Article

Effects of Unconventional Additives in Gasoline on the Performance of a Vehicle

1
College of Mechanical and Electrical Engineering, Hainan University, Haikou 570228, China
2
State Key Laboratory of Engines, Tianjin University, No.92 Weijin Road, Nankai Distric, Tianjin 300072, China
*
Authors to whom correspondence should be addressed.
Energies 2022, 15(5), 1605; https://doi.org/10.3390/en15051605
Submission received: 4 January 2022 / Revised: 26 January 2022 / Accepted: 31 January 2022 / Published: 22 February 2022

Abstract

:
In order to meet stricter emissions regulations and fuel consumption regulations, the upgrading of fuel quality has become one of the most important trends in the development of internal combustion engines. In this article, 89 # gasoline (G89) that is available on the Chinese market was selected as the base fuel, and five unconventional additives, ethyl tert-butyl ether (ETBE), N-Methylaniline, sec-butyl acetate, p-methylphenol and isobutanol, were added to the base fuel and named as G89-1, G89-2, G89-3, G89-4 and G89-5, respectively. The effects of these unconventional additives on a PFI vehicle were investigated. The test was carried out on a chassis dynamometer and the NEDC cycle was adopted to simulate driving conditions. The results show that, in terms of fuel consumption, G89-3 showed the best performance for decreasing fuel consumption. In terms of gaseous emissions, G89-4 decreased all four gaseous emissions, CO2, CO, THC and NOx, to a greater extent, which indicates that blending p-methylphenol into gasoline has a better potential for the vehicle to achieve cleaner emissions. In terms of acceleration performance, the five additives all shortened the acceleration time. The effects of the different additives on shortening acceleration time are basically consistent with the RON of the fuel.

1. Introduction

After more than 100 years of development and improvement, the internal combustion engine, which has the advantages of a high thermal efficiency, wide power range and compact structure, has been widely used in ship transportation, engineering power generation, aerospace, automobile transportation and other fields [1,2,3]. In recent years, although vehicles using different energies, such as electricity vehicles, fuel cell vehicles, etc., have attracted more and more attention and have entered a period of rapid development, there is still a consensus that the internal combustion engine will continue to be the main power device for the foreseeable future [4,5,6]. Gasoline fuel characteristics have significant influence on vehicle emissions and fuel consumption. In order to deal with stricter emissions regulations, such as EPA Tier 3, Euro 6 and China 6, and fuel consumption regulations, such as Euro 6d TEMP, US Tier 4 and China 6b, the upgrading of fuel quality has become one of the most important trends in the development of the internal combustion engines [7,8,9,10].
The use of fuel additives, especially those that are renewable, is considered to be a feasible, and also the easiest, way to upgrade fuel quality because of its advantages, such as improving combustion and reducing emissions and conventional fossil fuel consumption, without the need to change the engine structure [11,12,13,14]. Fuel additives are commonly divided into gasoline additives and diesel additives. Gasoline additives mainly include antioxidants, detergents, antiknock agents, etc. The antiknock agents are more important in improving gasoline engine performance because they are beneficial for increasing the compression ratio and optimizing the combustion phase by suppressing the knocking tendency. At present, antiknock agents used in the world market include specific ethers, alcohols, esters, etc.
Methyl tert-butyl ether (MTBE) is a typical ether antiknock agent with the property of a high octane number and the potential to purify exhausts [15,16]. Poulopoulos and Philippopoulos [17] studied the effect of adding MTBE to gasoline on the exhaust emissions of a gasoline engine and the results showed that CO and HC emissions could only be reduced by blending MTBE at high loads. Franklin et al. [18] conducted a detailed study on the addition of MTBE to gasoline both in the laboratory and real road tests. The results showed that although the addition of MTBE could reduce CO and THC emissions, the content of MTBE in unburned THC increased significantly during the cold start process. However, because MTBE can significantly pollute water and cause the inflammation of the nose and throat [19,20], it has been gradually eliminated.
Alcohol antiknock agents are mainly low-carbon alcohols, such as methanol and ethanol [21,22,23]. These low-carbon alcohols show remarkable antiknock capabilities and their prices are relatively low. Bilgin et al. [24] added 5% methanol to gasoline and compared the engine performance to that of pure gasoline, and the results indicated that the BMEP was increased and the power performance of the engine was improved by the methanol addition, which can be attributed to the lower heating value of methanol than that of gasoline as well as its cooling and leaning effects. The oxygen presence in methanol also assists in homogenizing the fuel−air mixture in the cylinder and, therefore, in improving combustion efficiency, which contributes to the increase in BMEP. Abu-zaid et al. [25] fueled a gasoline engine with a mixture of 15% methanol and 85% gasoline. The results showed that, in the range of 1000–2500 rpm, a better engine performance with the maximum power output, which increased by 16%, and the minimum brake fuel consumption, which was about 350 g/kwh, could be obtained.
Ethanol has the advantages of having a high octane value (good antiknock performance) and a wide source and being renewable [26], and it has been widely studied and commercially applied across the world as an engine fuel, especially in gasoline engines [27,28,29,30]. The research by Park et al. [31] showed that the laminar flame velocity of ethanol was higher than that of gasoline, so adding it to gasoline could shorten the initial combustion period and improve thermal efficiency. Turner et al. [32] fueled a gasoline engine with gasoline containing different proportions of ethanol addition and the results showed that the oxygen atoms in ethanol would reduce the HC emissions by 70% and the CO emissions by 35%. The research by He and Ceviz et al. [33,34] showed that fuel consumption increased and NOx emissions decreased when ethanol gasoline was used. However, in the study of Balki et al. [35], they found that the power of the engine decreased as the proportion of ethanol increased.
Ester antiknock agents mainly include dimethyl carbonate (DMC), etc. [36]. DMC is a colorless liquid and is mostly used as a green solvent [37]. DMC exhibits the necessary properties as an antiknock additive for gasoline, which is attributed to its higher octane number [38]. Wen et al. [39] indicated that by using gasoline with a DMC addition, CO and HC emissions could be reduced but the effect on NOx emissions was not obvious and fuel consumption increased.
The research above mentioned mainly focused on the effects of conventional gasoline additives on engine combustion and emissions. In fact, in addition to the conventionally and commercially used additives, there are many other substances that can be used as gasoline additives, which can be regarded as unconventional additives. The addition of unconventional additives also has the potential to improve the quality of gasoline and meet automotive fuel standards, but they may cause some negative effects on vehicle performance or on emissions. However, there are few studies on the effects of unconventional gasoline additives, both on the engine and on the vehicles.
Therefore, studying the effects of unconventional gasoline additives on vehicle performance can enrich understanding and provide an in-depth evaluation of these potential additives. Furthermore, it can provide a valuable reference for the selection of gasoline additives. Based on such a consideration, in order to enrich the types and amounts of gasoline additives and provide a reference for the diversification of gasoline additives, 89 # gasoline (G89) was selected as the base fuel for this paper and five unconventional additives, ethyl tert-butyl ether (ETBE), N-Methylaniline, sec-butyl acetate, p-methylphenol and isobutanol, were added to the base fuel and named as G89-1, G89-2, G89-3, G89-4 and G89-5, respectively. An experiment was carried out on a port fuel injection (PFI) vehicle to explore the impact of the unconventional additives on fuel consumption, emissions and the acceleration performance of the vehicle.

2. Experimental Device, Method and Fuel

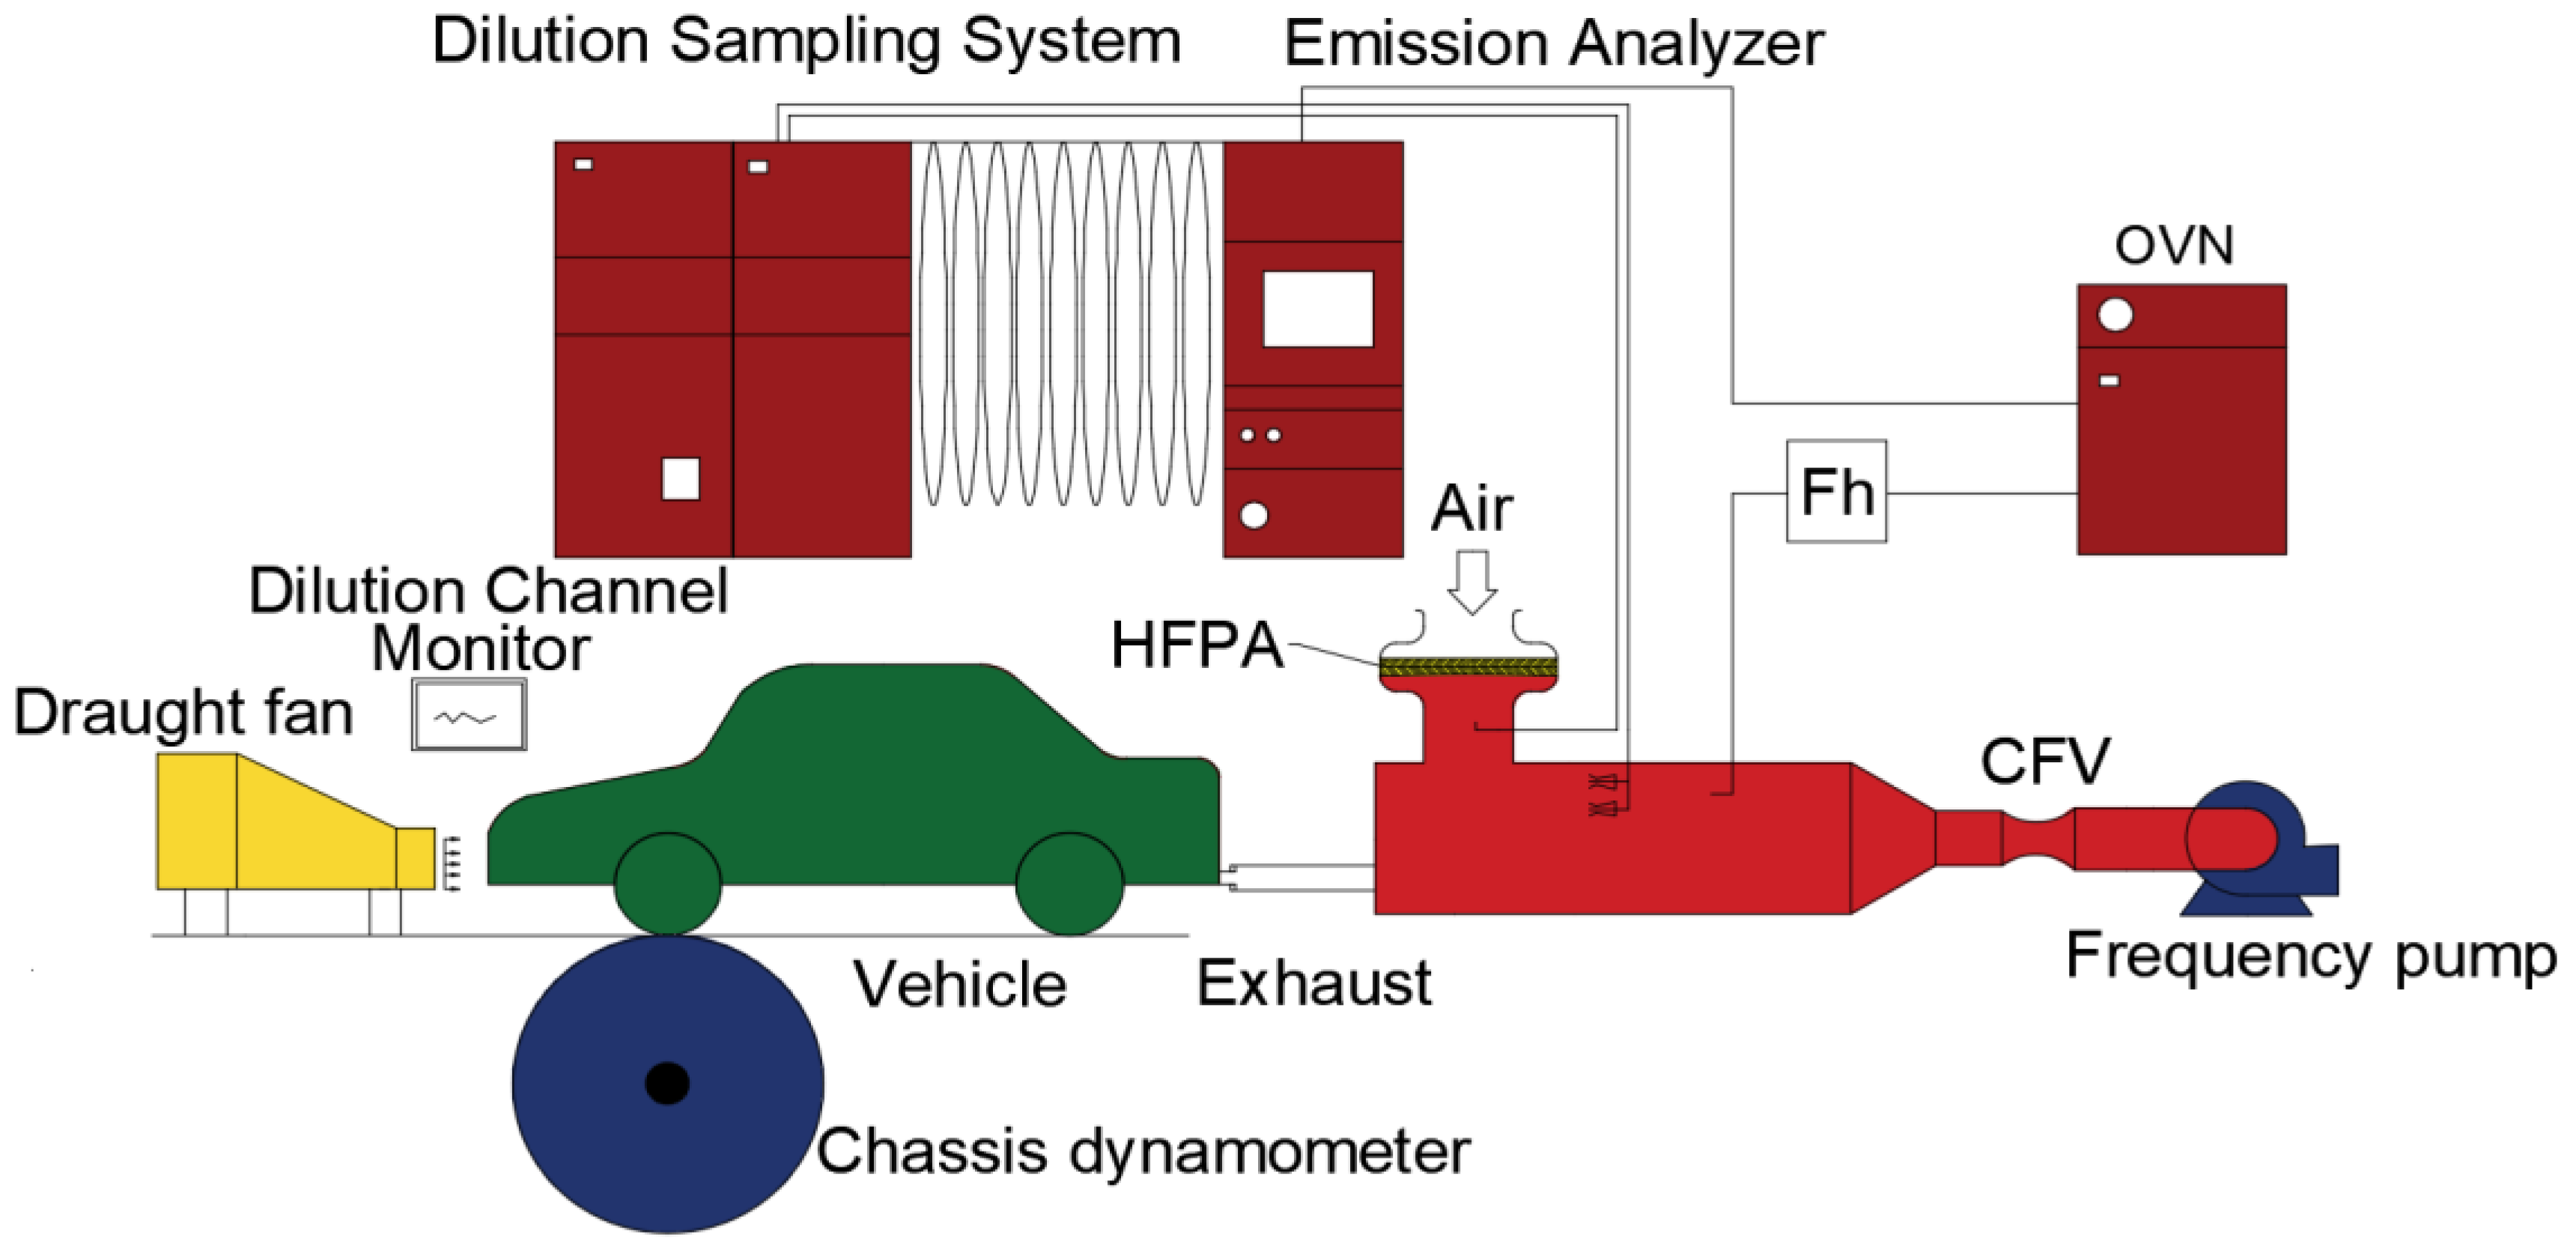
2.1. Experimental Device

The test was conducted on a passenger car, which was operated on a chassis dynamometer test bench. The vehicle was equipped with an PFI gasoline engine that occupied a high market share in the world markets, and the fuel supply method for the engine was multi-point EFI (electric fuel injection). The main vehicle specifications are shown in Table 1. Before the test, the cumulative mileage of the vehicle was about 2000 km.
Figure 1 is the schematic diagram of the chassis dynamometer test bench. In Figure 1, HFPA is a high-efficiency particulate filter, CFV is a critical flow venturi, OVN is an oven-type heated analyzer and Fh is a pre-filter. The monitor is a driver assistance that showed the speed of the vehicle. The vehicle ran on the chassis dynamometer to simulate actual road driving and the exhaust gas passed through the dilution channel, simulating the process of the exhaust gas entering the atmospheric environment. Finally, a fixed flow of diluted exhaust gas was sampled and stored in an air bag. The emission analyzer continuously measured the pollutant emissions of the diluted exhaust gas throughout the test, and also analyzed the concentration of components in the diluted exhaust gas that was stored in the air bag after the test cycle. The concentration of the exhaust gas in the air bag was proportional to the concentration of the automobile tail pipe. The results for the fuel consumption and gaseous emissions were all based on the analysis of the air bag components. The fuel consumption per 100 km was calculated according to the carbon balance method. Table 2 shows the main test equipment used in this research and Table 3 shows the measurement errors of the main test equipment.

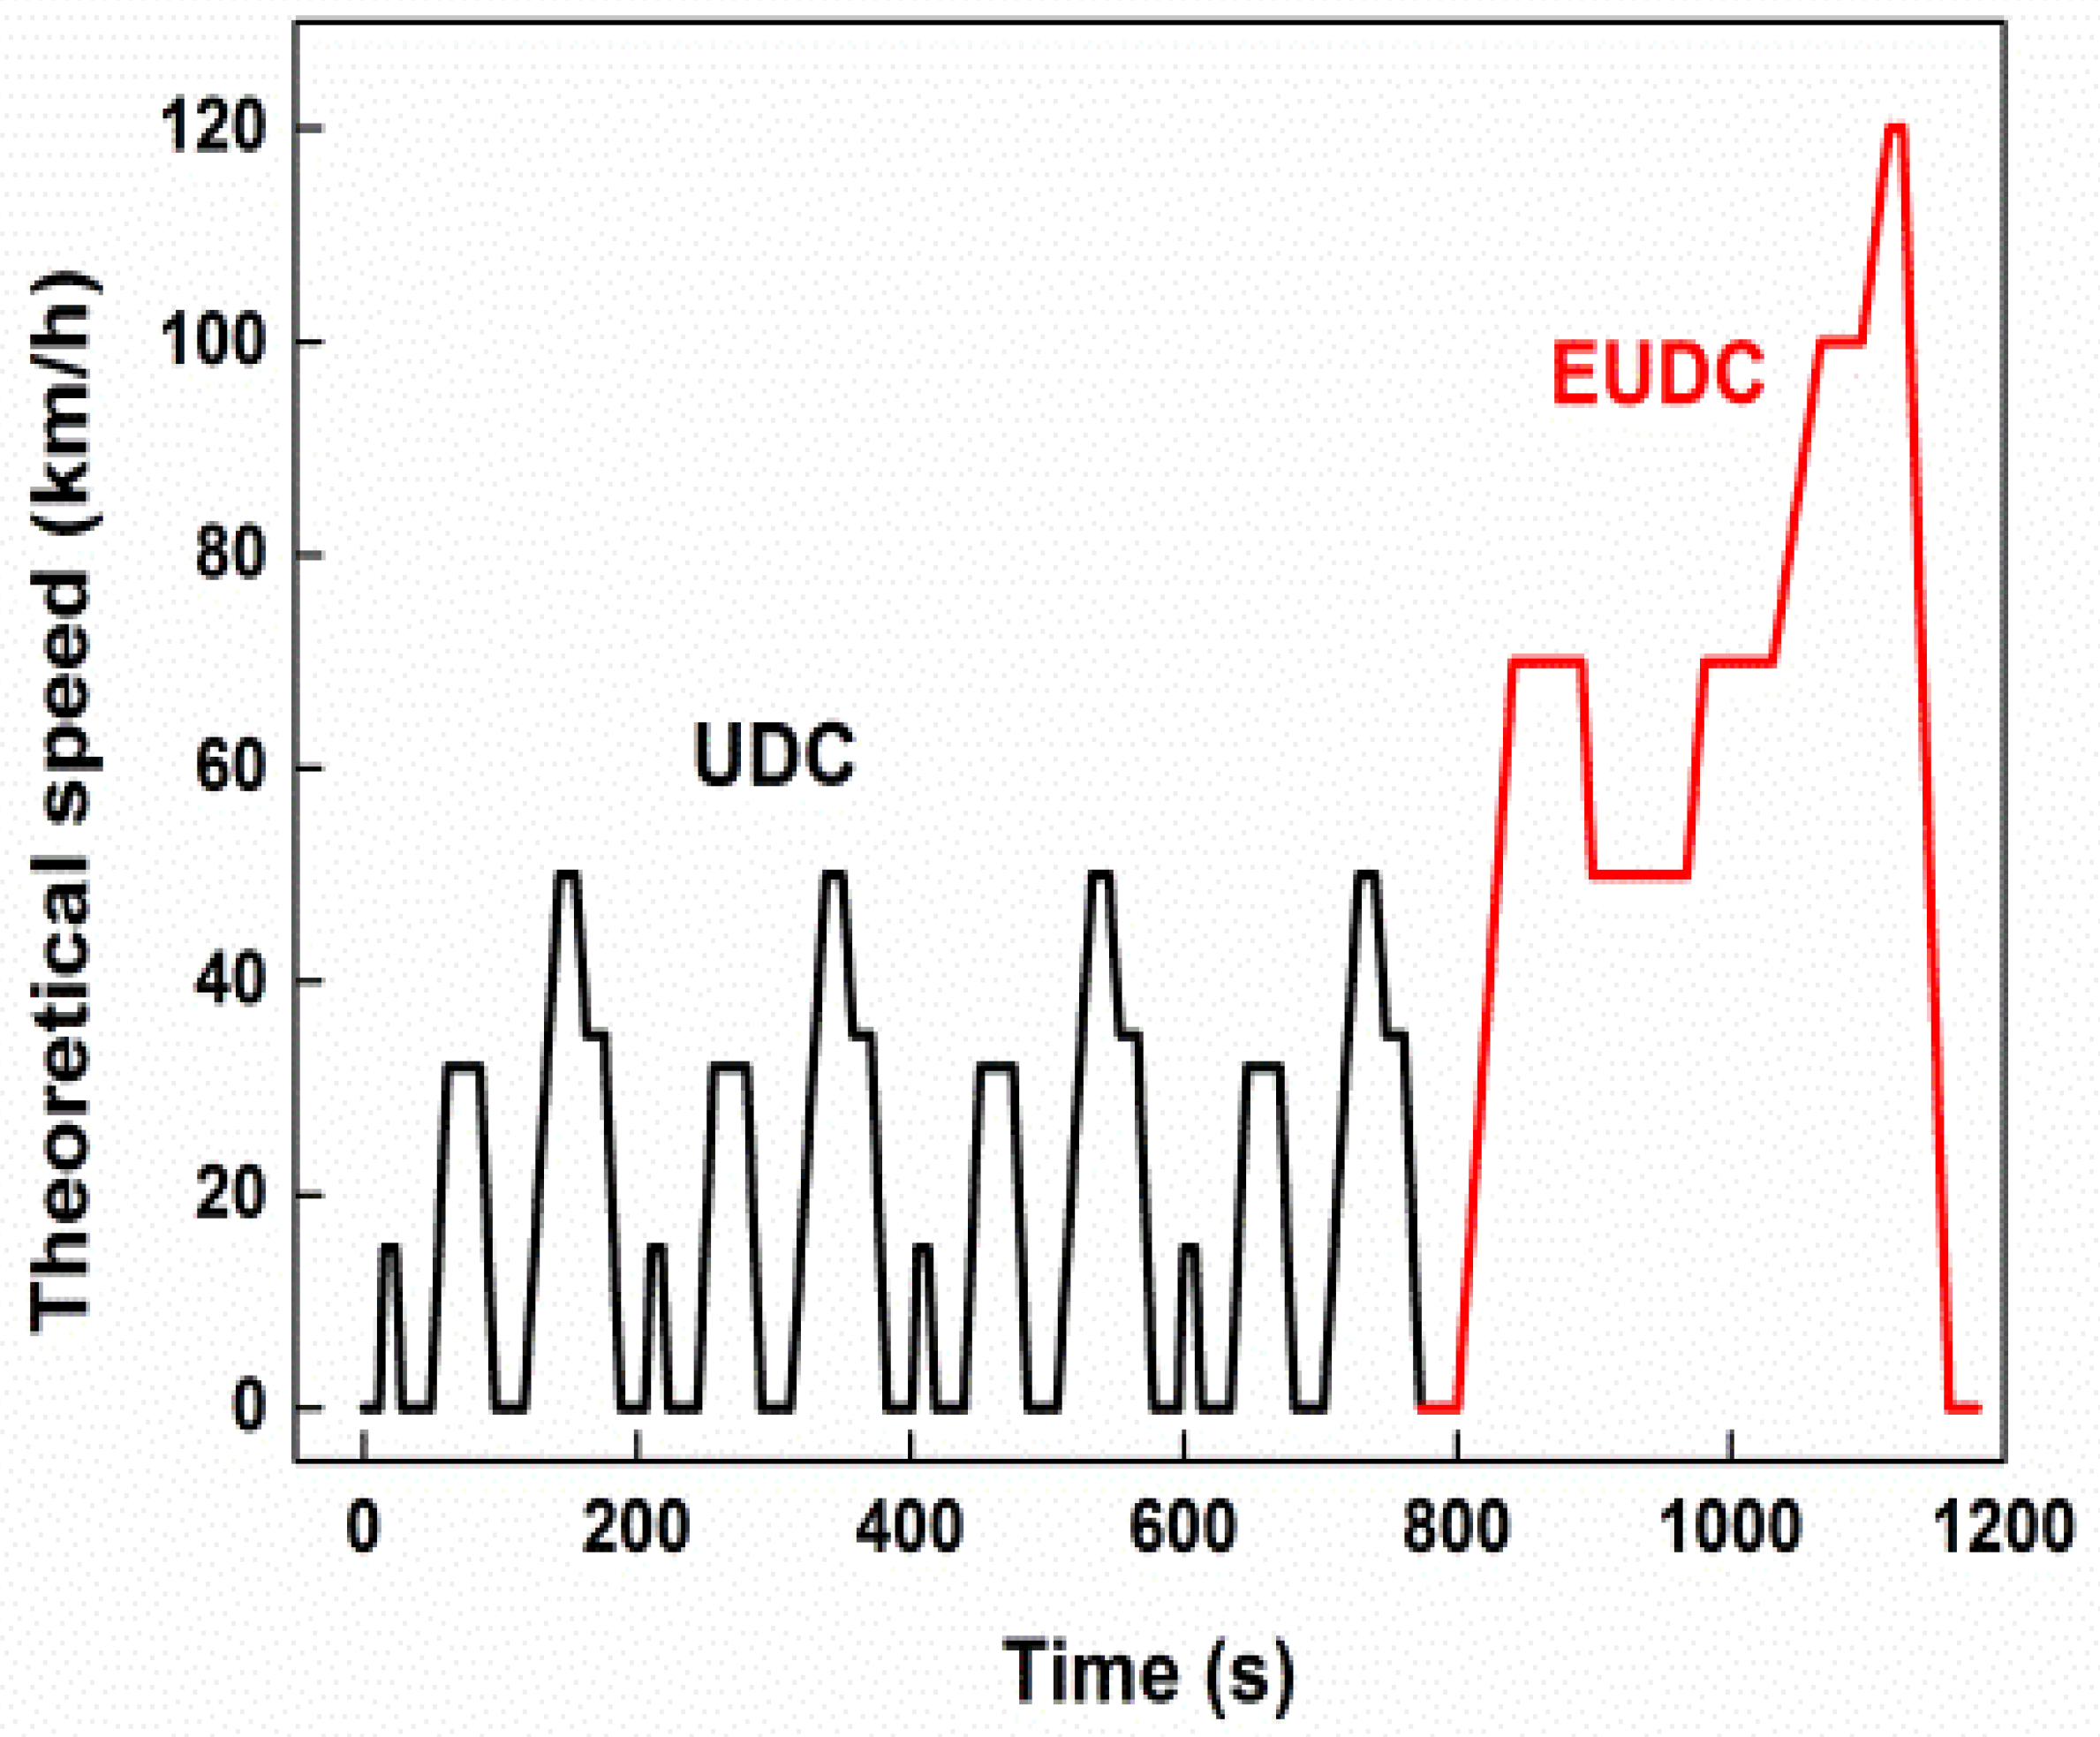
2.2. Experimental Method

In order to comprehensively assess the emissions and fuel economy of various fuels, this study mainly referred to the “Light Automotive Pollutant Emission Limits and Measurement Methods (China Fifth Stage) GB18352.5-2013” (herein referred to as national five regulations) type I test, wherein the test cycle used the new European Drive Cycle (NEDC). As shown in Figure 2, the entire cycle was divided into an urban drive cycle (UDC) and an extra-urban drive cycle (EUDC), in which the UDC cycle occupied a total of 780 s and then the vehicle ran in the EUDC cycle for 400 s. Compared to the EUDC, the UDC operating speed was lower and it had a cold start process with a lower engine temperature. Considering that the extensive use of modern start–stop technology causes a vehicle to start in a hot state more frequently than in a cold state, the NEDC cycle test was begun in the hot state in order to obtain data that were closer to the actual operation state of the vehicle. For each fuel, the NEDC cycle test was repeated at least twice to minimize the interference of external random factors on the test results and to ensure the accuracy of the data. Before the NEDC cycle test was started in the hot state, at least one complete NEDC cycle run was required to heat the engine. During the driving, the actual speed and theoretical speed were controlled within ±1 km/h.
To evaluate the effects of the different additives on the vehicle’s acceleration performance, the acceleration time of the vehicle from 0 to 100 km/h was measured for each fuel. The specific operation process was as follows: when the vehicle speed was 0, after the cooling water and the oil temperature reached the normal temperature control ranges of the vehicle, the driver shifted into the D gear and immediately pressed the accelerator pedal to the floor to accelerate the vehicle as quickly as possible. When the vehicle speed reached 100 km/h, the driver released the accelerator pedal and stepped on the brake to gradually reduce the vehicle’s speed back to zero. The system recorded the acceleration time for 0–100 km/h. In order to guarantee the reliability of the results, the data for the acceleration time for each fuel is the averaged results from at least 6 repeated tests.
During the test, the tire pressure of the test vehicle was checked every day to ensure that it was maintained at 0.22–0.23 MPa and general maintenance on the test vehicle was performed regularly, e.g., replacing the engine oil, air filter and oil filter. Each time that the fuel was changed during the test, the vehicle was allowed to run at idle speed to completely empty the fuel tank and the fuel pipe. When the dashboard fuel gauge of the vehicle showed that the vehicle was running out of fuel, the fuel filter was replaced. After changing the fuel, the vehicle was run at 60 km/h for more than 20 min to eliminate any possible interference from the previous test fuel.
The test vehicle complied with the China 5 Emission Standard for passenger cars and light-duty commercial vehicles with a three-way catalyst (TWC). However, it should be noted that in order to eliminate the effects of the after-treatment system and focus on the effects of the gasoline additives on the performance and emission characteristics, the TWC was disabled during this research and the changes in exhaust back pressure resulting from the three-way catalyst were ignored as well.

2.3. Experimental Fuels

In this research, five types of unconventional additives, ethyl tert-butyl ether (ETBE), N-Methylaniline, sec-butyl acetate, p-methylphenol, and isobutanol, were mixed with 89 # gasoline. ETBE was the substitute for MTBE due to it being less of a pollutant for water. It is a colorless and low-viscosity liquid with a molecular formula of C6H14O, and it has a high octane value and good antifreeze properties [40]. N-Methylaniline is a colorless to reddish brown oily liquid that is soluble in organic solvents, such as ethanol and ether, with the molecular formula of C7H9N [41]. Sec-butyl acetate is a colorless and transparent liquid with a high octane number, which is slightly soluble in water and has the molecular formula of C6H12O2. It is mainly used as a solvent [42]. P-methylphenol comprises colorless crystals at normal temperature with a melting point of 35.5 °C and the molecular formula of C7H8O. It is slightly soluble in water and soluble in organic solvents, such as ethanol [43]. Isobutanol is a flammable liquid with a pungent odor. Its molecular formula is C4H10O [44]. In general, all of the above additives have the excellent ability to improve gasoline’s antiknock performance due to their high octane numbers, which further affect the combustion and emission performance of the vehicle. The data in Table 4 were determined experimentally. We numbered every parameter in Table 4 in ascending order of value.
As shown in Table 4, the test fuels in this study were: the baseline gasoline (G89, RON = 89); G89 with 15% (volume fraction) ETBE additive (named as G89-1); G89 with 1.5% N-Methylaniline additive (G89-2); G89 with 9% sec-butyl acetate additive (G89-3); G89 with 1.5% p-methylphenol additive (G89-4); and G89 with 12% isobutanol additive (G89-5).
It should be mentioned that the proportions of the different types of additives mixed into gasoline were not the same, the main reason for which being that the effects of the above five additives on the vehicle’s performance were different. If one of the additives had less of an effect, the blending ratio was be increased. At the same time, the different blending ratios, such as a higher ratio of about 10%, can also be compared to the current blending of ethanol at 10% [45]. In addition, the current blending ratio from 1–15% can also be used to study the performance of different fuel components, such as aromatics and C9+, olefins, RON, etc. The physical and chemical properties of the test fuels are shown in Table 4.

3. Results and Discussions

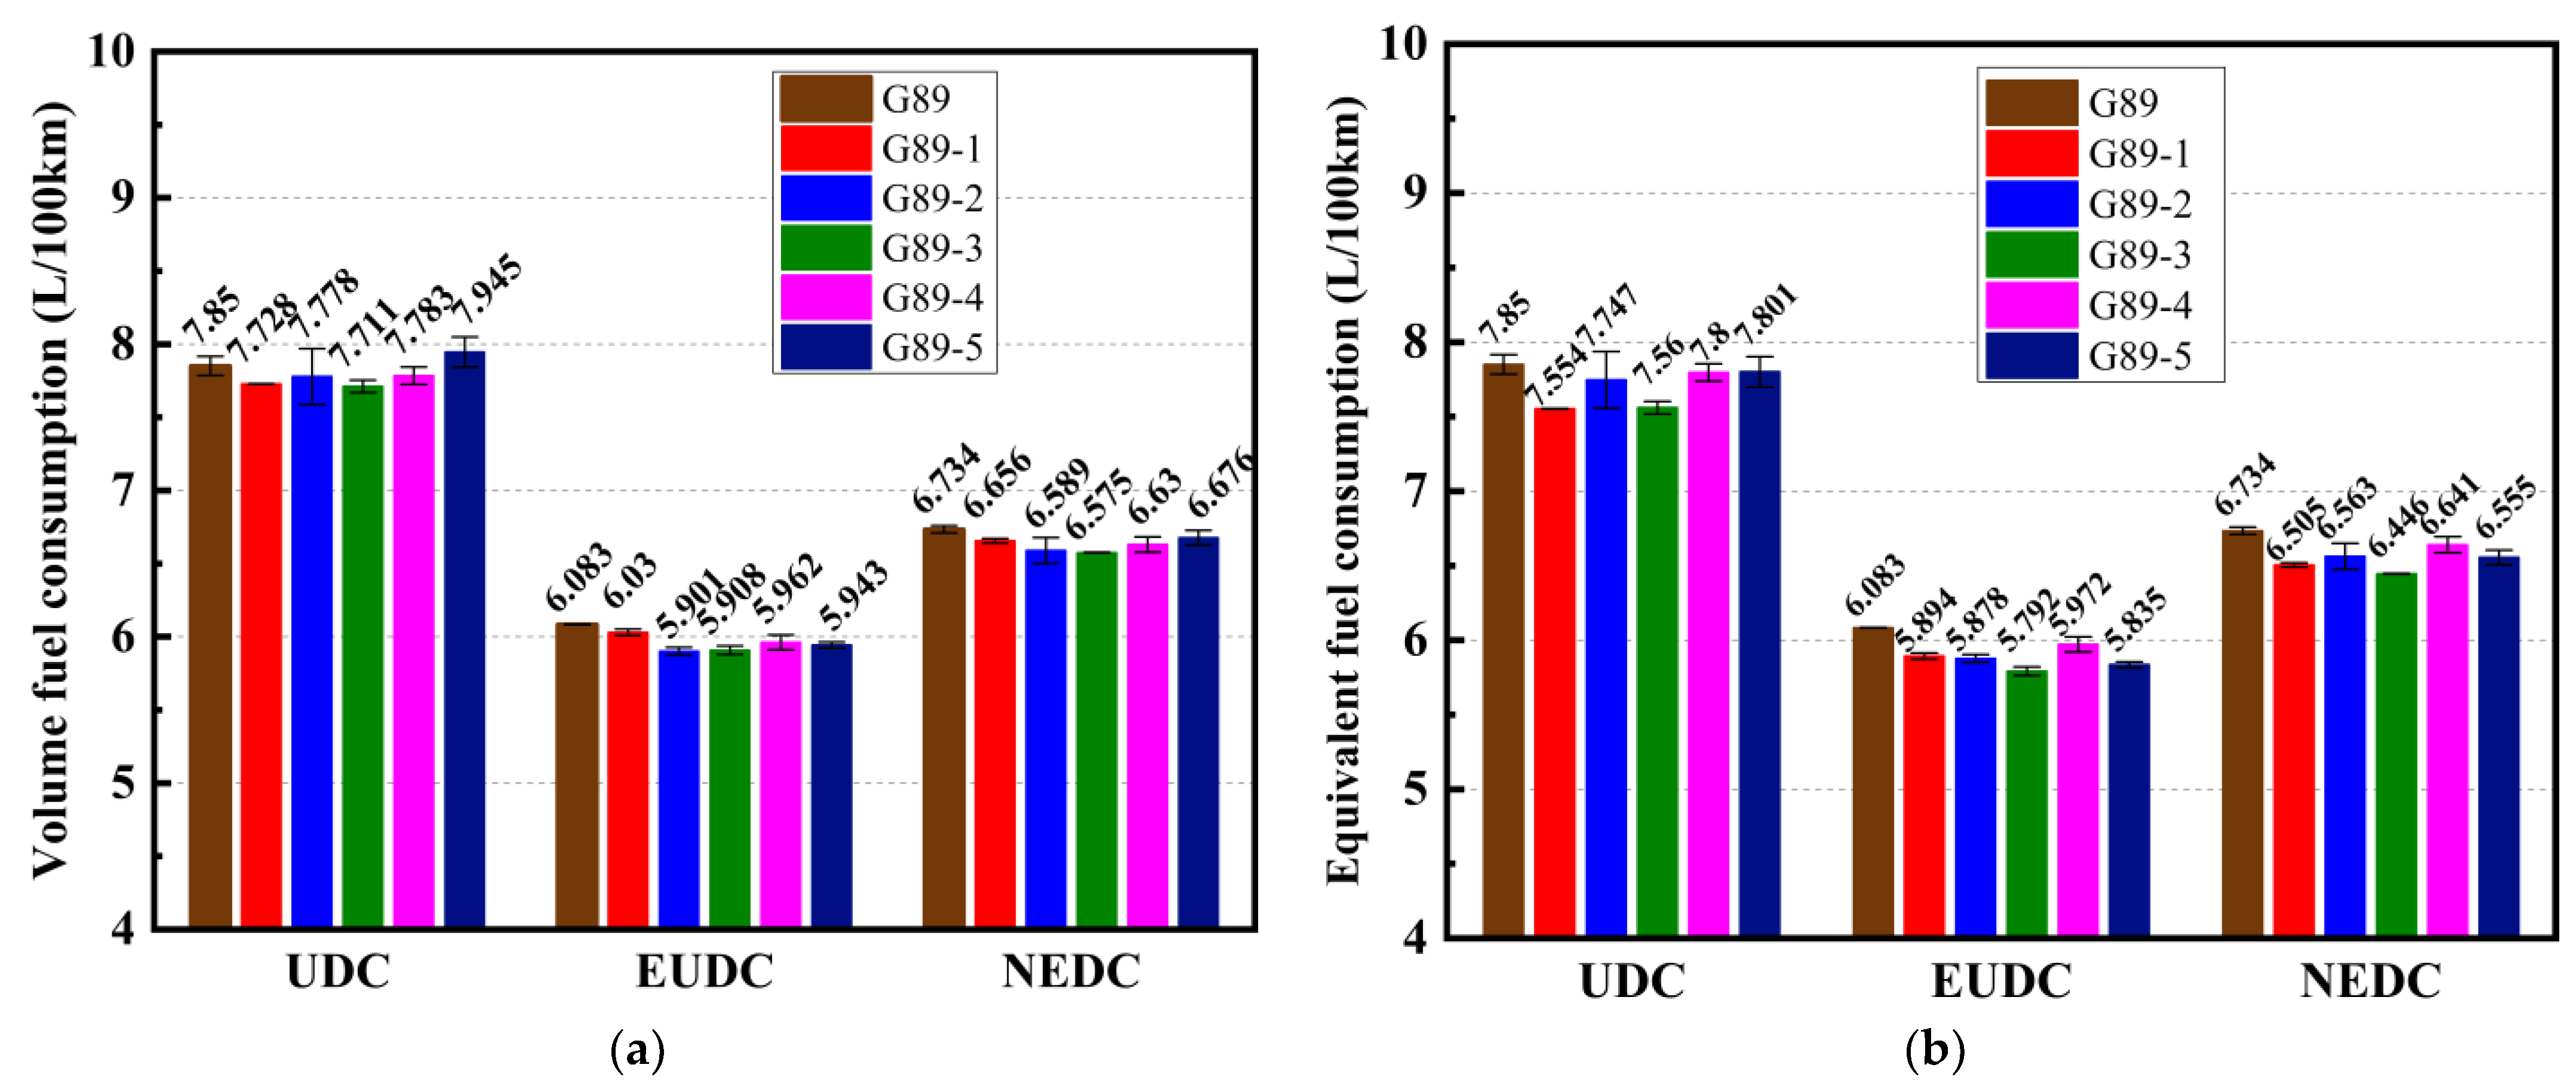
3.1. Effects of Different Unconventional Additives on Fuel Consumption

Figure 3a,b shows the volume fuel consumption and equivalent fuel consumption of the vehicle when fueled with the different fuels, with the values of fuel consumption labeled above the pillars. The vehicle fuel consumption results were calculated according to the carbon balance method. The final emissions results were the average values obtained from the remaining data after excluding the data with obvious errors. The error bars of the emissions results were the maximum deviation between the single effective measurement value and the average value.
The volume fuel consumption was directly related to the user’s intuitive feeling of vehicle fuel economy. As shown in Figure 3a, the five additives all decreased the volume fuel consumption to some degree over the entire NEDC cycle. In detail, the volume fuel consumption results from high to low were: G89-3 (blended with sec-butyl acetate); G89-2 (blended with N-Methylaniline); G89-4 (blended with p-methylphenol); G89-1 (blended with ETBE); and G89-5 (blended with isobutanol). The volume fuel consumption showed a strong negative correlation with the volume heating value of the fuels. In the case of the same amount of heat being released, the lower the volume heating value, the higher the volume fuel consumption. According to Table 4, among the five fuels with additives, G89-1 (blended with ETBE) had the lowest volume heating value, so its volume fuel consumption was the highest of the five mixed fuels. Although G89-1’s volume heating value was lower than pure gasoline (G89), its volume fuel consumption was still lower than G89 due to its higher RON. Finally, it should be noted that the difference between the five additives was small and the variation ratio between the highest and the lowest was only 13.5%, indicating that the effects of the additives on the volume fuel consumption are limited. In addition, it can be seen that the deviation of most data was in the range of 0.5%. Under the influence of the maximum deviation, the five additives’ effects on volume fuel consumption improvement were still similar to the average value, so the variations shown here are significant.
To eliminate the effect of the volume heating value on the volume fuel consumption, the equivalent fuel consumption, i.e., the volume fuel consumption of each blended fuel converted into that of G89 according to the volume heating value, was used to evaluate the thermal efficiency of the engine to a certain extent, as shown in Figure 3b. It can be seen that the five additives all decreased the equivalent fuel consumption to some degree over the entire NEDC cycle. The sequence was not the same as that of the volume fuel consumption. In addition, it can be seen that the deviation of most data was in the range of 0.5%. Under the influence of the maximum deviation, the five additives’ effects on the equivalent fuel consumption improvement were still similar to the average value, so the variation shown here is significant.
There are many factors that affect the equivalent fuel consumption. A fuel with a higher latent heat of vaporization will reduce the temperature in the cylinder, which is not conducive to fuel evaporation and the formation of a uniform mixture, and, consequently, will cause the deterioration of combustion and a lower thermal efficiency and result in increased equivalent fuel consumption [46]. Fuel with a lower T50 indicates better volatility, which helps to improve the equivalence ratio distribution and promote complete fuel combustion, thereby causing lower equivalent fuel consumption. A fuel with a higher RON can tolerate a more advanced ignition timing because of its better antiknocking capability, increasing the combustion constant volume and helping to reduce the equivalent fuel consumption [46].
In addition, the components in the fuel also have an important influence on the equivalent fuel consumption. In general, alkanes are burned first in the combustion process and aromatics with complex and strong structures are burned at the end. Therefore, fuel with a high aromatic content usually presents poor combustion performance and a higher equivalent fuel consumption [47]. C9+ aromatics is a polycyclic aromatic hydrocarbon containing more than nine carbon atoms. As the benzene ring structure is difficult to break, it finds it difficult to participate in the reaction. When the content of C9+ aromatics in a fuel is too high, the ignition performance of the fuel will deteriorate, resulting in an increase in equivalent fuel consumption [48].
Referring to Table 4, G89-3 had the lowest additive latent heat of vaporization and the smallest content of aromatics and C9+ aromatics, which helped to reduce its equivalent fuel consumption. Meanwhile, compared to the other blended fuels, its RON was the lowest and its T50 was the highest, which was not conducive to mixture formation and combustion phasing optimization. However, the oxygen content of G89-3 was the highest among the test fuels, its positive effects on combustion were more significant than the negative impact of its RON and T50 and it obtained the most improvement in thermal efficiency. The abovementioned factors together led to the G89-3 fuel having the best effect on decreasing the equivalent fuel consumption (−4.28%). G89-1 had a higher RON and the lowest T50, aromatics and C9+ aromatics content, which helped to reduce the equivalent fuel consumption.
However, the olefins content of G89-1 was the lowest. The olefins content has an important effect on the flame propagation speed, with lower olefins content resulting in slower combustion [49]. Therefore, G89-1 ranked second in terms of reducing equivalent fuel consumption (−3.40%). G89-5 had a lower T50, aromatics and C9+ aromatics content, but its additive latent heat of vaporization was the highest, so it obtained third position in terms of the reduction in the equivalent fuel consumption (−2.66%). G89-2 had the highest RON, but its T50, aromatics content and additive latent heat of vaporization were also higher, so it ranked fourth for decreasing the equivalent fuel consumption (−2.54%). Compared to G89, G89-4 had a higher T50, aromatics content and additive latent heat of vaporization, which caused the deterioration of equivalent fuel consumption. However, the RON of G89-4 was increased, which was beneficial for increasing the degree of constant volume combustion, and its C9+ aromatics content was also relatively reduced, which could promote the ignition and combustion performance of the fuel. Under the combined effects of various factors, G89-4 obtained the smallest improvement in the equivalent fuel consumption (−1.38%).
Moreover, it can be seen that the volume fuel consumption and equivalent fuel consumption of various fuels under EUDC conditions were significantly lower than those under UDC conditions. The main reason for this may be that the vehicle usually ran at a low engine load and was frequently started under UDC conditions, and the thermal efficiency was fairly low under those operating conditions. As for the EUDC cycle, the vehicle speed was high, which means that the engine was operating at a higher load with high efficiency.

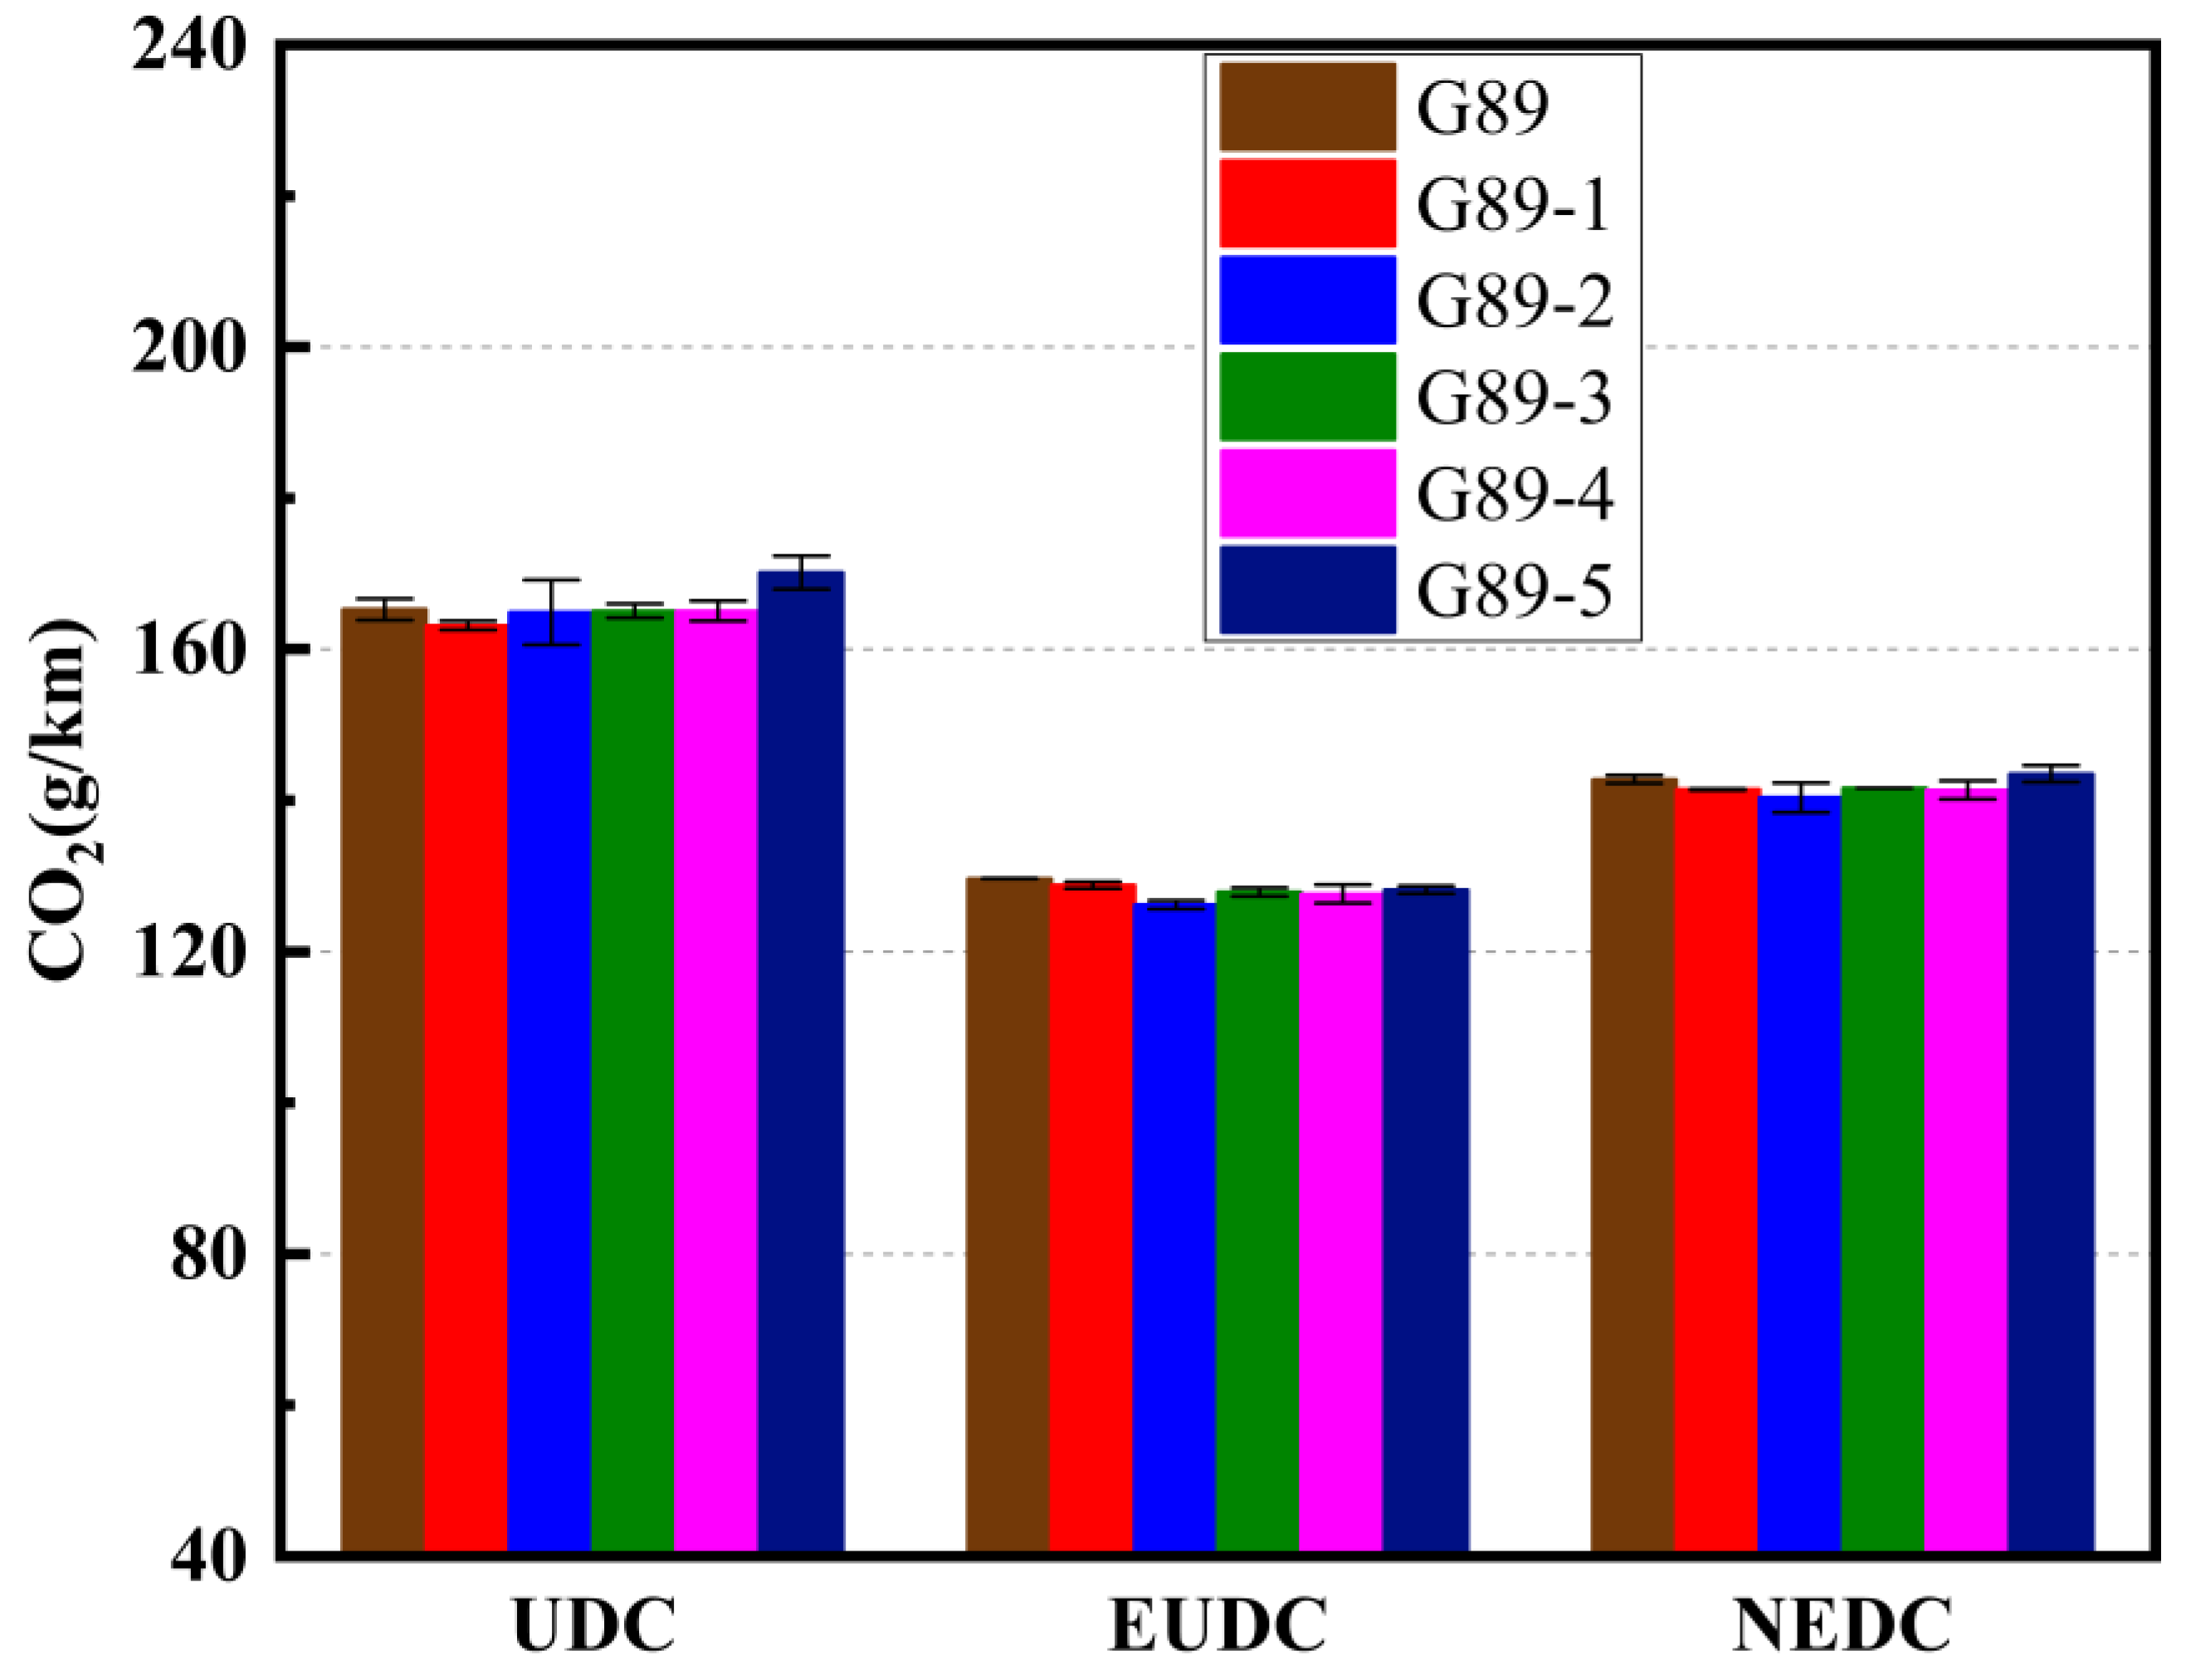
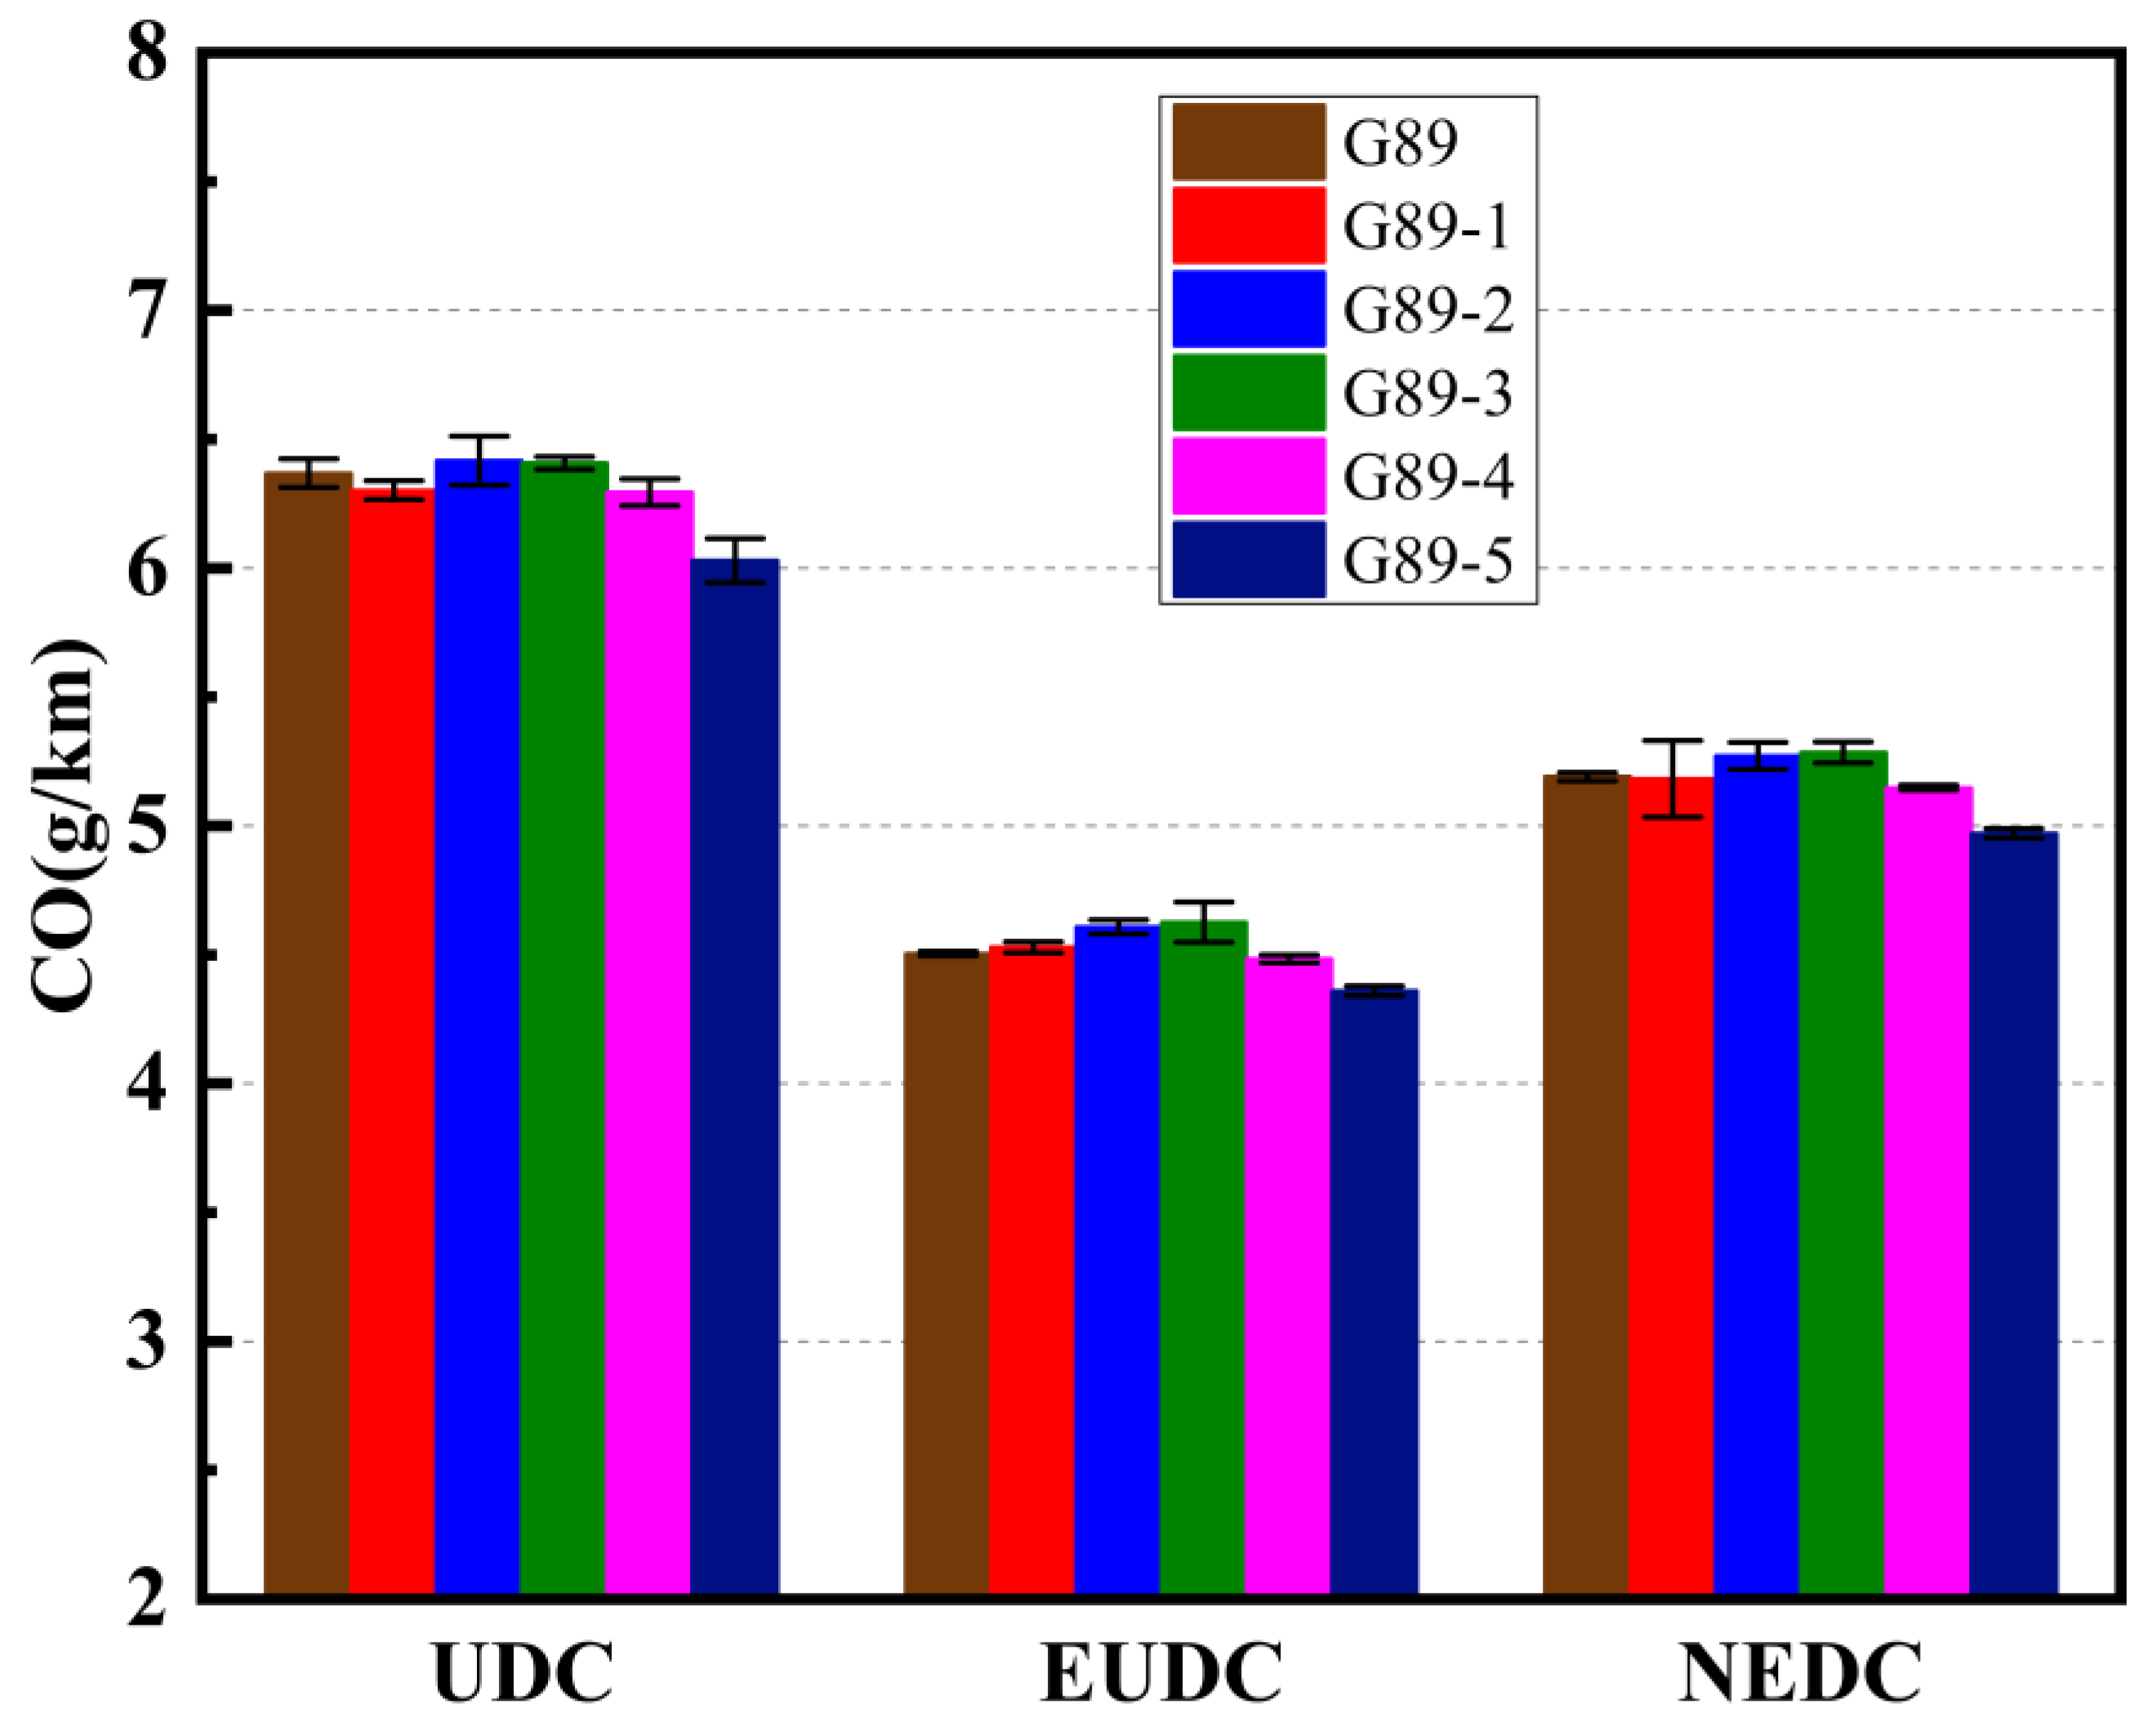
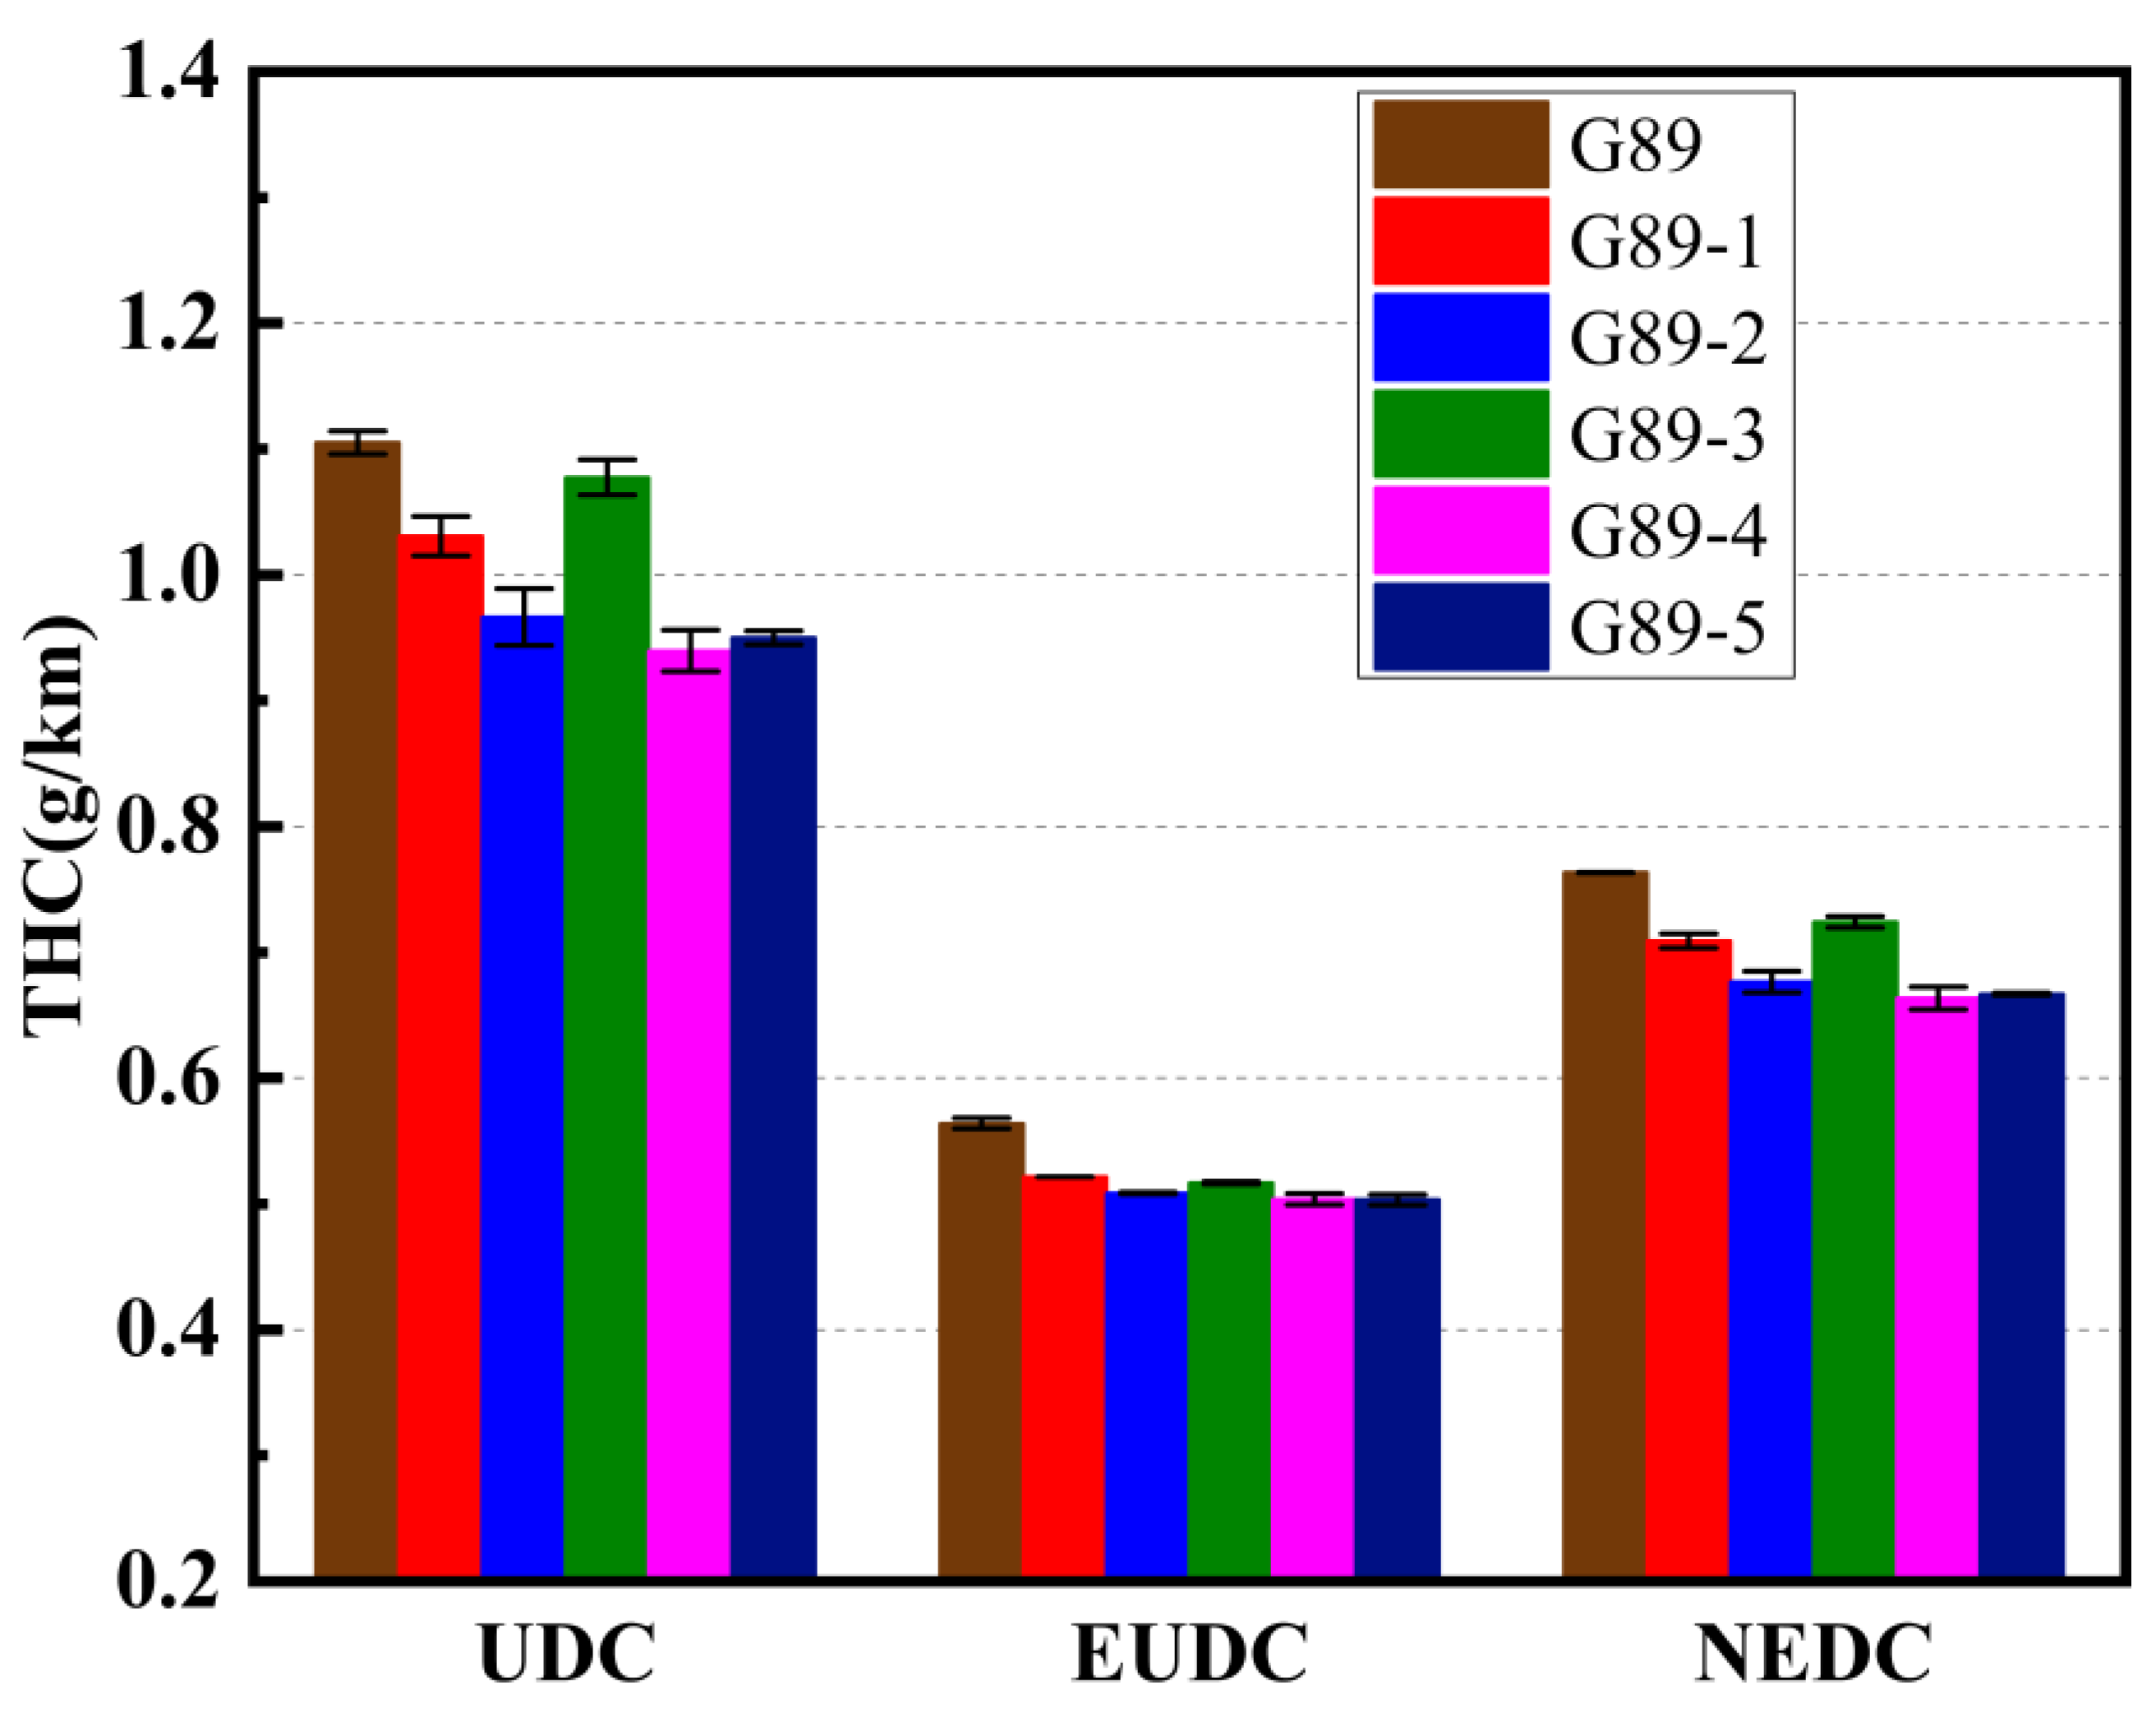
3.2. Effects of Different Unconventional Additives on Gaseous Emissions

Figure 4 shows the CO2 emissions of the PFI vehicle when fueled with the different fuels. Compared to the pure gasoline (G89), the CO2 emissions of the fuels with different additives generally showed a downward trend, except for G89-5, over the entire NEDC cycle. To be more specific, the CO2 emissions for the five mixed fuels from high to low were: G89-5 (0.52%); G89-3 (−0.80%); G89-1 (−0.94%); G89-4 (−0.99%); and G89-2 (−1.69%). The values in parentheses represent the percentage change relative to the G89 gasoline. In addition, it can be seen that the deviation of most data was in the range of 0.5%. Under the influence of the maximum deviation, the five additives’ effects on CO2 emissions improvement were still similar to the average value, so the variation shown here is significant.
It should be noted that CO2 emissions are generally consistent with the trend of volume fuel consumption, which means that thermal efficiency plays an important role in CO2 emission [50]. Meanwhile, the characteristics of the fuel also influence CO2 emissions to a certain degree. The volume fuel consumption of G89-5 was the highest among the five mixed fuels and its RON and oxygen content were higher than G89, according to the Table 4, which was conducive to the generation of CO2, and so, it obtained the highest CO2 emissions. The volume fuel consumption of G89-2 was ranked fourth among the five mixed fuels, and its T50 and T90 were also very high, which limited the atomization and evaporation of the fuel and caused a more uneven mixture equivalence ratio distribution, which was not conducive to the full combustion of fuel, further decreasing the CO2 emissions [50]. Therefore, G89-2 obtained the lowest CO2 emissions. However, it can be seen that the difference in CO2 emissions of the various fuels under UDC conditions and EUDC conditions was small.
Figure 5 shows the CO emissions of the PFI vehicle when fueled with the different fuels. Over the entire NEDC cycle, blending ETBE (G89-1), N-Methylaniline (G89-2) and sec-butyl acetate (G89-3) increased the CO emissions, but blending p-methylphenol (G89-4) and isobutanol (G89-5) decreased the CO emissions. More specifically, the CO emissions for the five mixed fuels from high to low were: G89-3 (1.82%); G89-2 (1.55%); G89-1 (0.16%); G89-4 (−0.83%); and G89-5 (−4.24%). In addition, it can be seen that the deviation of most data was in the range of 0.6%. Under the influence of the maximum deviation, the five additives’ effects on CO emissions improvement were still similar to the average value, so the variation shown here is significant.
T50 plays a dominant role in CO emissions. The lower the value of T50, the better the volatility of the fuel, which helps to form a more uniform mixture, promote more complete combustion and reduce CO emissions [51]. As the T50 of G89-3 was significantly higher than the other fuels, more fuel-rich regions were likely to appear during the combustion process, so its CO emissions were the highest. Compared to G89, the T50 of G89-1 was significantly lower but its CO emissions showed an increasing trend. According to the literature [52], the optimal temperature range of T50 is about 95–100 °C. When T50 is below 95 °C, CO emissions will increase with the decrease in T50. Therefore, the CO emissions of G89-1 increased.
In addition to the impact of T50, the carbon and oxygen contents of the fuel also play an important role in CO emissions. Fuels with a higher carbon content often increase CO emissions because of its propensity for incomplete combustion [46]. Therefore, although G89-2 had the highest RON, which was conducive to optimized combustion, its higher carbon content made it easy to produce CO. Moreover, its molecular formula did not contain oxygen atoms, which was not conducive to the later oxidation of CO. Meanwhile, its boiling point was fairly high, causing slow fuel evaporation and resulting in more local fuel-rich regions. So, the CO emissions of G89-2 were lower than those of G89-3. The reason G89-5 had the lowest CO emissions is mainly because it had a higher RON compared to G89-4, which helped to advance the ignition timing and increase the combustion constant volume degree and combustion efficiency.
Figure 6 shows the THC emissions of the PFI vehicle when fueled with the different fuels. Over the entire NEDC cycle, the five additives all decreased THC emissions to varying degrees, but the decrease in THC emissions was more obvious during the UDC stage, which represented urban operation. For the five mixed fuels, the THC emissions from high to low were: G89-3 (−5.13%); G89-1 (−7.10%); G89-2 (−11.38%); G89-5 (−12.64%); and G89-4 (−13.07%). In addition, it can be seen that the deviation of most data was in the range of 0.9%. Under the influence of the maximum deviation, the five additives’ effects on THC emissions improvement were still similar to the average value, so the variation shown here is significant.
THC emission is affected by a variety of factors. The impact of T50 on THC emissions is complex. On the one hand, a lower T50 means better fuel volatility, which helps to improve the mixture formation and reduce fuel-rich regions that are conducive to THC generation [51]. On the other hand, the better volatility of the fuel will also allow more fuel to enter into the narrow gap region and the quenching layer, which will increase the THC emissions. A higher T90 indicates the increase in heavy components in the fuel, which is not conducive to the volatilization and combustion of the fuel and results in the increase in THC emissions. The chemical structure of C9+ aromatics is strong and it is difficult to decompose and react completely, which makes the ignition performance of gasoline worse. Therefore, fuels with a higher C9+ aromatics content are prone to produce higher THC emissions [51]. Olefin is a kind of unsaturated hydrocarbon and its chemical properties are more active. Appropriately increasing the olefin content can help to reduce THC emissions [53]. In addition, fuels with a higher latent heat of vaporization will make the temperature inside the cylinder lower and worsen the fuel atomization and evaporation process, which increases THC emissions.
According to Table 4, G89-3 had the lowest T90 and additive latent heat of vaporization and its C9+ aromatics content was lower, which helped to decrease THC emissions. However, the T50 of G89-3 was the highest, which could cause an increase in fuel-rich regions that are conducive to THC generation. So, G89-3 obtained the smallest decrease in THC emissions. G89-1 had lower T50, T90 and C9+ aromatics contents and a lower additive latent heat of vaporization, but its olefins content was also the lowest, which reduced the flame propagation speed and combustion speed. So, G89-1 ranked fourth in terms of decreasing THC emissions.
G89-2 had a higher T90 and additive latent heat of vaporization, which caused the increase in THC emissions. However, it had the highest RON, which greatly improved the combustion process. So, G89-2 ranked third in terms of decreasing THC emissions. Although G89-5 had the highest additive latent heat of vaporization and the lowest olefins content, its T50, T90 and C9+ aromatics contents were also lower, which decreased the THC emissions. The abovementioned factors together led to G89-5 ranking number two in terms of decreasing THC emissions. The reason G89-4 had the best effect on decreasing THC emissions is mainly that the T50 had a dominant influence on THC emissions at that moment. Takei et al. found that the lowest THC emissions were obtained when the T50 was about 94 °C, and that increasing or decreasing the T50 would increase THC emissions [54]. Therefore, G89-4 had the greatest effect on decreasing THC emissions.
In addition, when comparing the different cycle conditions, it was found that CO and THC were mainly generated under UDC urban conditions. This is mainly because the PFI vehicle speed during UDC was lower than that during EUDC, which meant a low engine speed and/or low load with low in-cylinder temperature operation. Meanwhile, there was frequent acceleration and deceleration during the cycle, which could easily cause fuel-rich regions in the cylinder to increase CO and THC emissions.
Figure 7 shows the NOx emissions of the PFI vehicle when fueled with the different fuels. Over the entire NEDC cycle, the ETBE additive (G89-1) increased the NOx emissions, but the N-Methylaniline (G89-2), sec-butyl acetate (G89-3), p-methylphenol (G89-4) and isobutanol (G89-5) additives decreased the NOx emissions. For the five mixed fuels, the NOx emissions from highest to lowest were: G89-1 (3.88%); G89-2 (−0.90%); G89-5 (−4.46%); G89-4 (−6.22%); and G89-3 (−16.63%). In addition, it can be seen that the deviation of most data was in the range of 1.2%. Under the influence of the maximum deviation, the five additives’ effects on NOx emissions improvement were still similar to the average value, so the variation shown here is significant.
The formation of NOx requires three important factors: a high temperature, oxygen enrichment and high temperature duration [51]. T50 is also an important parameter reflecting the volatility of fuel and T90 is an important fuel property that reflects the proportion of heavy components within the fuel. Fuels with higher T50 and T90 indicate that it is more difficult for the fuel to mix well with the air, which is likely to cause fuel-rich areas, thereby reducing the production of NOx [51]. A higher latent heat of vaporization will cause a low temperature in the cylinder, which helps to decrease NOx emissions [50]. In addition, an increased RON of the fuel helps to improve combustion and increase the combustion temperature, which leads to the generation of NOx emissions.
According to Table 4, G89-1 had lower T50, T90 and additive latent heat of vaporization, which increased NOx emissions. Meanwhile, its RON was higher, causing the increased combustion temperature. Influenced by the abovementioned factors, G89-1 obtained the highest NOx emissions. G89-2 contained nitrogen atoms in its molecular formula. During the combustion, the nitrogen atoms could be converted into NOx through a series of chemical reactions. At the same time, it had the highest RON, which was prone to cause NOx emissions. However, due to its higher T50, T90 and additive latent heat of vaporization, G89-2 still obtained a slight reduction in NOx compared to G89, although the decreasing effect was the smallest. When comparing the different cycle conditions, it can be seen that G89-2 increased NOx emissions under UDC conditions, but it could decrease NOx emissions under EUDC conditions. This was mainly because under UDC conditions, the vehicle ran at a low-to-medium speed and the temperature in the cylinder was low. Due to G89-2 having the highest RON, its effect on increasing the combustion temperature was significantly higher than the reduction effect caused by factors such as the latent heat of vaporization, so the NOx emissions increased.
G89-5 had the highest additive latent heat of vaporization, which decreased the NOx emissions. However, its T50 and T90 were also lower, so G89-5 ranked third in terms of the reduction effect on NOx emissions. G89-4 had a higher T90 and additive latent heat of vaporization, but its RON was higher than that of G89-3 and its T50 was lower than that of G89-3. T50 and RON might have a greater effect on NOx emissions at that moment. So, G89-4 ranked second in terms of decreasing NOx emissions. The reason G89-3 had the best effect on decreasing NOx emissions was mainly because it had the highest T50 and almost the lowest RON, which greatly increased the fuel-rich regions and resulted in retard combustion phasing that was not conducive to the formation of NOx.
In addition, it can be seen that the amount of NOx emissions generated under EUDC conditions was significantly higher than that under UDC conditions. This was mainly because the in-cylinder temperature during EUDC was remarkably higher due to the higher vehicle speed.
In order to visually compare the improvement effect of the five additives on the gaseous emissions, the relative change rate (%) in the four gaseous emissions of the five mixed fuels relative to the base fuel (G89) are presented in the same figure with the values labeled above the pillars, as shown in Figure 8.
It can be seen that G89-1 decreased the CO2 and THC emissions but increased the CO and NOx emissions. In addition, although the additive (ETBE) blending volume ratio was the highest (15%) for G89-1, the impacts on improving gaseous emissions are not obvious. G89-2 and G89-3 both decreased the CO2, THC and NOx emissions but increased the CO emissions. It should be noted that although the blending volume ratio of p-methylphenol was only 1.5%, G89-4 decreased all four gaseous emissions significantly, which indicates that blending p-methylphenol into gasoline shows potential in terms of achieving cleaner emissions. Additionally, G89-5 decreased the CO, THC and NOx emissions but increased the CO2 emissions.

3.3. Effects of Different Unconventional Additives on Acceleration Performance of the PFI Vehicle

The acceleration time from 0 to 100 km was used to evaluate the acceleration performance of the PFI vehicle when fueled by the different fuel additives, as shown in Figure 9 with the values of acceleration time labeled above the pillars. It can be seen that the five additives all shortened the acceleration time to varying degrees. For the five mixed fuels, the acceleration time from highest to lowest was: G89-3, G89-4, G89-5, G89-1 and G89-2. With regard to the fuel properties, the RON was the main factor affecting acceleration time: the higher the fuel’s RON, the shorter the acceleration time of the vehicle. The higher RON meant the better antiknock performance of the fuel and that the spark timing could be advanced and the combustion process was closer to the top dead center, which was beneficial in improving the power output and acceleration performance [55]. Consequently, the acceleration time was shortened.

4. Conclusions

In this study, 89 # gasoline, which is available on the Chinese market, was used as the base fuel and five kinds of unconventional additives, ETBE, N-Methylaniline, sec-butyl acetate, p-methylphenol and isobutanol, were added to the base fuel and named as G89-1, G89-2, G89-3, G89-4 and G89-5, respectively. The effects of these fuel additives on the fuel consumption, emission characteristics and acceleration performance of a PFI vehicle were investigated experimentally. The test was carried out on a chassis dynamometer and the actual driving conditions were simulated using the NEDC test cycle. The main conclusions are as follows:
(1)
In terms of fuel consumption over the entire NEDC cycle, the five additives all decreased the volume fuel consumption and equivalent fuel consumption to varying degrees. The decrease in volume fuel consumption from highest to lowest was G89-3, G89-2, G89-4, G89-1 and G89-5, while the reduction in equivalent fuel consumption from highest to lowest was G89-3, G89-1, G89-5, G89-2 and G89-4. On the whole, blending sec-butyl acetate (G89-3) showed the best improvement in fuel consumption;
(2)
In terms of gaseous emissions over the entire NEDC cycle: G89-1 decreased the CO2 and THC emissions but increased the CO and NOx emissions; G89-2 and G89-3 both decreased the CO2, THC and NOx emissions but increased the CO emissions; G89-4 could decrease all four gaseous emissions; G89-5 decreased the CO, THC and NOx emissions but increased the CO2 emissions. On the whole, G89-4, with only 1.5% of p-methylphenol in the fuel volume, had the best performance in decreasing the gaseous emissions, which indicates that blending p-methylphenol in gasoline showed better potential for helping vehicles to achieve cleaner emissions;
(3)
In terms of acceleration performance, the five additives all shortened the acceleration time and the acceleration time from highest to lowest was G89-3, G89-4, G89-5, G89-1 and G89-2. It should be noted that the effects of the different additives on shortening the acceleration time were basically consistent with the RON of the fuel.

Author Contributions

Conceptualization, M.L. and X.Z.; methodology, Z.Z. and H.L.; validation, H.L., M.W. and C.Z.; formal analysis, X.Z.; investigation, Z.J. and X.Z.; resources, C.Z.; data curation, M.W. and X.K.; writing—original draft preparation, C.Z. and X.Z.; writing—review and editing, X.Z.; visualization, X.Z.; supervision, H.L.; project administration, H.L.; funding acquisition, H.L. All authors have read and agreed to the published version of the manuscript.

Funding

This research was funded by the National Natural Science Foundation of China (NSFC), projects 51976134 and 91941102.

Institutional Review Board Statement

Not applicable.

Informed Consent Statement

Not applicable.

Data Availability Statement

The study did not report any data.

Acknowledgments

This research was supported by the National Natural Science Foundation of China (NSFC), projects 51976134 and 91941102.

Conflicts of Interest

The authors declare no conflict of interest.

References

  1. Bae, C.; Kim, J. Alternative fuels for internal combustion engines. Proc. Combust. Inst. 2017, 36, 3389–3413. [Google Scholar] [CrossRef]
  2. Dong, S.J.; Cheng, X.B.; Ou, B.; Liu, T.; Wang, Z. Experimental and numerical investigations on the cyclic variability of an ethanol/diesel dual-fuel engine. Fuel 2016, 186, 665–673. [Google Scholar] [CrossRef]
  3. Kalghatgi, G.T. Developments in internal combustion engines and implications for combustion science and future transport fuels. Proc. Combust. Inst. 2015, 35, 101–115. [Google Scholar] [CrossRef]
  4. Kalghatgi, G.T. Is it really the end of internal combustion engines and petroleum in transport? Appl. Energy 2018, 225, 965–974. [Google Scholar] [CrossRef]
  5. Conti, J.; Holtberg, P.; Diefenderfer, J.; LaRose, A.; Turnure, J.T.; Westfall, L. International Energy Outlook 2016 with Projections to 2040; United States Energy Information Administration: Washington, DC, USA, 2016.
  6. B.P. BP Statistical Review of World Energy 2019; Pureprint Group Limited: London, UK, 2019. [Google Scholar]
  7. Yamada, H.; Hayashi, R.; Tonokura, K. Simultaneous measurements of on-road/in-vehicle nanoparticles and NOx while driving: Actual situations, passenger exposure and secondary formations. Sci. Total Environ. 2016, 563–564, 944–955. [Google Scholar] [CrossRef]
  8. Wang, Y.; Zheng, R.; Qin, Y.; Peng, J.; Li, M.; Lei, J.; Wu, Y.; Hu, M.; Shuai, S. The impact of fuel compositions on the particulate emissions of direct injection gasoline engine. Fuel 2016, 166, 543–552. [Google Scholar]
  9. Abdellatief, T.M.M.; Ershov, M.A.; Kapustin, V.M.; Abdelkareem, M.A.; Kamil, M.; Olabi, A.G. Recent trends for introducing promising fuel components to enhance the anti-knock quality of gasoline: A systematic review. Fuel 2021, 291, 120112. [Google Scholar] [CrossRef]
  10. Goyal, H.; Kook, S.; Ikeda, Y. The influence of fuel ignition quality and first injection proportion on gasoline compression ignition (GCI) combustion in a small-bore engine. Fuel 2019, 235, 1207–1215. [Google Scholar] [CrossRef]
  11. Liu, H.-F.; Wen, M.-S.; Cui, Y.-Q.; Zhang, C.-Q.; Zheng, Z.-Q.; Yao, M.-F. Effect of Blending n-Butanol in Diesel on Flame Development and Spectrum. Spectrosc. Spectr. Anal. 2020, 40, 1998–2004. [Google Scholar]
  12. Zheng, Z.; Yue, L.; Liu, H.; Zhu, Y.; Zhong, X.; Yao, M. Effect of two-stage injection on combustion and emissions under high EGR rate on a diesel engine by fueling blends of diesel/gasoline, diesel/n-butanol, diesel/gasoline/n-butanol and pure diesel. Energy Convers. Manag. 2015, 90, 1–11. [Google Scholar] [CrossRef]
  13. Liu, H.; Wang, X.; Zhang, D.; Dong, F.; Liu, X.; Yang, Y.; Huang, H.; Wang, Y.; Wang, Q.; Zheng, Z. Investigation on Blending Effects of Gasoline Fuel with N-Butanol, DMF, and Ethanol on the Fuel Consumption and Harmful Emissions in a GDI Vehicle. Energies 2019, 12, 1845. [Google Scholar] [CrossRef] [Green Version]
  14. Wen, M.; Zhang, C.; Yue, Z.; Liu, X.; Yang, Y.; Dong, F.; Liu, H.; Yao, M. Effects of Gasoline Octane Number on Fuel Consumption and Emissions in Two Vehicles Equipped with GDI and PFI Spark-Ignition Engine. J. Energy Eng. 2020, 146, 04020069. [Google Scholar] [CrossRef]
  15. de la Luz, A.P.; Iuga, C.; Vivier-Bunge, A. An effective force field to reproduce the solubility of MTBE in water. Fuel 2020, 264, 116761. [Google Scholar] [CrossRef]
  16. Topgül, T. The effects of MTBE blends on engine performance and exhaust emissions in a spark ignition engine. Fuel Process. Technol. 2015, 138, 483–489. [Google Scholar] [CrossRef]
  17. Poulopoulos, S.; Philippopoulos, C. Influence of MTBE addition into gasoline on automotive exhaust emissions. Atmos. Environ. 2000, 34, 4781–4786. [Google Scholar] [CrossRef]
  18. Franklin, P.; Koshland, C.; Lucas, D.; Sawyer, R.F. Evaluation of combustion by-products of MTBE as a component of reformulated gasoline. Chemosphere 2001, 42, 861–872. [Google Scholar] [CrossRef]
  19. Facetti, J.F.; Nunez, R.; Gomez, L.C.; Ojeda, J.; Bernal, C.; Leon-Ovelar, R.; Carvallo, F. Methyl tert-butyl ether (MtBE) in deep wells of the Patiño Aquifer, Paraguay: A preliminary characterization. Sci. Total Environ. 2019, 647, 1640–1650. [Google Scholar] [CrossRef]
  20. Rosell, M.; Lacorte, S.; Barceló, D. Simultaneous determination of methyl tert-butyl ether, its degradation products and other gasoline additives in soil samples by closed-system purge-and-trap gas chromatography—Mass spectrometry. J. Chromatogr. A 2006, 1132, 28–38. [Google Scholar] [CrossRef]
  21. Geo, V.E.; Godwin, D.J.; Thiyagarajana, S.; Saravanan, C.G.; Aloui, F. Effect of higher and lower order alcohol blending with gasoline on performance, emission and combustion characteristics of SI engine. Fuel 2019, 256, 115806. [Google Scholar]
  22. Wang, C.; Li, Y.; Xu, C.; Badawy, T.; Sahu, A.; Jiang, C. Methanol as an octane booster for gasoline fuels. Fuel 2019, 248, 76–84. [Google Scholar] [CrossRef]
  23. Waluyo, B.; Setiyo, M.; Wardana, I.N.G. Fuel performance for stable homogeneous gasoline-methanol-ethanol blends. Fuel 2021, 294, 120565. [Google Scholar] [CrossRef]
  24. Bilgin, A.; Sezer, I. Effects of methanol addition to gasoline on the performance and fuel cost of a spark ignition engine. Energy Fuels 2008, 22, 2782–2788. [Google Scholar] [CrossRef]
  25. Abu-Zaid, M.; Badran, O.; Yamin, J. Effect of Methanol Addition on the Performance of Spark Ignition Engines. Energy Fuels 2004, 18, 312–315. [Google Scholar] [CrossRef]
  26. Hao, H.; Liu, Z.; Zhao, F.; Du, J.; Chen, Y. Coal-derived alternative fuels for vehicle use in China: A review. J. Clean. Prod. 2017, 141, 774–790. [Google Scholar] [CrossRef]
  27. Karavalakis, G.; Short, D.; Vu, D.; Russell, R.L.; Asa-Awuku, A.; Jung, H.; Johnson, K.C.; Durbin, T.D. The impact of ethanol and iso-butanol blends on gaseous and particulate emissions from two passenger cars equipped with spray-guided and wall-guided direct injection SI (spark ignition) engines. Energy 2015, 82, 168–179. [Google Scholar] [CrossRef] [Green Version]
  28. Liu, Z.; Sun, P.; Du, Y.; Yu, X.; Dong, W.; Zhou, J. Improvement of combustion and emission by combined combustion of ethanol premix and gasoline direct injection in SI engine. Fuel 2021, 292, 120403. [Google Scholar] [CrossRef]
  29. da Silva, A., Jr.; Hauber, J.; Cancino, L.R.; Huber, K. The research octane numbers of ethanol-containing gasoline surrogates. Fuel 2019, 243, 306–313. [Google Scholar] [CrossRef]
  30. Ni, B.; Chen, Y. National Standard of the People’s Republic of China: Ethanol Gasoline for Vehicles (E10) (GB 18351-2010); China Standard Press: Beijing, China, 2010. [Google Scholar]
  31. Park, C.; Choi, Y.; Kim, C.; Oh, S.; Lim, G.; Moriyoshi, Y. Performance and exhaust emission characteristics of a spark ignition engine using ethanol and ethanol-reformed gas. Fuel 2010, 89, 2118–2125. [Google Scholar] [CrossRef]
  32. Turner, D.; Xu, H.; Cracknell, R.F.; Natarajan, V.; Chen, X. Combustion performance of bio-ethanol at various blend ratios in a gasoline direct injection engine. Fuel 2011, 90, 1999–2006. [Google Scholar] [CrossRef]
  33. Ceviz, M.A.; Yüksel, F. Effects of ethanol–unleaded gasoline blends on cyclic variability and emissions in an SI engine. Appl. Therm. Eng. 2005, 25, 917–925. [Google Scholar] [CrossRef]
  34. He, B.-Q.; Wang, J.-X.; Hao, J.-M.; Yan, X.-G.; Xiao, J.-H. A study on emission characteristics of an EFI engine with ethanol blended gasoline fuels. Atmos. Environ. 2003, 37, 949–957. [Google Scholar] [CrossRef]
  35. Balki, M.K.; Sayin, C.; Canakci, M. The effect of different alcohol fuels on the performance, emission and combustion characteristics of a gasoline engine. Fuel 2014, 115, 901–906. [Google Scholar] [CrossRef]
  36. Esan, A.O.; Adeyemi, A.D.; Ganesan, S. A review on the recent application of dimethyl carbonate in sustainable biodiesel production. J. Clean. Prod. 2020, 257, 120561. [Google Scholar] [CrossRef]
  37. Kartikeya, S.; Vimal, C.S. Synthesis of organic carbonates from alcoholysis of urea: A review. Catal. Rev. 2017, 59, 1–43. [Google Scholar]
  38. Maier, T.; Härtl, H.; Jacob, E.; Wachtmeister, G. Dimethyl carbonate (DMC) and Methyl Formate (MeFo): Emission characteristics of novel, clean and potentially CO2-neutral fuels including PMP and sub-23 nm nanoparticle-emission characteristics on a spark-ignition DI-engine. Fuel 2019, 256, 115925. [Google Scholar] [CrossRef]
  39. Wen, L.-B.; Xin, C.-Y.; Yang, S.-C. The effect of adding dimethyl carbonate (DMC) and ethanol to unleaded gasoline on exhaust emission. Appl. Energy 2010, 87, 115–121. [Google Scholar] [CrossRef]
  40. Thornton, S.F.; Nicholls, H.C.G.; Rolfe, S.A.; Mallinson, H.E.H.; Spence, M.J. Biodegradation and fate of ethyl tert-butyl ether (ETBE) in soil and groundwater: A review. J. Hazard. Mater. 2020, 391, 122046. [Google Scholar] [CrossRef]
  41. Antonio, V.; Ouldouz, G.; David, V.; Estarellas, C.; López, M.; Gómez-Catalán, J.; Lavilla, R.; Delgado, J.; Luque, F.J. Holistic approach to anti-knock agents: A high-throughput screening of aniline-like compounds. Fuel 2021, 305, 121518. [Google Scholar]
  42. Liu, M.M. Synthesis process of Sec-butyl acetate. Petrochem. Technol. 2017, 24, 271. [Google Scholar]
  43. Chemical Dictionary. Available online: http://www.chemdict.com/datcdcfa7j/ (accessed on 28 January 2022).
  44. Xiao, H.; Guo, F.; Wang, R.; Yang, X.; Li, S.; Ruan, J. Combustion performance and emission characteristics of diesel engine fueled with iso-butanol/biodiesel blends. Fuel 2020, 268, 117387. [Google Scholar] [CrossRef]
  45. Mohammed, M.K.; Balla, H.H.; Al-Dulaimi, Z.M.H.; Kareem, Z.S.; Al-Zuhairy, M.S. Effect of ethanol-gasoline blends on SI engine performance and emissions. Case Stud. Therm. Eng. 2021, 25, 100891. [Google Scholar] [CrossRef]
  46. Effect of Ethanol Gasoline Fuel Characteristics on Direct Injection Supercharged Passenger Vehicle Performance. 2020. Available online: https://d.wanfangdata.com.cn/periodical/nrjgc202005008 (accessed on 28 January 2022).
  47. Jin, D.; Choi, K.; Myung, C.-L.; Lim, Y.; Lee, J.; Park, S. The impact of various ethanol-gasoline blends on particulates and unregulated gaseous emissions characteristics from a spark ignition direct injection (SIDI) passenger vehicle. Fuel 2017, 209, 702–712. [Google Scholar] [CrossRef]
  48. Oda, K.; Hosono, K.; Isoda, T.; Aihara, H.; Kojima, K.; Shibata, G. Effect of Gasoline Composition on Engine Performance. SAE 1993, 930375. [Google Scholar]
  49. Aikawa, K.; Sakurai, T.; Jetter, J.J. Development of a predictive model for gasoline vehicle particulate matter emissions. SAE Int. J. Fuels Lubr. 2010, 3, 610–622. [Google Scholar] [CrossRef]
  50. Experimental Study on Vehicle and Emission Performance of Different Oxygen-Containing Blending Gasoline Fuel. Chin. Intern. Combust. 2019. Available online: https://d.wanfangdata.com.cn/periodical/nrjgc201906001 (accessed on 28 January 2022).
  51. Liu, H.F.; Wen, M.S.; Zhang, C.Q. Effects of blending ratio of methanol on performance and emissions of a passenger vehicle with GDI engine. In Proceedings of the 7th International Seminar on Motor Vehicle Emission Control and Supervision Technology, Wuhan, China, 17–19 July 2021. [Google Scholar]
  52. Dong, F.; Liu, H.F.; Yang, Y. Gasoline Application Technology Question and Answer; China Quality Supervision Press: Beijing, China, 2018; p. 44. [Google Scholar]
  53. Shen, Y.T.; Shuai, S.J.; Wang, J.X. Study on the effect of olefin on engine emission and combustion characteristics. Automot. Eng. 2008, 30, 644–647. [Google Scholar]
  54. Takei, Y.; Uehara, T.; Hoshi, H.; Sugiyama, S.; Okada, M. Effect of California Phase 2 Reformulated Gasoline Specifications on Exhaust Emission Reduction: Part 3; SAE International: Warrendale, PA, USA, 1997; p. 972851. [Google Scholar]
  55. Pechout, M.; Dittrich, A.; Vojtisek-Lom, M. Operation of an Ordinary PFI Engine on n-butanol and Iso-butanol and Their Blends with Gasoline; No.: 2014-01-2618; SAE International: Warrendale, PA, USA, 2014. [Google Scholar]
Figure 1. The schematic diagram of the chassis dynamometer test bench.
Energies 15 01605 g001
Figure 2. The vehicle speed during the NEDC cycle.
Energies 15 01605 g002
Figure 3. The volume fuel consumption and equivalent fuel consumption of the PFI vehicle when fueled with the different fuels: (a) the volume fuel consumption; (b) the equivalent fuel consumption.
Energies 15 01605 g003
Figure 4. The CO2 emissions of the PFI vehicle when fueled with the different fuels.
Energies 15 01605 g004
Figure 5. The CO emissions of the PFI vehicle when fueled with the different fuels.
Energies 15 01605 g005
Figure 6. The THC emissions of the PFI vehicle when fueled with the different fuels.
Energies 15 01605 g006
Figure 7. The NOx emissions of the PFI vehicle when fueled with the different fuels.
Energies 15 01605 g007
Figure 8. The relative change rate (%) of the five mixed fuels relative to the base fuel (G89) on the four gaseous emissions.
Energies 15 01605 g008
Figure 9. The acceleration time of the PFI vehicle from 0–100 km when fueled with the different fuels.
Energies 15 01605 g009
Table 1. The main vehicle specifications.
ParameterValue
Injection systemPFI
Displacement (L)1.6
Intake systemNaturally aspirated
Cylinder number4
Maximum power (kW)90
Rated speed (rpm)6000
Maximum torque (N·m)154
Compress ratio10.2
Emission standardChina V
Cylinder diameter × stroke (mm)80.5 × 78.5
Table 2. The main test equipment.
ParameterModel SpecificationsManufacturer
Chassis dynamometerROADSIM 48”compactAVL, Austria
Emission analyzerMEXA-7200HHoriba, Japan
Dilute sampling systemCVS-7200THoriba, Japan
Dilution channelDLS-7100EHoriba, Japan
Table 3. The measurement errors of the main test equipment.
EquipmentTest ProjectMeasurement Errors
Emission analyzerCO2≤1% of full scale or 2% of measured value, whichever was the smallest
CO
THC
NOx
Chassis dynamometerConstant speed difference<0.05% of full scale
Time measurement tolerance0.00005%
Constant traction tolerance<0.2% of full scale
Table 4. The physical and chemical properties of the test fuels.
FuelG89G89-1G89-2G89-3G89-4G89-5
AdditivesETBEN-MethylanilineSec-butyl acetateP-methylphenolIsobutanol
Additives blending rate15% (5)1.5% (1)9% (3)1.5% (1)12% (4)
Additives molecular formulaC6H14OC7H9NC6H12O2C7H8OC4H10O
Additives latent heat of vaporization (kJ/kg@20 °C)327.870 (2)516.952 (4)313.846 (1)431.024 (3)688.059 (5)
Boiling point/°C169.4 (1)172.7 (2)180.9 (5)173.8 (3)178.5 (4)184.6 (6)
RON (research octane number)89.0 (1)93.1 (5)94.8 (6)89.3 (2)89.5 (3)90.9 (4)
Density at 20 °C/(kg/m3)723.6 (1)724.9 (2)727.2 (4)735.8 (6)726.4 (3)730.4 (5)
Lower heating value (Mj/L)33.528 (5)32.771 (1)33.394 (4)32.871 (2)33.584 (6)32.919 (3)
T50/°C89.5 (3)78 (1)92.9 (4)99.4 (6)93.5 (5)88.5 (2)
T90/°C153.4 (4)151.4 (2)156.6 (6)151 (1)156.1 (5)151.8 (3)
Aromatics content (%)26.45 (4)22.13 (1)27.32 (5)23.4 (3)27.38 (6)22.71 (2)
Olefin content (%)6.19 (6)4.96 (1)6.11 (4)6.09 (3)6.13 (5)5.79 (2)
C9+ aromatics content (vol %)16.786 (6)14.268 (1)16.534 (4)15.275 (3)16.534 (4)14.772 (2)
Publisher’s Note: MDPI stays neutral with regard to jurisdictional claims in published maps and institutional affiliations.

