Article

Geopolitical Risk as a Determinant of Renewable Energy Investments

by
Floros Flouros
1,
Victoria Pistikou
1,2 and
Vasilios Plakandaras
2,*
1
Department of History, Politics and International Relations, School of Social Sciences, Arts and Humanities, Neapolis University Pafos, Paphos 8042, Cyprus
2
Department of Economics, Democritus University of Thrace, University Campus, 69100 Komotini, Greece
*
Author to whom correspondence should be addressed.
Energies 2022, 15(4), 1498; https://doi.org/10.3390/en15041498
Submission received: 19 January 2022 / Revised: 11 February 2022 / Accepted: 14 February 2022 / Published: 17 February 2022
(This article belongs to the Special Issue Emerging Trends in Energy Economics)

Abstract

:
The advent of various initiatives around the globe in shaping an energy transition towards a “greener” energy production future sparked a research interest towards the determinants that will shape their success. In this paper, we depart from the relevant literature evaluating the potential effect of geopolitical tensions on renewable energy investments, building on an explicit quantitative approach that provides clear empirical evidence. In doing so, we compile a large panel of 171 economies and measure the effect of geopolitical risk on “green” investing as measured by popular geopolitical risk indices, while controlling for all major variables proposed by literature. Our flexible Autoregressive Distributed Lag model with heterogenous effects across economies suggests that geopolitical risk has a significantly measurable effect on green investments both in the short and the long run. In fact, our results suggest that proper model specification is robust across alternate risk assessments. Overall, our study has direct policy implications suggesting that renewable energy could be an important part of our energy mix only if we take into account its linkages with geopolitical tensions.

1. Introduction

Energy is considered a vital element to the development and prosperity of societies, especially in the modern age of interconnection, high technological advancement, and globalization. Despite the fact that energy as a fuel for sustainable development continues to play a vital role, the acute environmental issues of our times have sparked a conversation on the forms and types of energy that should be used to ensure a high quality of life in developed economies and a safe energy environment to underdeveloped and developing ones. Thus, the debate focuses on the right to seek energy abundance and a just energy transition towards more environmentally friendly energy sources for all societies.
Unlike other societal dilemmas, the historical evolution of energy transition cannot be used to shape a cause-and-effect framework in the near future. In particular, the initial changes in fuel from wood to coal, and even oil, may have been influenced by the need to provide better services to society. Now, the latest changes may be deliberate and can be seen as driven, for others, by concerns about greenhouse gas emissions, nuclear risks, energy prices or dependence on energy imports. The problem lies in the fact that certain types and forms of energy, such as fossil fuels, emit gases that directly affect the environment to a critical extent, a fact that has already caused potentially irreversible damage globally [1].
The aim of this study is to evaluate the potential relationship between Renewable Energy Sources (RES) and Geopolitical Risk (GPR) as a driver of energy transition, since most of the studies focus mainly on the role of stakeholders and policy-making. More specifically, the term “energy transition” refers to a more sustainable use of energy, that of renewable sources. According to the literature, “transition” concerns socio-technical system changes. In particular, according to [2], transition is based on three levels: the niche level, the regime level, as well as the landscape level, “where impactful global events take place—like wars, economic crises, environmental disasters, geopolitical events, supranational decision-making—that influence both regime stability and the emergence and development of niches”. In this context, there are several studies highlighting the role of stakeholders and policy makers in energy transition. Indicatively, according to [3] “policy makers should take stakeholders’ perceptions into due consideration when trying to design a well suited and balanced policy intervention”, since energy transition requires socio-economic and environmental interactions, which create a complicated context in which decision-making takes place. In addition, [4] index takes into account several variables, such as governance and economic dynamics, in order to create a useful tool for policy-makers in order to evaluate energy transition, given that energy transition policy is determined mainly by stakeholders, since they affect the decision-making in several levels [5]. Therefore, the contribution of this study towards existing literature not only examines the potential effect of geopolitical tensions on renewable energy investments, but further enriches the stakeholders’ arsenals in the decision-making process.
The correlation of international politics and energy is perceived under several aspects, such as environmental issues and climate change [5,6,7,8], nuclear proliferation [9,10,11], as well as energy security as a vital determinant of economic growth [12,13,14]. In a sense of competitiveness and struggle for power rather than cooperation, none of the countries are willing to jeopardize their access in energy production as it would have severe implications on economic growth and development [15,16,17]. As mentioned by [18], “the climate regime has been afflicted by the ‘free rider’ problem. If some countries join together and agree to make cuts which are costly, then others who do not can enjoy the environmental benefits of such action without paying”. Especially developing countries, such as India and China, refuse to give up coal as an energy source, since their development is highly dependent on this element [19,20]. Besides, access to energy sources is a matter of national security, either in terms of demand or supply [21]. The issue of energy security and even energy autonomy through investing in renewable energy investments has become even more pressing during the latest tensions between Russia and the rest of Europe, the closure of the Maghreb-Europe Gas Pipeline between Algeria and Spain, or the tensions in the Middle East that mounted fossil fuel prices. The European Union has marked the first significant effort in mitigating its dependence to other oil and natural gas producing countries with the ambitious “Green Deal” policy initiative.
The intensive use of fossil fuels during previous eras had severe environmental impacts. Increased energy consumption associated with high CO2 emissions due to the combustion of fossil fuels led to global warming. The current policies implemented by developed countries did not work effectively for various reasons, including weak political propensity to effectively address the problem. The most illustrative example is the decision of the Trump administration to withdraw from the Paris Climate Agreement, even though it would be possible for the country to return back and rejoin in the near future should a new administration decide to do so. It was the first nation in the world to formally withdraw from the Paris Climate Agreement.
During the recent pandemic crisis of COVID-19, the energy demand decreased due to the slowdown of economic activities and business on a global level. Two years and counting from the start of the pandemic, global energy demand seems close to reverting back to its earlier levels as the global economy is recovering to its previous state. The crisis people have been forced to manage without preparation in terms of its extent and intensity seems to be a prelude to handling future crises, which will most likely become more frequent in other areas such as energy, economics and other. At the same time, the necessary energy for producing one global GDP unit declined during the last years, while investments in energy efficiency reverted and almost started increasing from 2021. Such investments can be linked to better efficiency in terms of optimal energy use and higher yield rates that contribute to the need for less energy consumption for the same outcome.
Although economically developed countries account for about 60% of the total expenditure projected in the Sustainable Recovery Report (Figure 1), the available funds of these economies are much larger than those of emerging and developing economies, which already face a large infrastructure deficit [22]. These emerging markets and emerging economies account for one-fifth of the world’s spending on clean energy, while accounting for two-thirds of the world’s population [22].
The falling cost of key clean energy technologies offers a huge opportunity for all countries to chart a new, lower emissions pathway towards economic growth and prosperity. This is reflected on the revenue of listed renewable power companies’ stocks outperforming fossil fuel companies and public equity market indices in recent years. However, clean energy investment still remains far short of what is required to put the energy system on a sustainable track (Figure 2). At the same time, the amount being spent on oil and natural gas is also short of what would be required to maintain current consumption trends [22]. A possible option could be to achieve higher capital investments for clean energy, which would not be an easy process due to required adjustments during the energy transition period. The possibility of increasing investments in green and renewable energy technologies is a function of their investment costs and the policy of the countries—incentives or charges. As the cost of basic green and renewable energy technologies decreases, so will a market of opportunities emerge. It is observed that investments in green and renewable energy technologies remain low and there is a distance from the point that is considered sufficient to put the energy system on a sustainable path [22].
Since fossil fuels are limited, the concentration on them comes from their dominant position in the global energy landscape, which accounts for almost 86% of the global energy consumption [23]. At the same time, Renewable Energy Sources (RES) can be reproduced in order to replace the consumed number of resources such as solar, wind, hydropower, geothermal, and biomass. The case of geopolitical risk in this scenario is the mix of military disputes between nation states and war threats that can have an impact on the international political system [24]. RES are known to be clean, green energy and friendly to the environment, and for that reason, RES can critically contribute to reduce CO2 emissions and other pollutants. Renewables, including solar, wind, hydro, biofuels, biomass, and others, are at the center of the transition to a less carbon-intensive and more sustainable energy system [22]. Based on the use of the energy mix in 2015, the fuel mix used for global energy production in 2015/16 can be considered as: fossil fuels represent 85% of the total amount of energy produced worldwide, while renewable energy sources account for only 1–2%. It should be noted that crude oil (40%), coal (22%), and natural gas (23%) are considered fossil fuels, while geothermal, sunlight, wind and recycling are considered renewable energy sources. The appearance of RES balances the influence of oil and gas producers in global politics. RES is closely related to climate change issues, natural resource depletion, and energy diversification, which contribute to energy security. Since geopolitical interests in the fossil fuels market changes, it makes RES appear more important in the international economy [25].
Energy and geopolitics have been tightly related to each other. Security of supply and access to the main natural resources have critically contributed to the energy security and consequently the national security of the involved nation-states. Moreover, access to energy resources has been proved a critical parameter in determining the winners of wars in the last century. Energy has been considered as one of the available tools that could influence neighboring states and strengthen national security through properly implemented energy policies. It has been seen that nation-states use energy as a geopolitical weapon in order to protect their vital interests and contribute to their national security [26].
Nevertheless, the development of new resources is changing the geopolitical and energy landscape since the transition to more environmentally friendly solutions has already started and is undergoing on a global scale. The availability of new resources is driving the creation of new geopolitical tools and opportunities, while at the same time climate change supports the energy transition to more green choices. The Intergovernmental Panel on Climate Change (IPCC), a group convened by the United Nations, set a specific target in its 1.5 °C report that clear benchmarks are required for action, such as cutting all emissions in half by 2030. Those countries with more capacity and responsibility must lead the way and support others in their journey. Governments must align their targets and plans with 1.5 °C according to the commitment of COP26 event, held in Glasgow in 2021. Based on current policies it looks that we are only on track to a critical 2.9 °C future [27]. Numerous studies and discussions in the literature show that ongoing climate change is primarily due to the rapid increase in Green House Gas (GHG) emissions from carbon dioxide (CO2)3 as well as from methane gas and nitrous oxide [28,29]. The major source of carbon dioxide (CO2) emissions is the burning of fossil fuels, which represented 87% of the world’s energy supply in 2012 [30].
The motivation of this study stems from the understudied relationship between Geopolitical risk and energy transition towards an environmentally friendly production path. The hypothesis tested is whether GPR influences Renewable Energy Sources (RES) production and thus investments in this sector should be treated as any other investment. Although the existing literature reaches mixed results regarding the sign of this relationship, its existence is of great importance both to practitioners and policy authorities. The limited number of studies in the relevant literature treats the estimation problem based on cointegrated panel regressions or on univariate time-series, no approach evaluates a heterogenous response framework that includes contemporaneously short and long-term dynamics. Following this string of literature, we develop a panel Autoregressive Distributed Lag (ARDL) estimator with heterogeneous effects [31] to study the relationship between RES and GPR on a wide range of economies. In doing so, we evaluate the Caldara and Iacovello [24] GPR index that comes in two flavors; an aggregated one for the global economy and a disaggregated one for 18 developing economies. As a robustness test, we repeat our analysis using the World Uncertainty Index of [2]. Our empirical findings support the existence of a significant negative relationship between GPR and investments in RES. Thus, despite the significance of a just energy transition towards “green” energy, the nature of the investments in the sector does not exhibit different characteristics than any other investment and is heavily relied upon traditional investment criteria such as GPR. Our contribution could be summarized to the following items:
  • Use of a heterogeneous approach on a panel dataset that is able to grasp asymmetric effects among different economies.
  • A broad examination of the entire global geopolitical landscape and its relationship with the evolution of renewable energy sources.
  • A definite empirical suggestion that geopolitical tensions are a crucial deterrent of investing in “green” energy.

2. Literature Review
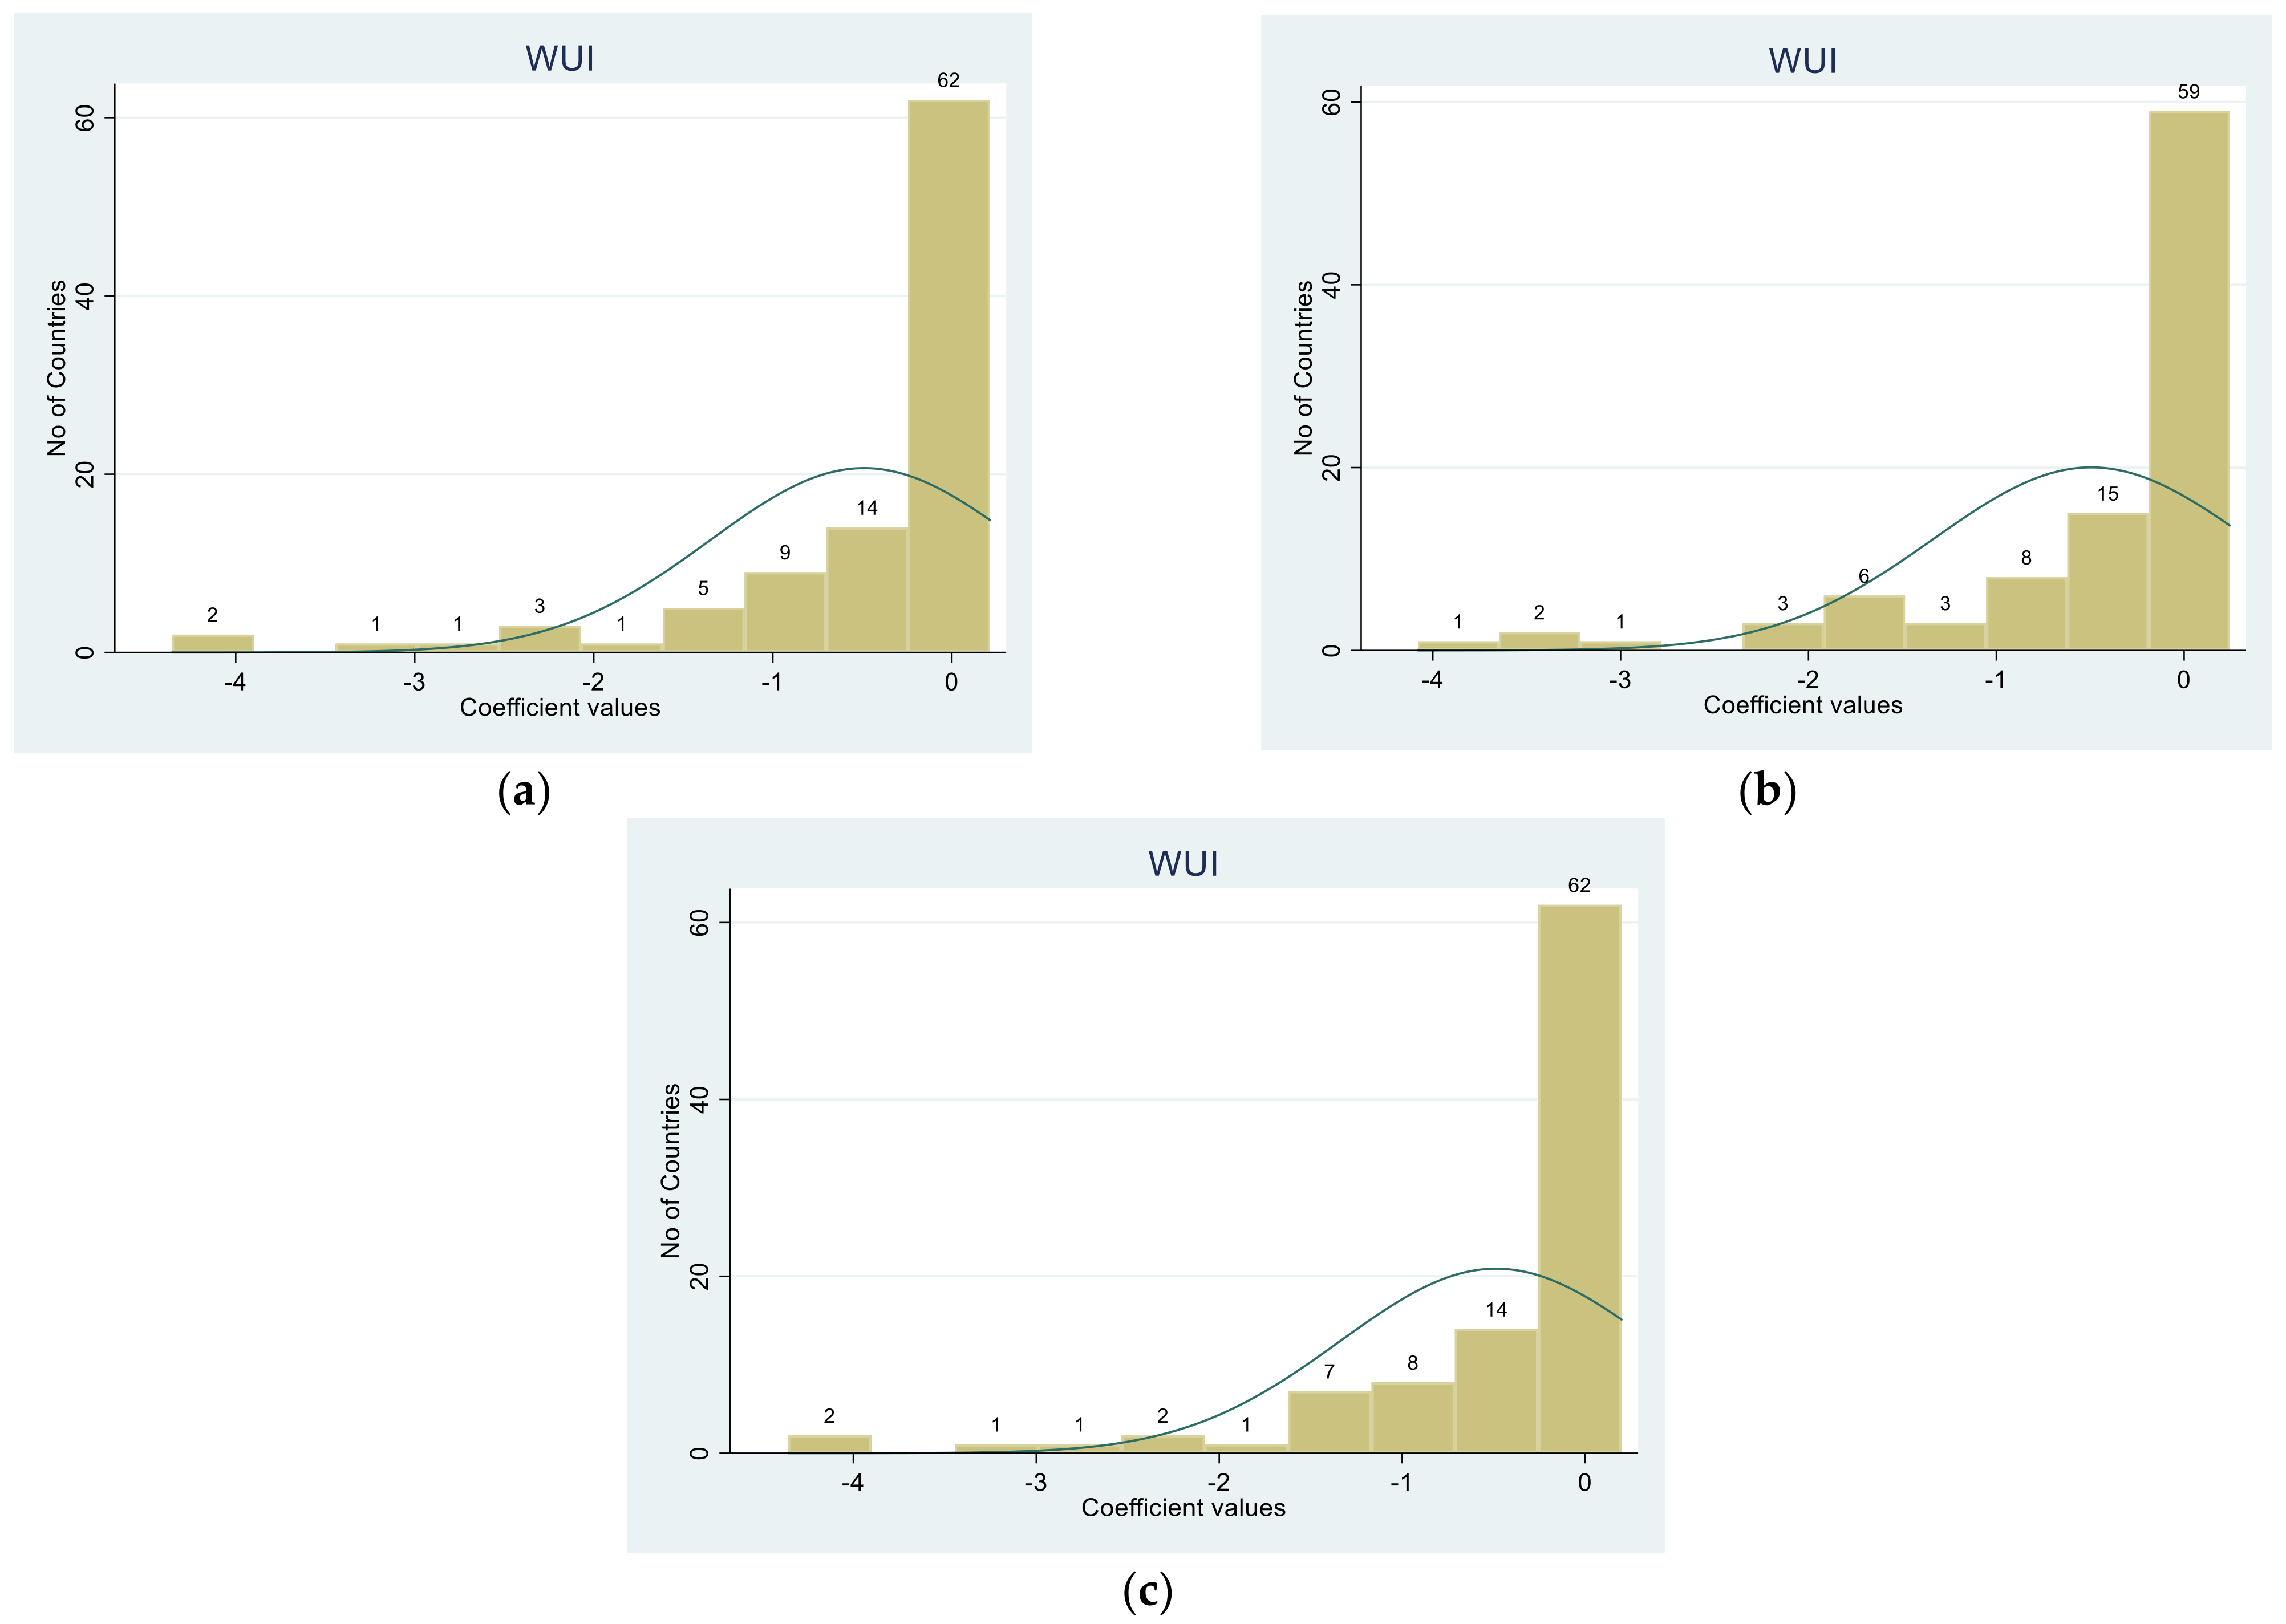
One of the main questions posed in the relevant literature is how geopolitics interact with energy, either regarding fossil fuels or renewables sources [32,33,34]. Up to now, most scholars analyze the correlation between political and economic uncertainty with energy, finding mixed results. In particular, according to [35], the determinants of renewable energy are mainly determined by consumption, supply and demand while political variables represent only 23% of the overall literature, focusing on institutional quality, democracy, ideology and governance as independent variables. As the author mentions “[…] the strand of literature to which the reviewed papers contribute to is relatively new and fragmented”. However, there are only few studies which focus on the relationship between Geopolitical Risk (GPR), as developed by [24], and RES.
The majority of empirical studies examine the impact of political and economic instability on fossil fuels. More specifically, focusing on the correlation between geopolitics and energy, as measured by geopolitical risk, most scholars examine the connection between these two variables based on fossil fuels, such as CO2 emissions, and most find mixed results. For example, [36] argue that high geopolitical risk is associated with high CO2 emissions, especially in the case of BRICS. Implementing a STRIRPAT model, [37] find that CO2 emissions increased due to GPR for BRICS. Other scholars find similar results, but they measure geopolitical risk in terms of military power [38], or terrorism [39,40]. By employing ARDL and a fully modified ordinary least regression model, most of the mentioned studies argue that militarization escalates CO2 emissions. However, according to [41], militarization mitigates CO2 emissions as far as India and Pakistan is concerned, due to the fact that they find an asymmetric impact between these two variables.
Reference [41] argue that GPR has an asymmetric effect on CO2 emissions. Using the non-linear autoregressive distributed lag model (NARDL), they find that any change in geopolitical risk negatively affects energy consumption and CO2 emissions. In particular, measuring the impact of geopolitical risk on CO2 emissions and energy consumption in BRICS, they conclude that “clean energy consumption can be a useful tool to reduce the geopolitical risks in BRICS”. Reference [42] also argue that geopolitical risk is negatively correlated to CO2 emissions, and that oil prices seem to remain unaffected on shocks from investments in RES. However, [43], focusing on energy transition behavior with an emphasis on geopolitical risk and implementing the ARDL method, suggest that there is a positive correlation between geopolitical risks and energy transition and “any increase in CO2 emissions has negative and statistically significant impact on energy transition in Russia”.
Given that a group of scholars considers the impact of geopolitical risk in a wider sense, that of political and economic instability, they measure its impact both on CO2 emissions and renewable sources. In particular, [44] implements a Generalized Method of Moments approach using two panel data estimation techniques. He concludes that political instability increases CO2 emissions, given that “democracy itself can also lead to environmental degradation”. Moreover, [45] is one of the first studies that examines the effects of geopolitical risk, based on the [24] index, on the oil stock nexus for the years 1899–2016. By implementing an unrestricted Vector Autoregressive-GARCH model in order to model time-varying conditional variances, they conclude that oil market volatility is larger compared to that of the stock market and the former is more significantly affected by GPR than the stock market index.
Regarding the economic aspect, [46] based on the Economic Uncertainty Index developed by [47], argue that in the short run, economic uncertainty increases CO2 emissions, and, additionally, apart from political instability, economic instability can have a positive impact on environmental degradation in the long run. However, [48] based on the World Uncertainty Index (WUI) and using an ARDL approach, find that there is a positive correlation between the WUI and CO2 emissions in the long run. On the other hand, [49] implemented non-linear econometric approaches and found a negative correlation between WUI and RES. As they mention, “the nonparametric LLLS regression estimates exhibit a negative long-run association between renewable energy consumption and policy uncertainty i.e., higher uncertainty regarding economic policy lowers renewable energy consumptions and vice-versa”. However, when renewable energy consumption is examined in relation to political factors by [50], political and institutional factors have a strong and statistically significant effect on renewable energy consumption. In particular, implementing a short and long-run panel causality approach on an Error Correction Model, they conclude that “renewable energy markets are strongly interwoven with major political decisions”.
On a different path, [51] measure the impact of WUI on investments for various industrial sectors. On a panel approach, they conclude that although the economic policy uncertainty inhibits the energy enterprises of fossil fuels, such as coal and petroleum, it significantly promotes solar and renewable energy. However, [52] finds no correlation between economic policy uncertainty and renewable energy growth. Implementing the empirical model based [52], the author finds a negative but statistically insignificant effect between the two variables. In addition, more attention is given on the impact of geopolitics on investments rather than on RES investments. For instance, many scholars argue that geopolitical risk has a severe impact on investments and affects negatively other economic sectors, such as tourism, trade flows, and oil prices [53,54,55] but positively affects government investments [56]. Other studies show that the impact of GPR varies depending on the geopolitically-sensitive sector [48] and energy can be considered as such. Moreover, given that RES is heavily depended on in R&D products, again, GPR has a negative relationship with R&D investments, although even in this field there are mixed results [57].
Additionally, geopolitical risk seems to significantly affect the diffusion of RES and energy production [58,59] and has a positive effect on renewable energy consumption [60]. In particular, [58] examined the correlation between geopolitical risk and renewable energy deployment in the United States based on quarterly data for the period of 1973 to 2020, using cointegration analysis and the ARDL approach. The study concludes that geopolitical risk has a positive and significant impact on renewable energy diffusion, since renewable energy, in a way, diminishes the level of energy dependency, thus providing energy security. Thus, “geopolitical risk is a driver to renewable energy deployment because of the expected negative consequences of these uncertainties on the economy”. Similarly, [59] finds corresponding results in a similar study focusing on 10 crude oil importer countries for the period of 1985–2017, employing a panel cointegration analysis and the ARDL approach. Similarly, [60] investigated the effect of geopolitical risk on renewable energy consumption in emerging economies over the period of 1996–2015. They employed a two-step system generalized method of moments (GMMs) approach. The results showed that geopolitical risk has a positive and significant impact on renewable energy consumption. Besides, financial development also supports renewable energy consumption in emerging economies, while the proper selection of a power plant based on renewable resources has to fulfil many criteria and incorporates high uncertainty.
The geopolitics of Renewable Energy Sources (RES), seems to have quite different characteristics compared to the cases where conventional fuels are met, such as crude oil, natural gas, lignite and coal. In the case of RES—when compared to conventional fuels—there is a greater need for Foreign Direct Investment (FDI) and allocation of necessary capital for the creation of fixed assets that will relate to the appropriate infrastructure, since most countries do not have them available at the moment. Moreover, there is a need for new distribution networks as well as creation of an appropriate network of suppliers and consumers, while RES energy production is much more decentralized and distributed in more areas within the country. The production of energy from RES creates the immediate need for design, construction, and availability of energy storage methods, which is now a necessary condition for the energy security of a country and the avoidance of unforeseen interruptions in the availability of electricity in the distribution network to consumers. Furthermore, the production of energy from RES could have a positive impact on the geopolitical relations in the world, although such a condition is not always unambiguous, since it could be considered the opposite, taking into account basic observations regarding RES. Finally, the use of RES still requires a great deal of effort to inform, build knowledge on, accept and integrate into existing networks of each country in a correct and efficient manner.
The increasing use of RES and the replacement of traditional forms of energy has already been under progress, referring to the energy transition process that takes place in the international energy scene. This transformation in the energy mix seems to be accompanied by a corresponding geopolitical risk that may drive new developments and changes in international politics [61,62]. Such a massive energy transition, although it would take time and several obstacles could delay its initial plan, can impact international relations and drive nation-states to gain more strength and power in case they succeed in gaining access to the related natural resources that are critical for the development of RES [63,64,65]. Current findings on the contribution of RES to normality and peace at both regional and global levels differ. One strand of literature poses that an increase of RES and their greater contribution to the energy mix contributes to the reduction of geopolitical risk and to the deepening of the cooperation between states. The need for cooperation between economies and the interconnection of energy systems for the maintenance of an adequate energy production system with smooth and efficient operation is also supported [66,67]. Moreover, energy production based solely on the “green” RES will contribute more to global energy security and thus smoothen tensions and frictions among states [68,69].
The intensification of cryptocurrency mining and the need to use environmentally friendly energy production to sustain respective investments has spurred a novel research path. [70] present an algorithm designed for the trading of energy saving certificates, implemented via a blockchain-based smart contract system, that can be used to reward “green” energy consumption and penalize all other forms in mining cryptocurrencies. [71] calculate an environmental performance index that introduces crypto mining to the energy consumption mix, suggesting that European countries have a firmer commitment in reducing the environmental impact from mining. Finally, [65] show that Bitcoin and gold respond positively to the composite geopolitical risk indicator when risk is high. This underscores that both Bitcoin and gold have the ability to act as safe havens for assets whose valuations plummet during times of violent geopolitical conflicts.

3. The Data

As we discuss in the introduction section, the scope of this study is to evaluate the potential causal relationship between RES and GPR. To account for this scope, we compiled an annual dataset of 171 countries from the period 1980–2018 from the U.S. Energy Information Administration (EIA) on the ratio of Energy production from RES. The GRP index we selected was the Caldara and Iacovello [24] from the Federal Reserve (FRB), given its broad use in relevant literature. The aforementioned index creates an index on the range of 0–100 based on a selection of newspaper articles from 10 outlets covering geopolitical tensions. In our framework, we merge the recent index that covers the period of 1985–2021 to the historical index (with only 3 newspapers) that goes back to 1990. Moreover, we control for various other effects using Real GDP growth rates to control for heterogeneities in economic development levels between economies, energy consumption per capita, and energy consumption per 2015 PPP GDP (MMBtu/$) to control for access to energy and brent oil prices from the repository of the Federal reserve of St. Louis (Fred), to account for the cost of energy production and the comparison with other energy production means. The descriptive statistics of our dataset are reported in Table 1.
As we observe, our panel dataset is unbalanced, since we miss observations for a number of variables. Nevertheless, the panel approach provides substantially more robust results than a simple Least-Squares regression with only 39 observations. Our variables have different logarithmic range, therefore we use logarithms for all variables apart from the RES ratio (ren_prod_r) and real GDP growth rate (gdp). Moreover, we observe large heterogeneities as we find countries with no RES production (South Sudan, Haiti, and Sri Lanka) and others with very large production ratios (Ireland, Austria, and Iceland). While the Caldara and Iacovello [24] index is a popular choice among researchers, it measures only global geopolitical risk without a spatial characteristic. Thus, to account for country specific results, we examine a sub-sample of 18 developing countries, for which Caldara and Iacovello produce an economy-specific index. This exercise could potentially highlight heterogeneity better than the aggregated index. The descriptive statistics of this subsample are reported in Table 2.
The sample is again heterogenous and logarithms are used to account for a different arithmetic range in variables. Finally, as a robustness test, we evaluate the World Uncertainty Index of [2] as the geopolitical risk measure. The index is produced annually for the period 1980–2018 for 130 countries. The index is country-specific and thus can be used to evaluate the results from the above approaches. We report descriptive statistics in Table 3.
Again, we resort to logarithmic forms of the variables, while the heterogeneity is obvious.

4. Empirical Results

The relationship between GPR and RES cannot be examined using a typical regression model, applied in quite a few empirical approaches in the literature, given that infrastructure investments need a significant time horizon to be completed and create a “critical mass” for shaping consumption preferences. The typical regression approaches (even in more advanced machine learning approaches) evaluate short-term relationships between variables. To account for long-term relationships and the possible evolving stationary of variables in the short-term, we use a panel Cross-Section Augmented Autoregressive Distributed Lag (CS-ARDL) model of [27] that accounts for long-term relationships and possible cointegration between variables as in (1):
Δ y i , t = β 0 , i + l = 1 p y β i , l Δ y i ,   t l + j = 0 p x β i , l Δ x i , t j + l = 0 p z ¯ ψ i , l z ¯ t l + θ o , i y i , t 1 + j = 0 k θ i , k x i , t k + ε i . t
where θ o , i y i , t 1 + j = 0 k θ i , k x i , t k is the Error correction term (ECM) of the model, py the lag order of the dependent variable, px the lag order of the control variables, p z ¯ the lag order of the added cross-sectional averages to account for endogeneity issues. The ECM part of the model captures long-term relationships between the dependent and the independent variables, while the rest of the model accounts for short-term relationships. The lag order py, px and p z ¯ are determined according to the Bayesian Information Criterion (BIC), while the ARDL/Bounds Testing methodology determines long-term (cointegration) relationship.
In estimating models’ coefficients we consider the Mean Group [MG] [72] estimator that allows for cross-sectional heterogenous coefficients and nonstationary (but cointegrated) data, the Common Correlated Effects Mean Group [CCEMG] [27] estimator that controls for cross-sectional dependence in addition to the characteristics of MG and the Dynamic Common Correlated Effects Mean Group [DCCEMG] [27] that adds lagged dependent variables to CCEMG to address endogeneity issues which render the estimators biased and inconsistent. The D/CCEMG estimator treats common dynamic factors as nuisance parameters used solely for controlling cross-sectional dependence without actual interpretation ability.

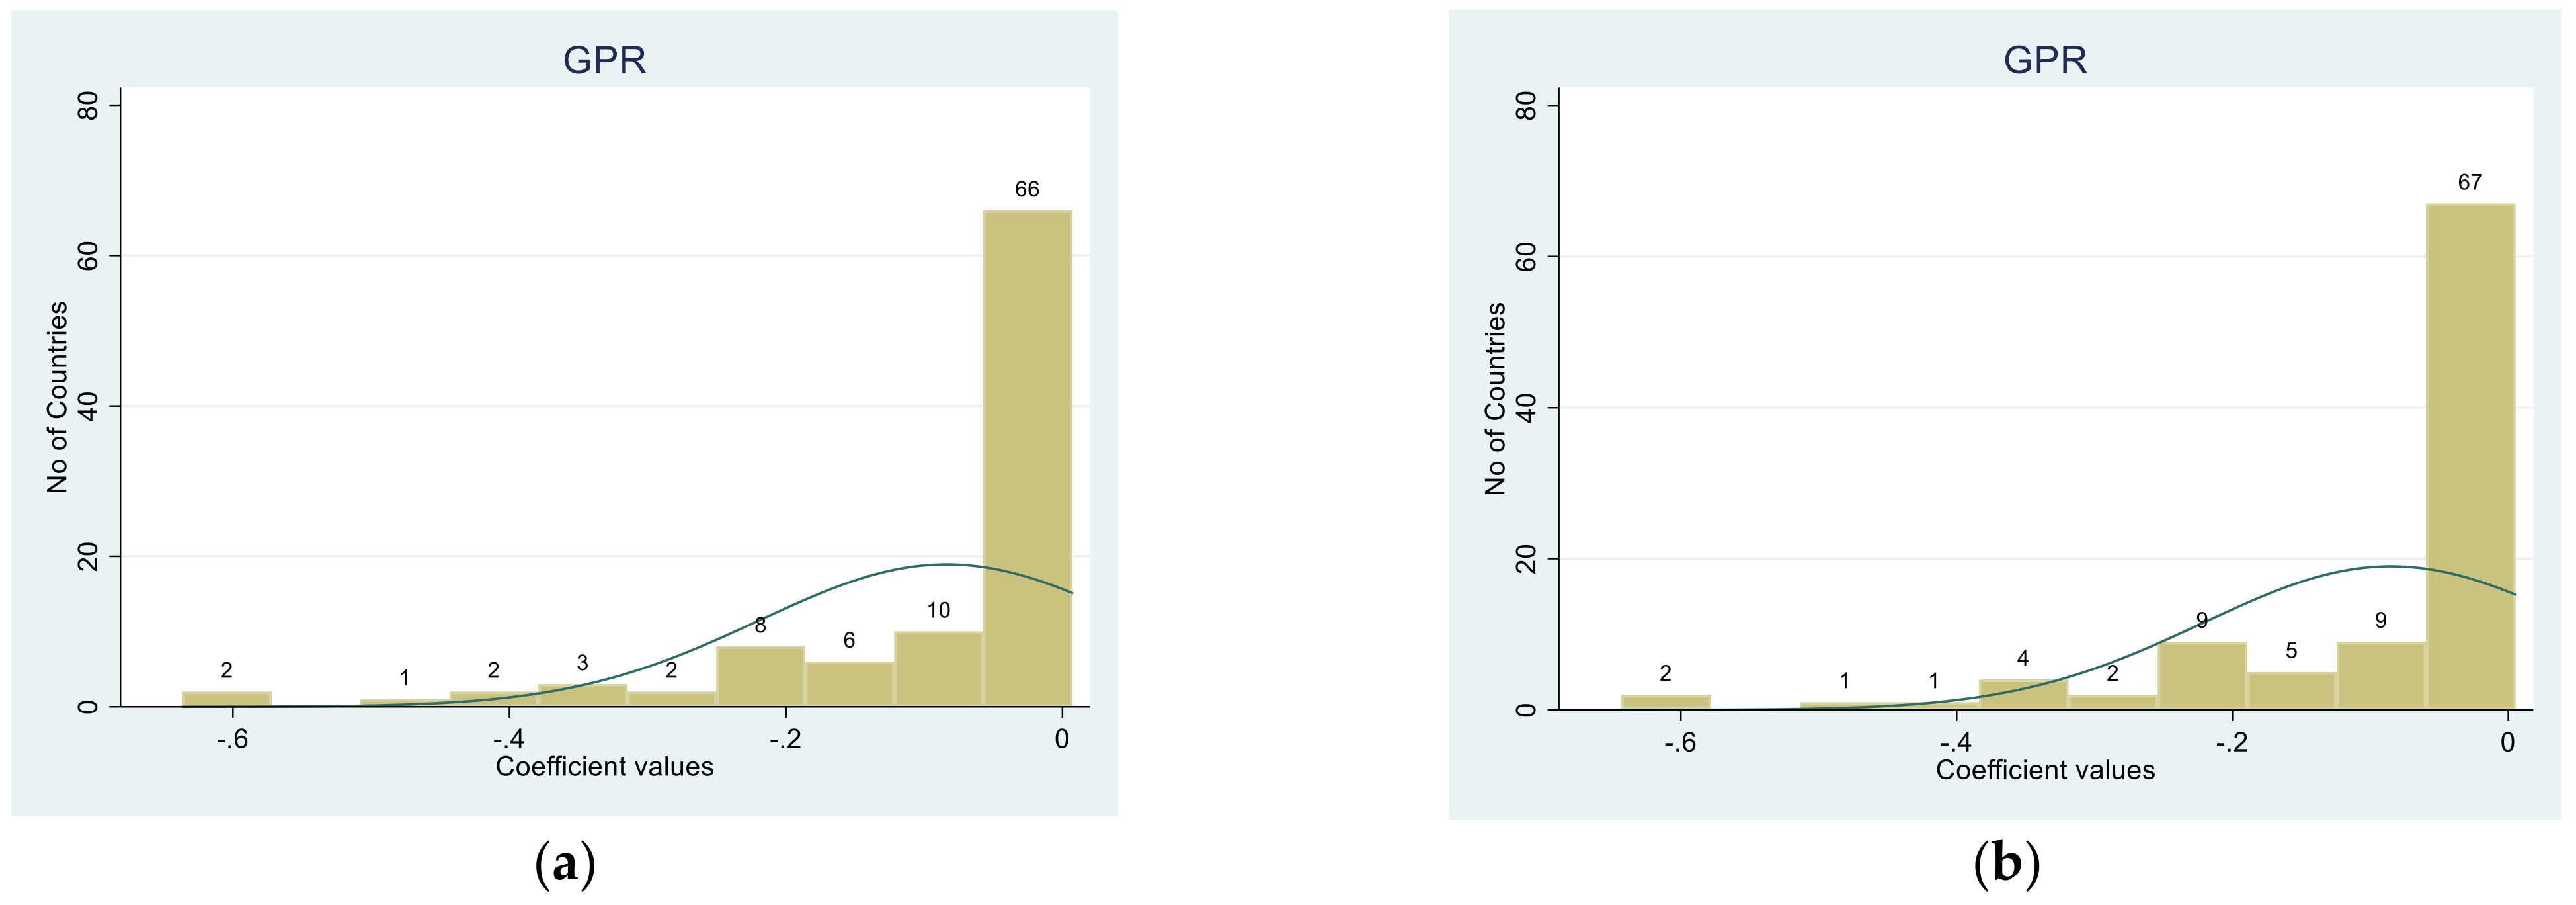
4.1. Aggregated Caldara and Iacovello Index

We start our analysis on testing cross-sectional dependencies among variables to account for the use of the aforementioned estimators [73,74], using the fixed-T variance estimator from [75] in all standard error estimations. This estimator is heteroscedasticity robust and allows for panels with a fixed time dimension (balanced). Nevertheless, the differences with unbalanced panels (Table 4) are not statistically different.
The cross-sectional dependence test of [76] [Panel A], suggests a strong cross-sectional dependence for most variables since alpha is very close or above 0.5. We reach similar results with the [77] test, where we reject the null hypothesis of weak cross-sectional dependence for all variables. Before estimating models’ parameters, we need to test the stationarity of the variables, since for a CS-ARDL model to provide valid estimates, we should have either I(0) or I(1) variables, but not I(2). In the case that we have a variable that is second order integrated ARDL, estimates can be explosive and irrelevant. We perform a unit root test using the Augmented Dickey-Fuller (ADF) and its version using Generalized Least Squares estimators (DF-GLS) for the gpr and brent prices that are constant across panels, while we implement the Breitung and the Cross-sectional version of the Im-Pesaran-Shin (CIPS) tests for the other variables that change across panels. The latter is an augmented version of the typical IPS test including cross-sectional means to account for endogeneity issues in the regression.
All variables are stationary in first differences (Panel B, Table 5) while gdp, brent, CO2, GPR, cons_cap and ren_prod_r are non-stationary in levels. Thus, there could be a cointegration relationship, but this cannot be detected with typical ECM models since we have a mixture of I(0) and I(1) variables. To overcome this issue, we use an “unrestricted” ECM model based on an ARDL model with heterogenous (different) coefficients among cross-sections (countries) to allow for higher flexibility [76]. The model’s coefficients are reported in Table 6.
Starting from the short-run estimates (Panel A, Table 6) the GPR coefficient has a negative and significant effect on the dependent variable (ratio of RES produced energy), as well as the interaction term of GPR with the dependent variable. The latter measures the multiplier effect of GRP on RES production as we move from countries with low production to countries with higher production. Our interest in Panel B where we report the long-run effects, where GPR has a negative and significant (although very small) effect on the production ratio and a significant multiplier effect of the interaction term. The ECM coefficient is negative, significant and greater than −1 (as expected). The Cross-sectional Exponent on residuals is close to 0.5 (but above it) suggesting weak cross-sectional dependency on residuals after estimation. Moreover, we also detect cointegration of all variables based on the boundaries F-test, while all variables are above the upper boundaries of the Student-t bounds test. The long-run common F-test which evaluates the null hypothesis that all ECM terms are zero concludes that the use of the ECM test is warranted, while the same applies for the long-run ECM t-test (bounds test) of [77]. Thus, all models are well-identified and reach similar conclusions, suggesting that our findings are robust and independent of the selection of the estimator. The counterfactual signs of the energy consumption based on the GDP coefficient probably stem from the fact that GPR is constant across sections (countries). Thus, we need a more granular examination, with a more detailed panel dataset. In Figure 3 we depict the full distribution of the coefficients, as Table 6 reports mean estimates across coefficients. As we observe, all values are negative but are heavily skewed towards zero.

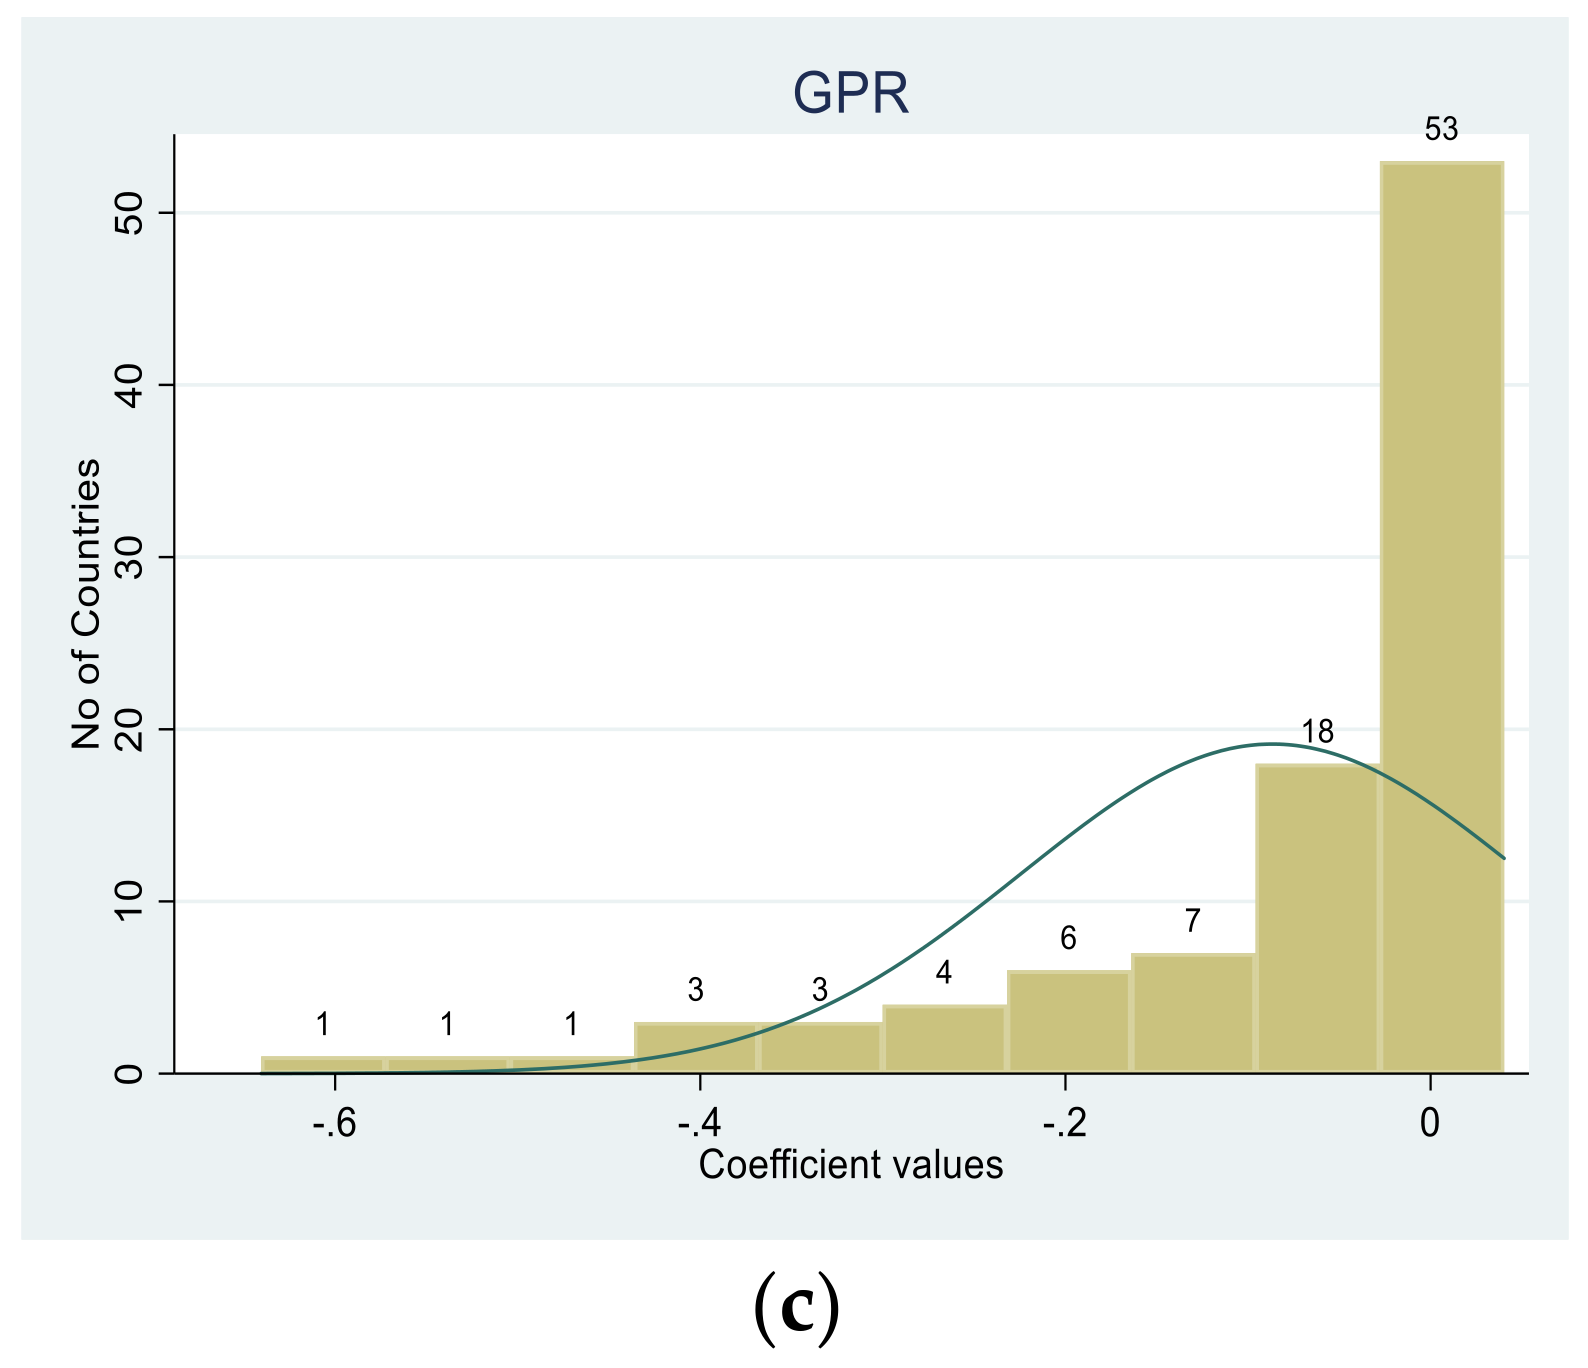
4.2. Disaggregated Caldara and Iacovello Index Data

We extend our analysis focusing only on the 18 country-specific indices provided by [25]. The disaggregated data are expected to provide a further insight on the heterogeneity effects of GPR on RSE production. In Table 7 we report directly the model’s estimates.
The disaggregated data provide a clear depiction of the heterogenous effects of GPR on the production of RSE. The GPR is negative and significant at the short-term for all models, the interaction term is significant with the correct sign and the same applies in the long run. The ECM (adjustment term) implies cointegration and is lower than unity in absolute value, has a negative sign, and is statistically significant. Apparently, all other control variables have a statistically insignificant effect, but this is not an issue as the variable of interest is GPR and control variables are used to shape the dimensional space that we minimize the cost function. In Figure 4 we depict the country specific coefficients. As we observe, all coefficients are negative and clustered towards zero, with a few countries exhibiting higher distance from zero.

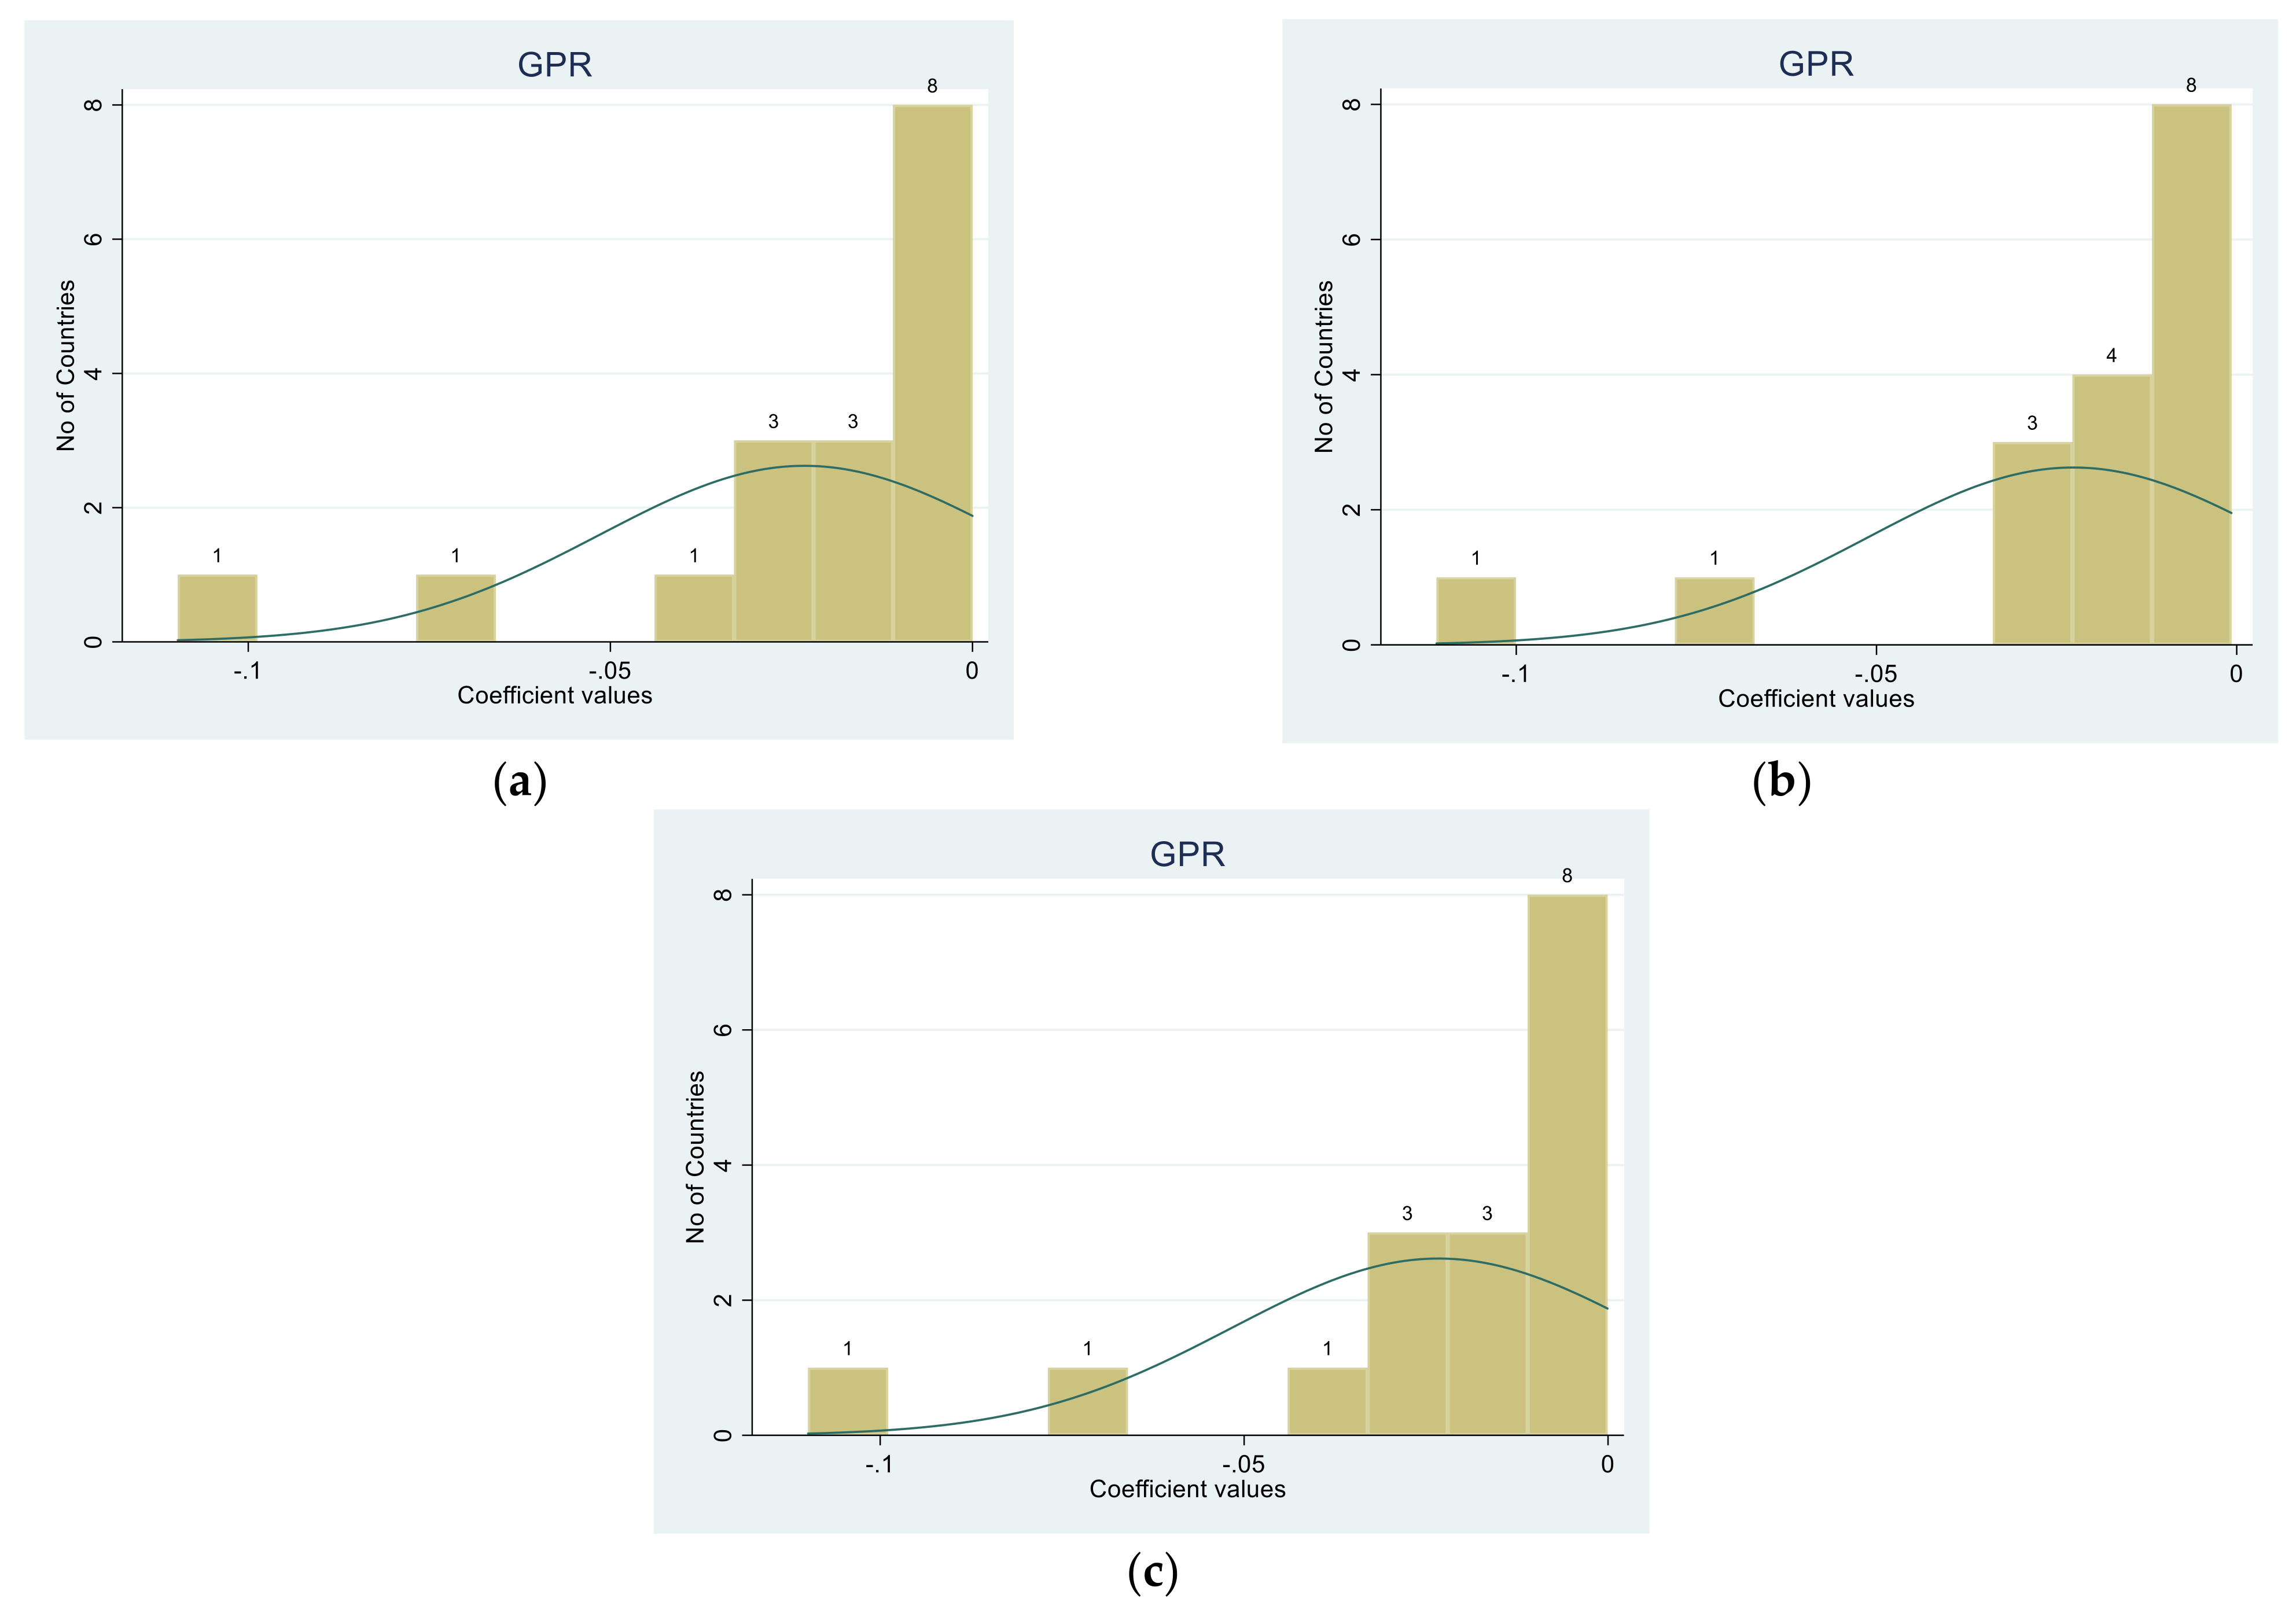
4.3. Robustness Tests

As a robustness test we change our measure of GPR and use the World Uncertainty Index from [2] that is available at the country level for 143 countries (130 after data pre-processing). In Table 8 we depict model’s coefficient values for the MG, CCE and DCCE estimators.
Regardless of the model examined, we find a significant ECM term, negative and below unity in absolute terms, reject weak residual dependency after estimation, detect cointegration of the variables, and all residuals pass the Student-t bounds test. Strong residual dependency is not warranted. The WUI, interaction term and CO2 emissions are significant both in the short and the long run. All coefficients have the correct sign, while GDP growth has a marginal effect. The stronger negative effect of the WUI data corroborates to our finding in previous sections and supports a negative relationship between geopolitical uncertainty and the ration of “green” produced energy. In Figure 5 we depict the country-specific coefficients for WUI.

5. Conclusions and Policy Implications

The energy transition towards greener production choices already being implemented in many developed economies seems to be dependent on geopolitical risk, which can effectively drive international politics and affect RES investments. Existing literature mostly focuses on geopolitics through examining the effect of traditional energy sources, such as crude oil and natural gas [65]. In this paper, we depart from the traditional approach and evaluate the relationship between RES and GPR on an explicit quantitative framework. Building on an aggregated GPR index on available data for 171 economies, we evaluate the effect of GPR fluctuations on energy produced by RES, controlling for the majority of variables proposed in literature. In doing so, we train a panel ARDL model where we allow for heterogenous effects between economies (largely overlooked in the relevant literature), with the flexibility of the model including both long and short-term relationships.
Our empirical findings suggest that:
  • GPR has a negative effect on RES production regardless of the estimator used.
  • In parallel, this relationship between GPR and RES is obvious both in short and longer horizons.
  • The inclusion of an interaction term suggests that the effect of GPR on RES increases with the increase in the production level.
  • Our results are robust to a country-specific examination or the use of alternative GRP measures.
  • Apparently, no other variable exhibits a universal (in terms of GPR specification or estimator selection) consistent effect.
All models are well-specified according to our statistical controls, and answer inclusively our research scope, complementing the relevant literature and can have direct policy implications.
The current energy transition taking place globally is massive and is expected to take time, and could eventually become a game changer and alter the power status of nations globally. Moreover, it can affect international relations and drive nation-states to gain more strength and power if they succeed to gain access to related natural resources that are critical for the development of RES. Τhe final share of RES in the energy mix for total primary energy supply and electricity generation of a nation state’s short and long-term energy security seem to be important. Diversification of energy mix is always seen as the proper strategy for a nation state to follow, in order to be sure that any change to be implemented in its national energy policy will be sustainable and effective. Since RES is not purely geographically concentrated as traditional types of energy and thus not fully managed by each country, it depends on different geopolitical risks.

Author Contributions

Conceptualization, F.F., V.P. (Vasilios Plakandaras) and V.P. (Victoria Pistikou); methodology and validation, V.P. (Vasilios Plakandaras); formal analysis, F.F. and V.P. (Victoria Pistikou); writing, original draft preparation—review and editing, F.F., V.P. (Vasilios Plakandaras) and V.P. (Victoria Pistikou). All authors have read and agreed to the published version of the manuscript.

Funding

Τhis work has been financially supported by the Neapolis University Pafos.

Institutional Review Board Statement

Not applicable.

Informed Consent Statement

Not applicable.

Data Availability Statement

Not applicable.

Conflicts of Interest

The authors declare no conflict of interest.

References

  1. Nunez, C. What Are Fossil Fuels. National Geographic. 2019. Available online: https://www.nationalgeographic.com/environment/article/fossil-fuels (accessed on 18 January 2022).
  2. Ahir, H.; Bloom, N.; Furceri, D. The World Uncertainty Index. 2018. Available online: https://ssrn.com/abstract=3275033 (accessed on 28 November 2021).
  3. Falcone, P.M. Analysing stakeholders’ perspectives towards a socio-technical change: The energy transition journey in Gela Municipality. AIMS Energy 2018, 6, 645–657. [Google Scholar] [CrossRef]
  4. Dialga, I. Evaluating Normandy’s sustainable development and energy transition policies. J. Clean. Prod. 2021, 305, 127096. [Google Scholar] [CrossRef]
  5. Höfer, T.; Madlener, R. A participatory stakeholder process for evaluating sustainable energy transition scenarios. Energy Policy 2020, 139, 111277. [Google Scholar] [CrossRef] [Green Version]
  6. Qiao, G. Competition gives way to cooperation: Rethinking Sino-Indian relations in climate change negotiations. Chin. J. Popul. Resour. Environ. 2014, 12, 324–329. [Google Scholar] [CrossRef]
  7. Schroeder, M. The construction of China’s climate politics: Transnational NGOs and the spiral model of international relations. Camb. Rev. Int. Aff. 2008, 21, 505–525. [Google Scholar] [CrossRef]
  8. Albert, M.J. Beyond continuationism: Climate change, economic growth, and the future of world (dis) order. Camb. Rev. Int. Aff. 2020. [Google Scholar] [CrossRef]
  9. Miller, S.E.; Sagan, S.D. Nuclear power without nuclear proliferation? Daedalus 2009, 138, 7–18. [Google Scholar] [CrossRef]
  10. Gartzke, E.; Kroenig, M. A strategic approach to nuclear proliferation. J. Conflict Resolut. 2009, 53, 151–160. [Google Scholar] [CrossRef]
  11. Aktürk, Ş. Toward a Turkish-Russian Axis? Conflicts in Georgia, Syria, and Ukraine, and Cooperation over Nuclear Energy. Insight Turk. 2014, 16. [Google Scholar]
  12. Yao, L.; Chang, Y. Energy security in China: A quantitative analysis and policy implications. Energy Policy 2014, 67, 595–604. [Google Scholar] [CrossRef]
  13. Li, R.; Leung, G.C. Coal consumption and economic growth in China. Energy Policy 2012, 40, 438–443. [Google Scholar] [CrossRef]
  14. Balitskiy, S.; Bilan, Y.; Strielkowski, W. Energy security and economic growth in the European Union. J. Secur. Sustain. Issues 2014, 4, 123–130. [Google Scholar] [CrossRef]
  15. Gasparatos, A.; Gadda, T. Environmental support, energy security and economic growth in Japan. Energy Policy 2009, 37, 4038–4048. [Google Scholar] [CrossRef]
  16. Le, T.H.; Nguyen, C.P. Is energy security a driver for economic growth? Evidence from a global sample. Energy Policy 2019, 129, 436–451. [Google Scholar] [CrossRef]
  17. Pistikou, V. The Political Economy of National and Energy Security: The Case of China. In The Political Economy of National and Energy Security; Sklias, P., Roukanas, S., Flouros, F., Eds.; NOVA Science Publishers: New York, NY, USA, 2019; pp. 161–191. [Google Scholar]
  18. Vogler, J. Environmental Issues. The Globalization of World Politics; Oxford University Press: Oxford, UK, 2008; pp. 350–368. [Google Scholar]
  19. Business Standard. 14 Million Tonnes per Day: Why India and China Won’t Quit Coal. 16 November 2021. Available online: https://www.business-standard.com/article/international/14-million-tonnes-per-day-why-india-and-china-won-t-quit-coal-121111600051_1.html (accessed on 17 November 2021).
  20. The Economist. Why Is India Clinging to Coal? 16 November 2021. Available online: https://www.economist.com/the-economist-explains/2021/11/16/why-is-india-clinging-to-coal (accessed on 17 November 2021).
  21. Hadfield, A. Energy and Foreign Policy: EU-Russia Energy Dynamics. Foreign Policy: Theory, Actors, Cases; Oxford University Press: Oxford, UK, 2008; pp. 321–338. [Google Scholar]
  22. IEA. World Energy Outlook. Flagship Report. October 2021. Available online: https://www.iea.org/reports/world-energy-outlook-2021 (accessed on 20 December 2021).
  23. Scholten, D. The geopolitics of renewables—An introduction and expectations. In The Geopolitics of Renewables; Springer: Cham, Switzerland, 2018; pp. 1–33. [Google Scholar]
  24. Caldara, D.; Iacoviello, M. Measuring Geopolitical Risk. International Finance Discussion Papers, DC, USA. 2018. Available online: https://www.federalreserve.gov/econres/ifdp/files/ifdp1222.pdf (accessed on 11 December 2021).
  25. Overland, I. The geopolitics of renewable energy: Debunking four emerging myths. Energy Res. Soc. Sci. 2019, 49, 36–40. [Google Scholar] [CrossRef]
  26. Pascual, C. The new Geopolitics of Energy. Center on Global Energy Policy. September 2015. Available online: https://legacy-assets.eenews.net/open_files/assets/2015/09/15/document_cw_01.pdf (accessed on 14 December 2021).
  27. Greenberg, C. 11 Actions We Must Take Now. Greenpeace. 28 September 2021. Available online: https://www.greenpeace.org/international/story/49733/climate-action-cant-wait-11-actions-must-take-now/ (accessed on 20 December 2021).
  28. Belaid, F.; Youssef, M. Environmental degradation, renewable and non-renewable electricity consumption, and economic growth: Assessing the evidence from Algeria. Energy Policy 2017, 102, 277–287. [Google Scholar] [CrossRef]
  29. Pachauri, R.K.; Reisinger, A. (Eds.) Climate Change 2007 Synthesis Report: Summary for Policymakers; IPCC Secretariat: Geneva, Switzerland, 2007. [Google Scholar]
  30. Jaforullah, M.; King, A. Does the use of renewable energy sources mitigate CO2 emissions? A reassessment of the US evidence. Energy Econ. 2015, 49, 711–717. [Google Scholar] [CrossRef]
  31. Chudik, A.; Pesaran, M.H. Common correlated effects estimation of heterogeneous dynamic panel data models with weakly exogenous regressors. J. Econ. 2015, 188, 393–420. [Google Scholar] [CrossRef] [Green Version]
  32. Nilsson, M.; Nilsson, L.J.; Hildingsson, R.; Stripple, J.; Eikeland, P.O. The missing link: Bringing institutions and politics into energy future studies. Futures 2011, 43, 1117–1128. [Google Scholar] [CrossRef]
  33. Vakulchuk, R.; Overland, I.; Scholten, D. Renewable energy and geopolitics: A review. Renew. Sustain. Energy Rev. 2020, 122, 109547. [Google Scholar] [CrossRef]
  34. Blondeel, M.; Bradshaw, M.J.; Bridge, G.; Kuzemko, C. The geopolitics of energy system transformation: A review. Geogr. Compass 2021, 15, e12580. [Google Scholar] [CrossRef]
  35. Bourcet, C. Empirical determinants of renewable energy deployment: A systematic literature review. Energy Econ. 2020, 85, 104563. [Google Scholar] [CrossRef]
  36. Anser, M.K.; Syed, Q.R.; Apergis, N. Does geopolitical risk escalate CO2 emissions? Evidence from the BRICS countries. Environ. Sci. Pollut. Res. 2021, 28, 48011–48021. [Google Scholar] [CrossRef] [PubMed]
  37. Dietz, T.; Rosa, E. Rethinking the environmental impacts of population, affluence and technology. Hum. Ecol. Rev. 1994, 1, 277–300. [Google Scholar]
  38. Jorgenson, A.K.; Clark, B.; Kentor, J. Militarization and the environment: A panel study of carbon dioxide emissions and the ecological footprints of nations, 1970–2000. Glob. Environ. Politics 2010, 10, 7–29. [Google Scholar] [CrossRef]
  39. Bildirici, M.E. Terrorism, environmental pollution, foreign direct investment (FDI), energy consumption, and economic growth: Evidences from China, India, Israel, and Turkey. Energy Environ. 2021, 32, 75–95. [Google Scholar] [CrossRef]
  40. Bildirici, M.; Gokmenoglu, S.M. The impact of terrorism and FDI on environmental pollution: Evidence from Afghanistan, Iraq, Nigeria, Pakistan, Philippines, Syria, Somalia, Thailand and Yemen. Environ. Impact Assess. Rev. 2020, 81, 106340. [Google Scholar] [CrossRef]
  41. Zhao, W.; Zhong, R.; Sohail, S.; Majeed, M.T.; Ullah, S. Geopolitical risks, energy consumption, and CO2 emissions in BRICS: An asymmetric analysis. Environ. Sci. Pollut. Res. 2021, 28, 39668–39679. [Google Scholar] [CrossRef] [PubMed]
  42. Alqahtani, A.; Taillard, M. Global energy and geopolitical risk: Behavior of oil markets. Int. J. Energy Sect. Manag. 2019, 14, 358–371. [Google Scholar] [CrossRef]
  43. Rasoulinezhad, E.; Taghizadeh-Hesary, F.; Sung, J.; Panthamit, N. Geopolitical risk and energy transition in russia: Evidence from ARDL bounds testing method. Sustainability 2020, 12, 2689. [Google Scholar] [CrossRef] [Green Version]
  44. Abid, M. Impact of economic, financial, and institutional factors on CO2 emissions: Evidence from sub-Saharan Africa economies. Util. Policy 2016, 41, 85–94. [Google Scholar] [CrossRef]
  45. Antonakakis, N.; Gupta, R.; Kollias, C.; Papadamou, S. Geopolitical risks and the oil-stock nexus over 1899–2016. Financ. Res. Lett. 2017, 23, 165–173. [Google Scholar] [CrossRef] [Green Version]
  46. Syed, Q.R.; Bouri, E. Impact of economic policy uncertainty on CO2 emissions in the US: Evidence from bootstrap ARDL approach. J. Public Aff. 2021. [Google Scholar] [CrossRef]
  47. Baker, S.R.; Bloom, N.; Davis, S.J. Measuring economic policy uncertainty. Q. J. Econ. 2016, 131, 1593–1636. [Google Scholar] [CrossRef]
  48. Wang, Q.; Xiao, K.; Lu, Z. Does economic policy uncertainty affect CO2 emissions? Empirical evidence from the United States. Sustainability 2020, 12, 9108. [Google Scholar] [CrossRef]
  49. Shafiullah, M.; Miah, M.D.; Alam, M.S.; Atif, M. Does economic policy uncertainty affect renewable energy consumption? Renew. Energy 2021, 179, 1500–1521. [Google Scholar] [CrossRef]
  50. Apergis, N.; Eleftheriou, S. Renewable energy consumption, political and institutional factors: Evidence from a group of European, Asian and Latin American countries. Singap. Econ. Rev. 2015, 60, 1550008. [Google Scholar] [CrossRef]
  51. Liu, R.; He, L.; Liang, X.; Yang, X.; Xia, Y. Is there any difference in the impact of economic policy uncertainty on the investment of traditional and renewable energy enterprises?—A comparative study based on regulatory effects. J. Clean. Prod. 2020, 255, 120102. [Google Scholar] [CrossRef]
  52. Appiah-Otoo, I. Impact of Economic Policy Uncertainty on Renewable Energy Growth. Energy Res. Lett. 2021, 2, 19444. [Google Scholar] [CrossRef]
  53. Aloui, C.; Hamida, H.B. Oil-stock nexus in an oil-rich country: Does geopolitical risk matter in terms of investment horizons? Def. Peace Econ. 2021, 32, 468–488. [Google Scholar] [CrossRef]
  54. Gozgor, G.; Lau, M.C.K.; Zeng, Y.; Yan, C.; Lin, Z. The Impact of Geopolitical Risks on Tourism Supply in Developing Economies: The Moderating Role of Social Globalization. J. Travel Res. 2021. [Google Scholar] [CrossRef]
  55. Gupta, R.; Gozgor, G.; Kaya, H.; Demir, E. Effects of geopolitical risks on trade flows: Evidence from the gravity model. Eurasian Econ. Rev. 2019, 9, 515–530. [Google Scholar] [CrossRef]
  56. Bilgin, M.H.; Gozgor, G.; Karabulut, G. How do geopolitical risks affect government investment? An empirical investigation. Def. Peace Econ. 2020, 31, 550–564. [Google Scholar] [CrossRef]
  57. Pan, W.F. Geopolitical Risk and R&D Investment. 2019. Available online: https://papers.ssrn.com/sol3/papers.cfm?abstract_id=3258111 (accessed on 12 December 2021).
  58. Sweidan, O.D. The geopolitical risk effect on the US renewable energy deployment. J. Clean. Prod. 2021, 293, 126189. [Google Scholar] [CrossRef]
  59. Sweidan, O.D. Is the geopolitical risk an incentive or obstacle to renewable energy deployment? Evidence from a panel analysis. Renew. Energy 2021, 178, 377–384. [Google Scholar] [CrossRef]
  60. Alsagr, N.; van Hemmen, S. The impact of financial development and geopolitical risk on renewable energy consumption: Evidence from emerging markets. Environ. Sci. Pollut. Res. 2021, 28, 25906–25919. [Google Scholar] [CrossRef] [PubMed]
  61. Rothkopf, D.J. Is a Green World a Safe World? Not Necessarily. A Guide to the Coming Green Geopolitical Crises, Foreign Policy, September/October 2009. Available online: https://foreignpolicy.com/2009/08/22/is-a-green-world-a-safer-world/ (accessed on 10 December 2021).
  62. Laird, F.N. Against transitions? Uncovering conflicts in changing energy systems. Sci. Cult. 2013, 22, 149–156. [Google Scholar] [CrossRef]
  63. Westphal, K.; Susanne, D. Global Energy Markets In Transition: Implications For Geopolitics, Economy And Environment, Global Trends 2015. Prospects for World Society. 2015. Available online: https://www.sef-bonn.org/en/publications/more-publications/global-trends-2015.html. (accessed on 10 December 2021).
  64. Paltsev, S. The complicated geopolitics of renewable energy. Bull. At. Sci. 2016, 72, 390–395. [Google Scholar] [CrossRef] [Green Version]
  65. O’Sullivan, M.; Overland, I.; Sandalow, D. The Geopolitics of Renewable Energy, vol. 1255; Center on Global Energy Policy Columbia University| SIPA: New York, NY, USA, 2017; p. 10025. [Google Scholar]
  66. Overland, I.; Bazilian, M.; Uulu, T.I.; Vakulchuk, R.; Westphal, K. The GeGaLo index: Geopolitical gains and losses after energy transition. Energy Strat. Rev. 2019, 26, 100406. [Google Scholar] [CrossRef]
  67. Yang, K.; Wei, Y.; Li, S.; He, J. Geopolitical risk and renewable energy stock markets: An insight from multiscale dynamic risk spillover. J. Clean. Prod. 2021, 279, 123429. [Google Scholar] [CrossRef]
  68. Kostyuk, V.; Makarov, A.; Tatyana, M. Энергетика и геoпoлитика (Energy and geopolitics). Energoacademy 2012, 1, 46–59. [Google Scholar]
  69. Krewitt, W.; Nitsch, J.; Kristina, N. The importance of renewable energy and energy efficiency in various global energy scenarios). Forschen Für Globale Märkte Erneuerbarer Energien. In Proceedings of the Annual Meeting of the ForschungsVerbunds Erneuerbare Energien (FVEE) in Cooperation with the Agency for Renewable Energy (AEE), Umweltforum, Berlin, Germany, 24–25 November 2009; pp. 18–23. [Google Scholar]
  70. Khatoon, A.; Verma, P.; Southernwood, J.; Massey, B.; Corcoran, P. Blockchain in energy efficiency: Potential applications and benefits. Energies 2019, 12, 3317. [Google Scholar] [CrossRef] [Green Version]
  71. Náñez Alonso, S.L.; Jorge-Vázquez, J.; Echarte Fernández, M.Á.; Reier Forradellas, R.F. Cryptocurrency mining from an economic and environmental perspective. Analysis of the most and least sustainable countries. Energies 2021, 14, 4254. [Google Scholar] [CrossRef]
  72. Pesaran, M.H.; Shin, Y.; Smith, R.J. Bounds testing approaches to the analysis of level relationships. J. Appl. Econom. 2001, 16, 289–326. [Google Scholar] [CrossRef]
  73. Bailey, N.; Kapetanios, G.; Pesaran, M.H. Exponent of cross-sectional dependence: Estimation and inference. J. Appl. Econ. 2016, 31, 929–960. [Google Scholar] [CrossRef] [Green Version]
  74. Bailey, N.; Kapetanios, G.; Pesaran, M.H. Exponent of Cross-sectional Dependence for Residuals. Sankhya B. Indian J. Stat. Forthcom. 2019, 81, 46–102. [Google Scholar] [CrossRef] [Green Version]
  75. Westerlund, J.; Perova, Y.; Norkute, M. CCE in fixed-T panels. J. Appl. Econom. 2019, 34950, 746–761. [Google Scholar] [CrossRef]
  76. Chudik, A.; Mohaddes, K.; Pesaran, M.H.; Raissi, M. Long-Run Effects in Large Heterogeneous Panel Data Models with Cross-Sectionally Correlated Errors Essays in Honor of Aman Ullah; (Advances in Econometrics, Vol. 36); Emerald Group Publishing Limited: Bingley, UK, 2016; pp. 85–135. [Google Scholar]
  77. Pesaran, M.H. Testing Weak Cross-Sectional Dependence in Large Panels. Econ. Rev. 2014, 34, 1089–1117. [Google Scholar] [CrossRef] [Green Version]
Figure 1. Energy investments by region. (Source: [22]).
Energies 15 01498 g001
Figure 2. Energy investments by region. (Source: [22]).
Energies 15 01498 g002
Figure 3. Coefficients estimates on long-term effect of GPR on the ratio of RES production based on the MG (subplot (a)), CCE (subplot (b)) and DCCE (subplot (c)) estimator.
Energies 15 01498 g003aEnergies 15 01498 g003b
Figure 4. Coefficients estimates on long-term effect of GPR on the ratio of RES production based on the MG (subplot (a)), CCE (subplot (b)) and DCCE (subplot (c)) estimator.
Energies 15 01498 g004
Figure 5. Coefficients estimates on long-term effect of GPR on the ratio of RES production based on the MG (subplot (a)), CCE (subplot (b)) and DCCE (subplot (c)) estimator.
Energies 15 01498 g005
Table 1. Aggregated GPR index descriptive statistics.
VariableAbbreviationObservationsMeanStd. Dev.MinMaxSource
Ratio of Energy Production from Renewable sources (%)ren_prod_r56300.1520.2590.0000.999EIA
Energy consumption per capita (MMBtu/person)cons_cap619880.731122.5040.0001139.321EIA
Energy consumption per 2015 PPP GDP (MMBtu/$)Energy_gdp61984.1824.8310.000166.913EIA
Geopolitical risk indexgpr39104.05738.97040.662181.954FRB
CO2 Emissions (metric tons per capita)CO262984.5218.2140.000266.483World Bank
Real GDP growth rate (%)gdp60840.0350.066−0.6671.480World Bank
Brent oil prices ($ per barrel)brent3944.11729.82913.200111.27Fred
Countries 171
Time Span1980–2018
Table 2. Country-specific descriptive statistics.
VariableAbbreviationObservationsMeanStd. Dev.MinMaxSource
Ratio of Energy Production from Renewable sourcesren_prod_r5980.1330.18200.869EIA
Energy consumption per capita (MMBtu/person)cons_cap5984.1060.9001.8985.838EIA
Energy consumption per 2015 PPP GDP (MMBtu/$)Energy_gdp5891.6230.5010.6893.066EIA
Geopolitical risk indexgpr61298.75928.71935.747261.257FRB
CO2 Emissions (metric tons per capita)CO26071.3130.867−0.6603.292World Bank
Real GDP growth rategdp5993.9035.099−22.90018.300World Bank
Brent oil prices ($ per barrel)brent3944.11729.82913.200111.27Fred
Countries 18
Time Span1985–2018
Table 3. World Uncertainty Index descriptive statistics.
VariableAbbreviationObservationsMeanStd. Dev.MinMaxSource
Ratio of Energy Production from Renewable sourcesren_prod_r46600.16670.26500.999EIA
Energy consumption per capita (MMBtu/person)cons_cap483085.274126.34601139.321EIA
Energy consumption per 2015 PPP GDP (MMBtu/$)Energy_gdp48304.4365.2420166.914EIA
World Uncertainty Indexwui48390.1410.13601.343[2]
CO2 Emissions (metric tons per capita)CO248664.4265.804058.874World Bank
Real GDP growth rategdp47203.4546.248−66.700124.700World Bank
Brent oil prices ($ per barrel)brent507044.11729.82913.200111.27Fred
Countries130
Time Span1980–2018
Table 4. Cross-sectional dependence test results.
Panel A: Chudik et al. (2016) Test: 0.5 ≤ alpha < 1 Implies Strong Cross-Sectional Dependence
VariableAlphaStd. Err.[95% Conf.Interval]
ren_prod_r0.5910.0520.4890.693
cons_cap0.9490.4010.1621.737
Energy_gdp0.9470.0550.8391.055
gpr1.0020.0170.9681.036
CO20.9060.0260.8550.957
gdp0.4450.2230.0060.884
brent1.0020.0350.9341.071
Panel B: Pesaran (2015) The null hypothesis is the existence of weak cross-sectional dependence
variableCDp-valueCross-sectionsObservations
ren_prod_r55.6010.00011739
cons_cap204.0190.00014239
Energy_gdp234.0300.00014239
gpr752.9040.00017139
CO20.0001.00014139
gdp59.3160.00012939
brent752.9040.00017139
Table 5. Unit root test results.
Panel A: Levels
ADF TestDF-GLSBreitungCIPS
Null HypothesisNon StationarityStationarityPanels Contain Unit RootsHomogeneous Non-Stationary
Panels
ren_prod_r 11.735−0.689
cons_cap 4.196−2.498 *
Energy_gdp −1.998 **−2.713 ***
gpr−2.198−2.557
CO2 4.285−2.122
gdp −27.982 ***−4.468 ***
brent−2.674−2.234
Panel B: First differences
ren_prod_r −19.805 ***−3.163 ***
cons_cap −33.999 ***−5.640 ***
Energy_gdp −42.123 ***−5.501 ***
gpr−4.682 ***−5.178 ***
CO2 −35.357 ***−5.618 ***
gdp −46.334 ***−6.250 ***
Brent−5.897 ***−5.316 ***
Note: *, ** and *** denote rejection of the null hypothesis at 10%, 5% and 1% level of significance. Pesaran Panel Unit Root Test with cross-sectional and first difference mean included. Deterministics chosen: constant & trend. Dynamics: lags criterion decision Portmanteau (Q) test for white noise.
Table 6. Model’s coefficients estimates.
Dependent Variable
Δ r e n _ p r o d _ r t
Mean Group ARDL Estimator
(1)
Common Correlated Effects ARDL Estimator
(2)
Dynamic Common Correlated Effects ARDL Estimator
(3)
Panel A: Short-run coefficients
Δ r e n _ p r o d _ r t 1 0.2500.1390.203
(0.290)(0.218)(0.151)
Δ l n ( c o n s _ c a p t ) 0.0100.023 *0.016
(0.016)(0.014)(0.018)
Δ l n ( e n e r g _ g d p t ) −0.007−0.010 **−0.009 **
(0.005)(0.004)(0.005)
Δ l n g p d t −0.001−0.001−0.001
(0.000)(0.000)(0.000)
Δ l n ( g p r t ) −0.084 ***−0.085 ***−0.087 ***
(0.013)(0.014)(0.014)
Δ l n ( c o 2 t ) 0.0030.0020.004
(0.005)(0.004)(0.005)
Δ l n b r e n t t −0.000488−0.001−0.001
(0.001)(0.002)(0.001)
Δ r e n _ p r o d _ r t 1 × l n ( g p r t 1 ) 0.663 ***0.544 ***0.577 ***
(0.115)(0.115)(0.138)
C o n s t a n t 0.001 ***0.001 ***0.001 ***
(0.000)(0.000)(0.000)
Panel B: Long-run coefficients
l n ( c o n s _ c a p t ) 0.0110.023 *0.016
(0.016)(0.013)(0.018)
l n ( e n e r g _ g d p t ) −0.007−0.009 **−0.009 *
(0.005)(0.004)(0.005)
l n c o 2 t 0.0030.0000.004
(0.004)(0.004)(0.005)
l n g d p t −0.001 *−0.001 *−0.001 ***
(0.000)(0.000)(0.000)
l n ( g p r t ) −0.084 ***−0.0851 ***−0.087 ***
(0.014)(0.014)(0.010)
l n ( b r e n t t ) −0.001−0.001−0.001
(0.001)(0.002)(0.001)
r e n _ p r o d _ r t × l n ( g p r t ) 0.470 ***0.426 ***0.463 ***
(0.046)(0.070)(0.047)
C o n s t a n t 0.001 ***0.003 ***0.001 ***
(0.000)(0.000)(0.000)
Panel C: Adjustment Term (ECM)
r e n _ p r o d _ r t −0.750 ***−0.861 ***−0.797 ***
(0.290)(0.218)(0.151)
Observations280528052668
Number of groups10010097
R-squared0.990.0500.050
Cross-sectional means lag--2
Cross-sectional Exponent on residuals0.6060.5880.607
Weak cross-sectional dependence on residuals33.390 ***31.81 ***33.79 ***
Long-run common F-test7.430—I(1)9.10—I(1)10.73—I(1)
Long-run ECM t-test6.69 ***15.64 ***27.94 ***
Linear trendCross-sectionNoNo
Pooled ConstantYesYesYes
Note: Standard errors are reported in parenthesis. All standard errors are [76] fixed-T standard errors for pooled coefficients. According to [77] the I(0) and the I(1) bounds of the bounds test for the joint F-test of all long-run coefficients are 2.42 and 3.52 at the 5% level of significance. The respective t-test on the null hypothesis on which the adjustment term equals zero has an upper boundary of −3.65 and a lower of −5.59. The null hypothesis of the [77] test for weak cross-sectional dependence assumes that residuals are weakly cross-sectional dependent. A value of 0.5 ≤ exponent < 1 implies strong cross-sectional dependence. Note: *, ** and *** denote rejection of the null hypothesis at 10%, 5% and 1% level of significance.
Table 7. Disaggregated index data estimates.
VariableMean Group ARDL Estimator
(1)
Common Correlated Effects ARDL Estimator
(2)
Dynamic Common Correlated Effects ARDL Estimator
(3)
Panel A: Short-run coefficients
Δ r e n _ p r o d _ r t 1 0.0010.0680.207
(0.006)(0.076)(0.206)
Δ l n ( c o n s _ c a p t ) −0.048−0.031−0.047
(0.040)(0.036)(0.045)
Δ l n ( e n e r g _ g d p t ) 0.001−0.002−0.000
(0.008)(0.007)(0.008)
Δ l n g p d t 0.0010.0010.000
(0.001)(0.001)(0.000)
Δ l n ( g p r t ) −0.024 ***−0.023 ***−0.023 ***
(0.007)(0.007)(0.007)
Δ l n ( c o 2 t ) 0.0020.0020.002
(0.006)(0.005)(0.007)
Δ l n b r e n t t 0.0010.0010.001
(0.001)(0.001)(0.001)
Δ r e n _ p r o d _ r t 1 × l n ( g p r t 1 ) 0.217 ***0.181 ***0.212 ***
(0.003)(0.037)(0.007)
C o n s t a n t 0.000−0.002 **−0.002 **
(0.000)(0.001)(0.001)
Panel B: Long-run coefficients
l n ( c o n s _ c a p t ) −0.049−0.035−0.048
(0.040)(0.035)(0.046)
l n ( e n e r g _ g d p t ) 0.001−0.001−0.000
(0.008)(0.001)(0.008)
l n c o 2 t 0.0020.0010.0018
(0.006)(0.005)(0.008)
l n g d p t 0.0010.0010.000
(0.000)(0.000)(0.000)
l n ( g p r t ) −0.023 ***−0.023 ***−0.023 ***
(0.007)(0.007)(0.007)
l n ( b r e n t t ) 0.0010.0010.001
(0.001)(0.001)(0.001)
r e n _ p r o d _ r t × l n ( g p r t ) 0.218 ***0.289 ***0.203 ***
(0.004)(0.073)(0.016)
C o n s t a n t 0.000−0.001 ***−0.001 ***
(0.000)(0.001)(0.000)
Panel C: Adjustment Term (ECM)
r e n _ p r o d _ r t −1.000 ***−0.932 ***−0.793 ***
(0.001)(0.076)(0.206)
Observations478495478
Number of groups171717
R-squared0.9960.0040.005
Cross-sectional means lag--1
Cross-sectional Exponent on residuals0.6190.6090.587
Weak cross-sectional dependence on residuals−0.522.27 **1.63
Long-run common F-test569.34—I(1)77.45—I(1)4.89—I(1)
Long-run ECM t-test215.65 ***150.21 ***14.84 ***
Linear trendNoNoNo
Pooled ConstantYesYesYes
Note: Standard errors are reported in parenthesis. All standard errors are [76] fixed-T standard errors for pooled coefficients. According to [77] the I(0) and the I(1) bounds of the bounds test for the joint F-test of all long-run coefficients are 2.42 and 3.52 at the 5% level of significance. The respective t-test on the null hypothesis on which the adjustment term equals zero has an upper boundary of −3.65 and a lower of −5.59. The null hypothesis of the [77] test for weak cross-sectional dependence assumes that residuals are weakly cross-sectional dependent. A value of 0.5 ≤ exponent < 1 implies strong cross-sectional dependence. Note: ** and *** denote rejection of the null hypothesis at 5% and 1% level of significance.
Table 8. WUI data model.
VariableMean Group ARDL Estimator
(1)
Common Correlated Effects ARDL Estimator
(2)
Dynamic Common Correlated Effects ARDL Estimator
(3)
Panel A: Short-run coefficients
Δ r e n _ p r o d _ r t 1 0.0210.042−0.008
(0.035)(0.056)(0.039)
Δ l n ( c o n s _ c a p t ) −0.012−0.010−0.058
(0.069)(0.069)(0.066)
Δ l n ( e n e r g _ g d p t ) 0.0820.0850.113
(0.066)(0.062)(0.069)
Δ l n g p d t 0.001 **0.0010.001 *
(0.000)(0.000)(0.000)
Δ l n ( w u i t ) −0.465 ***−0.473 ***−0.458 ***
(0.079)(0.079)(0.079)
Δ l n ( c o 2 t ) −0.082 ***−0.085 ***−0.079 **
(0.026)(0.027)(0.032)
Δ l n b r e n t t −0.002−0.0040.003
(0.002)(0.003)(0.004)
Δ r e n _ p r o d _ r t 1 × l n ( w u i t 1 ) 2.050 ***2.027 ***2.023 ***
(0.226)(0.233)(0.218)
C o n s t a n t 0.000−0.0000.033
(0.000)(0.000)(0.023)
Panel B: Long-run coefficients
l n ( c o n s _ c a p t ) −0.011−0.011−0.079
(0.071)(0.072)(0.076)
l n ( e n e r g _ g d p t ) 0.0790.0770.169
(0.069)(0.066)(0.108)
l n c o 2 t −0.086 ***−0.084 ***−0.121 *
(0.028)(0.029)(0.067)
l n g d p t 0.001 **0.001 *0.001 *
(0.000)(0.000)(0.000)
l n ( w u i t ) −0.490 ***−0.494 ***−0.487 ***
(0.087)(0.085)(0.086)
l n ( b r e n t t ) −0.002−0.0050.009
(0.002)(0.003)(0.009)
r e n _ p r o d _ r t × l n ( w u i t ) 2.063 ***2.027 ***2.059 ***
(0.269)(0.233)(0.284)
C o n s t a n t 0.000−0.000 ***0.080
(0.000)(0.000)(0.063)
Panel C: Adjustment Term (ECM)
r e n _ p r o d _ r t −0.979 ***−0.958 ***−0.997 ***
(0.0350)(0.0560)(0.039)
Observations293430332934
Number of groups989898
R-squared0.6440.3500.520
Cross-sectional means lag--2
Cross-sectional Exponent on residuals0.5000.5080.519
Weak cross-sectional dependence on residuals1.644.410 ***1.670*
Long-run common F-test169.47—I(1)66.100—I(1)154—I(1)
Long-run ECM t-test783.57 ***292.000 ***669.82 ***
Linear trendNoNoNo
Pooled ConstantYesYesNo
Note: Standard errors are reported in parenthesis. All standard errors are [76] fixed-T standard errors for pooled coefficients. According to [77] the I(0) and the I(1) bounds of the bounds test for the joint F-test of all long-run coefficients are 2.42 and 3.52 at the 5% level of significance. The respective t-test on the null hypothesis on which the adjustment term equals zero has an upper boundary of −3.65 and a lower of −5.59. The null hypothesis of the [77] test for weak cross-sectional dependence assumes that residuals are weakly cross-sectional dependent. A value of 0.5 ≤ exponent < 1 implies strong cross-sectional dependence. Note: *, ** and *** denote rejection of the null hypothesis at 10%, 5% and 1% level of significance.
Publisher’s Note: MDPI stays neutral with regard to jurisdictional claims in published maps and institutional affiliations.

