Article

Design and Optimization of a Novel Microchannel Battery Thermal Management System Based on Digital Twin

1
State Key Laboratory for Manufacturing Systems Engineering, Xi’an Jiaotong University, Xi’an 710049, China
2
Shaanxi Key Laboratory of Intelligent Robots, School of Mechanical Engineering, Xi’an Jiaotong University, Xi’an 710049, China
*
Author to whom correspondence should be addressed.
These authors contributed equally to this work.
Energies 2022, 15(4), 1421; https://doi.org/10.3390/en15041421
Submission received: 3 January 2022 / Revised: 6 February 2022 / Accepted: 14 February 2022 / Published: 15 February 2022

Abstract

:
In order to avoid high-temperature and large rate discharge impact on the performance of battery modules, a microchannel liquid cooling battery thermal management system (BTMS) and BTMS virtual model of the microchannel structure based on digital twin (DT) is proposed. On the basis of accurate virtual simulation model, the computational fluid dynamics (CFD) model and the Gaussian process regression algorithm were combined to drive the optimization process in order to improve the cooling capacity of the system. The results show that the microchannel plates can greatly enhance the cooling capacity of the direct cooling system and effectively improve the uniformity of the coolant. The width of the microchannel plates and the side spacing actually represent the amount of coolant flowing through the inside and outside of the battery module, which significantly impacts the maximum temperature and maximum temperature difference. Increasing the coolant flow can only effectively improve the cooling capacity of the module to a limited extent. Gaussian process regression based on the DT virtual model is more suitable for analyzing the interaction between multiple factors and obtaining global optimization results. After optimization, the maximum temperature and the maximum temperature difference of the system are reduced by 4.02 °C and 5.05 °C, respectively. The proposed structure and method are expected to provide insights into the design and development of battery thermal management systems.

Graphical Abstract

1. Introduction

In recent years, batteries have played an important role in promoting and developing new energy applications such as electric vehicles and mobile robots [1,2,3]. Lithium-ion batteries (LIBs) are widely used for their high energy density, long cycle life, and no memory effect [4,5]. Compared with other power cells, such as lead-acid batteries, LIBs with an optimal operating temperature range of 25–35 °C are more sensitive to temperature [6,7]. The high temperature generated (larger than 50 °C for example) during work can easily degrade cell performance and even lead to thermal runaway. The battery thermal management system (BTMS) is able to control the temperature of battery module within a proper range and reduce the temperature gradient inside the battery module as much as possible [6]. The question concerning how to design a battery thermal management system with high efficiency and high energy density has become a key issue for the development of these fields.
There are several cooling methods of BTMS, such as air cooling, phase change material cooling, heat pipe cooling, liquid cooling, etc. [8,9]. Air cooling has the advantages of simple structure and easy implementation. In the early BTMS, the battery module layouts, the design and optimization of air duct structure, and flow direction were studied by researchers [10,11,12]. In addition, some flow resistance models are proposed to calculate the air flow rate and temperature distribution [13,14,15]. Although the air cooling method has been designed and developed, it still has disadvantages such as poor cooling capacity and low environmental adaptability [16].
The phase change material (PCM) relies on its latent heat and phase change heat absorption for cooling, which has a simple structure and good temperature uniformity [17]. Many researchers add paraffin, metal fins, expanded graphite, nanoparticles, or nanofluid to phase change materials to improve thermal conductivity for better cooling capacity [18,19,20]. However, it is limited by low thermal conductivity, instability at high temperatures, and material leakage. As an efficient heat transfer component, the heat pipe has been actively investigated due to its simple structure, high thermal conductivity, safety, and reliability [21,22,23]. Many researchers also combined heat pipes with air cooling, liquid cooling, and PCM cooling to form a composite battery thermal management system with the heat pipe. Thus, the thermal management capability is further improved [24,25]. However, due to structural constraints, the application of heat pipes in battery thermal management systems is not yet mature.
For liquid cooling, the cooling media can be water, mineral oil, ethylene glycol, etc. [26]. In the early stage of liquid cooling application, research focused on designing different cooling channels. Jarrett et al. designed the serpentine cooling channel plate, numerically optimized the channel width and position as the optimization parameters, and obtained the optimal structural size of the internal channel of the serpentine cooling plate [27,28]. Later, researchers found that the micro-channels can produce a better heat exchange effect in the liquid cooling mode, so they launched the design and optimization of the micro-channels in a cold plate. Wang et al. designed a cylindrical battery modular structure, explored the effects of series and parallel cooling fluid channels, and found that parallel channels have a better cooling capacity and temperature consistency [29]. In addition, some researchers have replaced the cooling medium with materials with higher thermal conductivity for research. Liu et al. used different coolants such as water, ethylene glycol, engine oil, and nanofluid to conduct heat dissipation research on a liquid-cooled structure and compared the effects of different coolants on the maximum temperature and the maximum temperature difference [30].
With the development of different cooling structures, parameter optimization has gradually become an important research direction of BTMS. At present, it mainly includes a single variable method, multi-objective analysis method, and other model methods (flow resistance model, thermal resistance model). Rao et al. compared and optimized the contact length of aluminum block and coolant flow rate for their BTMS. Through simulation analysis, it is concluded that when the flow rate does not exceed 0.1 m/s, the spacing difference k = 3 mm has the best cooling effect [31]. Li et al. used the multi-objective genetic algorithm (MOGA) method to optimize the air cooling structure, which greatly reduced the volume and temperature difference of the battery module [32]. E et al. established the thermal resistance model of the cold plate to simplify the heat transfer process of the serpentine-channel cold plate, which improved the solving rate of the heat flow rate [33].
The structure and form of BTMS are becoming more and more complex with ongoing developments. However, there are few studies on the high-performance cooling of compact battery modules under high-power discharge. In actual applications such as electric vehicles, the battery module is in a narrow space, and its space utilization and high discharge rate have a significant impact on heat dissipation. The indirect liquid cooling structure is not only large in size, but also cannot bring high heat exchange effect. In the existing research, there is few direct cooling thermal management structure design and optimization research in the narrow space. In addition, structural parameters often have an important influence on the cooling performance of BTMS. When parameters optimization is concerned, most studies ignore the interaction influence between the parameters on the cooling performance of the system. As a result, it is impossible to obtain the optimal parameter solution. At the same time, the digital twin model has been of wide concern recently. A digital twin system is a digital simulation system that describes the real system in detail [34]. It is based on the model in virtual space to understand, predict, optimize, and control the real system. On the one hand, digital twin system includes real-time interaction between physical and virtual models [35]. On the other hand, the digital twin system uses the reconstructed virtual model to verify, analyze, predict, and optimize the physical system [36,37]. Any hardware or software prototype that can be used to emulate a physical system can be considered a DT and to not necessarily have one unique definition. Simulation, analysis, and optimization of virtual models of physical systems are also part of the digital twin space. Establishing a DT model of the BTMS will help it further optimize and improve. However, there is no digital twin research on battery thermal management systems.
Given the problems mentioned above, this paper proposes a microchannel liquid cooling battery thermal management system with a microchannel structure for high-rate discharge cooling in a narrow space. In order to enhance the heat exchange effect of the coolant, the micro flow channel plates are introduced to perform micro flow segmentation for each of two cells in the battery module, which converts the ordinary convective heat transfer into smaller size channel heat transfer in a limited space. The micro flows of coolant generated after division do not interfere with one other, which significantly improves the effect of convective heat transfer. Several modules can be connected in series and parallel to achieve large-scale commercialization. In addition, the BTMS virtual model of microchannel structure based on digital twin (DT) is constructed. The five-dimensional DT model of BTMS is refined. Taking the microchannel structure as an example, the physical model, virtual model, connections, services, and digital twin data of the BTMS are proposed. Multi-objective iterative optimization is carried out based on the digital twin virtual model. Good thermal management results verify the generalization ability of the model. The main research of this paper includes the following aspects. Firstly, the thermophysical parameters are measured experimentally, and the CFD model simulation verification is carried out. The advantages of a microchannel structure are highlighted. Secondly, the digital twin virtual simulation model of microchannel structure BTMS is established. The orthogonal CFD analysis of structural parameters was carried out based on virtual BTMS. Using these orthogonal data as a priori data, the Gaussian process regression (GPR) model is proposed to analyze the interaction between different factors, which realizes the prediction of the maximum temperature and maximum temperature difference of the battery module. Finally, multi-objective optimization and performance comparison of the model structure is carried out. The good cooling effects reflect the advantages of the microchannel structure. The efficient optimization model is driven by the combination of GPR prediction and non-dominated sorting genetic algorithm II (NSGA-II) optimization, which guides for improving the capability of the battery thermal management system.

2. The Microchannel Battery Thermal Management System and Digital Twin-Based Design

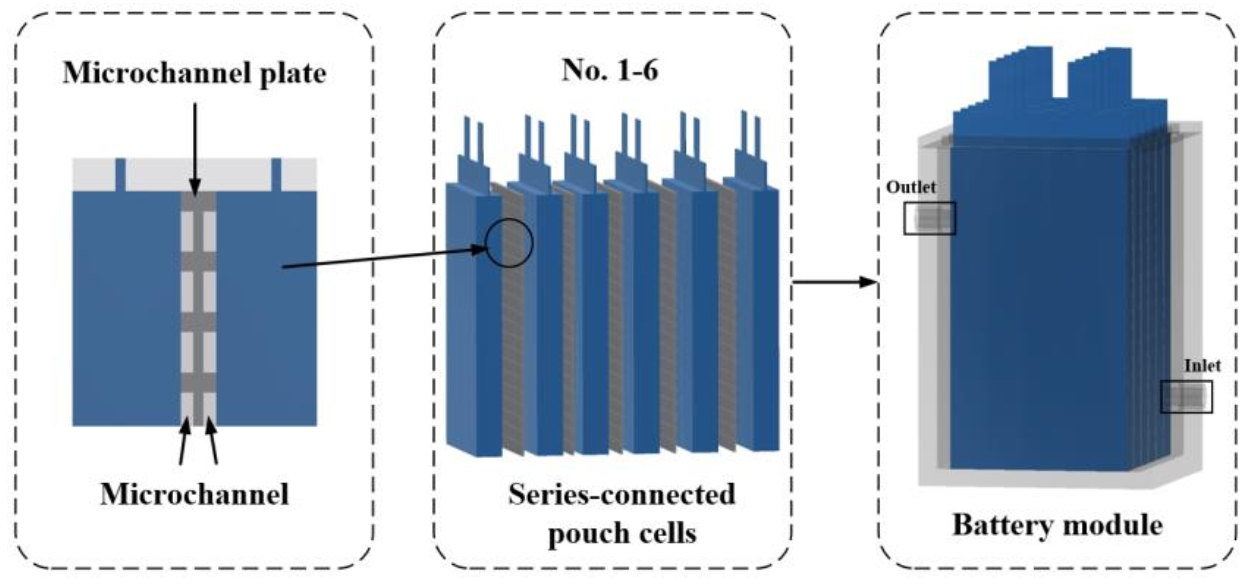
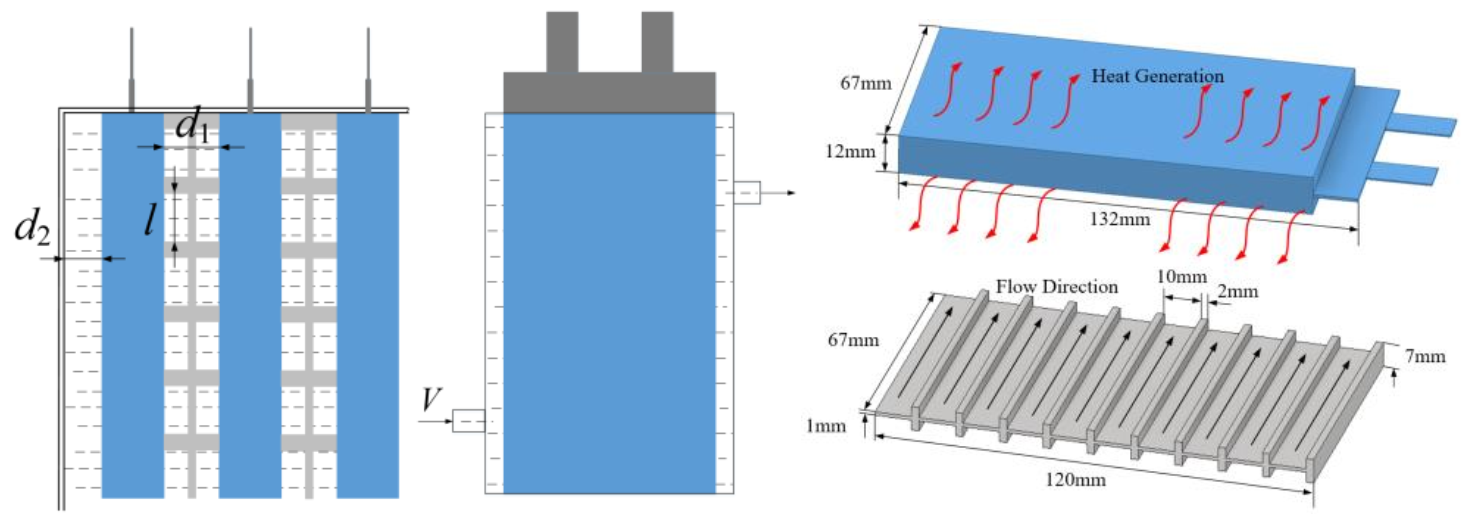
2.1. Introduction and Analysis of the Microchannel Battery Thermal Management System

The microchannel liquid cooling battery thermal management system is developed, as shown in Figure 1. The microchannel structure is simplified and analyzed by taking the module composed of six cells as an example. In the whole battery module, the cells with serial numbers 1–6 are connected in series to form a column and form a laminated structure with the microchannel plate. The specifications of the pouch cell are shown in Table 1. All cells are directly immersed in the coolant, while the tabs are extended to the outside and sealed to prevent coolant penetration and avoid short circuit with the coolant. A microchannel plate made of acrylonitrile butadiene styrene (ABS) material is clamped between two cells to form a sandwich structure, thus forming a microchannel structure.
The microchannel plate plays three roles, namely micro flow segmentation, enhancement of local disturbance heat exchange, and battery module support. The main body of the battery module is immersed in the cooling liquid. At the same time, a microchannel for the circulation of coolant is formed in a narrow space through the microchannel plates. In this way, ordinary convective heat transfer is transformed into micro-scale heat transfer. Due to the small scale, the cell’s surface-to-body ratio increases, enhancing the surface effect (especially the convective heat transfer effect). The coolant inlet and outlet are arranged on the shell of the thermal management system. With the continuous flow of the liquid cooling medium water glycol, heat exchange occurs on the cell wall to take away the heat generated by the cell. This controls the temperature of the module and ensures the safety of the battery module. The coolant is separated into micro-flows that do not affect each other by the microchannel plate. The local convection heat exchange effect of the coolant is greatly enhanced while the flow rate is uniform, thereby improving the cooling efficiency and better achieving the heat dissipation of the module. In addition, the microchannel plate is light in weight (about 0.01 kg), small in size (about 0.00001 m3), and easy to manufacture on a large-scale.
As shown in Figure 2, most of the heat generated by the cell is dissipated into the microchannel coolant in direct contact with its surface only through the surface heat transfer thermal resistance. Microchannel plates and cells can be considered almost adiabatic. There are four microchannel structure parameters: microchannel plate width (cell internal spacing) d1 (mm), side spacing (distance between the outside of the battery module and the inner wall of the box) d2 (mm), microchannel height l (mm), and coolant flow rate V (L/min). These parameters have important influences on the heat dissipation performance of the microchannel structure. In order to facilitate the fabrication of the experimental modules and the arrangement of thermocouples while taking into account the pump power, the structural parameters [d1, d2, l, V] = [7, 16, 10, 1.6] are used as the experimental basis to verify the simulation heat generation model accuracy.

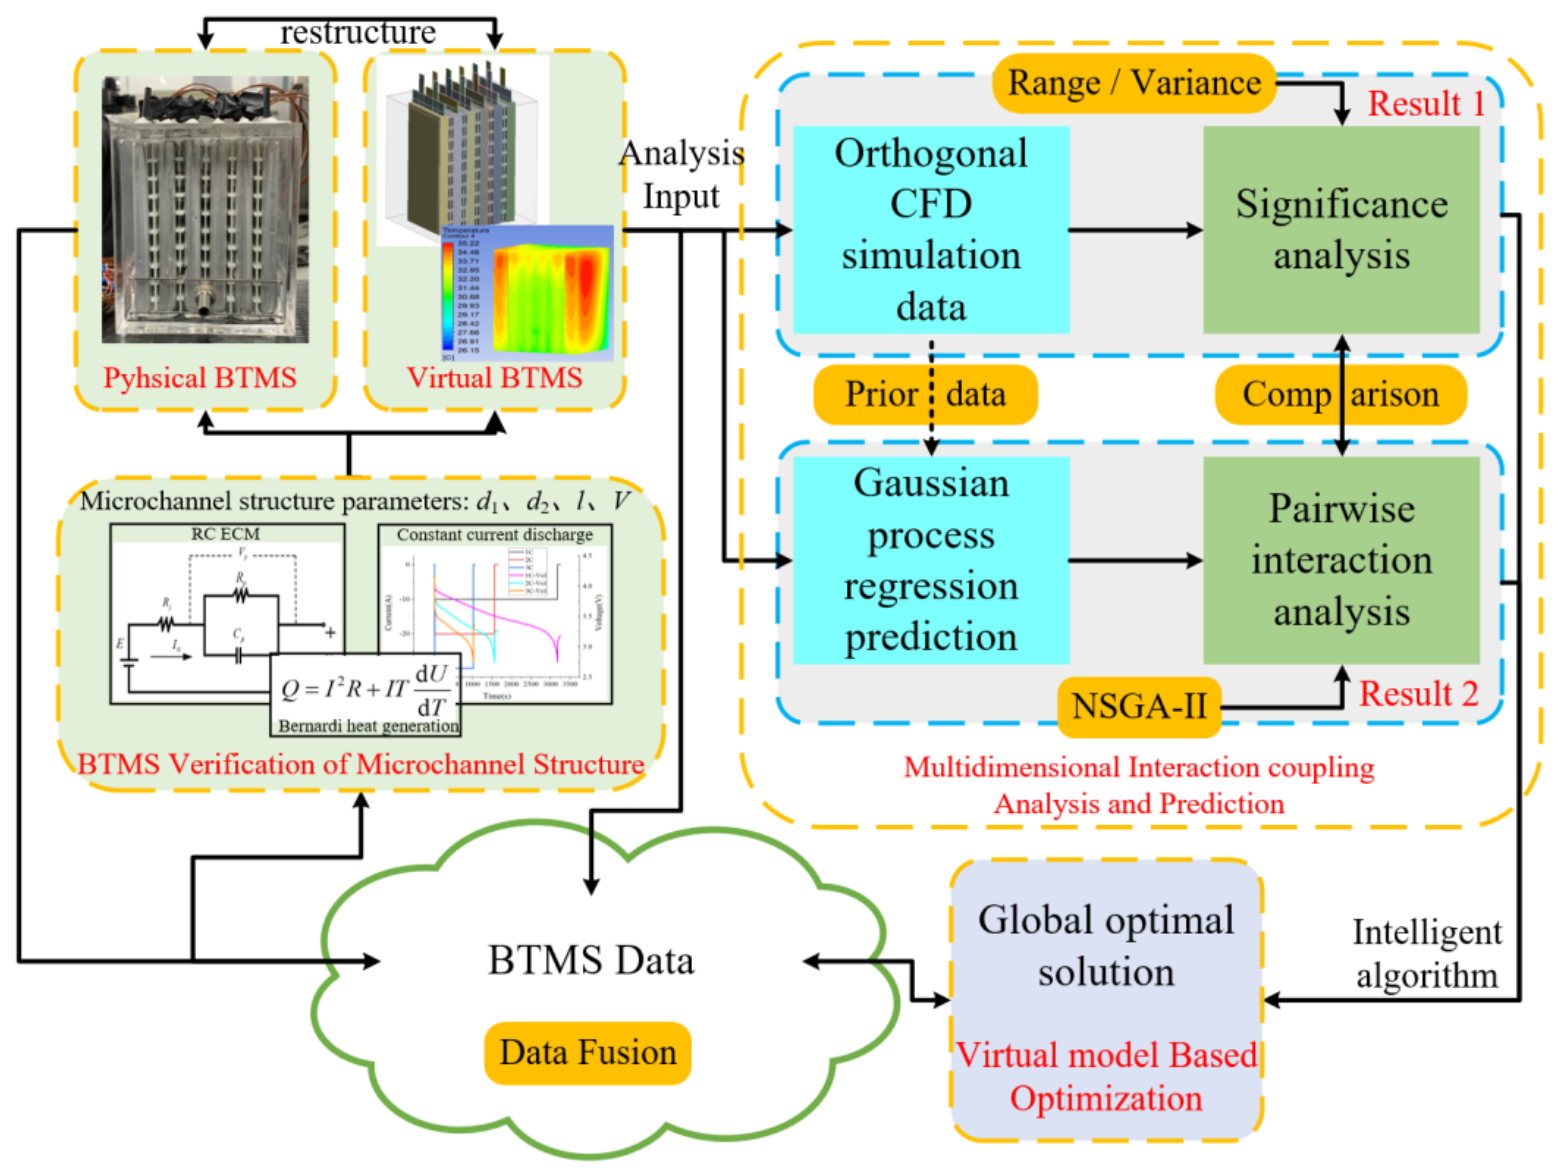
2.2. Digital Twin-Based Design of the Microchannel Battery Thermal Management System

As a highly integrated system, the analysis and optimization of BTMS often needs to be carried out in a virtual simulation environment. On the one hand, the virtual model can realize the rapid construction of BTMS with different structures. On the other hand, BTMS provides sufficient data for the virtual model, which supports the generalization between different battery module structures, heat generation mechanisms, cooling methods, and system optimization. Then, the design efficiency and practicability of the thermal management system needs to be improved. Therefore, in order to propose the virtual simulation model of microchannel BTMS in this paper, the digital twin space of BTMS is shown in Figure 3.
The digital twin space of BTMS includes physical BTMS, virtual BTMS, digital twin data of BTMS, BTMS services, and the connections (CNT) between the four. The physical BTMS is a real microchannel liquid cooling system. At the same time, the virtual BTMS includes geometric models, simulation models (CFD model based on Fluent), heat generation mechanism models, and working condition models. The two are coupled correspondingly. All data are centrally stored in BTMS data. It can be used for state evaluation, system capability optimization, etc. Finally, through the self-written services, the virtual reality combination and human-computer interaction of the system are realized. The current, voltage and temperature information of the battery module are displayed in real time. The analysis and optimization of microchannel BTMS in this work mainly depends on digital twin virtual model. After the reconstruction and verification of the physical model, the virtual model can reflect the physical system well. Then, the BTMS data and virtual models are used to drive the data fusion to analyze and optimize the BTMS, finally improving the thermal management capability.

3. Virtual Calculation and Simulation Model

3.1. Governing Equations of the Digital Twin Virtual Model

The digital twin virtual model-based energy conservation equation of the cell can be given as:
ρ c p b T t = x k x T x + y k y T y + z k z T z +   Q g e n
where ρ, cpb, T represent the density, specific heat capacity, and temperature of the cell material, respectively. kx and ky are the in-plane thermal conductivity along the length and width of the cell, and the values are the same. kz is the thermal conductivity along the thickness of the cell. Qgen is the volumetric heat source in the cell.
The governing equations of convective heat transfer include continuity equation, momentum conservation equation, and energy conservation equation, which are shown as follows for the coolant:
ρ c t + ρ c v   = 0
t ρ c v + ρ c v v   = p + μ c v
t ρ c c p c T c + ρ c c p c v T c   = k c T c
where ρc, cpc represent the average density, specific heat capacity of the coolant respectively, kc is the thermal conductivity of the coolant, Tc is the coolant temperature, μc is the dynamic viscosity of the coolant, and v is the velocity vector of coolant. The convective boundary condition between the cells and coolant can be written as the following equation:
q = h c Δ T
where q is the quantity of heat convection, ΔT is the temperature difference between the wall and coolant, and hc is the surface heat transfer coefficient.

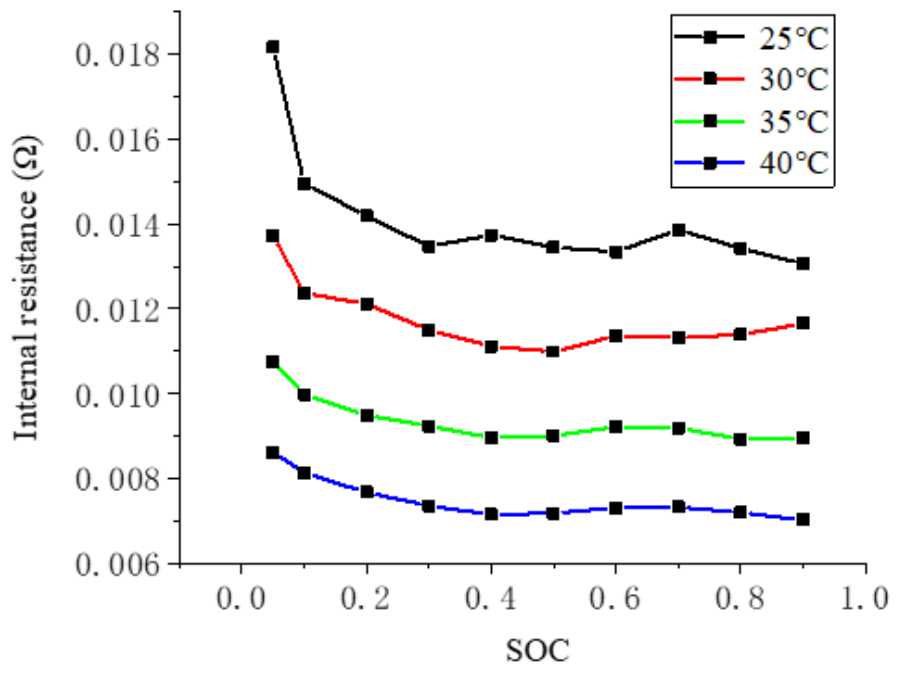
3.2. Cell Heat Generation of the Digital Twin Virtual Model

Based on the following assumptions, the computational fluid dynamics (CFD) simulation model is meshed and calculated:
(a)
The material of the cell is evenly distributed and isotropic.
(b)
The material property will not change with the temperature and SOC (state of charge).
(c)
The heat source is distributed uniformly in all of the areas of the cell.
According to the previous work of Bernardi et al., the heat generation rate of each cell can be calculated as follows [39]:
Q = I 2 R + I T d U d T
where Q is the heat generation rate, I is the current, R is the internal resistance, T is the transient temperature, and d U d T is the entropy thermal coefficient. This study mainly considers the discharge process with large heat generation.
The internal resistance is an important parameter affecting the heat generation of the cell, which is closely related to SOC and temperature. In order to obtain the relationship between the internal resistance and SOC, the hybrid pulse power characteristic (HPPC) test was completed at different temperatures. By fitting the curves of relevant experimental data, the relationship between internal resistance and SOC can be obtained in Figure 4.
The cell entropy thermal coefficient represents the change of open circuit voltage (OCV) of the cell with temperature under constant voltage, an important physical parameter to characterize the cell thermal properties. The entropy coefficient has been measured and calculated experimentally as the basis of cell heat generation simulation [6].
As shown in Table 2, the thermophysical parameters of the materials required for the simulation have been detected by relevant equipment.

3.3. Initial and Boundary Conditions of the Digital Twin Virtual Model

The initial virtual model boundary conditions are set as follows: (1) the initial temperature of battery module, environment, and coolant is 298 K; (2) the inlet is set as the velocity inlet while the outlet is the pressure outlet. Since the Reynolds number is less than 2300, the laminar flow model is utilized in the numerical simulation; (3) the top surface of the cell is the natural convection boundary condition; (4) the SIMPLE algorithm is used to solve the above equations; and (5) to ensure the computation accuracy and efficiency of the equation, the convergence accuracy of the energy equation is set to 10−8. The structure grid is adopted for the cell. Other complex geometries such as cooling channel, contact surface, etc. are discretized by the unstructured grid. Grid independence analysis also has been carried out. Governing equations, heat generation, and initial and boundary conditions of the BTMS are all reflected in the virtual simulation model analysis and optimization process.

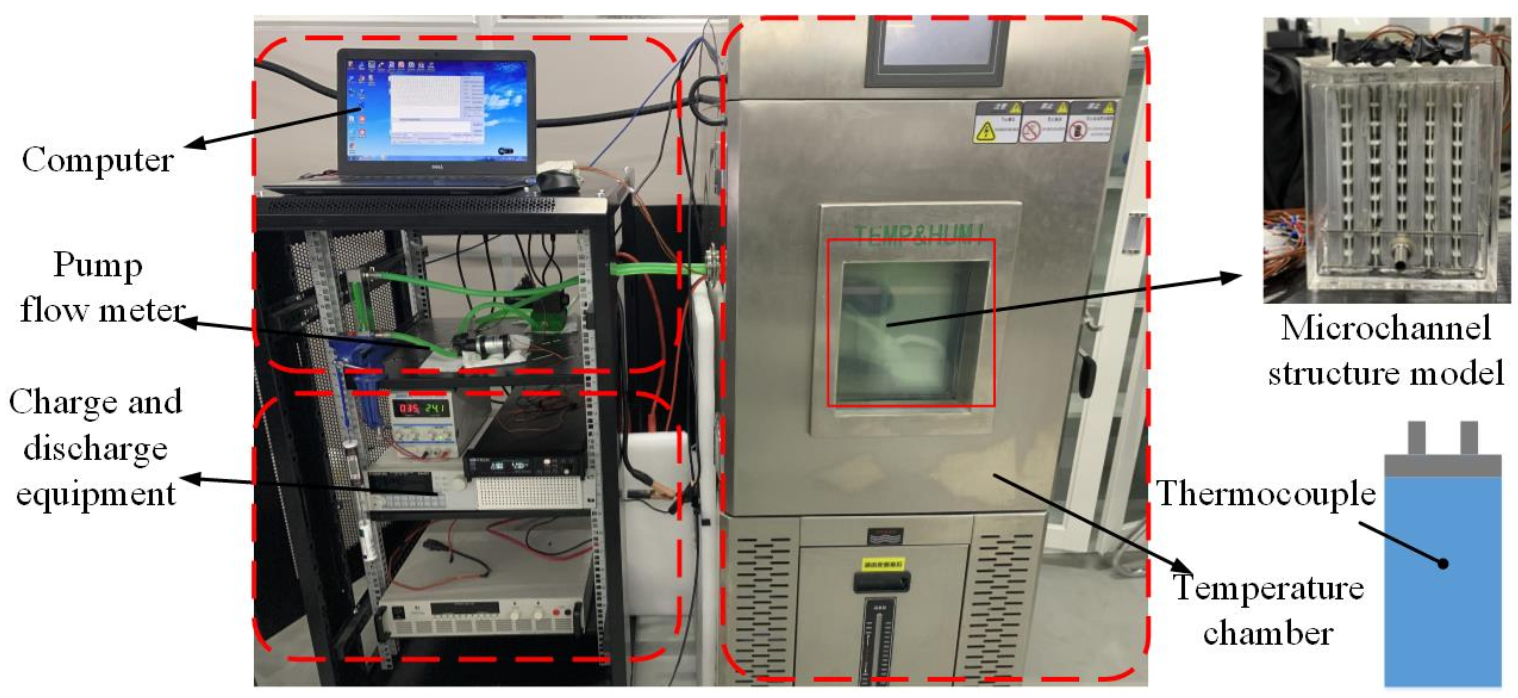
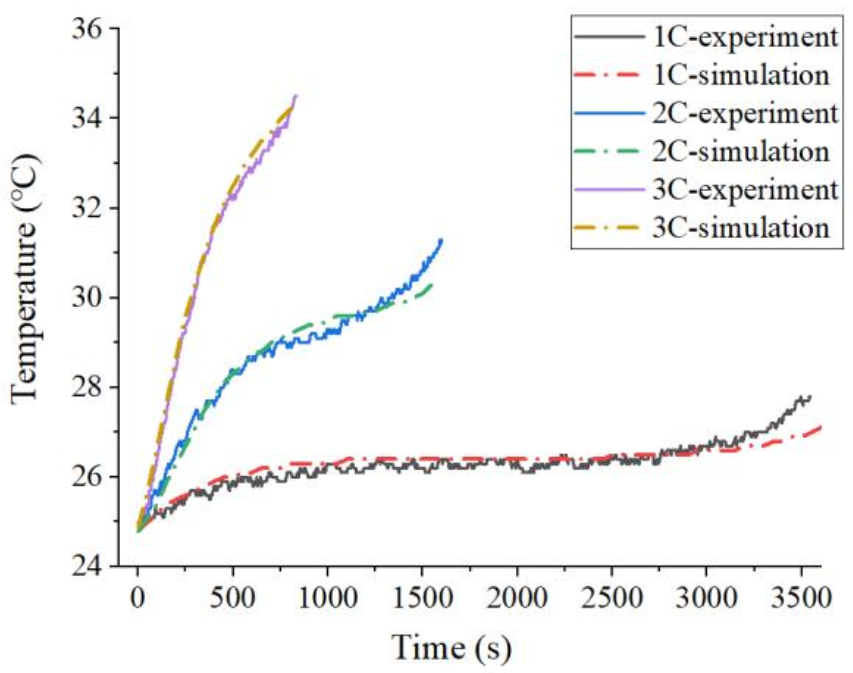
3.4. Experiment and Validation of the Digital Twin Virtual Model

In order to verify the accuracy of the simulation model, the experimental platform shown in Figure 5 was built for system cooling experiments. The thermocouple is placed in the center of each cell where the heat is most concentrated and difficult to dissipate. The temperature data are transmitted to the computer for recording and subsequent processing.
According to the symmetry of the battery module, the temperature of No. 3 cell in the module is compared between the simulation and the experimental results (as shown in Figure 6 and Table 3).
It can be seen from the Figure 6 that the numerical simulation and the experimental results are consistent with the temperature rise trend. With the progress of the discharge process, the cell temperature increases gradually. At the end of discharge, the cell temperature shows a sharp rise due to the increase of internal resistance. Therefore, in order to prevent the battery module from generating much heat, it is necessary to avoid deep discharge of the battery module as far as possible.
When the discharge rate is 1 C, 2 C, and 3 C, the highest temperature of the No. 3 cell measuring point is 27.8 °C, 31.3 °C, and 34.5 °C. Table 3 shows the temperature deviation (temperature difference between the simulation and the experiment results at the end of the discharge) for different discharge rates. The deviation percentages are 2.52%, 2.88%, and 0.29%. The smaller temperature deviation also verifies the accuracy of the simulation model.

4. Digital Twin Virtual Model Based Optimization of the BTMS

In general, the single-factor optimization analysis of the battery thermal management system cannot achieve good results. The method shown in Figure 7 is proposed to explore the interaction between different structural factors of the microchannel cooling system and realize the optimal parameter optimization. The analysis process of the microchannel liquid cooling BTMS includes virtual reconstruction based on physical system, priori data acquisition, interaction analysis, multi-objective optimization, and feedback. Based on the virtual model of microchannel BTMS in digital twin space, the methods of temperature prediction and system optimization are as follows: based on the orthogonal CFD data of the digital twin model, Gaussian process regression in machine learning is used to explore the interaction between structural parameters, and multi-objective optimization research is carried out through NSGA-II.

4.1. Gaussian Process Regression of the Digital Twin Virtual Model Based Optimization

According to past experience, structural optimization by CFD simulation takes a lot of time for modeling and simulation. In this paper, Gaussian process regression is used for multi-parameter learning of the model. The Gaussian process is a random process, which is widely used in machine learning methods to map the relationship between output targets and input targets. It is suitable for multi-dimensional input and sparse samples, which can realize automatic optimization of hyper-parameters.
The Gaussian process is a non-parametric supervised learning method that can directly infer the distribution of functions. The Gaussian process defines a priori function. After observing some function values, it can be converted into a posteriori function through algebraic operations. When an infinite dimension is sampled to obtain an infinite number of points, it can be understood as a function obtained by sampling. The original probability density function is no longer a distribution of points but a distribution of functions. This infinite element Gaussian distribution is called the Gaussian process.
For all x = [x1, x2, ···, xn], if f(x) = [f(x1), f(x2), ···, f(xn)] obey the multivariate Gaussian distribution. Then, f is a Gaussian process, and its model can be expressed as:
f x   G P μ x , κ x , x
where μ(x) represents the mean value function, which returns the mean value of each dimension. κ(x,x) represents the covariance function or kernel function, and returns the covariance matrix between the dimensions of the two vectors. The Gaussian process is uniquely defined by the mean function and the covariance function, and the finite-dimensional subset of the Gaussian process obeys the multivariate Gaussian distribution.
The kernel function is the core of the Gaussian process and determines the nature of the Gaussian process. The most commonly used kernel function is the Gaussian kernel function, also known as the radial basis function RBF. The basic form is as follows:
K x i , x j   = σ 2 exp x i x j 2 2 2 2
where σ and are the hyper-parameters of the Gaussian kernel. Parameter σ is used to control the degree of flatness of the function, and parameter controls the volatility in the vertical direction. The Gaussian process will automatically correct the hyper-parameters during operation.
Gaussian process has a good ability to deal with random processes and is suitable for handling independent parameter variables. For the four independent parameters of the microchannel liquid cooling battery thermal management system, the Gaussian process can be used for interaction analysis and regression prediction between these parameters and the temperature index of the thermal management system. It will be an effective method for simulating and fitting the nonlinear response of battery thermal management.

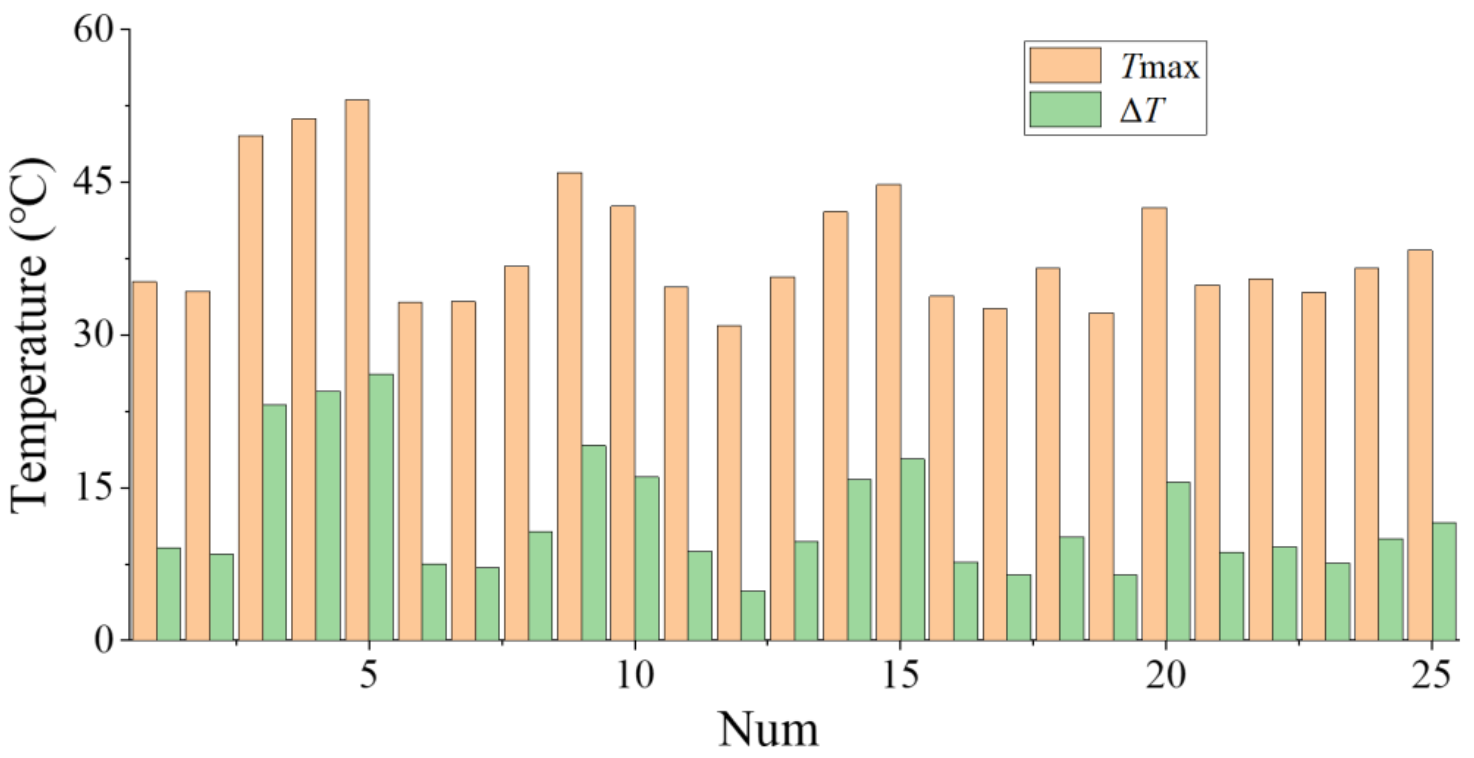
4.2. Orthogonal Design of the Digital Twin Virtual Model Based Optimization

In order to construct the Gaussian process of this BTMS, a batch of training data and corresponding results need to be obtained to train the Gaussian process model. Experimental method design (DOE) includes central composite design (CCD), Box-Behnken design (BBD), Latin hypercube sampling (LHS), orthogonal design (OD), etc. In this paper, OD is used to determine the basic training data and obtain the significant response in advance. In addition, due to the fixed structure of the BTMS, the temperature rise trend is the same at different discharge rates. The influence of the charge-discharge rate on the maximum temperature and the maximum temperature difference of the battery module is only reflected in the numerical value. It does not affect the changing trend of the parameters. Compared with a low discharge rate, the heat generation of cell is more obvious at a high discharge rate. Therefore, in order to facilitate the learning of Gaussian model and highlight the influence of temperature and temperature difference, the analysis is based on a 3 C discharge rate.
Then, we defined the range of the structural parameters. In order to refine the sensitivity of different factors, while taking into account the size of the battery module in a narrow space and the power of the pump used, we reduced the volume of the module as much as possible and improved the mass ratio. The maximum width of the micro flow channel designed did not exceed 1/3 of the cell thickness. The coolant flow rate matches the optimal power range of the pump. Each factor is divided into five levels. The L25 (56) orthogonal analysis table determined according to the number of factors, level ranges and test indicators is shown in Table A1. The table supports a total of six factors and five levels of orthogonal analysis. Since the structure of the microchannel system has four influencing factors, the remaining blank factors are just regarded as error responses, which have parallel corresponding levels with other influencing factors. All test indexes were obtained by digital twin virtual simulation model. Maximum temperature and maximum temperature difference of battery module under different parameters are shown in the Figure 8.

4.3. NSGA-II Method of the Digital Twin Virtual Model Based Optimization

The results related to BTMS include maximum temperature, maximum temperature difference, space efficiency, maximum pressure difference, power loss, etc. In addition to the first two, other parameters can be directly calculated by the given input parameters to obtain accurate values without the need for using Gaussian process. Therefore, in order to obtain the optimal parameters of the microchannel structure, the virtual model-based NSGA-II was used on the basis of Gaussian process regression. Taking the maximum temperature and maximum temperature difference as indexes, the Pareto solution was obtained for the four influencing factors of the system. The limitation of the optimized model is that the maximum temperature of the battery module is lower than the upper limit of the optimal operating temperature of the power cell 40 °C. At the same time, the minimum temperature difference can be satisfied as much as possible under high-rate discharge. In addition, considering the rationality of microchannel size, the parameters are limited to a certain extent. According to the parameter design range, the established multi-objective optimization model is as follows:
x =   d 1 , d 2 , l , V 2 d 1 4 0 d 2 4 4 l 8 0.8 V 1.6 T max 40   ° C Find :   min   T max   and   min   Δ T

5. Results and Discussions

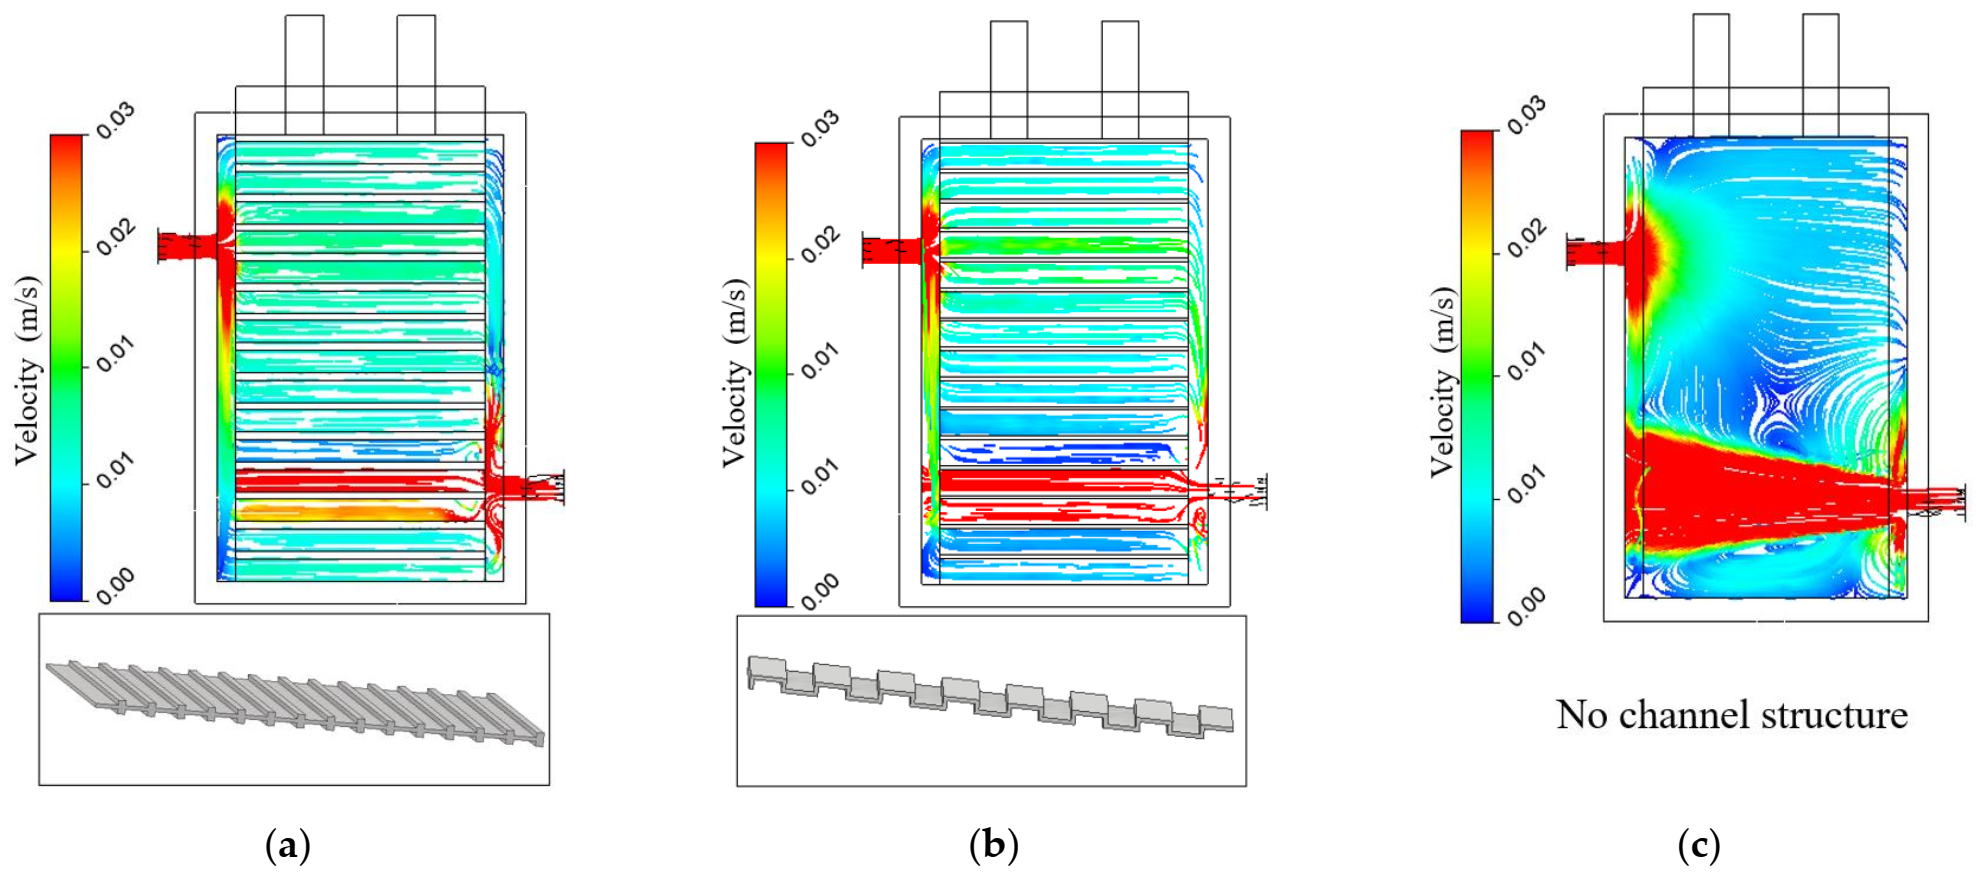
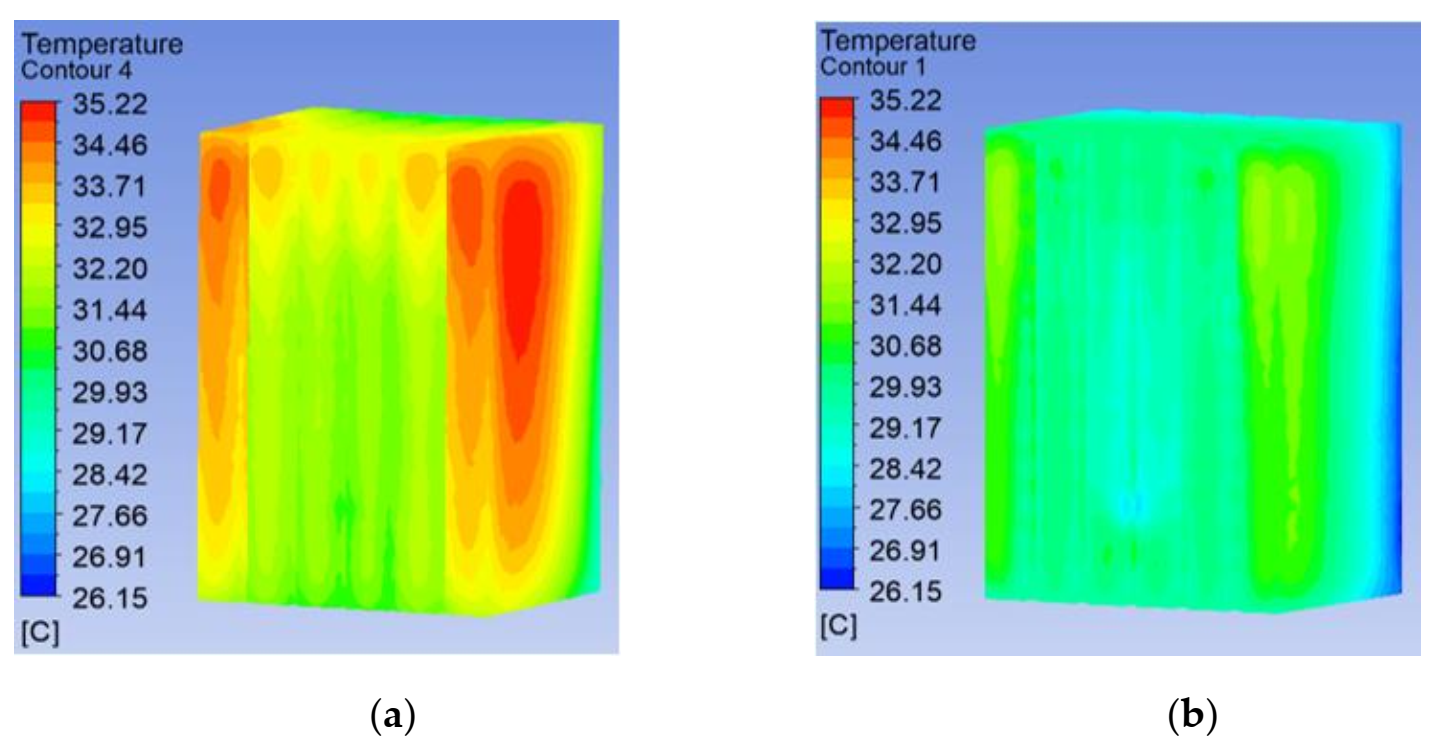
5.1. Streamline Analysis of Microchannel Structure

As shown in Figure 9, in order to highlight the advantages of the cooling performance of the microchannel structure, the distribution of coolant flow lines inside the module is compared in three cases: the cross-shaped microchannel structure, the bow-shaped microchannel structure, and the no-microchannel structure under the same battery module size. It can be clearly seen that the flow line and flow velocity distribution of the cooling liquid inside the module containing the cross-shaped microchannel structure are more uniform than the others. When the flow rate is 1.6 L/min, the coolant flow rate in the microchannel is kept above 0.01 m/s. Although the bow-shaped microchannel structure can separate the flow lines, the uniformity effect is poor and will cause greater local flow rate unevenness. The coolant inside the no-microchannel structure is in a chaotic state, and most of the cell area is not well cooled. A more uniform streamline and higher flow rate prove the outstanding advantages of microchannel structure, which will be further analyzed and optimized to obtain the best state of the microchannel liquid cooling battery thermal management system.

5.2. Orthogonal Analysis Based on Digital Twin Virtual Model

The range and variance analysis of the two temperature indicators were carried out, respectively, and the significance of the factors was judged preliminarily. Orthogonal optimization was carried out at the same time. Table 4 shows the influence of different factors on the range (RTmax, RΔT) and variance (MSj(Tmax), MSjT)) of the maximum temperature, the temperature difference, and the degree of significance of the factors judged by the F factor. The range results show that the range values of d2 and d1 are relatively large, far exceeding V and l. It shows that the influence of the width and side spacing of the microchannel plate on the maximum temperature and the maximum temperature difference is much higher than that of the coolant flow rate and the height of the microchannel. The order of the influence degree of the four factors is as follows: d2, d1, V, and l.
The variance results show that there is at least 99.5% confidence that d2 has a highly significant effect on the maximum temperature and maximum temperature difference of the battery module. There is at least 97.5% confidence that d1 has a significant effect on the maximum temperature and maximum temperature difference of the battery module. The influence of V and l is close to the mean square value of the error column, so it is suggested that their influence on the maximum temperature and maximum temperature difference of the battery module is not significant.
Figure 10 shows the variation of the maximum temperature and the maximum temperature difference of the battery module with different factor levels. The trends of the two thermal management indicators are very similar. With the increase of d1, the maximum temperature and the maximum temperature difference of the module show trends indicating a gradual decrease and then a slight increase. The minimum value is obtained at d1 = 3.5 mm. When d2 is greater than 1 mm, the influence on the temperature shows an increasing trend. Due to the orthogonality, the effects of l and V are not prominent, resulting in no fixed influence mode, and there are minimum temperature values at l = 6 mm and V = 1.4 L/min, respectively. In summary, after orthogonal optimization, when d1 = 3.5 mm, d2 = 1 mm, l = 6 mm, and V = 1.4 L/min, the microchannel thermal management system has the best temperature control capability.

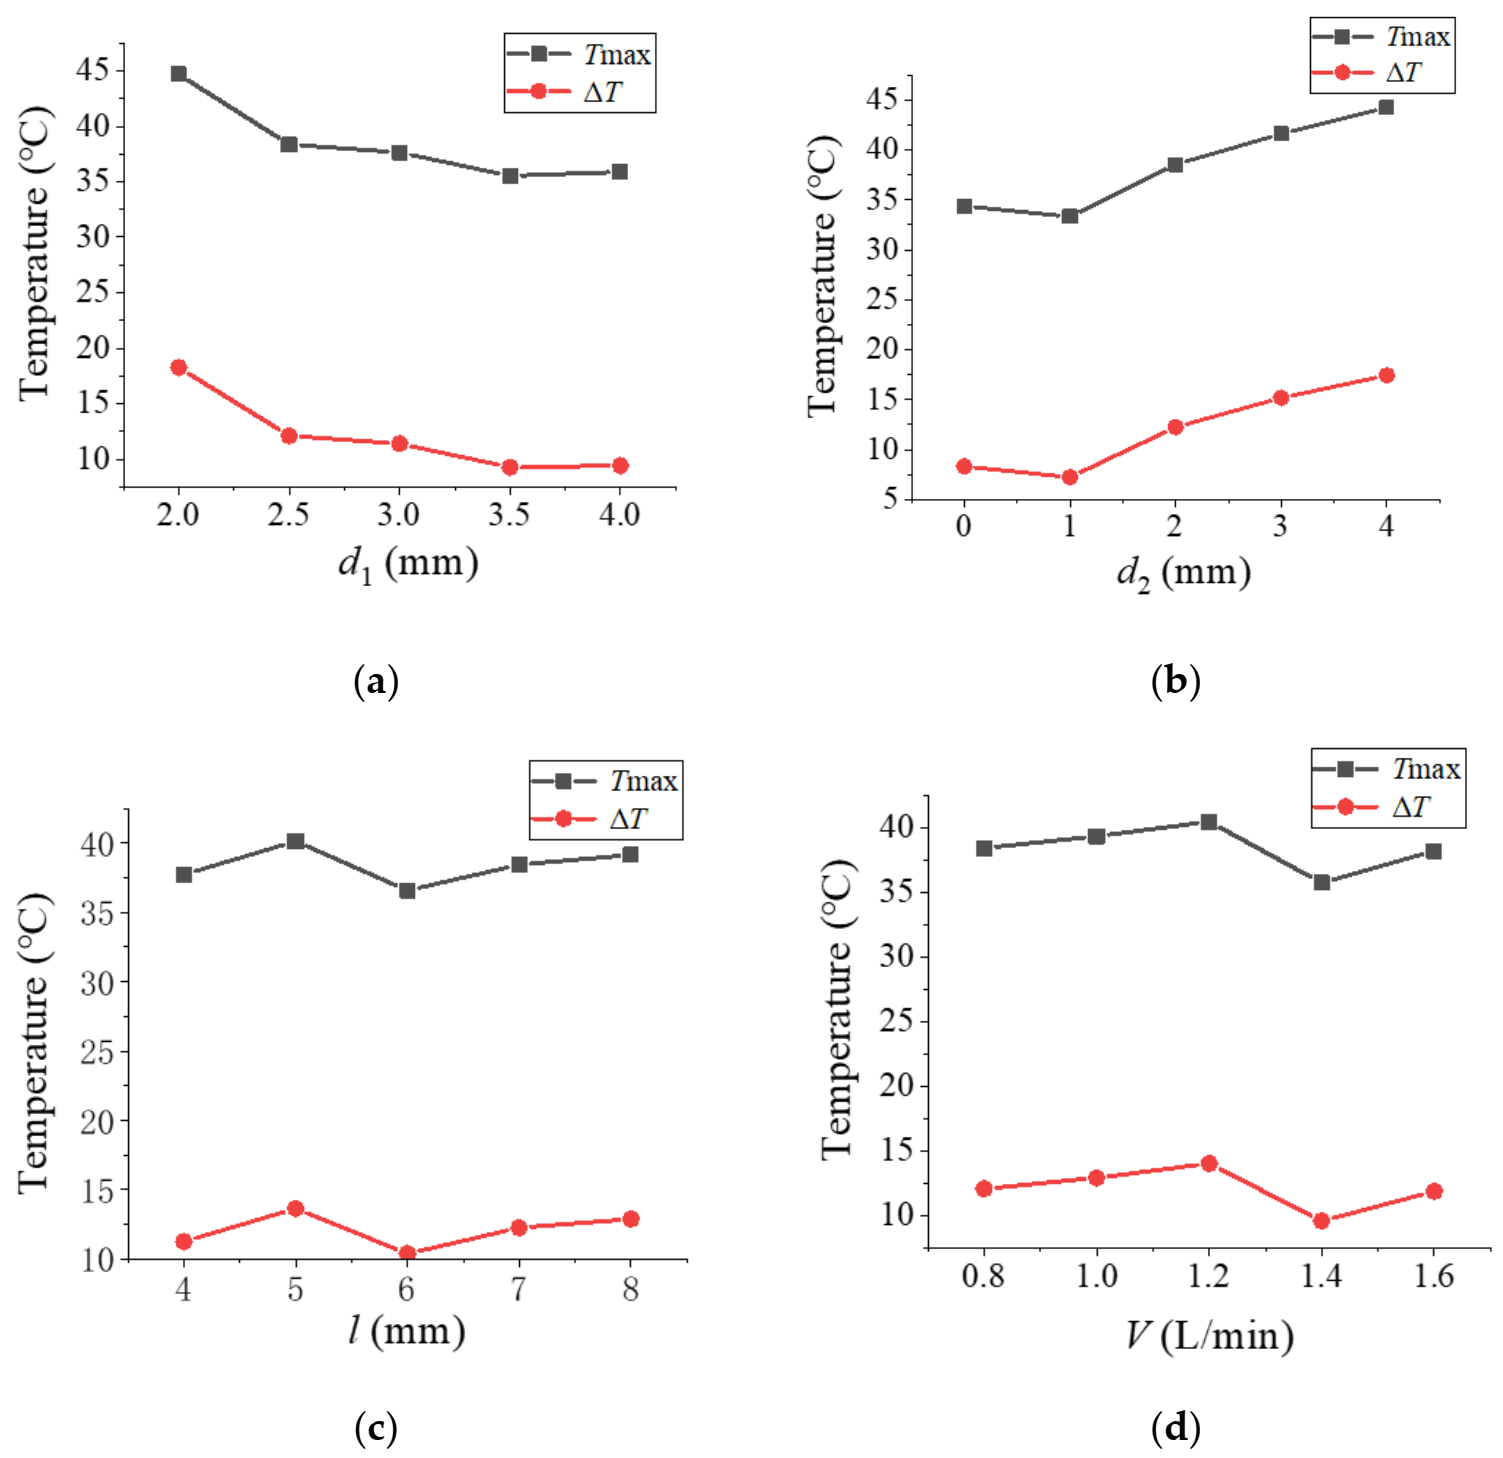
5.3. Gaussian Process Regression Analysis Based on Digital Twin Virtual Model

In order to make Gaussian regression converge better, another 25 groups of data are designed again by using other columns of the orthogonal table. Based on the prior total orthogonal data, Gaussian process regression analysis was performed on the module structure parameters and optimization goals. Figure 11 shows the Gaussian regression response of d1, d2; d1, l; and d2, l, and V to the maximum temperature of the microchannel system. From (a–c), it is obvious that the maximum temperature of the module varies with d1, d2, and l. When d1 approaches 3~3.5 mm, d2 approaches 0~1 mm, and l approaches 6~7 mm, the maximum temperature of the module reaches a lower level. Both d1 and d2 have a significant impact. When the microchannel plate width (d1) decreases, the amount of coolant between the two cells inside the battery module decreases, and the heat exchange is insufficient. When the side distance (d2) of the battery module increases, more coolant flows away from both sides of the battery module without entering the inside of the module to exchange heat with the cell, which also leads to an increase in the maximum temperature. It can be seen from (d) that when other parameters are fixed, the greater the coolant flow rate, the lower the maximum temperature of the module. This result is slightly inconsistent with the orthogonal analysis result (the system has the optimal cooling capacity when V = 1.4 L/min). Since each test group of the orthogonal analysis is at the orthogonal point, the local optimal solution will be affected by the combination of factors when analyzing the influence. Different experimental groups will bring differences in local optimal solutions. However, in the interaction analysis of Gaussian process, other parameters are fixed, which can better reflect the real independent influence of variables. As the coolant flow increases, the downward trend of the maximum temperature of the module gradually slows down. Therefore, increasing the flow rate can only rapidly improve the cooling effect to a certain extent. When it exceeds a certain range, the cooling effect is no longer significantly improved. On the contrary, continuing to increase the flow rate will bring about greater loss of pump power, so a trade-off between the two needs to be made.
Figure 12 shows the Gaussian regression response of d1, d2; d1, l; d2, l, and V to the maximum temperature difference of the microchannel system. Similarly, the influence of d1 and d2 is the most significant, and the reason for this is consistent with the influence of the two on the maximum temperature. When the flow rate is fixed, d1 and d2 also represent the proportional relationship between the coolant flowing into the inside and outside of the battery module respectively. The maximum temperature of the module depends on the size relationship of the coolant flow. However, the maximum temperature difference of the module depends on the proportional relationship of the coolant flow across the sidewall of the cell. It can be seen that when d1 and d2 increase or decrease in linear proportions at the same time, the maximum temperature difference of the module is always kept at a low level. The result shows that in order to promote the coolant through the inside and outside of the microchannel system to have a similar heat dissipation effect, the amount of coolant flowing through the inside and outside of the battery module needs to be linearly correlated (so as to obtain the better temperature difference control result). It can also be seen from (d) that as the coolant flow rate increases, the downward trend of the maximum temperature difference of the module gradually slows down.
In summary, in order to reduce the maximum temperature and the maximum temperature difference of the module, it is necessary to reasonably control the cell internal spacing d1 and the side spacing d2. At the same time, it is necessary to select a suitable microchannel height l, and increase the coolant flow rate V appropriately.

5.4. Multi-Objective Optimization and Comparison Based on Digital Twin Virtual Model

The data of orthogonal analysis and Gaussian process regression analysis based on the virtual model are stored in the BTMS data. After multi-objective optimization of four parameters, a group of reasonable and effective results were selected. The results before and after virtual model optimization are shown in Table 5. After orthogonal optimization, the maximum temperature of the battery module was 31.8 °C, and the maximum temperature difference was 5.76 °C. The maximum temperature of the module obtained by Gaussian process regression and multi-objective optimization was 30.67 °C, and the maximum temperature difference was 4.68 °C. Compared with the initial structure, the maximum temperature and the maximum temperature difference dropped by 4.55 °C and 4.39 °C, respectively. The thermal management effect has been significantly improved. Compare the two analysis and optimization methods: when the experimental base is small, the orthogonal analysis method can save time and cost, but cannot obtain the global optimal solution. When the experimental base is large and there are many influencing factors, Gaussian process regression can realize the analysis of the interaction between multiple factors. After the analysis of the interaction, the hidden internal interaction between different factors is fully reflected. It can not only realize single factor analysis, but also realize interactive analysis of two or more factors, making the optimization direction more comprehensive. The global optimal solution has the best thermal management performance. With the continuous accumulation of BTMS data, more virtual models can be used for complex calculation and optimization.
The optimized structural parameters are used for simulation, and the temperature contours at the end of the battery module discharge before and after optimization are shown in Figure 13. It can be clearly seen that the structure after Gaussian process regression optimization has a better cooling effect. The maximum temperature of the battery module has greatly reduced from 35.22 °C to 31.2 °C with a drop of 4.02 °C. At the same time, the maximum temperature difference of the module decreased from 9.07 °C to 5.05 °C. The highest temperature distribution position is on the outer side of the two cells (No. 1 and 6). Compared with the high temperature distribution area before optimization, the high temperature distribution area is significantly reduced. The four internal cells have also been cooled more fully, and the temperature inconsistency between the cells has been significantly reduced after optimization.
To further reflect the advantages of this method, it was compared with the structure of the small flow channel liquid cooling method in the existing research [30,40]. The direct comparison is not convincing due to different cell types, dimensions, layouts, and operating conditions. Therefore, the mentioned existing methods are reconstructed with the same cell size and heat generation as this work. The results are shown in Figure 14. Using the same cell size and heat generation, the maximum temperature of the battery module in [30] is 51.29 °C and the overall temperature difference is 26.29 °C. In [40], the maximum temperature and the temperature difference are 38.37 °C and 8.33 °C, respectively. According to the temperature contour, compared with the single analysis optimization method using the fixed variable method in other articles, the maximum temperature of the battery module is further reduced by 18.7% after the joint optimization of the Gaussian process regression-NSGA-II algorithm in this article. The temperature difference is reduced by 39.4%, which also makes the temperature consistency better. The microchannel direct liquid cooling structure in this paper has a better cooling effect and a smaller volume occupation, and the battery module is easy to manufacture and has a lower cost. After optimization, the microchannel system has better temperature control capabilities.

6. Conclusions

A new type of microchannel liquid cooling battery thermal management system has been proposed in this paper. Cooling performance analysis, experimental verification, and numerical simulation have been carried out. A novel digital twin virtual model-based BTMS parameter analysis and optimization process is proposed. The structural parameters that were difficult to change through the experiments have been analyzed and optimized by the Gaussian process regression method based on prior virtual orthogonal CFD data. The main conclusions which can be drawn from this study are as follows:
The design of the new microchannel structure can effectively improve the cooling performance of BTMS in a narrow space. The microchannel plate has functions which include separating the micro flow and enhancing disturbance, thereby improving the cooling effect of the module. According to the factor range and variance analysis, d2 and d1 have extremely significant effects on the heat dissipation capacity of the module. In contrast, the effects of V and l are not significant.
In the virtual simulation model, Gaussian process regression based on orthogonal priors can realize the interaction analysis of the parameters. d1 and d2 represent the amount of coolant flowing through the inside and outside of the module, respectively, affecting the consistency of the cooling effect of the module indirectly. Properly controlling the linear relationship between the two factors can greatly enhance the cooling capacity of the system and improve the temperature uniformity in a limited space. By increasing the coolant flow, the cooling capacity of the module can only be effectively improved to a limited extent. A larger flow will bring a greater pump power loss, which must be weighed when selecting. After optimization, the maximum temperature and the maximum temperature difference of the system decreased by 4.02 °C and 5.05 °C, respectively. Compared with other research schemes, the optimized microchannel structure in this paper has a better cooling effect but smaller volume occupation.
Compared with orthogonal analysis, Gaussian process regression can highlight the significance of factors and analyze factor interaction. The Gaussian process regression-based multi-objective optimization method can minimize the maximum temperature and the maximum temperature difference. The global optimization results can also be obtained.
Finally, the virtual model can comprehensively cover the comprehensive information of BTMS. By coupling the physical model and the virtual model, a large amount of BTMS data can be refined. Using these data for fusion and driving can further optimize and improve the battery thermal management system. With the full connections of physical BTMS, virtual BTMS, BTMS data, and other services, BTMS will develop towards higher integration and intelligence.

Author Contributions

Conceptualization, J.X.; methodology, J.X.; software, Z.X.; validation, Z.X., Z.G., H.W. and Z.S.; formal analysis, Z.X.; investigation, J.X. and X.M.; resources, Z.G. and Z.S.; data curation, Z.X. and Z.G.; writing—original draft preparation, Z.X.; writing—review and editing, J.X. and X.M.; visualization, Z.G., H.W. and Z.S.; supervision, J.X. and X.M.; project administration, J.X.; funding acquisition, J.X. All authors have read and agreed to the published version of the manuscript.

Funding

This research was funded by the National Key Research and Development Program of China grant number 2020YFB1708400 and the National Natural Science Foundation of China grant number 52075420.

Institutional Review Board Statement

Not applicable.

Informed Consent Statement

Not applicable.

Data Availability Statement

Not applicable.

Acknowledgments

The authors gratefully acknowledge the numerical simulation platform support provided by high performance computing center of Xi’an Jiaotong University.

Conflicts of Interest

The authors declare no conflict of interest.

Appendix A

Table A1. The virtual simulation result of different factors’ levels.
NumFactorsTest IndexNumFactorsTest Index
d1d2lVE1E2TmaxΔT d1d2lVE1E2TmaxΔT
12040.81135.229.07143380.82242.115.84
22161.45234.278.5153451.41344.7517.8
322814349.5723.1163.5061.62333.797.7
42351.63451.2324.48173.5181.21432.626.43
52471.22553.1116.18183.5250.85536.5810.15
62.5081.43533.257.47193.5371.44132.156.47
72.51512133.267.15203.54413242.4715.56
82.5271.61236.7510.69214051.24234.938.65
92.5341.25345.9519.15224170.83335.59.2
102.5460.84442.6316.06234241.42434.157.61
1130715434.758.732443611536.619.98
123141.64530.954.88254481.65138.311.6
133261.23135.719.69

References

  1. Moussa, A.; Bekrar, A.; Trentesaux, D.; Aissani, N.; Bouamrane, K. Manufacturing 4.0 Operations Scheduling with Agv Battery Management Constraints. Energies 2020, 13, 4948. [Google Scholar]
  2. Jun, X.; Mei, X.; Wang, X.; Fu, Y.; Zhao, Y.; Wang, J. A Relative State of Health Estimation Method Based on Wavelet Analysis for Lithium-Ion Battery Cells. IEEE Trans. Ind. Electron. 2021, 68, 6973–6981. [Google Scholar]
  3. Jiang, Y.; Xu, J.; Hou, W.; Mei, X. A Stack Pressure Based Equivalent Mechanical Model of Lithium-Ion Pouch Batteries. Energy 2021, 221, 119804. [Google Scholar] [CrossRef]
  4. Vima, M.; Saxena, R.; Kumar, K.; Kalam, A.; Tripathi, B. Review on Battery Thermal Management Systems for Energy-Efficient Electric Vehicles. Renew. Sustain. Energy Rev. 2021, 151, 111611. [Google Scholar]
  5. Mahesh, P.; Panchal, S.; Kim, N.; Lee, M.Y. Cooling Performance Characteristics of 20 Ah Lithium-Ion Pouch Cell with Cold Plates Along Both Surfaces. Energies 2018, 11, 2550. [Google Scholar]
  6. Guo, Z.; Xu, J.; Xu, Z.; Mubashir, M.; Wang, H.; Mei, X. A Three-Heat-Source Electro-Thermal Coupled Model for Fast Estimation of the Temperature Distribution of a Lithium-Ion Battery Cell. IEEE Trans. Transp. Electrif. 2021, 1. [Google Scholar] [CrossRef]
  7. Xu, J.; Mei, X.; Wang, H.; Wang, J. A Hybrid Self-Heating Method for Batteries Used at Low Temperature. IEEE Trans. Ind. Inform. 2021, 17, 4714–4723. [Google Scholar] [CrossRef]
  8. Pranjali, R.T.; Gupta, M.M.; Joshi, S.S. Developments in Battery Thermal Management Systems for Electric Vehicles: A Technical Review. J. Energy Storage 2021, 35, 102255. [Google Scholar]
  9. Wang, H.; Tao, T.; Xu, J.; Shi, H.; Mei, X.; Gou, P. Thermal Performance of a Liquid-Immersed Battery Thermal Management System for Lithium-Ion Pouch Batteries. J. Energy Storage 2022, 46, 103835. [Google Scholar] [CrossRef]
  10. Tao, W.; Tseng, K.J.; Zhao, J.; Wei, Z. Thermal Investigation of Lithium-Ion Battery Module with Different Cell Arrangement Structures and Forced Air-Cooling Strategies. Appl. Energy 2014, 134, 229–238. [Google Scholar]
  11. Rajib, M.; Park, C. Reciprocating Air Flow for Li-Ion Battery Thermal Management to Improve Temperature Uniformity. J. Power Sources 2011, 196, 5685–5696. [Google Scholar]
  12. Ming, X.X.; Sun, X.D.; Hu, D.H.; Li, R.Z.; Tang, W. Research on Heat Dissipation Performance and Flow Characteristics of Air-Cooled Battery Pack. Int. J. Energy Res. 2018, 42, 3658–3671. [Google Scholar]
  13. Kai, C.; Wang, S.; Song, M.; Chen, L. Structure Optimization of Parallel Air-Cooled Battery Thermal Management System. Int. J. Heat Mass Transf. 2017, 111, 943–952. [Google Scholar]
  14. Kai, C.; Song, M.; Wei, W.; Wang, S. Structure Optimization of Parallel Air-Cooled Battery Thermal Management System with U-Type Flow for Cooling Efficiency Improvement. Energy 2018, 145, 603–613. [Google Scholar]
  15. Kai, C.; Chen, Y.; She, Y.; Song, M.; Wang, S.; Chen, L. Construction of Effective Symmetrical Air-Cooled System for Battery Thermal Management. Appl. Therm. Eng. 2020, 166, 114679. [Google Scholar]
  16. Hakeem, A.A.A.; Solyali, D. Configuration, Design, and Optimization of Air-Cooled Battery Thermal Management System for Electric Vehicles: A Review. Renew. Sustain. Energy Rev. 2020, 125, 109815. [Google Scholar]
  17. Jie, L.; Zou, D.; Wang, Y.; Wang, S.; Huang, L. Battery Thermal Management Systems (Btms) Based on Phase Change Material (Pcm): A Comprehensive Review. Chem. Eng. J. 2022, 430, 132741. [Google Scholar]
  18. Ravindra, J.; Afzal, A.; Panchal, S. A Novel Battery Thermal Management System Using Nano-Enhanced Phase Change Materials. Energy 2021, 219, 119564. [Google Scholar]
  19. Weixiong, W.; Yang, X.; Zhang, G.; Ke, X.; Wang, Z.; Situ, W.; Li, X.; Zhang, J. An Experimental Study of Thermal Management System Using Copper Mesh-Enhanced Composite Phase Change Materials for Power Battery Pack. Energy 2016, 113, 909–916. [Google Scholar]
  20. Rao, Z.; Huo, Y.; Liu, X.; Zhang, G. Experimental Investigation of Battery Thermal Management System for Electric Vehicle Based on Paraffin/Copper Foam. J. Energy Inst. 2015, 88, 241–246. [Google Scholar] [CrossRef]
  21. Rao, Z.; Wang, S.; Wu, M.; Lin, Z.; Li, F. Experimental Investigation on Thermal Management of Electric Vehicle Battery with Heat Pipe. Energy Convers. Manag. 2013, 65, 92–97. [Google Scholar] [CrossRef]
  22. Rao, Z.; Huo, Y.; Liu, X. Experimental Study of an Ohp-Cooled Thermal Management System for Electric Vehicle Power Battery. Exp. Therm. Fluid Sci. 2014, 57, 20–26. [Google Scholar] [CrossRef]
  23. Xin, Y.; Zhao, Y.; Quan, Z. Thermal Management System of Lithium-Ion Battery Module Based on Micro Heat Pipe Array. Int. J. Energy Res. 2018, 42, 648–655. [Google Scholar]
  24. Zhang, Z.; Wei, K. Experimental and Numerical Study of a Passive Thermal Management System Using Flat Heat Pipes for Lithium-Ion Batteries. Appl. Therm. Eng. 2020, 166, 114660. [Google Scholar] [CrossRef]
  25. Wang, J.; Gan, Y.; Liang, J.; Tan, M.; Li, Y. Sensitivity Analysis of Factors Influencing a Heat Pipe-Based Thermal Management System for a Battery Module with Cylindrical Cells. Appl. Therm. Eng. 2019, 151, 475–485. [Google Scholar] [CrossRef]
  26. Deng, Y.; Feng, C.; Zhu, H.; Chen, J.; Wen, M.; Yin, H. Effects of Different Coolants and Cooling Strategies on the Cooling Performance of the Power Lithium Ion Battery System: A Review. Appl. Therm. Eng. 2018, 142, 10–29. [Google Scholar] [CrossRef]
  27. Anthony, J.; Kim, I.Y. Design Optimization of Electric Vehicle Battery Cooling Plates for Thermal Performance. J. Power Sources 2011, 196, 10359–10368. [Google Scholar]
  28. Jarrett, A.; Kim, I.Y. Influence of Operating Conditions on the Optimum Design of Electric Vehicle Battery Cooling Plates. J. Power Sources 2014, 245, 644–655. [Google Scholar] [CrossRef]
  29. Wang, H.; Tao, T.; Xu, J.; Mei, X.; Liu, X.; Gou, P. Cooling Capacity of a Novel Modular Liquid-Cooled Battery Thermal Management System for Cylindrical Lithium Ion Batteries. Appl. Therm. Eng. 2020, 178, 115591. [Google Scholar] [CrossRef]
  30. Liu, H.; Chika, E.; Zhao, J. Investigation into the Effectiveness of Nanofluids on the Mini-Channel Thermal Management for High Power Lithium Ion Battery. Appl. Therm. Eng. 2018, 142, 511–523. [Google Scholar] [CrossRef]
  31. Rao, Z.; Qian, Z.; Kuang, Y.; Li, Y. Thermal Performance of Liquid Cooling Based Thermal Management System for Cylindrical Lithium-Ion Battery Module with Variable Contact Surface. Appl. Therm. Eng. 2017, 123, 1514–1522. [Google Scholar] [CrossRef]
  32. Wei, L.; Xiao, M.; Peng, X.; Garg, A.; Gao, L. A Surrogate Thermal Modeling and Parametric Optimization of Battery Pack with Air Cooling for Evs. Appl. Therm. Eng. 2019, 147, 90–100. [Google Scholar]
  33. Jiaqiang, E.; Xu, S.; Deng, Y.; Zhu, H.; Zuo, W.; Wang, H.; Chen, J.; Peng, Q.; Zhang, Z. “Investigation on Thermal Performance and Pressure Loss of the Fluid Cold-Plate Used in Thermal Management System of the Battery Pack. Appl. Therm. Eng. 2018, 145, 552–568. [Google Scholar]
  34. Fei, T.; Zhang, M.; Liu, Y.; Nee, A.Y.C. Digital Twin Driven Prognostics and Health Management for Complex Equipment. CIRP Ann. 2018, 67, 169–172. [Google Scholar]
  35. Meng, Z.; Tao, F.; Nee, A.Y.C. Digital Twin Enhanced Dynamic Job-Shop Scheduling. J. Manuf. Syst. 2021, 58, 146–156. [Google Scholar]
  36. Zhang, C.; Zhou, Q.; Li, Y.; Hua, L.; Xu, H. The Digital Twin Modelling of the Electrified Vehicle Based on a Hybrid Terminating Control of Particle Swarm Optimization. IFAC-Pap. 2021, 54, 552–557. [Google Scholar] [CrossRef]
  37. Haber, G.R.; Quiza, R.; Villalonga, A.; Arenas, J.; Castano, F. Digital Twin-Based Optimization for Ultraprecision Motion Systems with Backlash and Friction. IEEE Access 2019, 7, 93462–93472. [Google Scholar]
  38. Guo, Z.; Xu, J.; Xu, Z.; Mubashir, M.; Wang, H.; Mei, X. A Lightweight Multi-Channel Direct Contact Liquid Cooling System and Its Optimization for Lithium-Ion Batteries. IEEE Trans. Transp. Electrif. 2021, 1. [Google Scholar] [CrossRef]
  39. Bernardi, D.; Pawlikowski, E.; Newman, J. A General Energy Balance for Battery Systems. J. Electrochem. Soc. 1985, 132, 5–12. [Google Scholar] [CrossRef] [Green Version]
  40. Cong, W.; Zhang, G.; Li, X.; Huang, J.; Wang, Z.; Lv, Y.; Meng, L.; Situ, W.; Rao, M. Experimental Examination of Large Capacity Lifepo4 Battery Pack at High Temperature and Rapid Discharge Using Novel Liquid Cooling Strategy. Int. J. Energy Res. 2018, 42, 1172–1182. [Google Scholar]
Figure 1. Microchannel liquid cooling battery thermal management system.
Energies 15 01421 g001
Figure 2. Optimization parameters of the microchannel structure.
Energies 15 01421 g002
Figure 3. Digital twin framework of the BTMS.
Energies 15 01421 g003
Figure 4. Cell internal resistance at different temperatures.
Energies 15 01421 g004
Figure 5. Experimental facilities.
Energies 15 01421 g005
Figure 6. Comparison of experimental and simulated temperature of No. 3 cell with cooling at ambient temperature 25 °C.
Energies 15 01421 g006
Figure 7. Microchannel structure parameter analysis and optimization process based on DT virtual model.
Energies 15 01421 g007
Figure 8. Maximum temperature and maximum temperature difference of battery module under different factors’ levels.
Energies 15 01421 g008
Figure 9. Coolant flow lines with different channel structures: (a) streamline formed by the cross-shaped microchannel structure; (b) streamline formed by the bow-shaped microchannel structure; (c) streamline formed by the no-microchannel structure.
Energies 15 01421 g009
Figure 10. Variation of maximum temperature and temperature difference with different factor levels: (a) optimization target varies with d1; (b) optimization target varies with d2; (c) optimization target varies with l; (d) optimization target varies with V.
Energies 15 01421 g010
Figure 11. Gaussian regression response of different factors to the maximum temperature of microchannel system: (a) effect of d1 and d2 on maximum temperature; (b) effect of d1 and l on maximum temperature; (c) effect of d2 and l on maximum temperature; (d) effect of V on maximum temperature.
Energies 15 01421 g011
Figure 12. Gaussian regression response of different factors to the temperature difference of microchannel system: (a) effect of d1 and d2 on temperature difference; (b) effect of d1 and l on temperature difference; (c) effect of d2 and l on temperature difference; (d) effect of V on temperature difference.
Energies 15 01421 g012
Figure 13. Temperature contour of battery module at the end of discharge before and after optimization: (a) initial structure; (b) Gaussian process regression optimization structure.
Energies 15 01421 g013
Figure 14. Comparison of other small flow channel liquid cooling structure schemes: (a) results of structure in [30]; (b) results of structure in [40].
Energies 15 01421 g014
Table 1. The size and physical parameters of LIB. Adapted with permission from ref. [38]. 2022 IEEE.
ParameterRated Voltage
(V)
Rated Capacity
(mAh)
Cut-Off Voltage
(V)
Mass
(kg)
Dimension
(mm)
Value3.710,0003.0–4.20.23132 × 67 × 12
Table 2. Thermophysical parameters of cell materials.
MaterialsThermal Conductivity
(W/m·K)
Density
(kg/m3)
Specific Heat
(J/kg·K)
Cell body3.272543.921679
Copper (negative pole)3888978381
Aluminum (positive pole)2022719871
Table 3. Temperature deviation.
Discharge Rate1 C2 C3 C
Maximum temperature (°C)27.831.334.5
Temperature deviation (°C)0.70.90.1
Table 4. The range and variance analysis of the maximum temperature and temperature difference.
IndexFactors
d1d2lV
RTmax9.15810.9323.5484.75
RΔT9.00410.2083.264.45
MSj(Tmax)68.17108.079.1415.47
Fj(Tmax)4.477.09\\
MSj(ΔT)67.2895.008.3613.48
Fj(ΔT)4.926.95\\
Significance 1**********
F(4,16)α0.005 = 5.64α0.01 = 4.77
α0.025 = 3.73α0.05 = 3.01
1 Significance increases with the number of *.
Table 5. Comparison of simulation results before and after microchannel structure optimization.
Parameterd1d2lVTmaxΔT
Initial structure2040.835.29.07
Orthogonal optimization3.5161.431.85.76
Gaussian regression optimization3.140.86.21.630.64.68
Publisher’s Note: MDPI stays neutral with regard to jurisdictional claims in published maps and institutional affiliations.

