Article

The Effect of DC Voltage Pre-Stress on the Breakdown Voltage of Air under Composite DC and LI Voltage and Test Circuit: Design and Application †

1
Group for Lightning and Surge Protection, Technische Universität Ilmenau, 98693 Ilmenau, Germany
2
Electrical Engineering Department, Istanbul Technical University, 34469 Istanbul, Turkey
3
Electrical-Electronic Engineering Department, Marmara University, 34722 Istanbul, Turkey
4
Research Unit High-Voltage Technologies, Technische Universität Ilmenau, 98693 Ilmenau, Germany
*
Author to whom correspondence should be addressed.
This paper is an extended version of our paper published in 2021 13th International Conference on Electrical and Electronics Engineering (ELECO), Bursa, Turkey, 25–27 November 2021; pp. 147–151.
Energies 2022, 15(4), 1353; https://doi.org/10.3390/en15041353
Submission received: 4 January 2022 / Revised: 7 February 2022 / Accepted: 11 February 2022 / Published: 13 February 2022
(This article belongs to the Section F6: High Voltage)

Abstract

:
The use of HVDC systems is increasing in number due to technological innovations, increasing power capacity and increasing customer demand. The characteristics of insulation systems under composite DC and LI voltage must be examined and clarified. In this study, firstly, experimental circuits were designed to generate and measure composite DC and LI high voltage using a simulation program. The coupling elements used were chosen according to simulation results. Afterward, experimental circuits were established in the laboratory according to the simulation results of the designed experimental circuit. Then, breakdown voltages under composite DC and LI voltage for less uniform and non-uniform electric fields were measured with four different electrode systems for positive and negative DC voltage pre-stresses with different amplitudes. The 50% breakdown voltage was calculated using the least-squares method. Finally, 3D models were created for the electrode systems used in the experiments using the finite element method. The efficiency factors of electrode systems calculated with the FEM results were correlated with the experimental breakdown voltage results. Thus, the breakdown behavior of air under bipolar and unipolar composite voltages (CV) was investigated. In conclusion, the experimental results showed that very fast polarity change in bipolar CV causes higher electrical stress compared to unipolar CV.

1. Introduction

High-voltage direct-current (HVDC) systems are quickly being applied for transmission systems day by day. They have important advantages such as integrating renewable resources, bulk power distribution over long distances, less cost over long distances and allowing flexible grid operation [1,2]. In HVDC lines, the line is usually a point-to-point supply over long distances. In case of any failure or interruption in HVDC lines, the power transmission system is severely affected [3,4]. HVDC systems must operate with high reliability, as they transmit high power and have a critical role in power transmission and given their important role in modern power systems. For overhead line HVDC systems, lightning is a significant threat in terms of the reliability and power quality of HVDC systems [5]. The reliability and sustainability of power transmission systems are of vital importance. When a failure in the insulation of power systems occurs, the reliability of the power system is in danger. Thus, overvoltages occur, and they are called internal and external overvoltages. Whereas internal overvoltages occur during switching of the circuit, ground and phase short circuits, resonance, etc., external overvoltages usually occur during lightning strikes [6]. These events cause traveling waves in the power system and protection elements. These waves cause high- and short-time overvoltages. Some qualification tests apply to provide reliability and safety in high-voltage equipment [7,
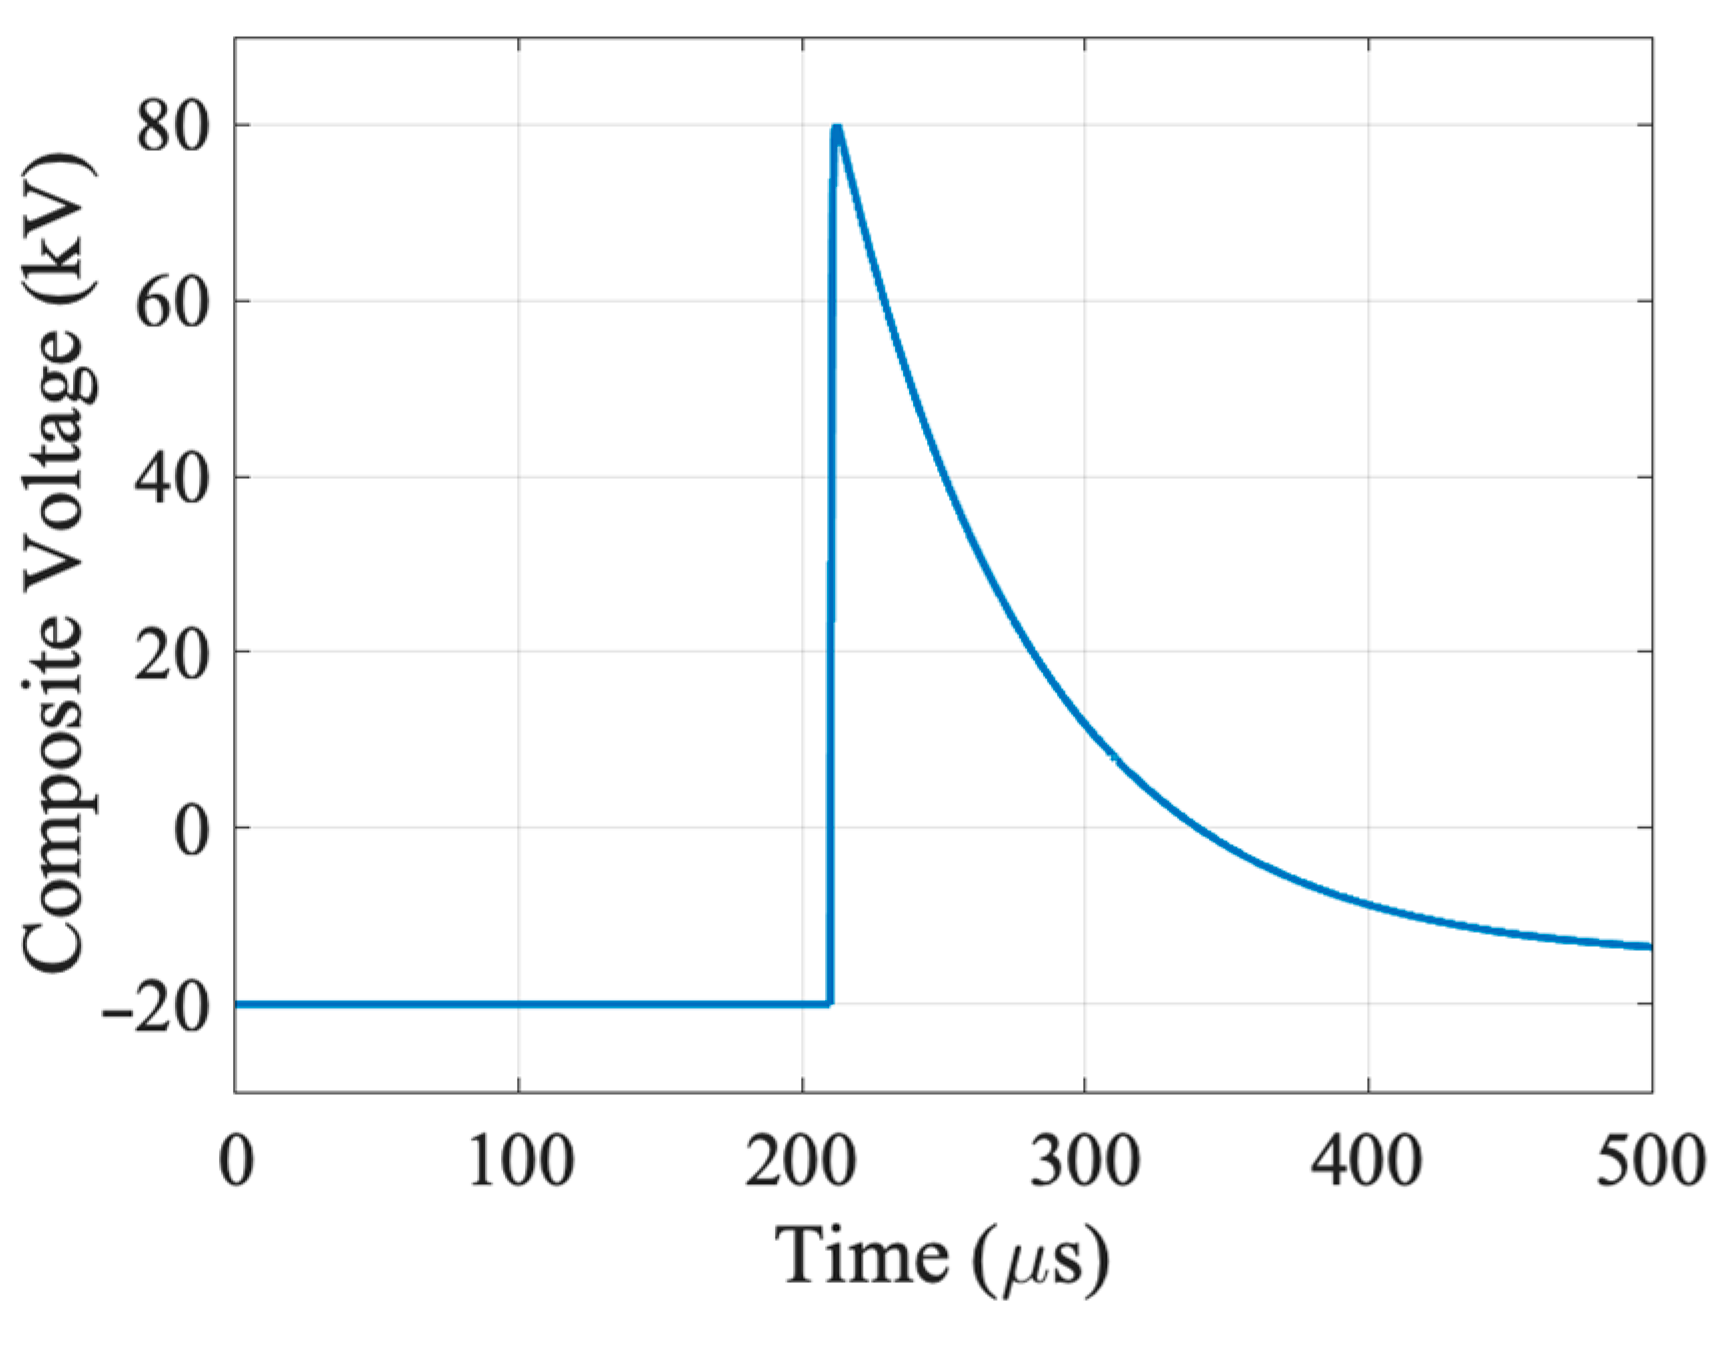
8]. The high-voltage tests in the standards are conducted separately for a single voltage type, such as AC, DC or impulse voltage. In order to check the reliability and safety of insulation systems, they should be tested under composite voltage (CV) as in real operation. The two different voltage waveforms in tests under mixed voltage are simultaneously applied to a test object from a single terminal or double terminals. If a single terminal for high voltage is used, this voltage type is called “composite voltage”, and if two different terminals are used for high voltage, it is called “combined voltage” [9]. In the composite voltage test circuit, voltage sources have to be isolated with coupling elements so that the sources do not affect each other [10]. As an example, the composite voltage waveform by the superimposed 20 kV − DC and 100 kV + lighting impulse (LI) voltage is shown in Figure 1.
In recent years, studies have been accelerated to obtain the breakdown behavior of insulation materials under composite DC and impulse voltage. Gabler et al. [11] studied the breakdown behavior of oil-paper insulation material under superimposed DC and lightning impulse voltage stresses. They examined the breakdown behavior of tested material for the bipolar and unipolar superposing states of the lightning impulse voltage at positive DC voltage pre-stress. They have revealed that DC voltage pre-stress at the bipolar composite voltage is more crucial than unipolar composite voltage stress for oil-paper insulation. Wang et al. [12] studied insulation characteristics of SF6/N2 filled GIS spacers under composite DC and LI voltage. They examined the effect of pre-stress time of DC voltage at two different gas temperatures on flashover voltage of insulation material. They carried out the test while both positive and negative DC voltage pre-stresses were applied. The experiments were performed with bipolar and unipolar superposing of the DC voltage with the lightning impulse. They indicated that the flashover voltage decreased significantly under composite voltage in reverse polarity condition. Zha et al. [13] studied the effect of bubbles on the insulation behavior of LN2 (liquid nitrogen) under composite DC and LI voltage, +DC and −LI and at different pressures. They applied breakdown experiments under composite +DC voltage superimposed −LI voltage. As a result, they revealed that composite +DC and −LI voltage is more likely to harm the insulation than +DC voltage and −LI voltage for this insulation material. Arnold et al. [14] studied the measurement of corona inception and breakdown voltage in coaxial SF6 arrangements under AC, DC, impulse stress and composite voltage (DC and LI). They showed the impact of bias DC voltage applied at low and high pressures on breakdown voltage under composite DC and LI voltage. Du et al. [15] studied the impacts of superimposed voltage and ambient temperature on flashover behaviors and surface charge in an oil-paper insulation system. They carried out some experiments at superimposed voltage with different polarity and amplitude combinations and at different temperature ranges. They revealed that the peak value of flashover voltage decreases as DC voltage increases under all combinations, and flashover is more likely to happen at higher temperatures. Ma et al. [16] studied the change of breakdown behavior of particle-contaminated HVDC GIL under superimposed voltage of DC and impulse. They indicated that the probability of firefly motion increased with increasing DC voltage, while the probability of bouncing motion decreased. As a result, they emphasized that superposition of DC voltage and impulse voltage may be a critical situation for HVDC GIL if free conductive particles are present. In addition to these studies, the behavior of electrical treeing [17,18,19,20,21] and electrical properties [22,23,24] in solid insulating materials has been observed in recent years under superimposed DC and impulse high voltage.
In this study, firstly, simulations were carried out for establishing a composite DC and LI voltage test setup by a circuit simulation software. With the simulations, the coupling element types and their properties in the test circuit were chosen. In this part of the study, it was ensured that the DC and LI high-voltage sources used did not affect each other, and the compliance of the obtained waveforms with the standards was evaluated. Then, breakdown voltages under composite DC and LI voltage for less uniform and non-uniform electric fields with four different electrode systems were measured for different amplitude ±DC voltage pre-stress. The 50% breakdown voltage was used for the evaluations, which was calculated using the least-squares method. Finally, 3D models were generated for the electrode systems used in the experiments using the finite element method (FEM). Results obtained with FEM were correlated with experimental results. Thus, the breakdown behavior of air under bipolar and unipolar CV was examined.

2. The Setup and Analysis of the Composite DC and LI Voltage Experimental Circuit

The mixed voltage is obtained by combining two different voltage types [9,10,
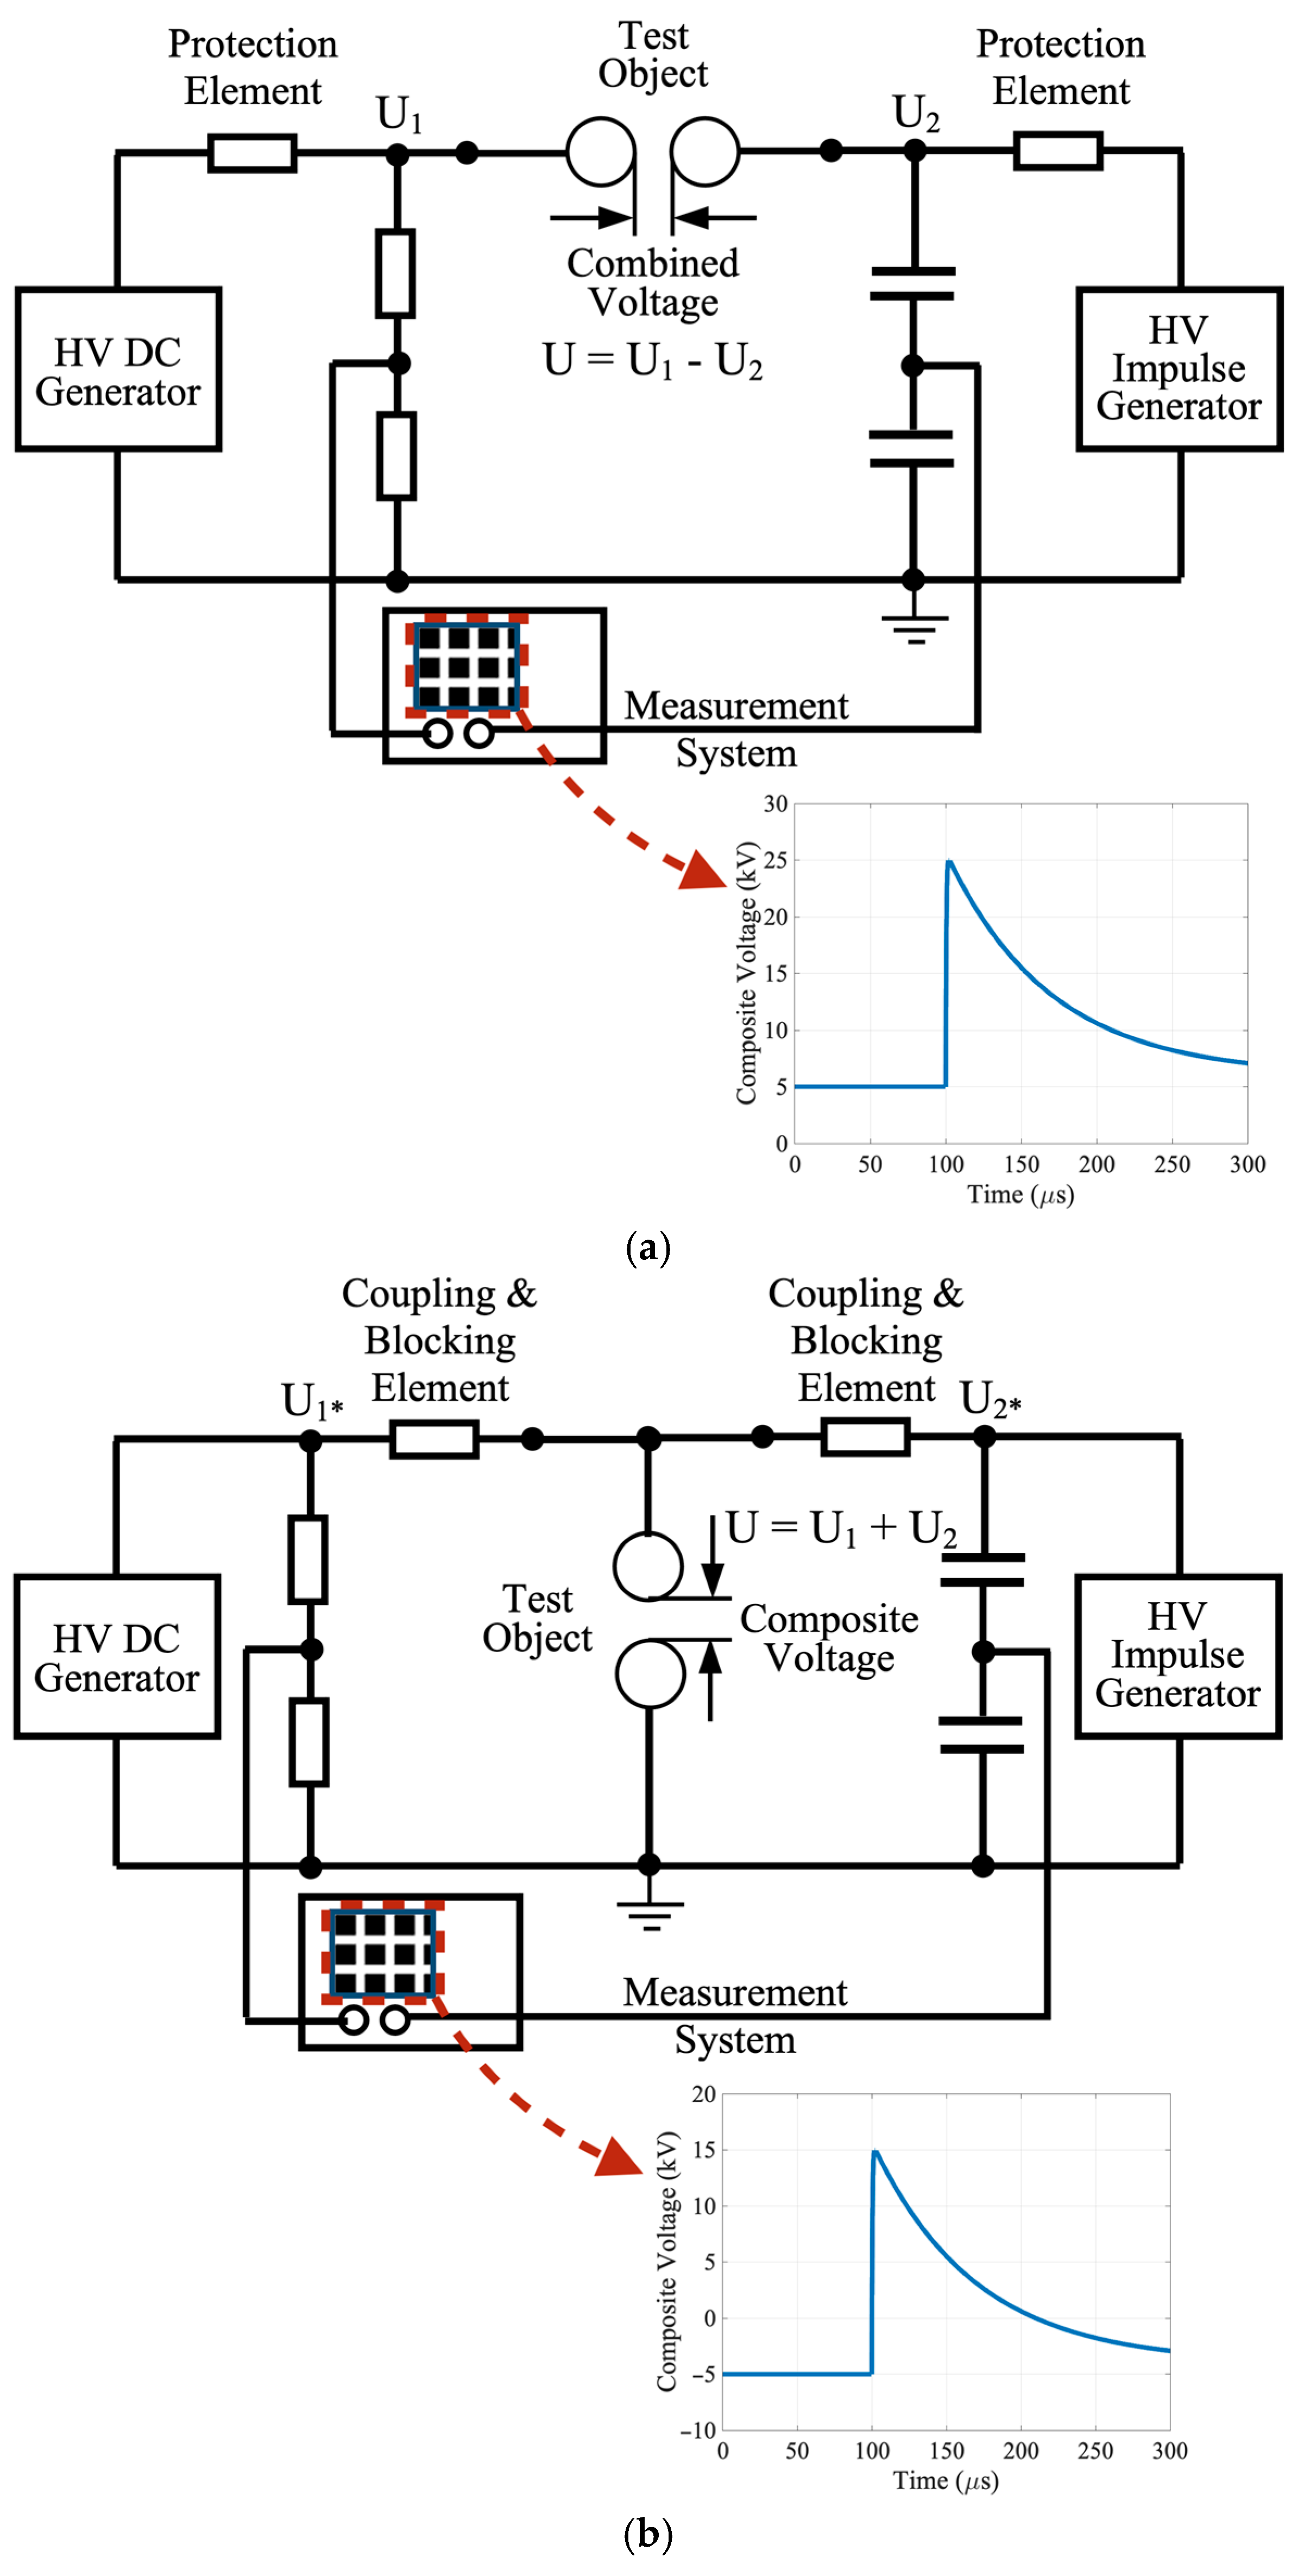
25]. They are created by the combination of two signals with different characteristics. Two types of circuits are used to generate mixed high voltages. The main difference between them is the position of the test object to which the mixed voltage is applied. The voltage that occurs in these two types of test circuits is called “composite voltage” or “combined voltage”. In the combined voltage circuit, the test object has three terminals, while in the composite voltage circuit, the test object has two terminals. The generation and measurement test circuit for combined voltage is given in Figure 2a. In this figure, a positive DC high-voltage source on the left side is seen. A positive lightning impulse generator on the right is seen. These voltages are applied to the test object from different terminals. The resulting combined voltage is shown in the bottom of the figure. Here, the resulting combined high voltage is applied to the test object from a different terminal. The generation and measurement test circuit for composite voltage is given in Figure 2b. In this figure, a negative DC high-voltage source on the left side is seen. A positive lightning impulse generator on the right is seen. These voltages are applied between the HV and ground terminals of the test object. The resulting combined voltage is shown in the bottom of the figure. Here, the resulting composite high voltage is applied to the test object from single terminals.
In this part of the study, a composite DC and LI voltage test circuit was established in the High Voltage and Diagnostic Laboratory of the TU Ilmenau in Ilmenau, Germany. First, analyses were made with a circuit simulation program in order to establish the most suitable circuit with the elements in the HV laboratory. Simulation studies were carried out with the elements in the laboratory to create lightning impulse voltages in accordance with the standards [7]. The lightning impulse generator and composite voltage generator designed are shown in Figure 3. There are two types of equivalent circuit models (“a” and “b” equivalent circuit models) that are frequently used to generate impulse voltages [6,
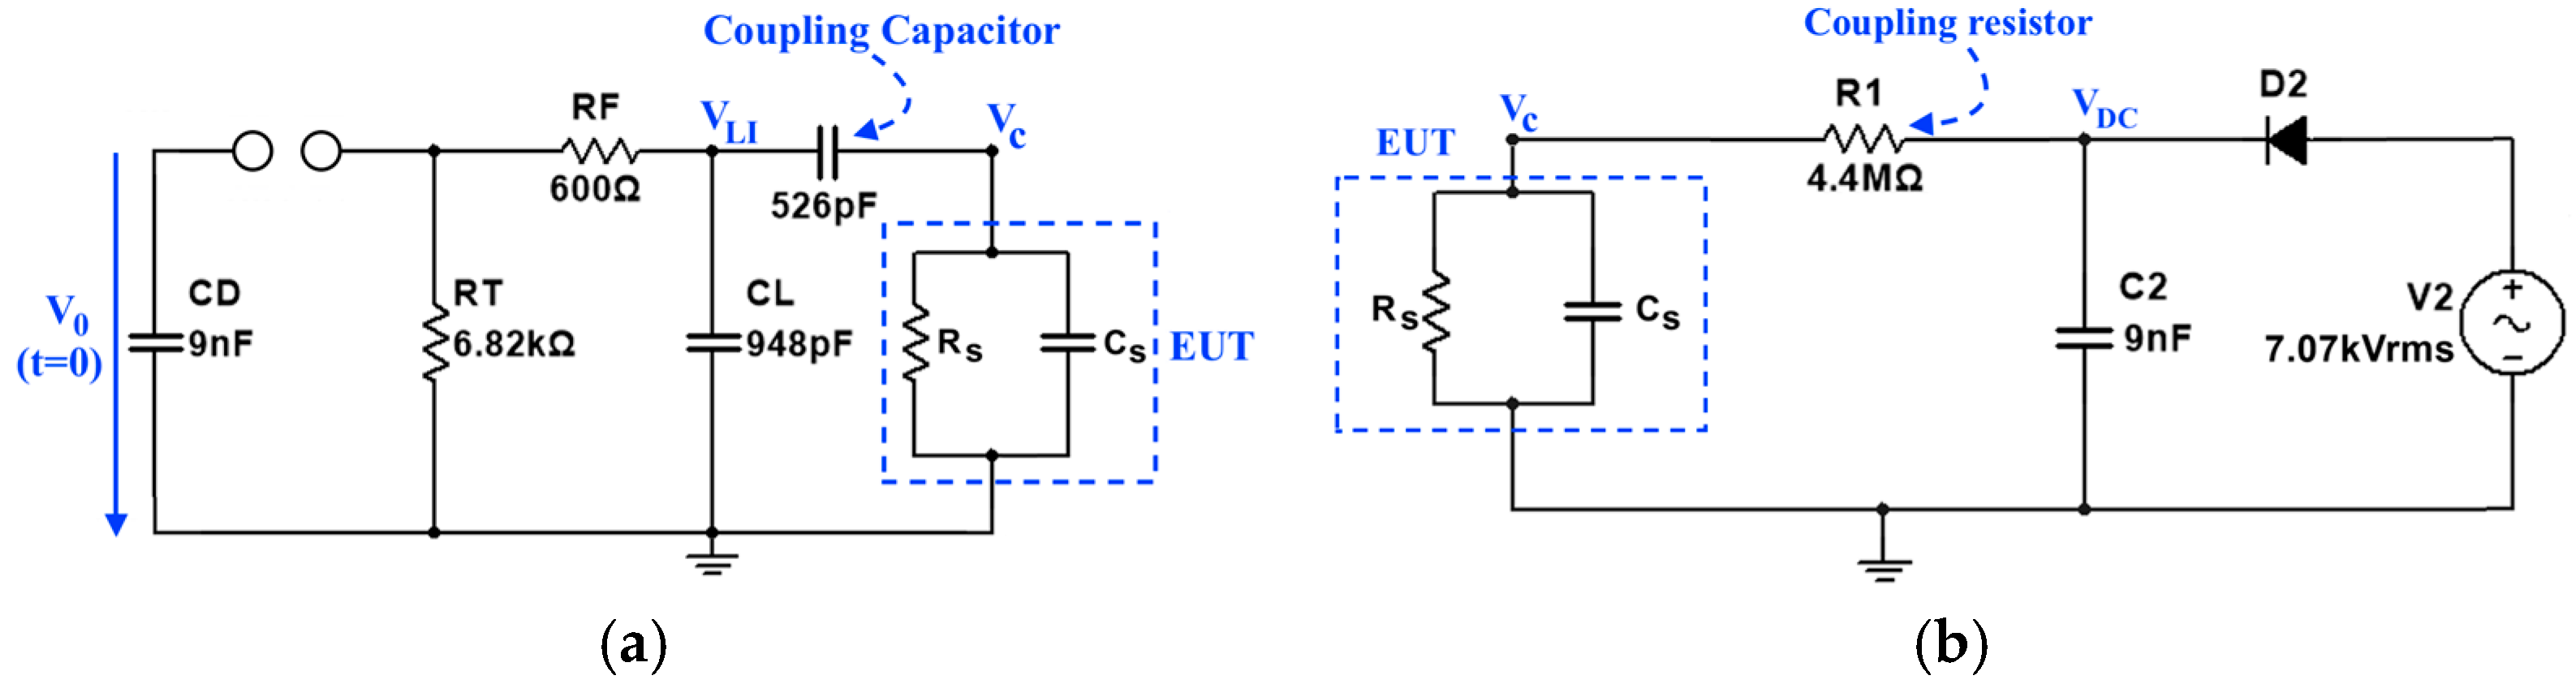
26]. The equivalent circuits of the LI and DC voltage side are shown in Figure 4. The voltage drop of the DC side can be easily calculated by Figure 4b, after the isolation between DC and LI sides. A non-ideal dielectric material is represented by a resistance and a capacitance connected in parallel or series [6]. The test object was represented with a parallel connection of a resistance Rs and a capacitance Cs. The voltage drop by coupling resistance on the DC side can be calculated by Equation (1).
% e = ( 1 R s R s + R 1 ) · 100 %
In this equation,
%e:Percent of voltage dropR1:Coupling resistor on DC side
Rs:Resistance of test sample
The front time T1 = 1.527 μs and time to half-value T2 = 49.51 μs was calculated for K1 = 2.96 and K2 = 0.73 by equations for lightning impulse voltage [6]. Later, time parameters and voltage parameters of the designed lightning impulse generator were measured on the simulation circuit. The front time T1 = 1.52 μs and time to half-value T2 = 50.165 μs were obtained by simulation software. These parameters are acceptable when compared to the time values of a standard lightning impulse generator (1.2 μs/50 μs). The allowed tolerances are ±30% for T1 and ±20% for T2. The efficiency factor of the designed lightning impulse generator was obtained as 90.47% and 86.7%, calculated by equations and simulation, respectively.
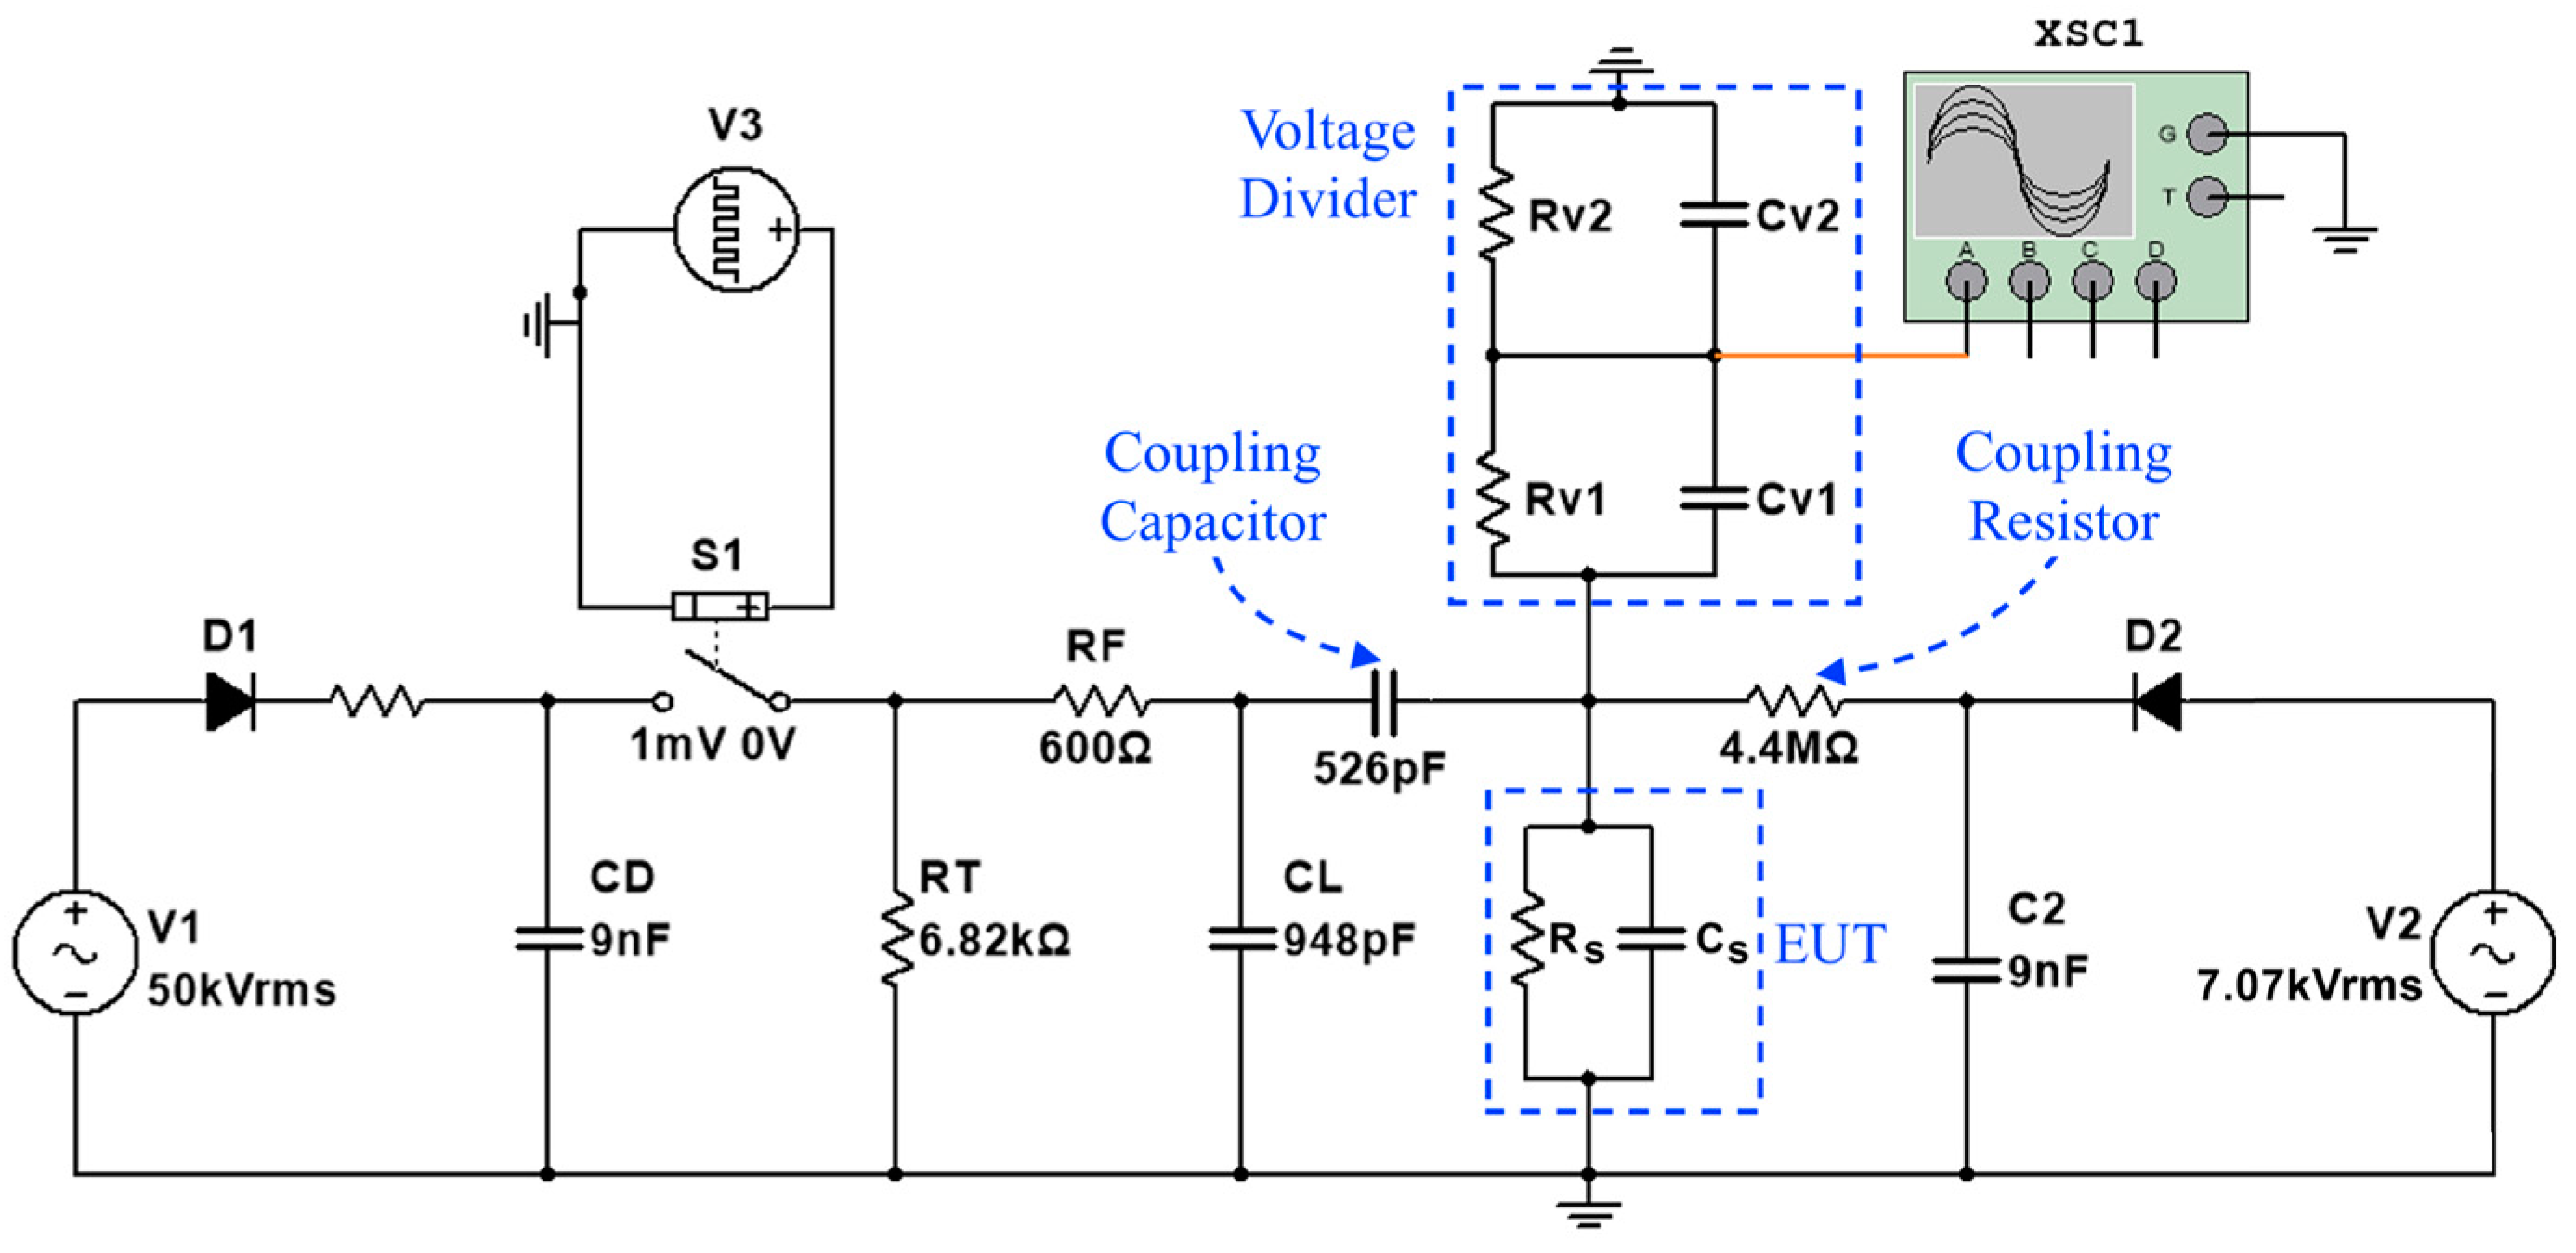
After designing the lightning impulse generator, some simulations were carried out in order to choose the coupling capacitance and the resistance in the test setup. These elements should be used to protect each voltage source from the voltage stress of each other. The coupling resistance and the capacitance of equipment under test (EUT) (Cs) work as a low-pass filter (LPF) to protect the DC voltage side from LI voltage stress. In contrast, the coupling capacitance at the LI voltage side works as a high-pass filter (HPF) against DC voltage stress [27]. The capacitance 
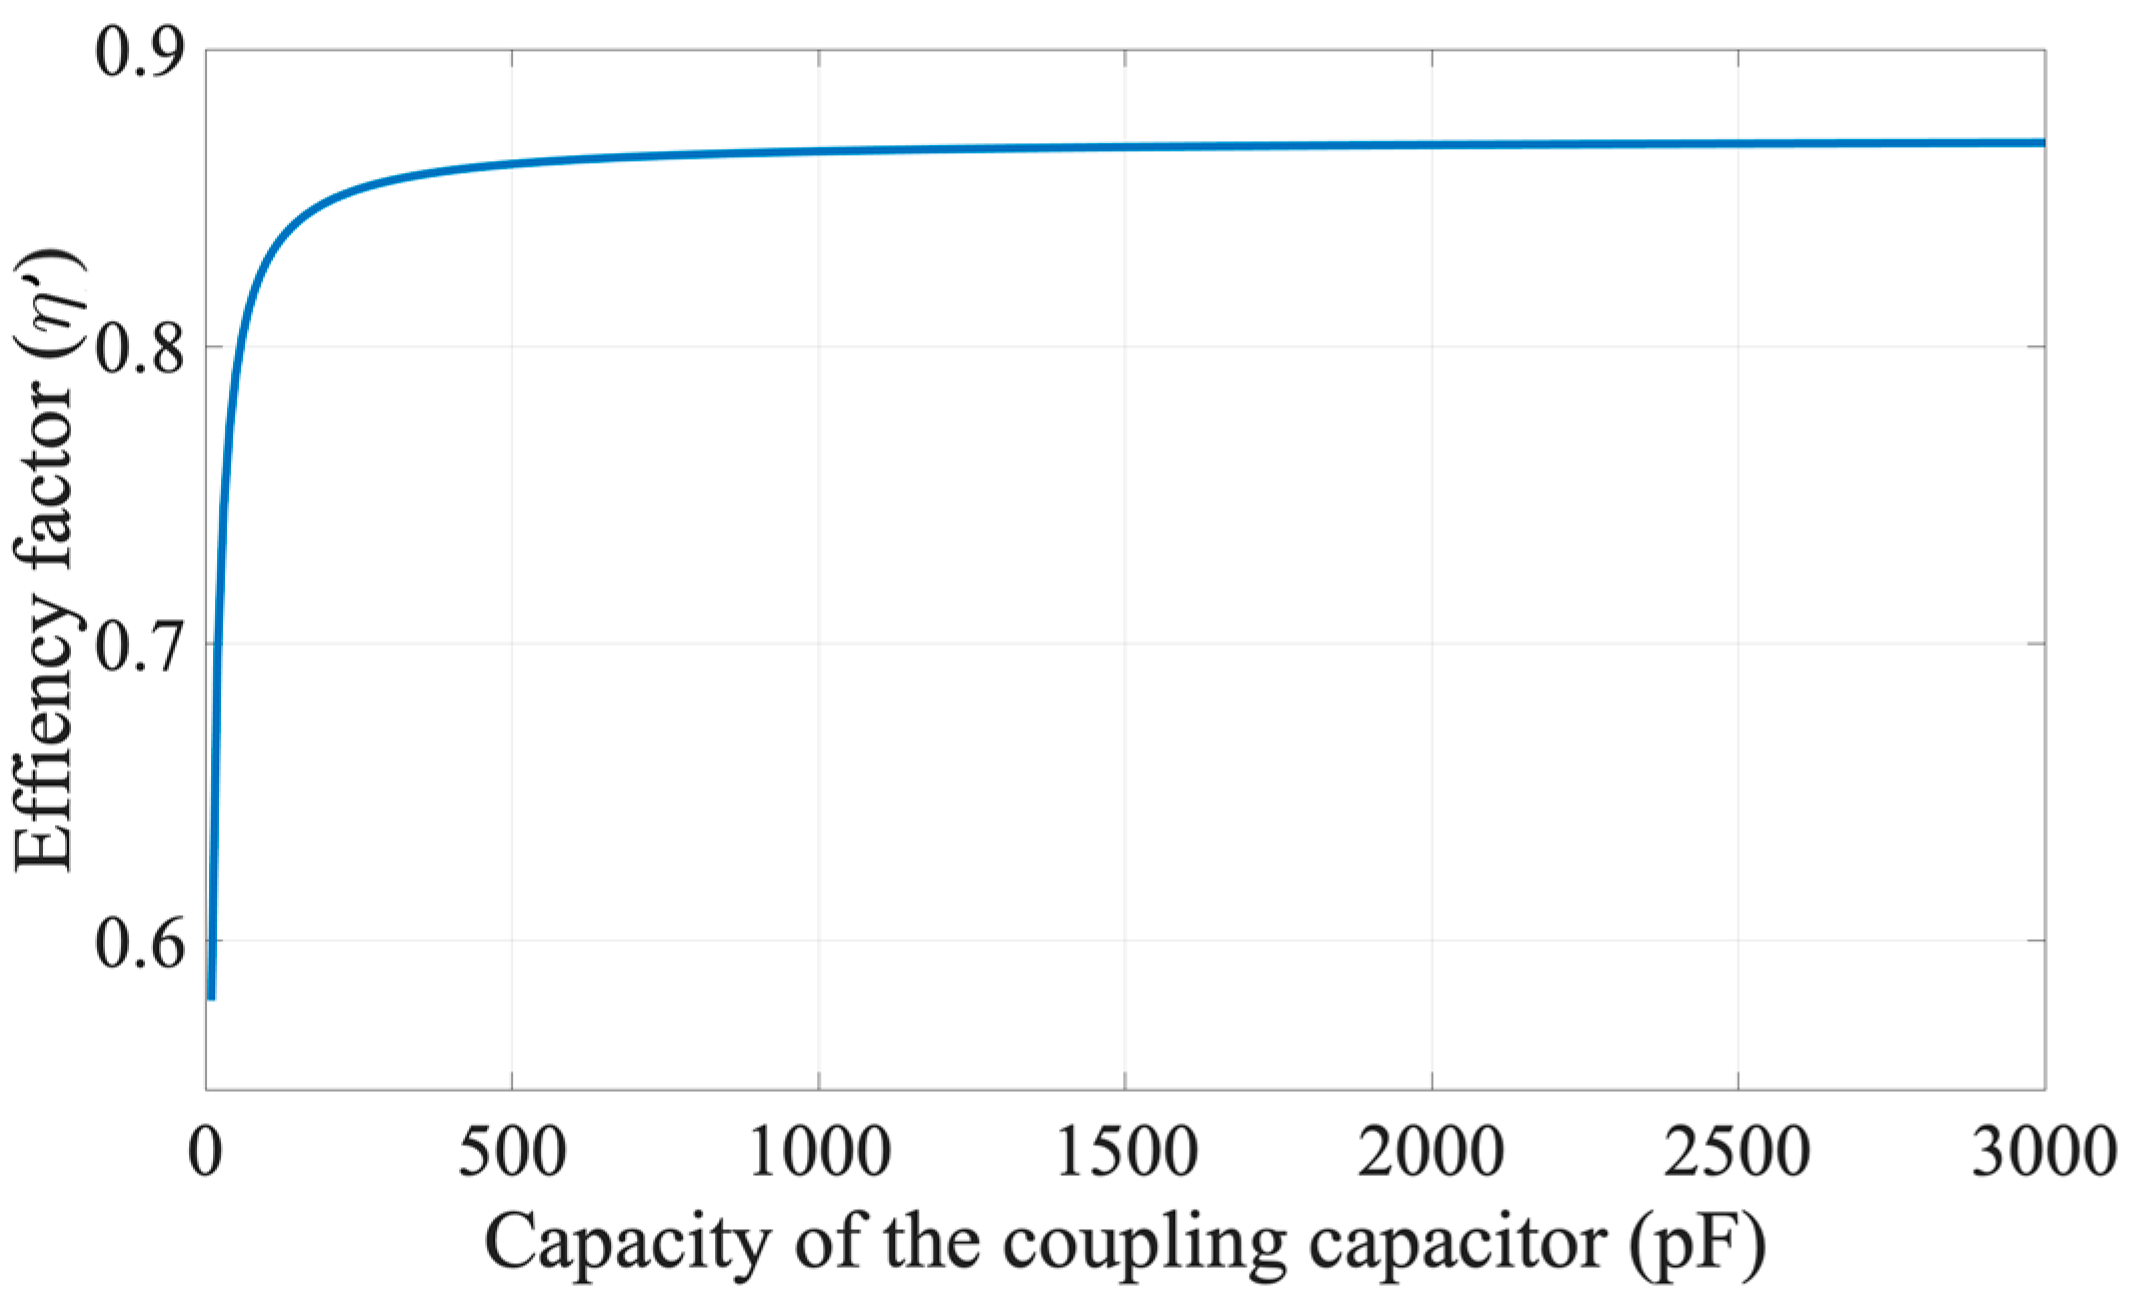
Cs of the EUT and the coupling capacitor CC act as a capacitive voltage divider, thus reducing the peak voltage of impulse at the EUT and efficiency of the impulse voltage source. The variation of the efficiency factor of the impulse voltage with respect to the coupling capacitor and the capacitance of EUT can be calculated with the following equation.
η = C C C C + C s · η
In this equation,
η :The efficiency factor of impulse voltage on EUTCC:Coupling capacitor on LI side
Cs:Capacitance of test sample η :The efficiency factor of impulse voltage
In Figure 5, the variation of the efficiency factor over the capacity of the coupling capacitor is shown. It can be seen in this graph that the selection of a coupling element above 500 pF is sufficient for the experiments to be carried out with the test object of 5 pF. The efficiency factor can decrease up to 0.6 at values below 500 pF depending on the coupling capacitance selected.
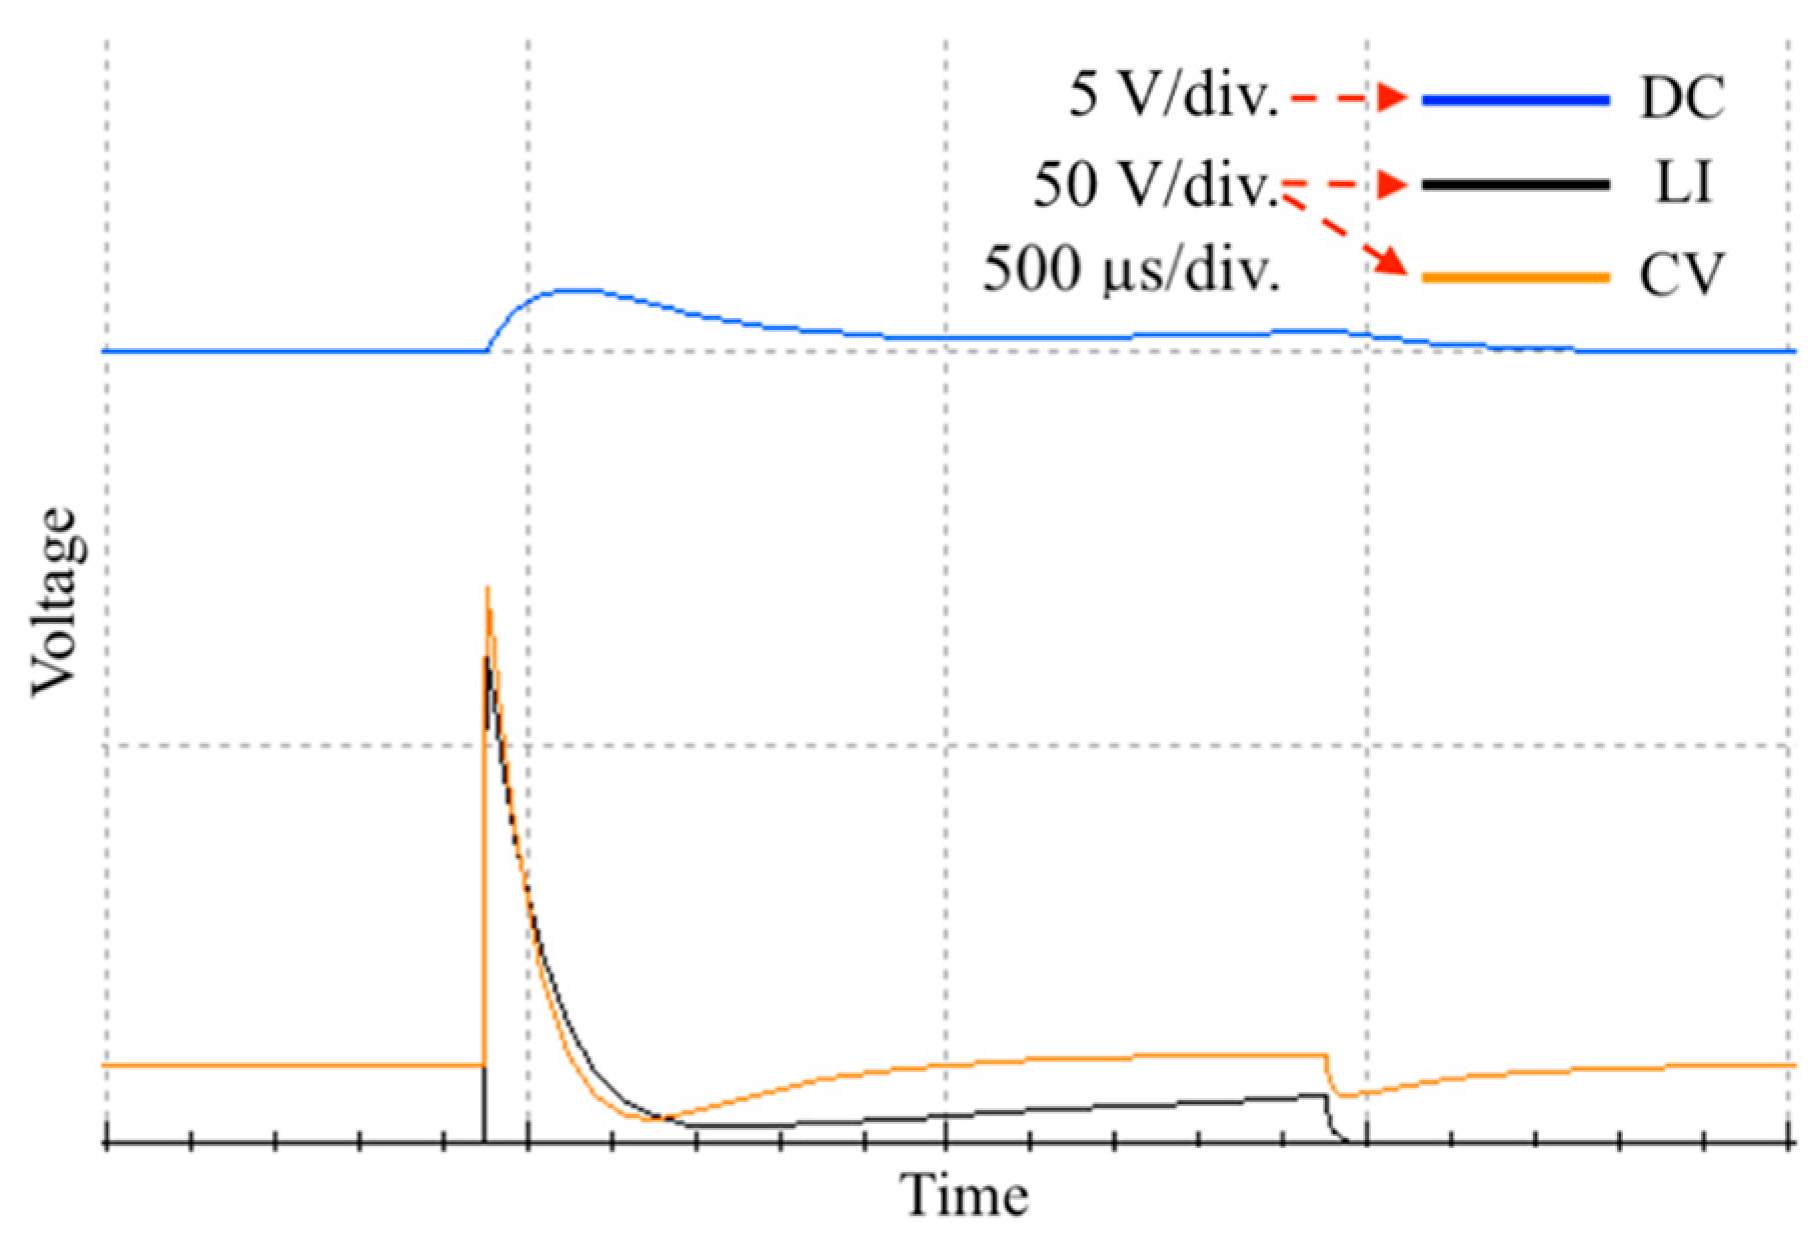
Then, to determine the value of the coupling resistance on the DC side, analyses were made according to the resistance values of the resistors available in the laboratory. This coupling resistance should not only extinguish lightning impulse but also limit the current from the DC voltage during charging of the equipment under test (EUT), as well as in case of failure. The waveforms obtained as a result of the analysis made with the 320 kΩ coupling resistor are shown in Figure 6. Here, with the generation of lightning impulse voltage, a ripple in DC voltage occurred for 320 kΩ. This ripple was about 8% of the mean value of the DC voltage. Then, these analyses were repeated with 2.2 MΩ, 4.4 MΩ and 16.5 MΩ. The ripple was about 2% for 2.2 MΩ, while no significant ripple was observed for 4.4 MΩ and 16.5 MΩ. After this analysis, we decided to use the resistance of 4.4 MΩ for coupling resistance. The conversion ratio of voltage dividers on these simulations is 1000:1.
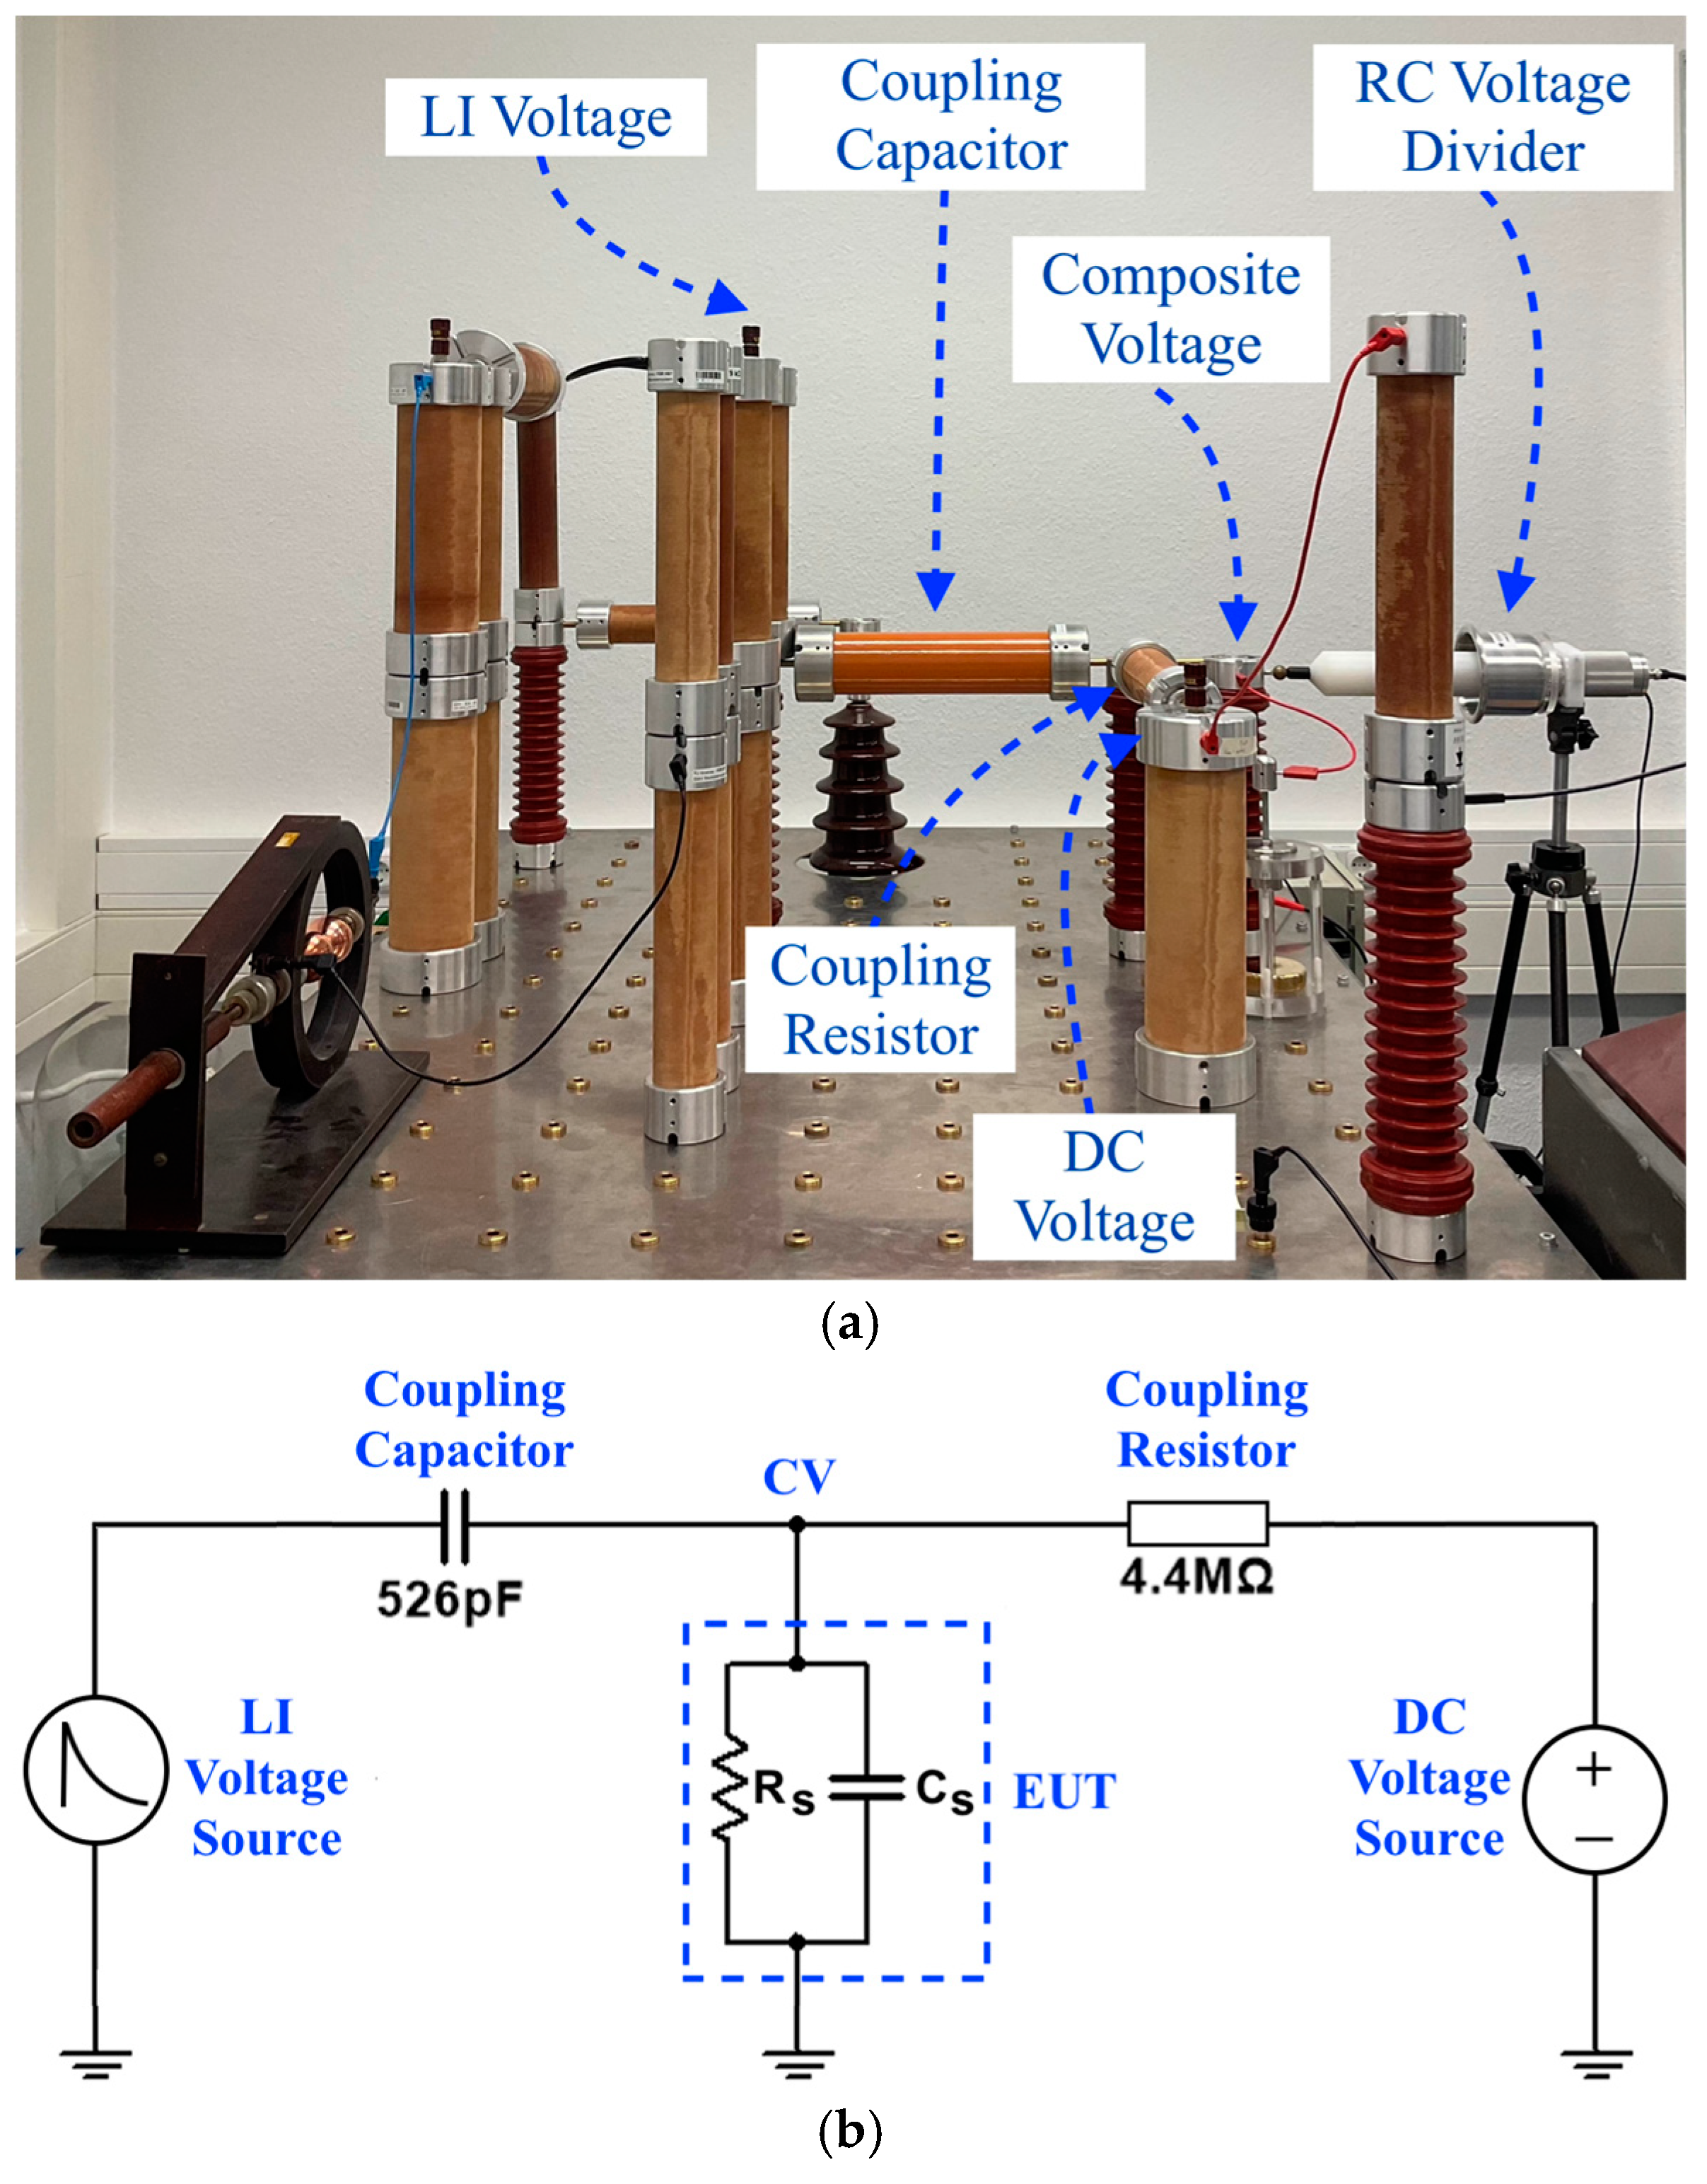
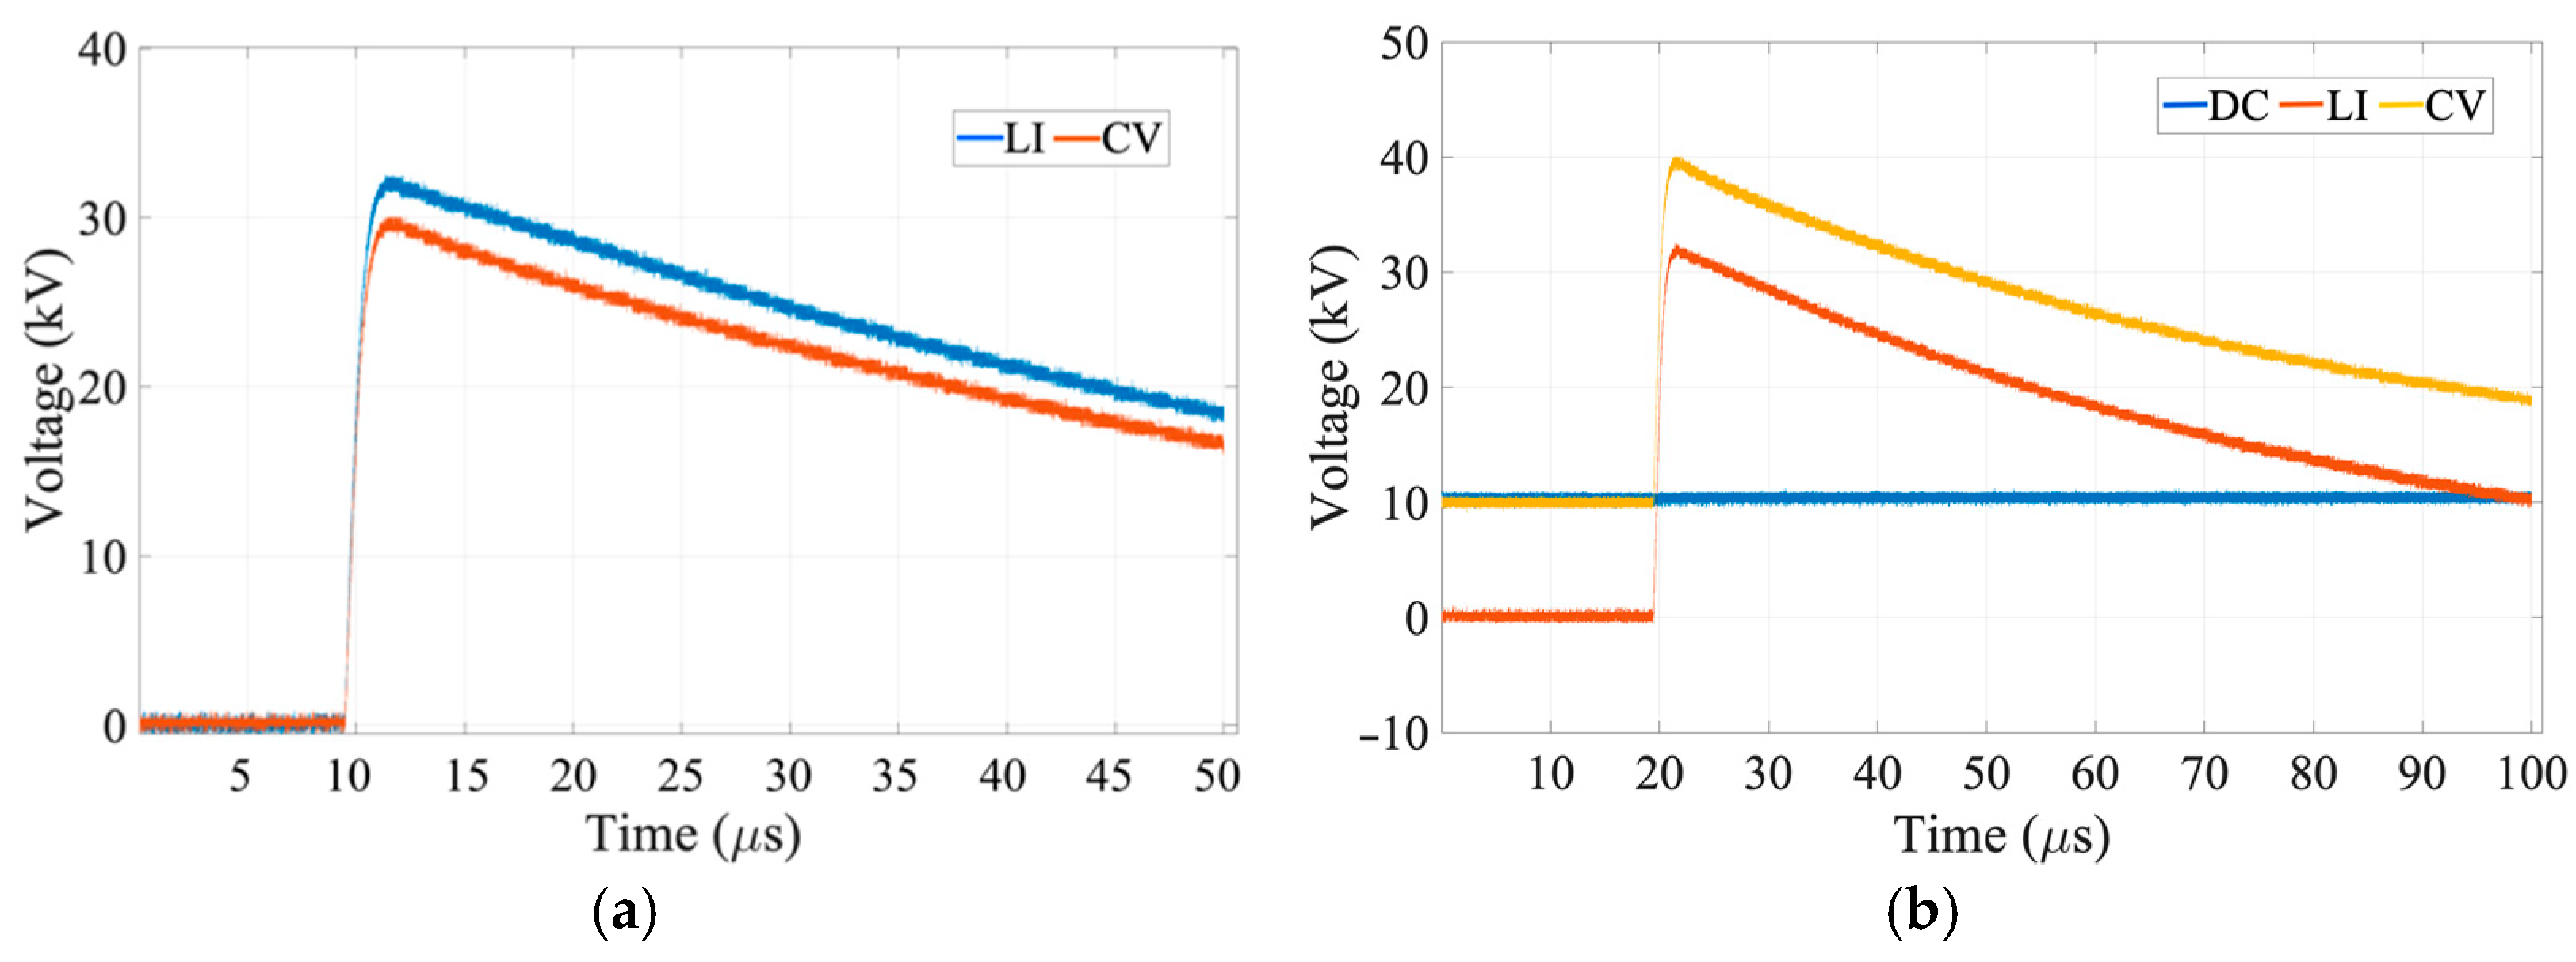
After these analyses, the generation circuit of the composite DC and LI voltage was established in the HV and Diagnosis Laboratory of TU Ilmenau. The experimental setup and its equivalent circuit are shown in Figure 7. A 50 kV high-voltage test transformer was used for the LI voltage side and a 30 kV test transformer was used for the DC voltage side. A spherical electrode system was used for the lightning impulse tests. Composite voltage waveforms were recorded with an oscilloscope via the North Star PVM 5-2 capacitive–resistive voltage divider. The conversion ratio of the capacitive–resistive voltage divider used is 2000:1. The bandwidth of the used oscilloscope is 200 MHz, and the sampling rate is 2.5 GS/s. Voltage waveforms measured at the input of coupling capacitor and output of coupling capacitor are shown in Figure 8a. The composite DC and LI voltage generated by superimposing the 10 kV + DC and the peak value of almost 32 kV +LI voltages is shown in Figure 8b. The peak value of composite voltage is almost 40 kV. While the reduction of the peak voltage was approximately 6.5% for a 526 pF coupling capacitor, it was measured to be approximately 4.5% for 1037 pF. The breakdown voltages for 1037 pF and 526 pF are 40 kV and 80 kV, respectively.

3. Test Procedure and Assessment of Experiment Results

3.1. The Application and Assessment of Composite Experiment Results

Breakdown experiments under composite DC and LI voltage were performed for less uniform and non-uniform electric fields. A sphere–sphere electrode system was used for the less uniform electric field, and two different rod electrodes with different radii of curvature, a plane electrode system and a needle–plane electrode system were used for the non-uniform electric field. All experiments were carried out in vertical electrode arrangement. The electrode systems used for less uniform and non-uniform electric field experiments are shown in Figure 9. Electrode surfaces were cleaned with polishing material and isopropyl alcohol before experiments. The ambient conditions (humidity, temperature and pressure of air) were continuously monitored and recorded during the experiments by Greisinger GFTB 200 hygro-/thermo-/barometer at 10 min intervals. The measured breakdown voltage values were multiplied by the air density correction factor [7] so that breakdown voltages were normalized.
While obtaining composite voltage by superimposing voltages of different polarities, there are four different combinations. In this study, the possible situations for superimposing DC and LI voltages used are as follows:
(a)
The superposing of pre-stress +DC and +LI voltages;
(b)
The superposing of pre-stress −DC and −LI voltages;
(c)
The superposing of pre-stress +DC and −LI voltages;
(d)
The superposing of pre-stress −DC and +LI voltages.
Of these superposing states, (a) and (b) are called unipolar composite voltages, while (c) and (d) are called bipolar composite voltages. In Figure 10, waveforms for different superposing states of 5 kV ±DC and 20 kV ±LI voltages are shown.
In previous studies, the “four-quadrants diagram” was used to show the test results under composite voltage generated by superimposing voltages of different polarities [11,27,28]. The four-quadrants diagram is shown in Figure 11. By this diagram, the breakdown voltage results in four different superposing states shown in Figure 10 can be effectively displayed. In this diagram, the value of the applied DC voltage pre-stress is positioned along the x-axis, while the value of the composite voltage is positioned along the y-axis. The breakdown voltage results are located in the I and III quadrants for the case of a unipolar superposing, while the breakdown voltage results for the case of a bipolar superposing are located in the II and IV quadrants. In Figure 11, positive and negative CV with a peak value of 10 kV is shown as an example for unipolar (P1) and bipolar (P2) superposing states, respectively. In these examples, the blue arrow indicates the positive DC voltage pre-stress value (3 kV), while the red arrow indicates the positive and negative LI voltage stress.
In this study, experiments were carried out with both positive and negative DC voltage pre-stress for unipolar and bipolar superposing states. A constant DC voltage pre-stress during 60 ± 5 s was applied between the electrodes, and no fluctuation in DC voltage pre-stress was observed. Later, twenty impulse voltage shots were superimposed on DC voltage pre-stress. To ensure the reliability of the experiments, the experiments were repeated five times for below and above 50% breakdown voltage. Experiments were performed for both unipolar and bipolar superposing states. While the breakdown voltage results obtained are given, the four-quadrants diagram is divided into two parts for +LI and −LI in order to increase the visuality of the graphs. The four-quadrants diagram is split in this way because the applied DC voltage pre-stress is a variable parameter and an integer value.

3.2. Obtaining 50% Breakdown Voltage

Breakdown phenomena under impulse voltage is a statistical event. The impulse breakdown voltage can be obtained by applying a plurality of consecutive impulse voltages. The distribution of the breakdown probability function is shown in Figure 12 [6]. In this graph, the highest voltage value at which no breakdown occurs is defined as 0% breakdown voltage, and the lowest voltage value at which breakdown occurs in all applied impulses is defined as 100% breakdown voltage. In the literature, 50% breakdown voltage is frequently used to describe the breakdown characteristic of insulating materials under impulse voltage [6,11,16]. It is the voltage value at which the breakdown occurs in half of a certain number of applied impulse voltages. In practice, it is difficult to find the exact 50% breakdown voltage experimentally, so there are often points that are slightly above and below 50% breakdown voltage. Then, 50% breakdown voltage can be calculated using these values by probability distribution functions and/or curve-fitting methods.
In this study, 50% breakdown voltage can be found by the curve-fitting method, assuming that between 20% and 80% of the breakdown probability of the distribution function in Figure 12 is linear. In each experiment, twenty lightning impulse shots were applied, and the breakdown probability was obtained for the applied voltage value by counting the number of breakdowns occurring between the electrodes. Firstly, points below and above 50% breakdown voltage were found experimentally, and then 50% breakdown voltage was calculated by the least-squares method. Regression analysis is a conceptually simple method to investigate functional relationships among variables [29]. In the investigation of experimental studies, it is desirable to find a function that models the collected data. It is often very difficult to find a function that fits these data exactly, and different regression analysis methods are used to determine the most suitable function for the data collected. It finds the best function to match the data, minimizing the square error. One of the most used methods in regression analysis is the least-squares method. It is used when determining variables in various branches such as finance, engineering, etc. [30,31]. Linear regression is a linear approach that reveals the relationship between a dependent variable and one or more independent variables. In this study, we assumed 20% to 80% of the breakdown probability curve to be linear and used linear regression to find the 50% breakdown voltage. If we define the linear regression Equation as in (3), m and b values are found by the least-squares method with Equations (4) and (5), respectively. In these equations, x ¯ is the mean of all values at input x , while y ¯ is the mean of all values at output y . n is the length of the data set.
y = m x + b
m = i = 1 n ( x i x ¯ ) ( y i y ¯ ) i = 1 n ( x i x ¯ ) 2
b = y ¯ m x ¯

4. The Breakdown Results under Composite DC and LI Voltage for Different Electric Fields

4.1. The Experimental Results in Less Uniform Electric Field

Breakdown experiments under composite DC and LI voltage in the less uniform electric field were performed with spherical electrodes having a diameter of 50 mm in air. Experiments were carried out for unipolar and bipolar superposing conditions at 10 mm gap spacing. The highest, lowest and arithmetic mean values of the ambient conditions measured during these experiments are shown in Table 1. The variation of 50% breakdown voltage according to different +DC and −DC voltage pre-stress under composite DC and LI voltage is shown in Figure 13. The breakdown voltages under positive and negative DC voltage stress are equal to breakdown voltages under positive and negative LI voltage stress. This is an ordinary result in a less uniform electric field anyway. The breakdown voltages measured under bipolar CV stress decrease with increasing DC voltage pre-stress. This situation is the same for both positive and negative DC voltage stress. The maximum reduction of breakdown voltages at bipolar CV stress is approximately 2% and 4.5% for positive and negative DC voltage pre-stress compared to LI voltage stress, respectively. In contrast, the breakdown voltages measured under unipolar CV stress increase with increasing DC voltage pre-stress. While this situation slightly increases for negative DC voltage pre-stress up to 15 kV, it is clearly seen after 15 kV. The rise of breakdown voltage at unipolar CV stress is about 2.5% maximum for negative DC voltage pre-stress compared to negative LI voltage stress. While breakdown voltages increase slightly with increasing positive DC voltage pre-stress outside 20 kV, it is clearly seen at 20 kV DC voltage pre-stress, and its rise is about 2% maximum.

4.2. The Experimental Results in Non-Uniform Electric Field

For the breakdown voltage experiments in the non-uniform electric field, two rod electrodes with different radii of curvature and needle electrodes were used for the high potential electrode. For the ground electrode, a disk-shaped plane electrode with a diameter of 86 mm was used. Thus, three different non-uniform electric fields with different homogeneity were obtained. These rod and needle electrodes used for the high potential electrode are shown in Figure 14.
Breakdown experiments under composite DC and LI voltage were performed with a rod electrode with a curvature diameter of 6 mm and a plane electrode in air. The experiments were repeated for 5 mm, 10 mm and 15 mm gap spacing. The variation of 50% breakdown voltage according to different +DC and −DC voltage pre-stress under composite DC and LI voltage is shown in Figure 15. The highest, lowest and arithmetic means of the ambient conditions measured during these experiments are shown in Table 2. The breakdown voltages under positive LI are lower than under negative LI. These results are the same for all gap spacing of this electrode system. These results are very ordinary in a non-uniform electric field. The breakdown voltages at unipolar CV with positive DC voltage pre-stress increase with increasing DC voltage pre-stress.
The maximum increase in breakdown voltage occurred when a 12 kV (for d = 15 mm and 10 mm) and 10 kV (for d = 5 mm) DC pre-stress were applied, and they were 21.9%, 12.4% and 7.7% for 5 mm, 10 mm and 15 mm compared to LI voltage stress, respectively. On the other hand, the breakdown voltage at bipolar CV with negative DC voltage pre-stress tends to decrease with increasing DC voltage pre-stress.
Breakdown experiments under composite DC and LI voltage were performed with a rod electrode with a curvature diameter of 1 mm and a plane electrode in air. The experiments were carried out for 15 mm gap spacing. The variation of 50% breakdown voltage according to different +DC and −DC pre-stress under composite DC and LI voltage is shown sin Figure 16. The maximum, minimum and arithmetic mean of the ambient conditions measured during these experiments are shown in Table 3. The breakdown voltages under positive LI voltage are lower than under negative LI voltage. The breakdown voltages at unipolar CV for both positive and negative DC voltage pre-stress increase with increasing DC voltage pre-stress. All measured breakdown voltages under unipolar positive CV are almost equal to or greater than at LI voltage stress. With increasing DC voltage, the breakdown voltages at bipolar CV for both positive and negative DC voltage pre-stress remain almost stable up to ±8 kV DC voltage compared to positive and negative LI voltage. In addition, they decrease dramatically at DC voltages greater than this value compared to positive and negative LI voltages. Thus, the breakdown voltage at bipolar CV with negative and positive DC voltage pre-stress tends to decrease with increasing DC voltage pre-stress.
Breakdown experiments under composite DC and LI voltage were performed with needle and plane electrodes in air. Experiments were carried out for 15 mm gap spacing. The variation of 50% breakdown voltage according to different +DC and −DC pre-stress under composite DC and LI voltage is shown in Figure 17. The maximum, minimum, and arithmetic mean of the ambient conditions measured during these experiments are shown in Table 4. The breakdown voltages under positive LI voltage are lower than under negative LI voltage. The breakdown voltages under unipolar CV with positive LI voltage superimposed increase with increasing DC voltage pre-stress up to 4 kV and decrease dramatically at 6 kV and 8 kV positive DC voltages pre-stress compared to positive LI voltage. Conversely, it increases again at +12 kV DC voltage pre-stress compared to positive LI voltage. On average, taking into account all results for unipolar CV with positive DC voltage pre-stress, the breakdown voltage tends to increase with increasing DC voltage pre-stress. Only breakdown voltage at 8 kV positive DC voltage pre-stress is lower than +LI voltage. Additionally, in experiments repeated here for the same superposing condition, the measurement results were very scattered. The breakdown voltages for this superposing condition were highly affected by the applied DC voltage pre-stress and did not display a stable behavior. The breakdown voltages under bipolar CV with positive LI voltage superimposed remain almost constant with increasing DC voltage pre-stress up to −6 kV and decrease dramatically at DC voltages greater than this value compared to negative LI voltage. For unipolar CV with negative LI voltage superimposed, the breakdown voltages increase slightly with −2 kV DC voltage pre-stress and remain constant at all applied DC voltages. The breakdown voltage at bipolar CV with negative LI voltage increases slightly at +2 kV DC voltage pre-stress. But, the breakdown voltage for this superposing condition decreases at +12 kV DC voltage pre-stress compared to negative LI voltage. In general, taking into account all results for unipolar and bipolar CV with positive and negative DC voltage pre-stress, the breakdown voltage at unipolar CV stress tends to increase with increasing DC voltage pre-stress, whereas the breakdown voltage at bipolar CV stress tends to decrease with increasing DC voltage pre-stress.

5. Electric Field Analysis of Electrode Systems used on Breakdown Tests by FEM

In this part of the study, the electric field analysis of the electrode systems used in the breakdown tests in air environment under CV was made with FEM. It is a numerical method often used for modeling engineering problems. FEM is widely used to evaluate the insulation performance of insulating material by obtaining the electric field distribution [
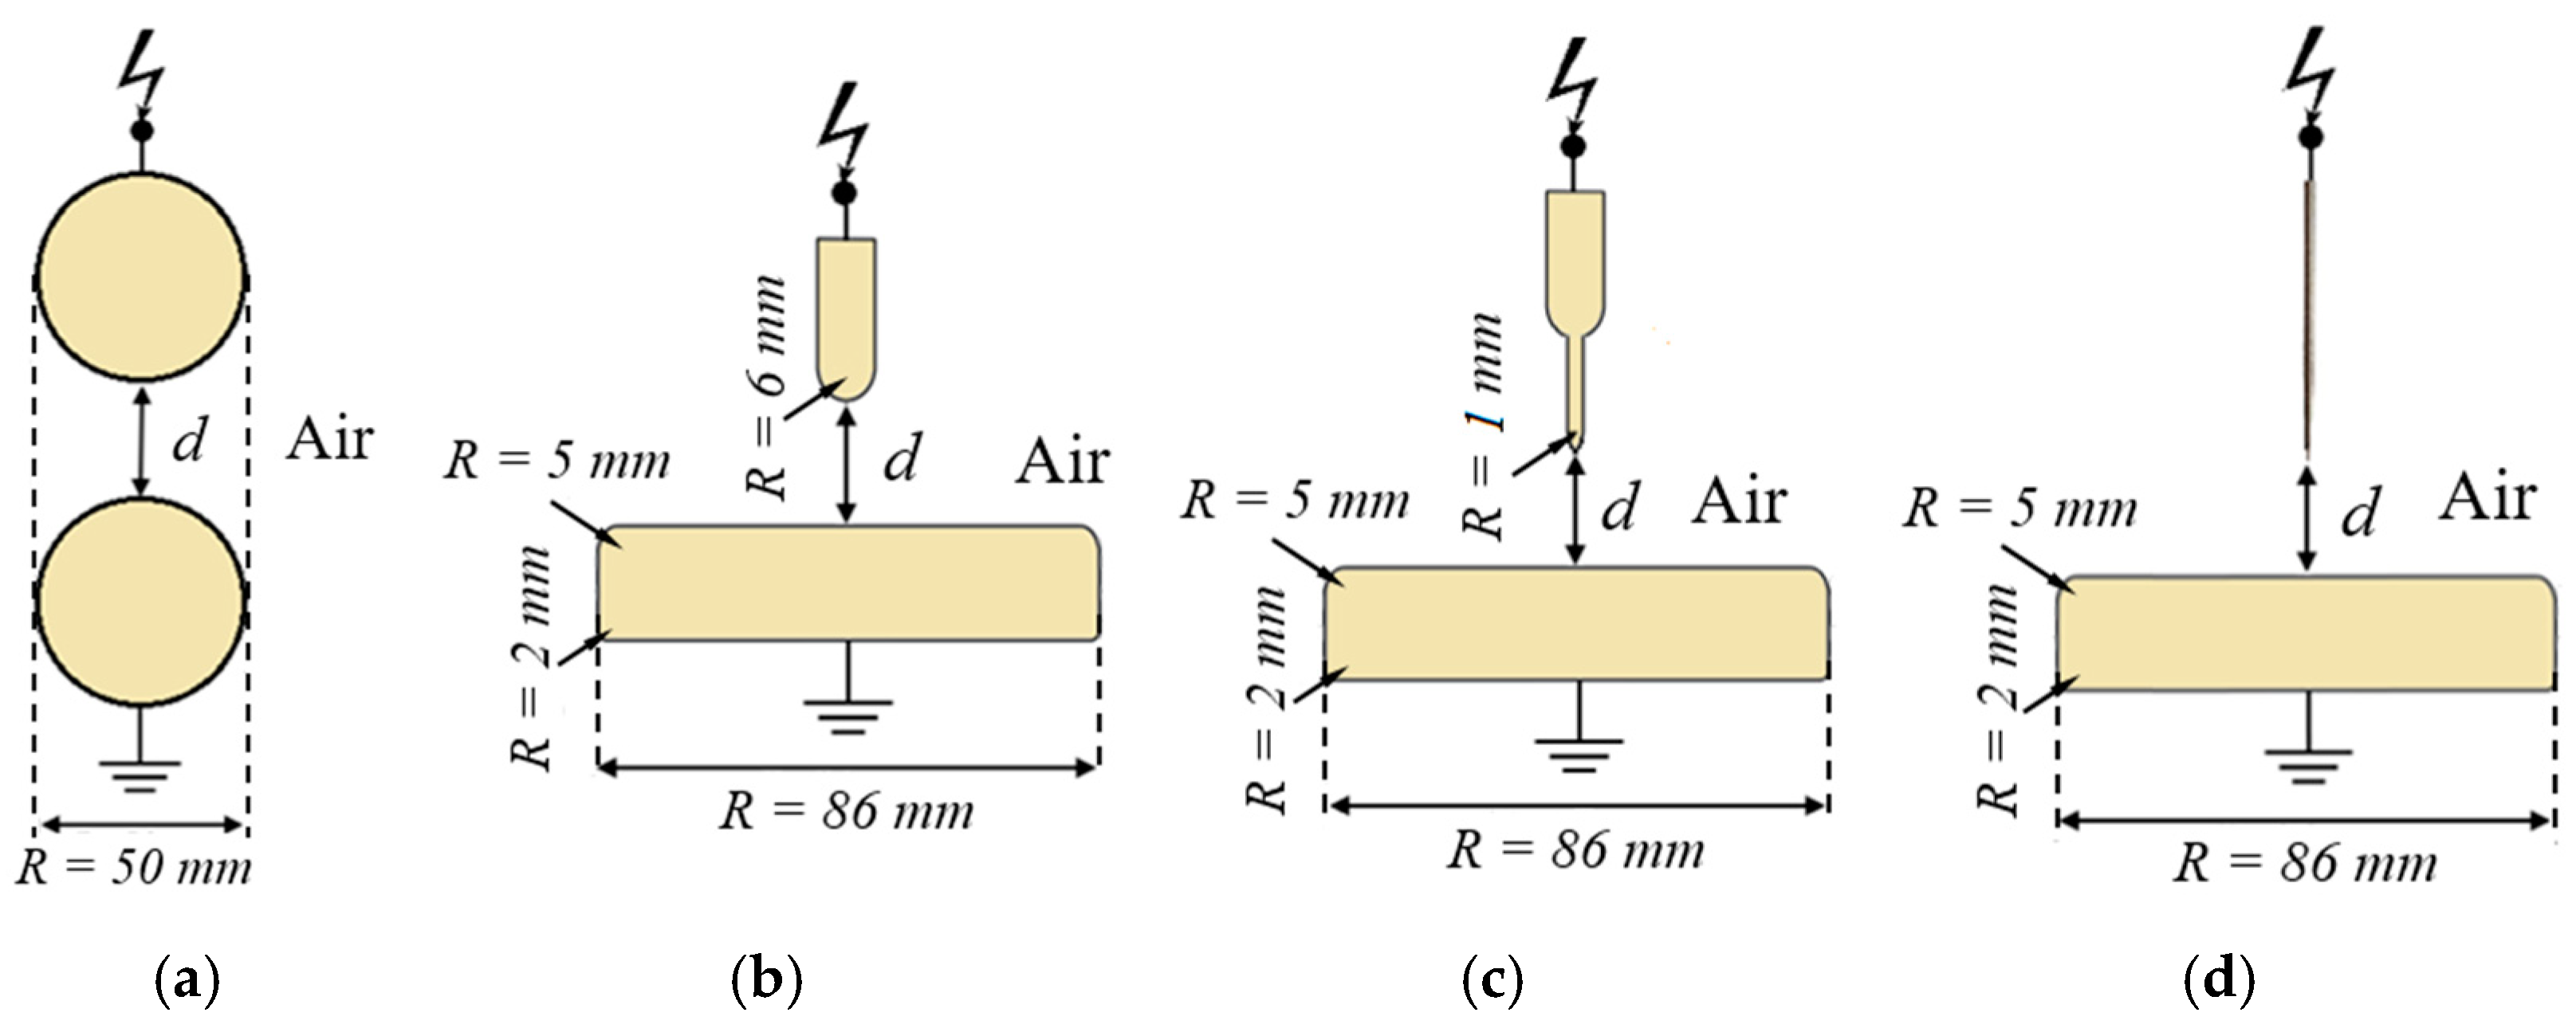
32]. Firstly, the geometric structure of the problem to be solved is drawn in the analysis made with FEM. The dimensions and shapes of the electrodes used in the breakdown experiments are shown in 
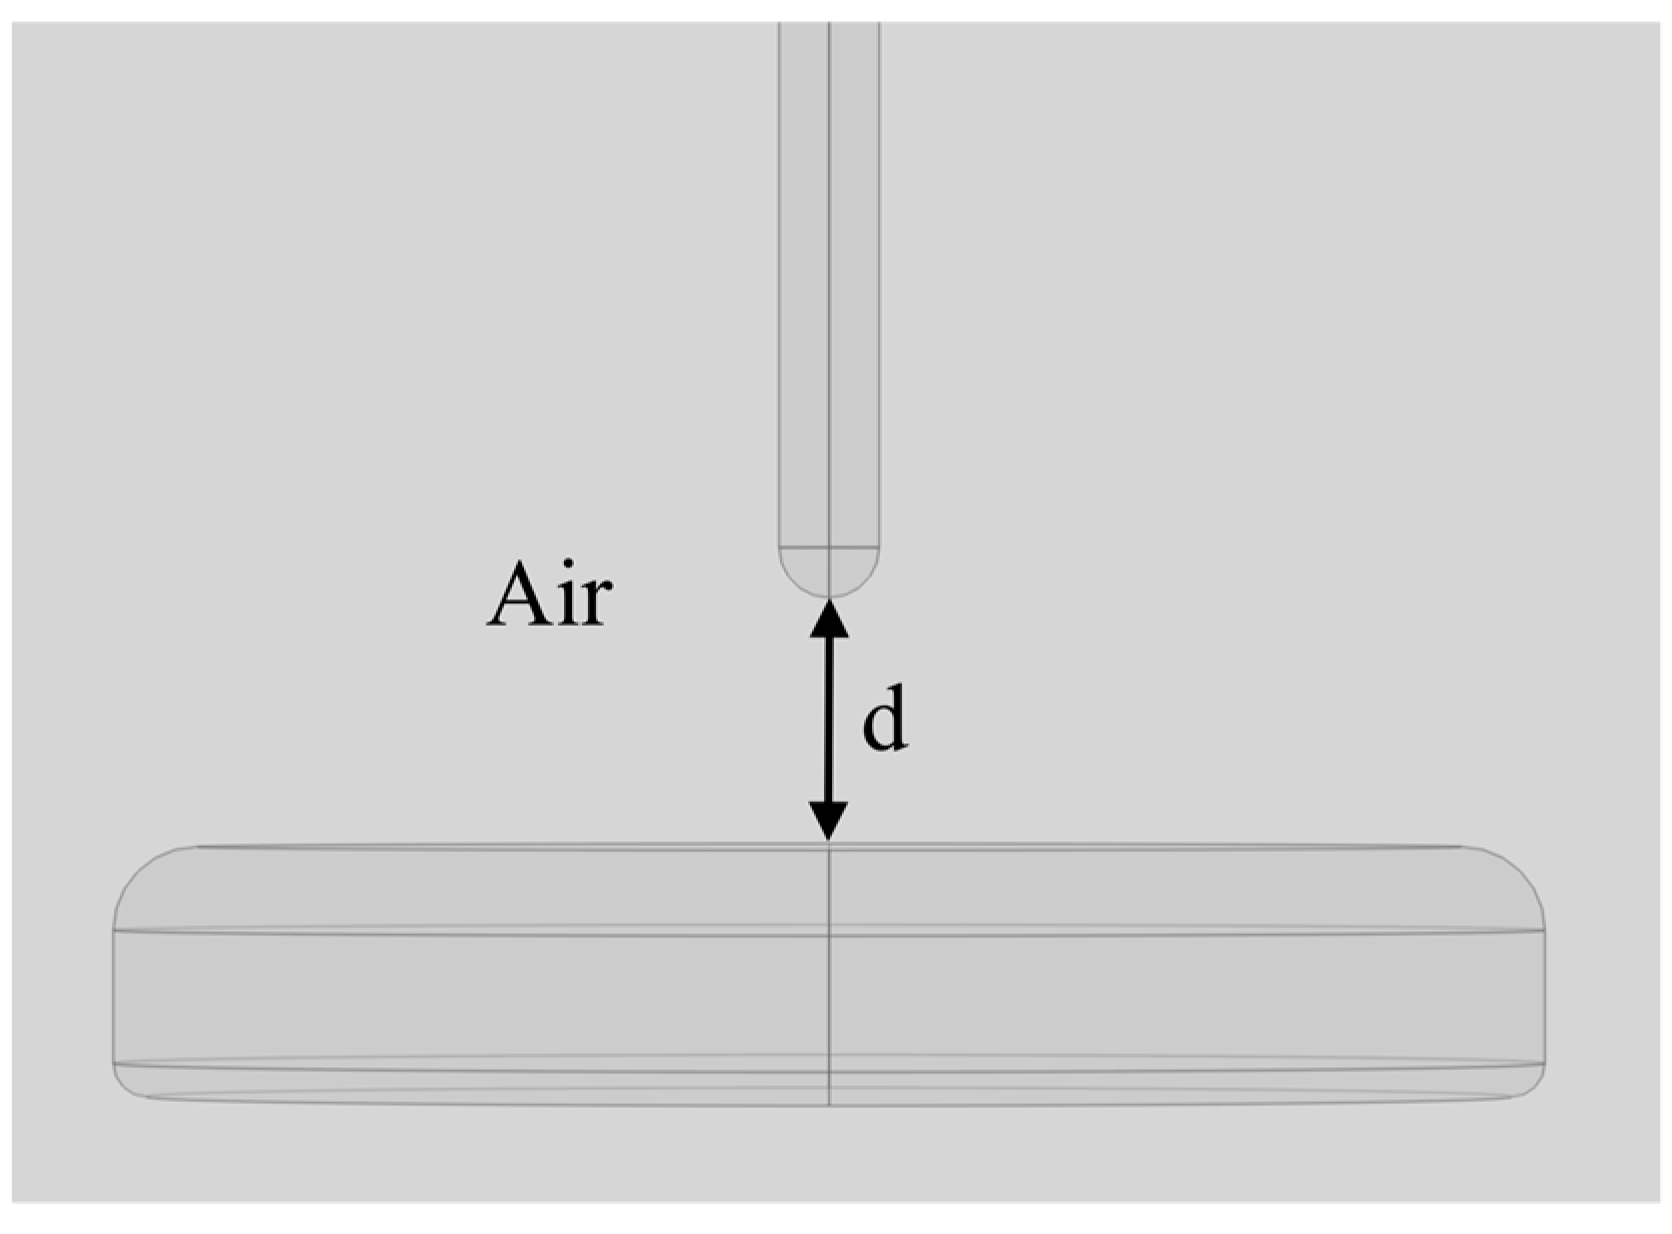
Figure 9. These electrode systems were drawn in 3D on a package program based on FEM, and an air environment was drawn outside the electrode system. The geometry of the model drawn for the rod (R = 6 mm)–plane electrode system in the package program is shown in Figure 18 as an example. In this figure, d is gap spacing. The all-electrodes system and gap spacing used on breakdown experiments were drawn to the package program in the same way. After this step, the materials of the problem and their properties were defined. After the materials and their properties are defined by geometry, the boundary conditions should be specified [33,34]. Then, 5 kV was applied to the rod electrode, and ground was applied to the plane electrode.
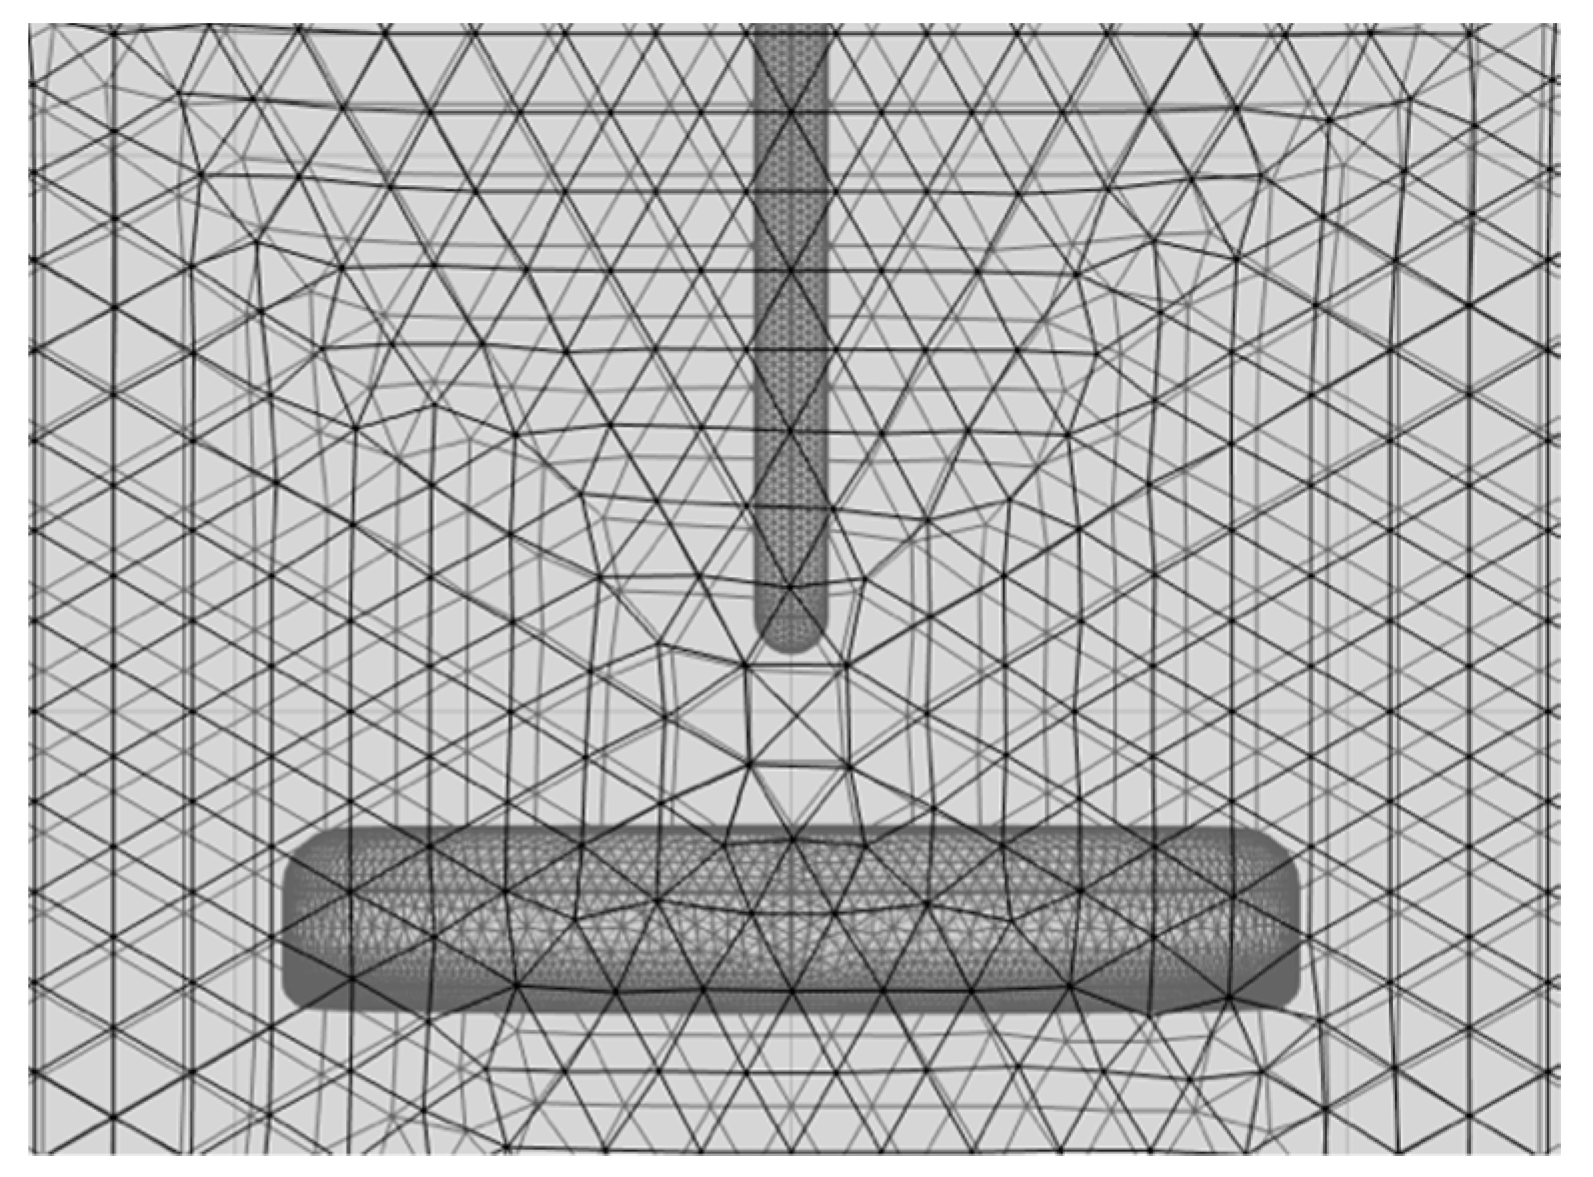
After the boundary conditions are defined, the geometry is divided into a finite number of tetrahedron elements. During this process, a basic equation is defined for each triangular element [33]. The meshed form of the electrode system, whose geometrical structure is depicted in Figure 18, is shown in Figure 19.
Finally, a set of mathematical equations is obtained from all these definitions, and it is solved by the package program. The equations defined in the model are given below in Equations (6)–(8). The electric field results of electrode systems were obtained by solving the equation system.
· J = Q j
J = σ E + J e
E = V
In these equations,
:Differential operator (nabla) V :Applied voltage [kV]
E :Electric field intensity [kV/cm] J :Current density [A/m2]
J e :External current density [A/m2] Σ :Electric conductivity [S/m]
Q j :Current source [A/m3]
All electrode systems and gap spacing used in the experiments were modeled by FEM. Then, maximum electric fields were calculated for different electrode systems and gap spacing with the created FEM model. The maximum electric field and electric field distribution for different electrode systems are shown in Figure 20. As can clearly be seen here, the maximum electric field increases with decreasing radius of curvature of the high potential electrode. This increase is dramatically high for the cases shown in Figure 20b,c.

6. The Relationship between Breakdown Results and Electric Field Analysis and Discussion

In the non-uniform electric fields, discharge always starts at the electrode with the smaller radius of curvature and grows depending on the polarity of the electrode. In the arrangement where the rod electrode is negative and the plane electrode is ground, the first electron avalanche starts directly from the cathode and grows in the anode direction. Meanwhile, the positive ions in the avalanche body strengthen the electric field in the direction of the cathode and weaken it in the direction of the anode. On the other hand, in the arrangement where the rod electrode is positive and the plane electrode is ground, the discharge mechanism shows a different character. Here the first avalanche occurs at a certain distance from the rod electrode and grows towards the rod electrode. With the growth of the channel, a discharge occurs. An initial electron is always needed for the breakdown mechanism to start [6,
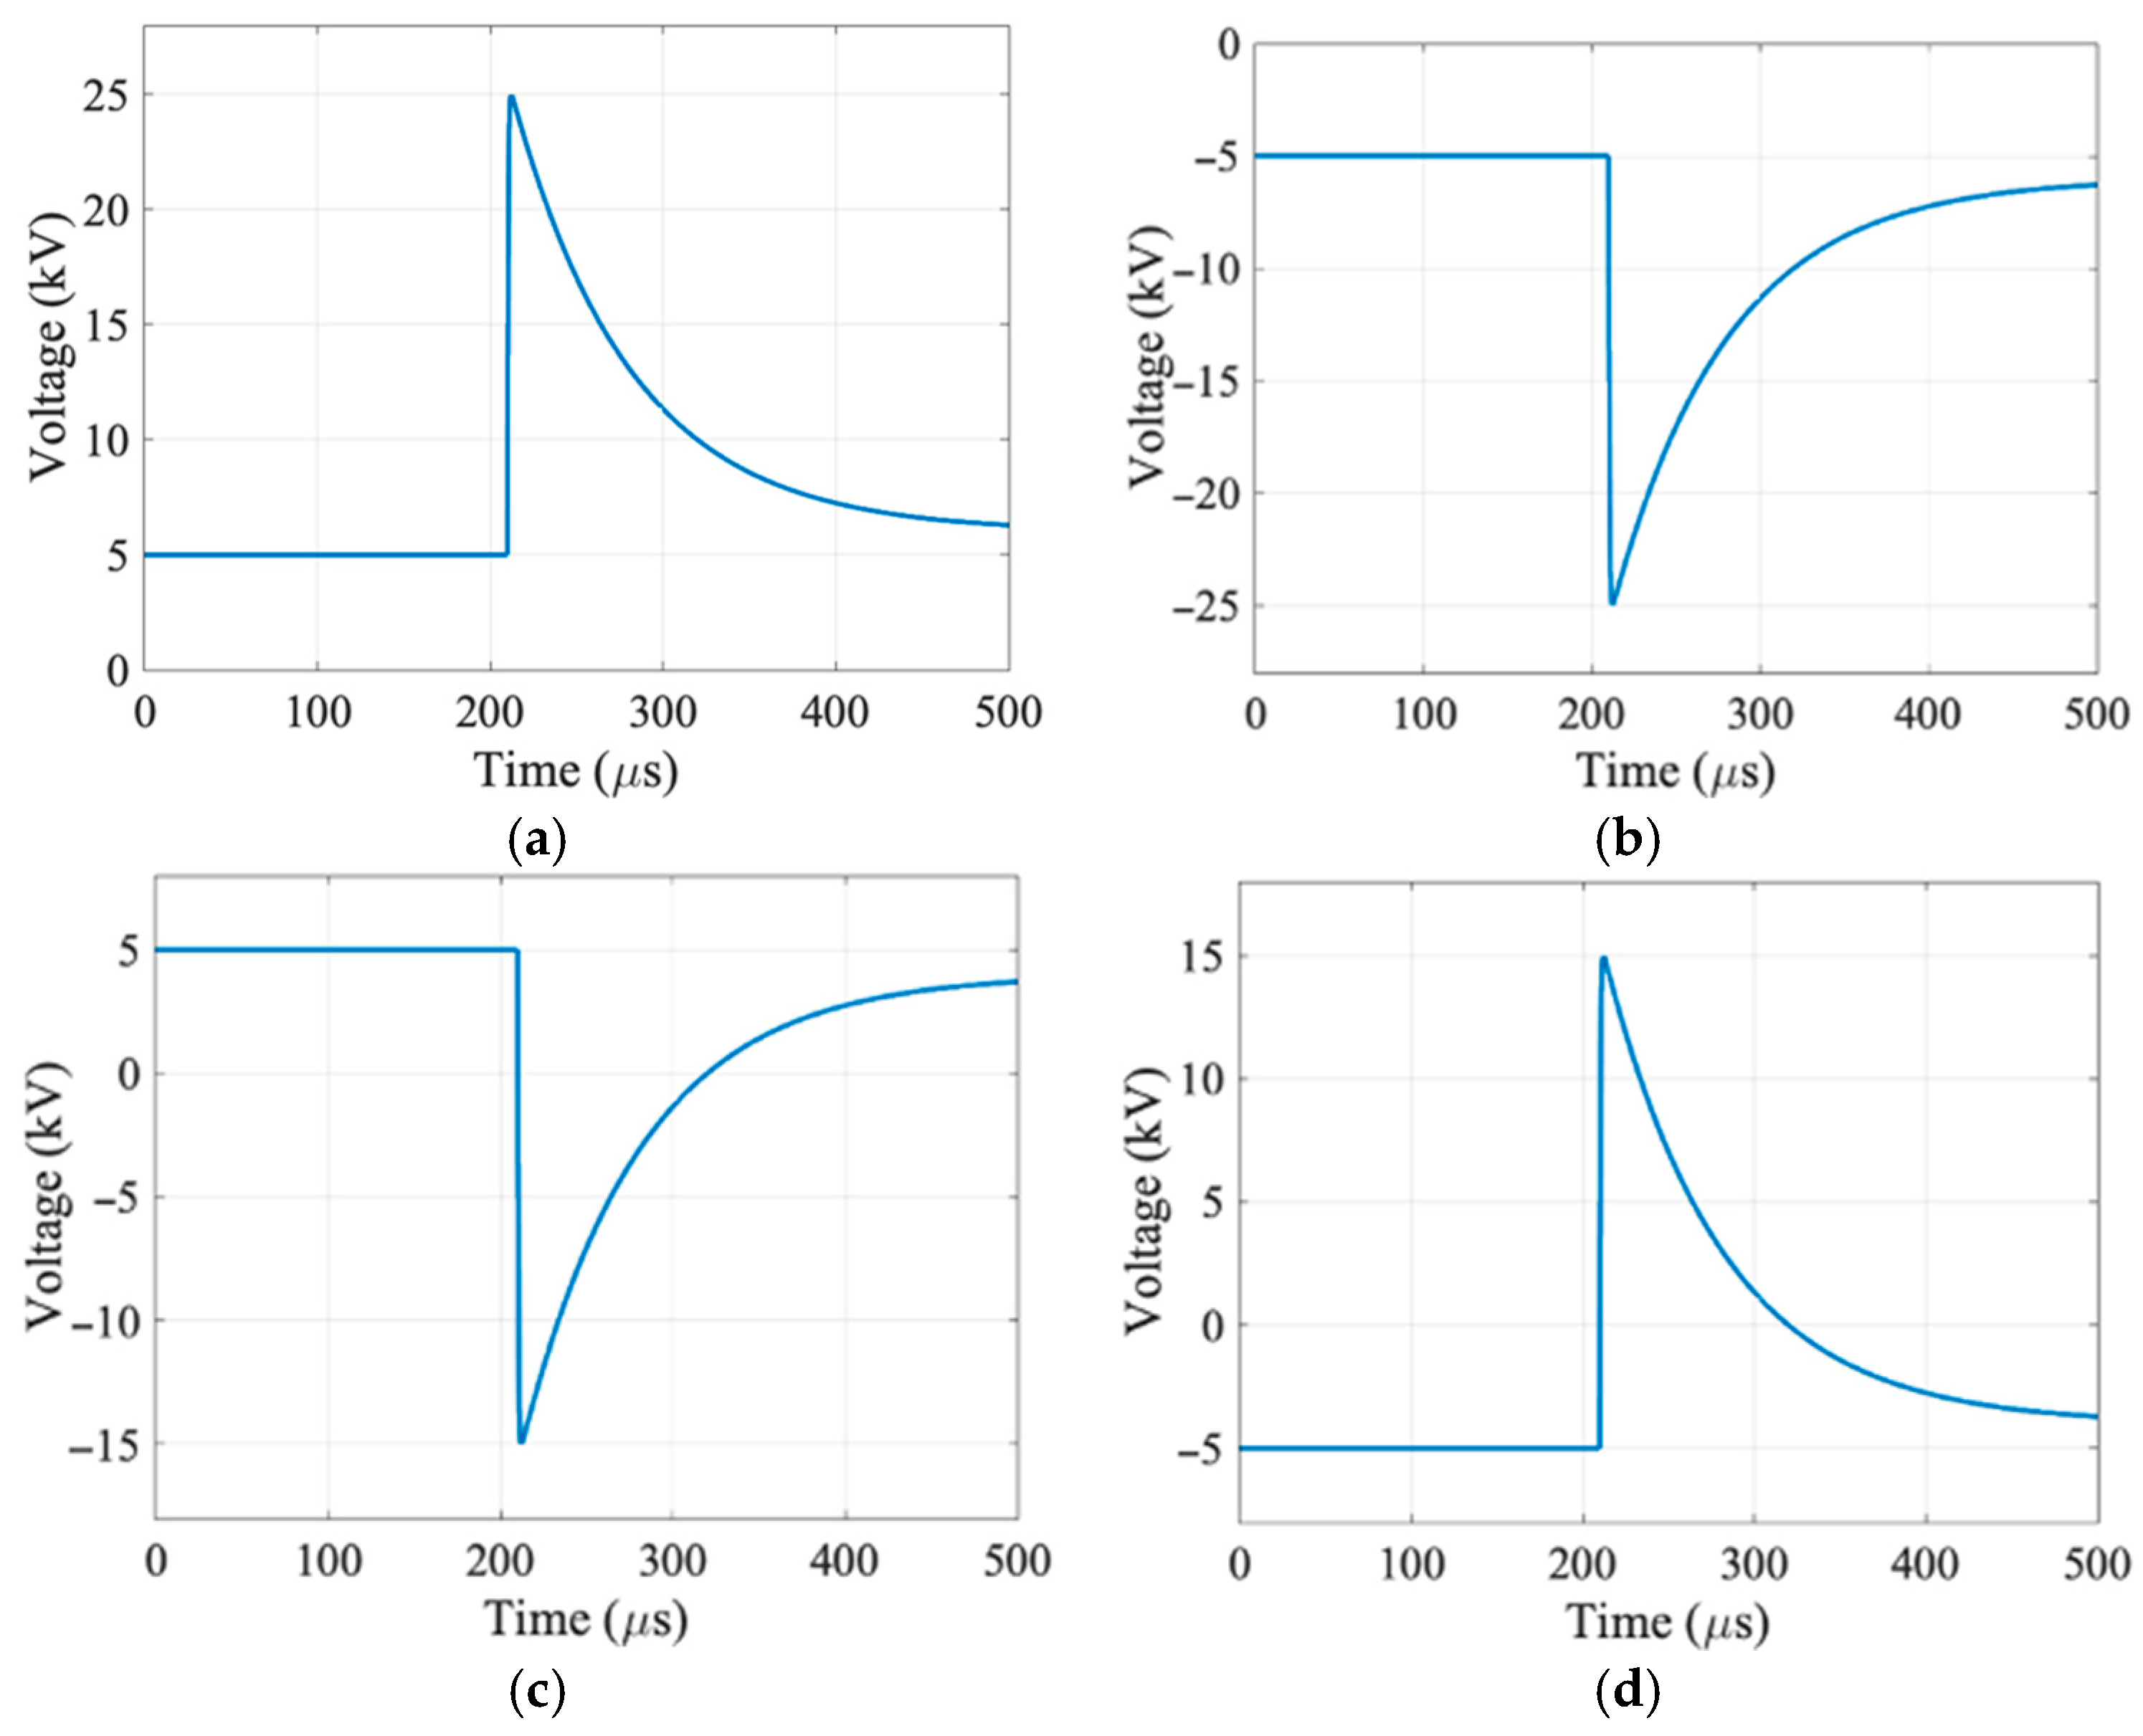
35]. In this study, firstly, DC voltage pre-stress was applied to the electrode with the smaller radius of curvature for 60 ± 5 s, and then 20 impulse voltages were superimposed on the DC voltage pre-stress. During this experimental procedure, the positions of the initial electrons that triggered the breakdown mechanism between the electrodes before superposing LI voltage stress are as shown in Figure 21. Here, when the electrode with the smaller radius of curvature is negative, there are some initial electrons every time because they are emitted from the negative electrode. On the other hand, when the electrode with the smaller radius of curvature is positive, it is not clear whether there is an initial electron near the electrode in the air to trigger the breakdown mechanism during the first superimposed impulse voltage pre-stress. For other superimposed impulse voltages, it is not clear whether the LI voltage stress superimposed captures free electrons near the rod electrode because LI voltage is a very short-term transient voltage type. Thus, the breakdown voltages under unipolar CV for positive DC voltage pre-stress (I. quadrant in 
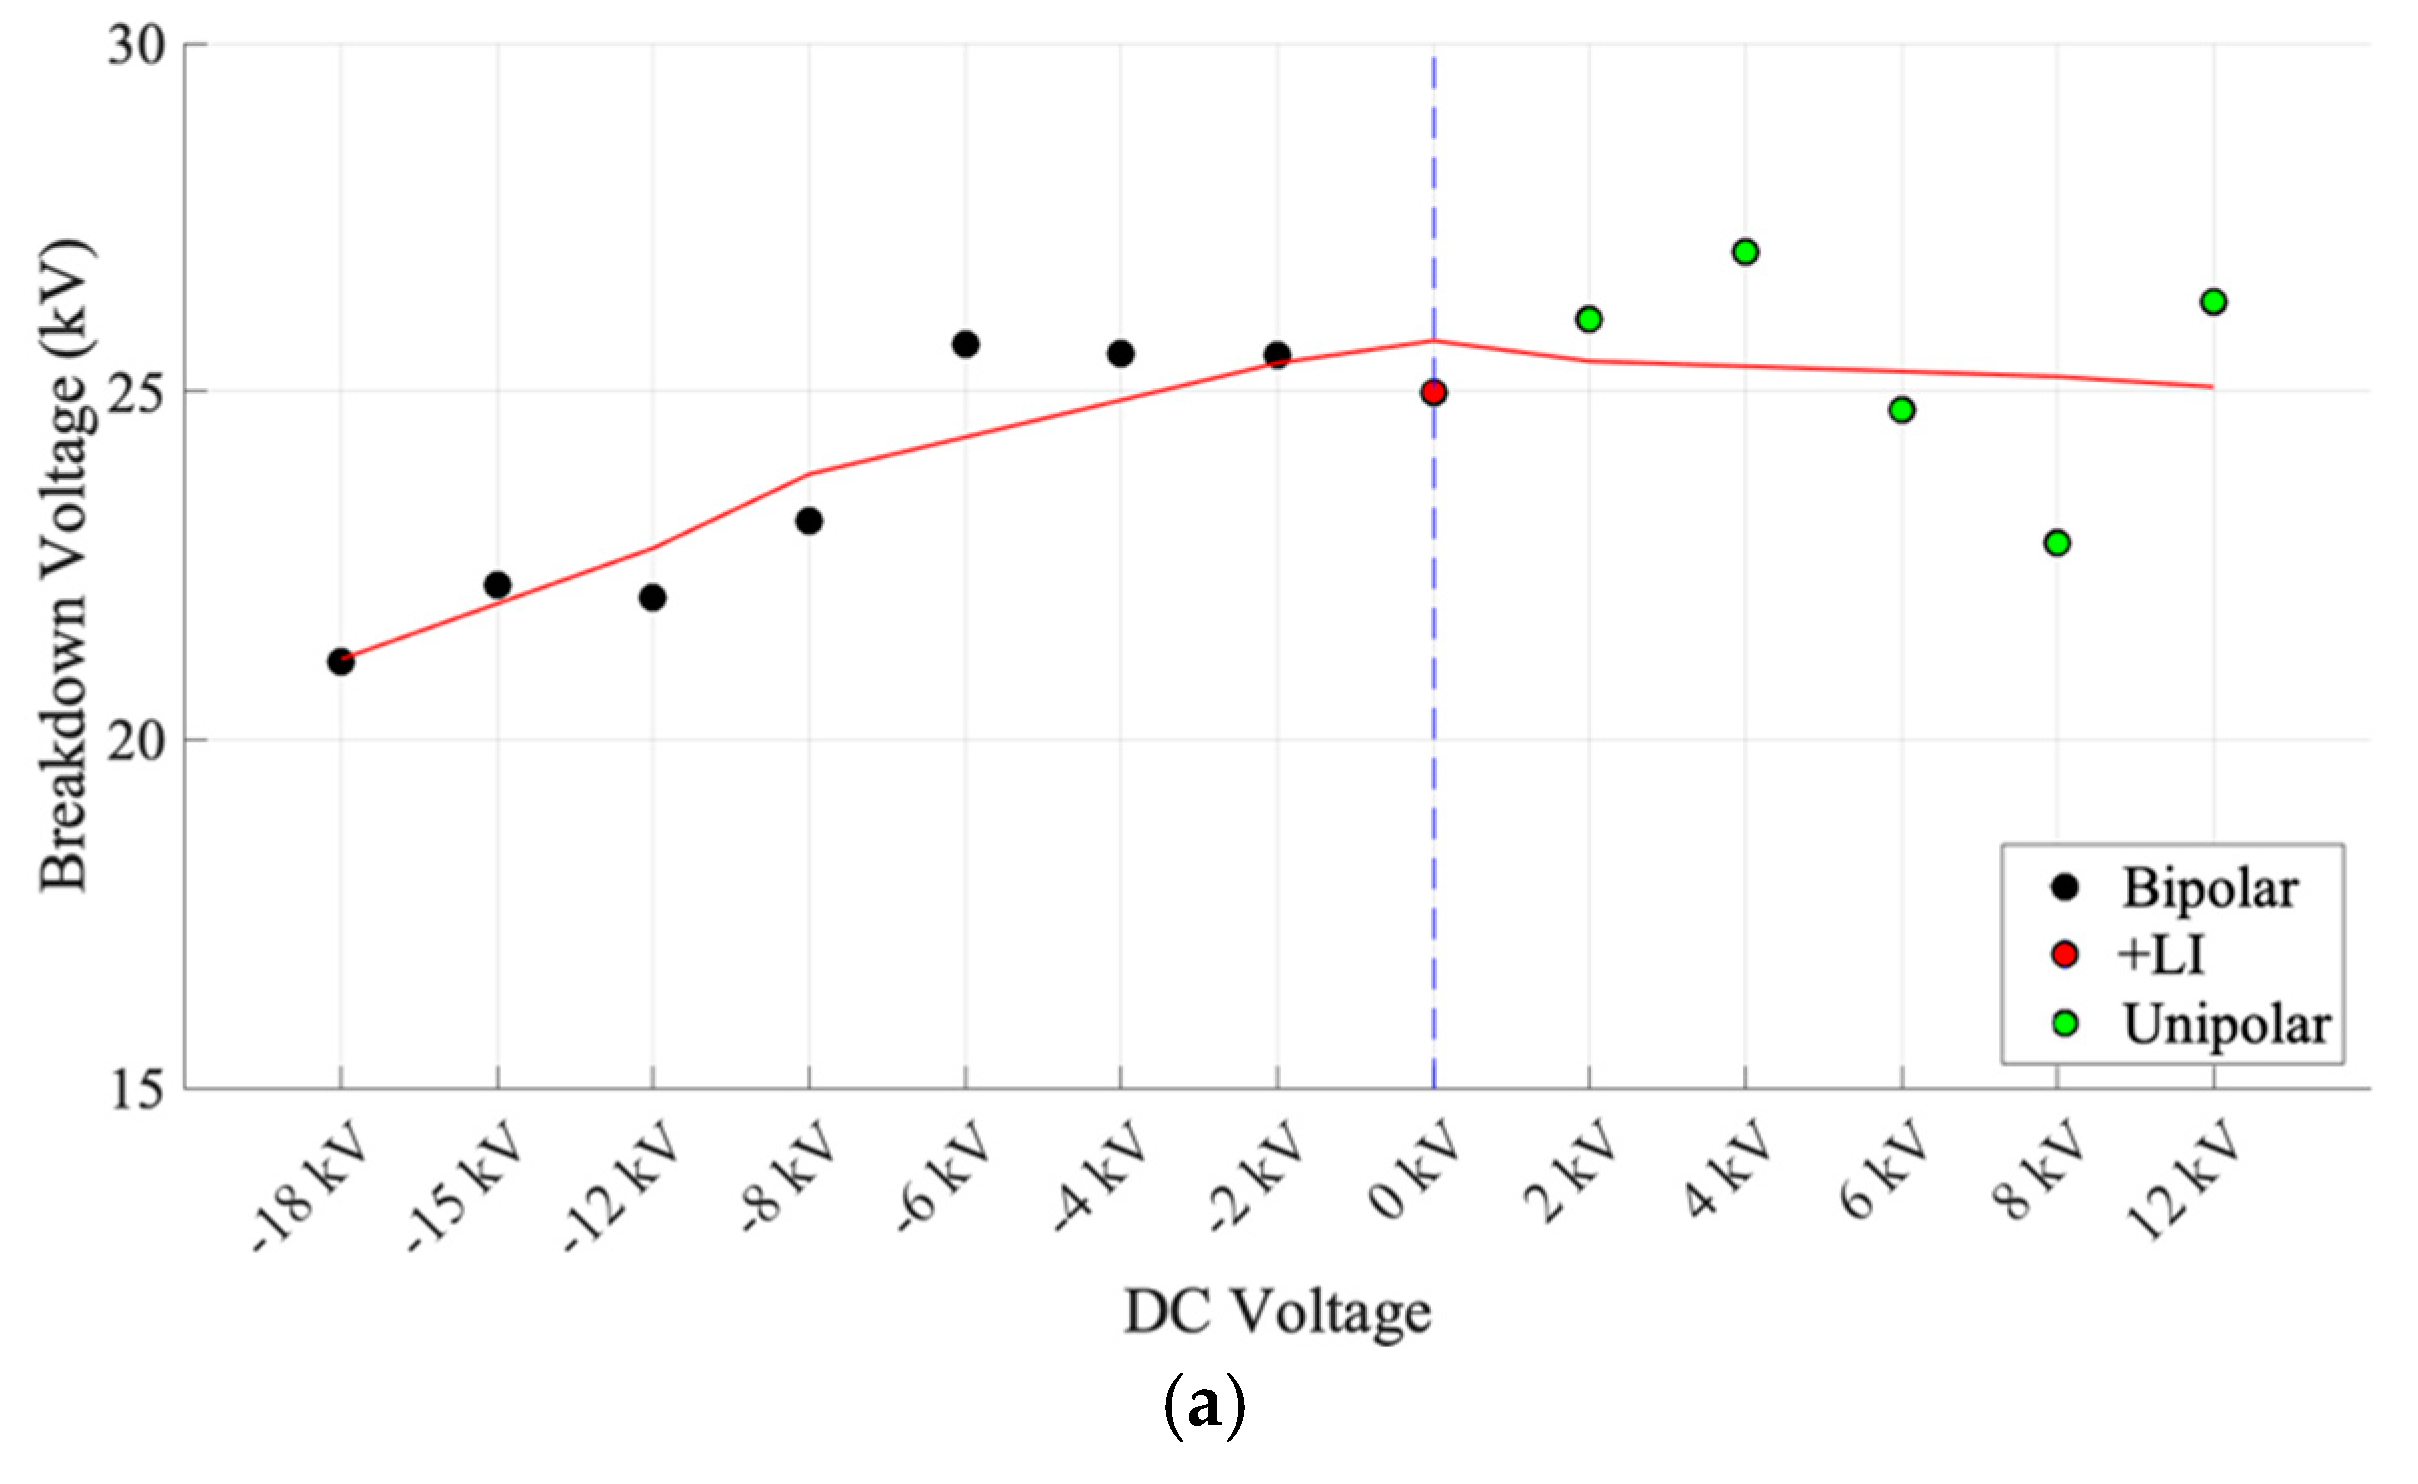
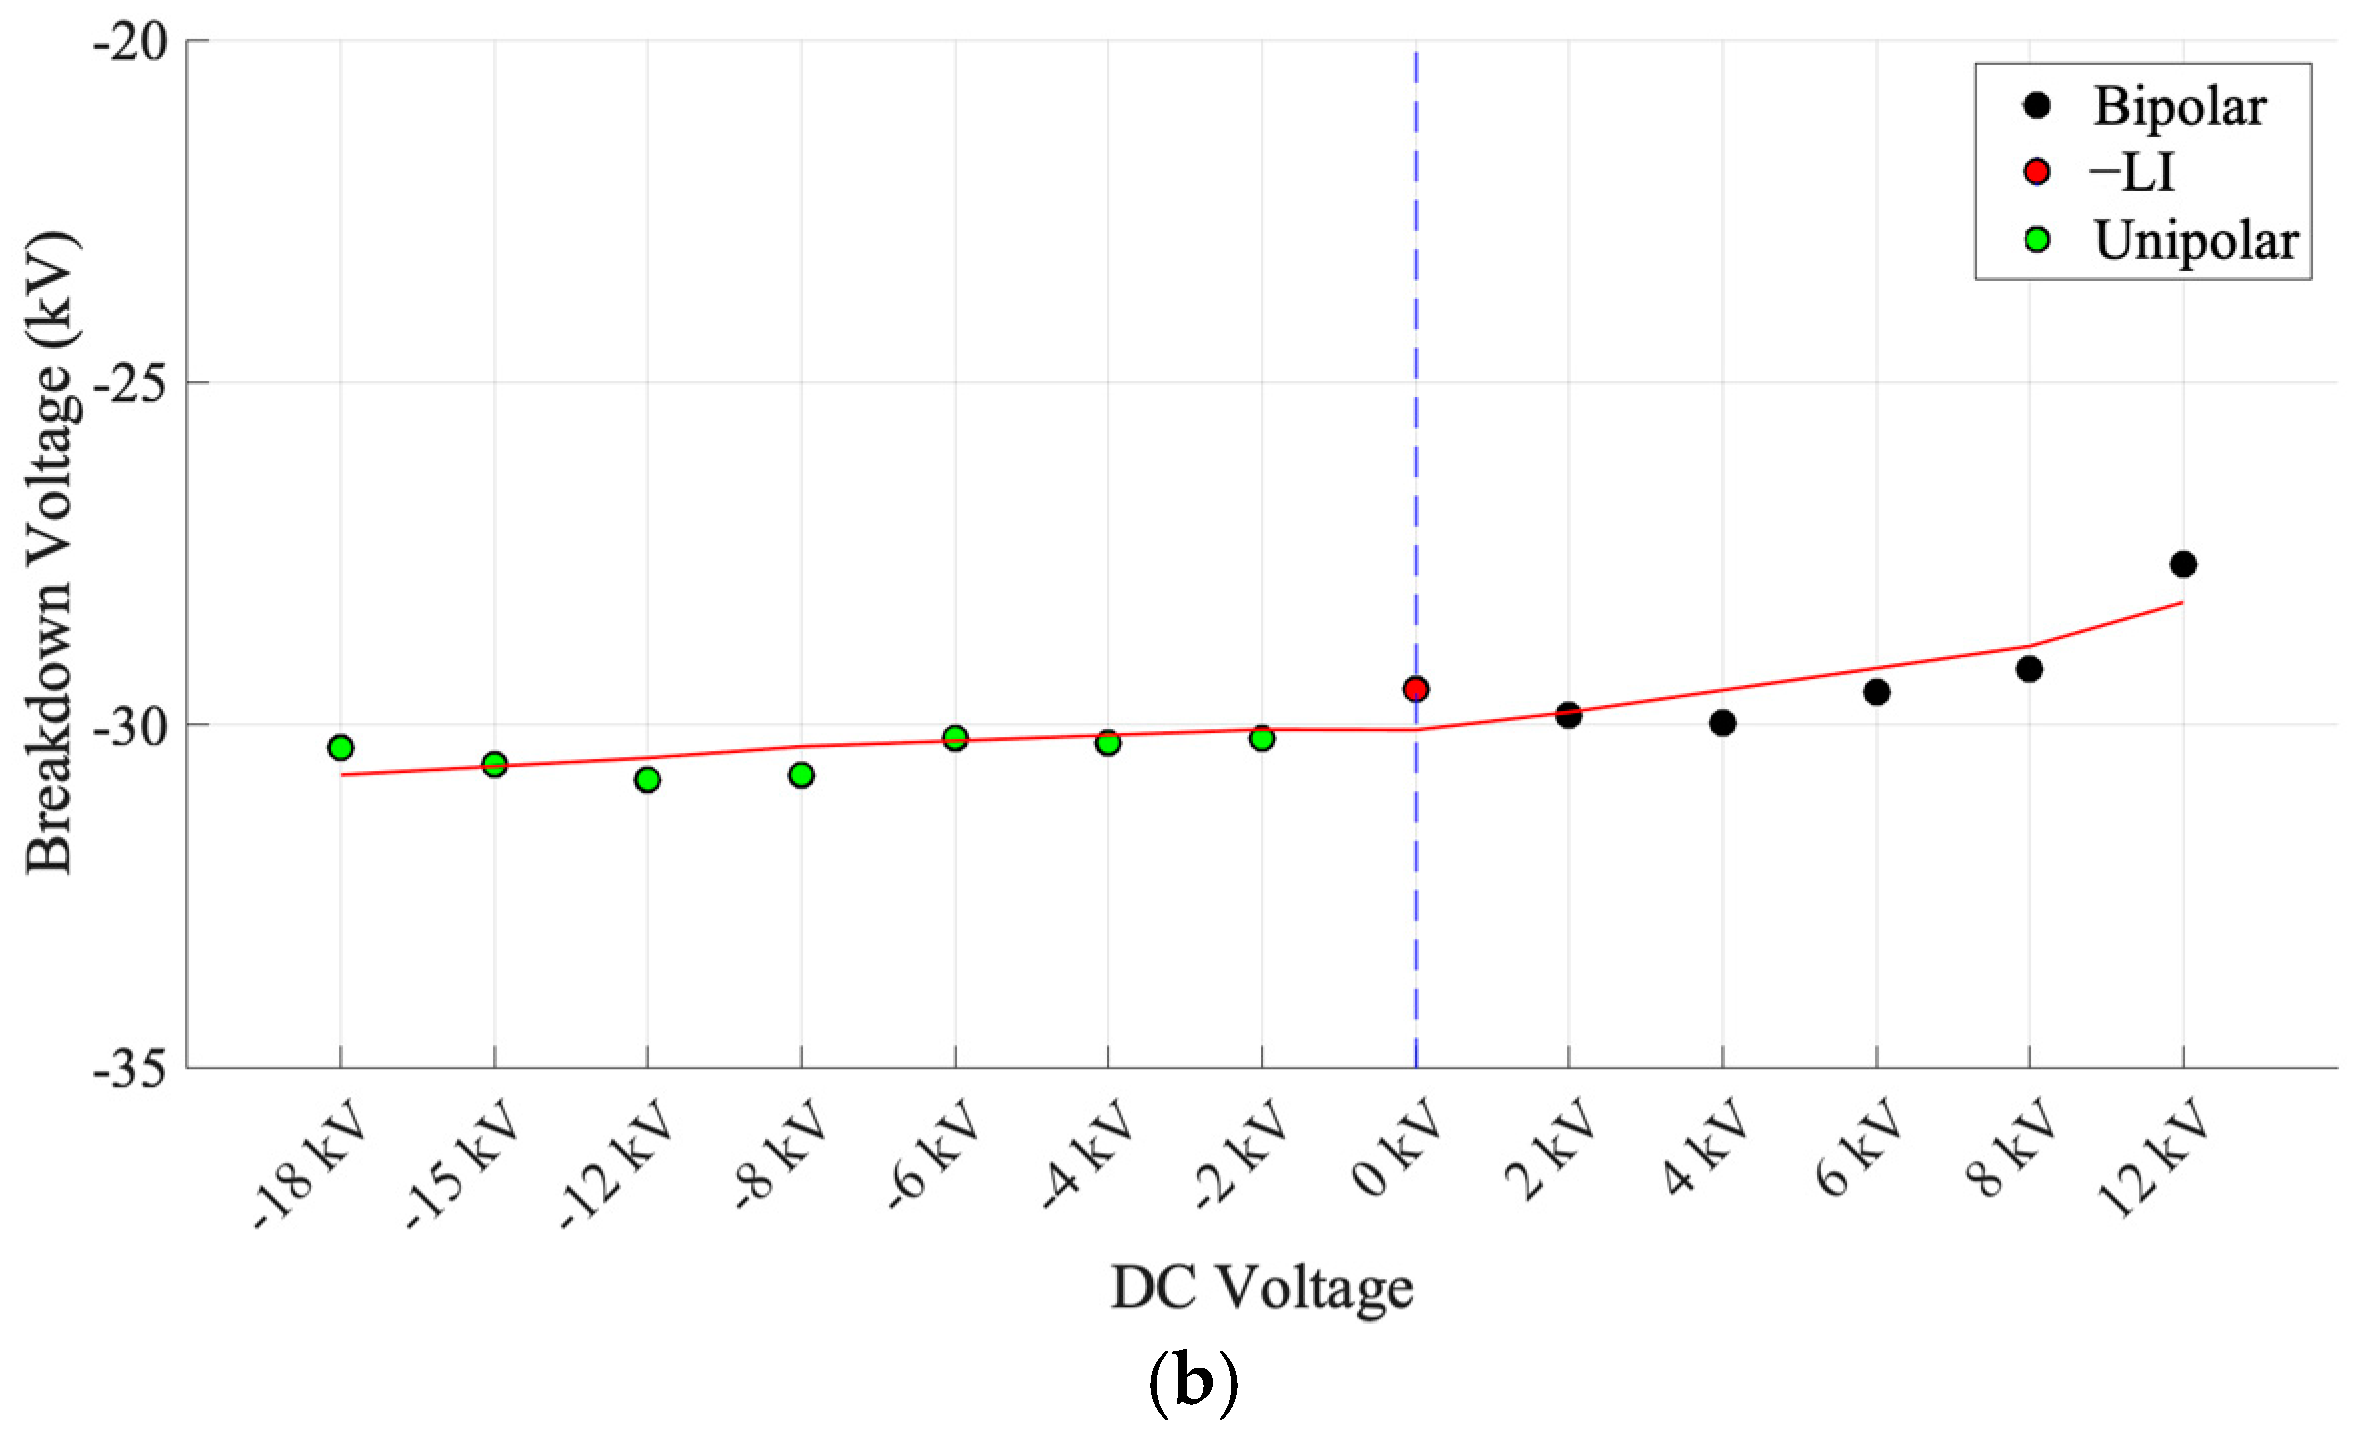
Figure 11) are not stable for experiments on rod (R = 1 mm)–plane and needle–plane electrode systems. For other superposition states, the initial electrons required for the breakdown mechanism are obtained by either −DC voltage or −LI voltage stress. Moreover, the higher breakdown voltages can be measured because of the statistical time-lag in the breakdown initiation under LI voltage stress [6]. For these reasons, great scattering and instabilities can occur in breakdown voltage measured under CV or LI voltage stresses.
The maximum electric field was obtained for all electrode systems used in experiments by FEM. Then, the efficiency factor of these electrode systems was calculated using maximum electric field (Emax) and uniform electric field (E0) strengths according to Equation (9). E0 is the uniform field strength at the parallel-plate electrodes [6].
η = E 0 E m a x
The calculated efficiency factor (η) for different electrode systems is given in Figure 22. The relationship between efficiency factor, corona inception voltage (Vi) and breakdown voltage (Vbd) can be seen in the figure. Here, the marked points have nothing to do with the y-axis. Through these points, it is aimed to classify the electrode systems according to the efficiency factor. While the efficiency factors for sphere–sphere and rod (R = 6 mm)–plane (for all gap spacing) are in the weakly non-uniform field, the efficiency factors for rod (R = 1 mm)–plane and needle–plane are in the strongly non-uniform field. As soon as the ignition condition for the streamer or Townsend mechanism is fulfilled, the breakdown occurs instantly for weakly non-uniform electric fields. If the electric field strength is high enough, there are suitable ionization conditions for the entire path between the electrodes. Above the critical field efficiency factor (ηc), pre-discharges do not occur between the electrodes (see Figure 22). The factor is 0.2 for air at standard atmospheric conditions [6]. However, in strongly non-uniform electric fields (ηc < 0.2), high electric field strengths and suitable ionization conditions only take place close to the curved electrode surface. In the low field region, the electron attachment dominates over the ionization processes. When the ignition condition is provided on the surface of the curved electrode, pre-discharges (corona) begin without instantly occurring breakdown. The space-charge-dominated streamer discharges appear with increasing voltage [6]. The inception voltage (Vi) of corona decreases with decreasing η. The breakdown voltage (Vbd) is higher due to space charge clouds around the curved electrode. The breakdown will occur at a higher breakdown voltage (Vbd) if the electric field strength in the low field region is high enough for streamer growth to the counter electrode.
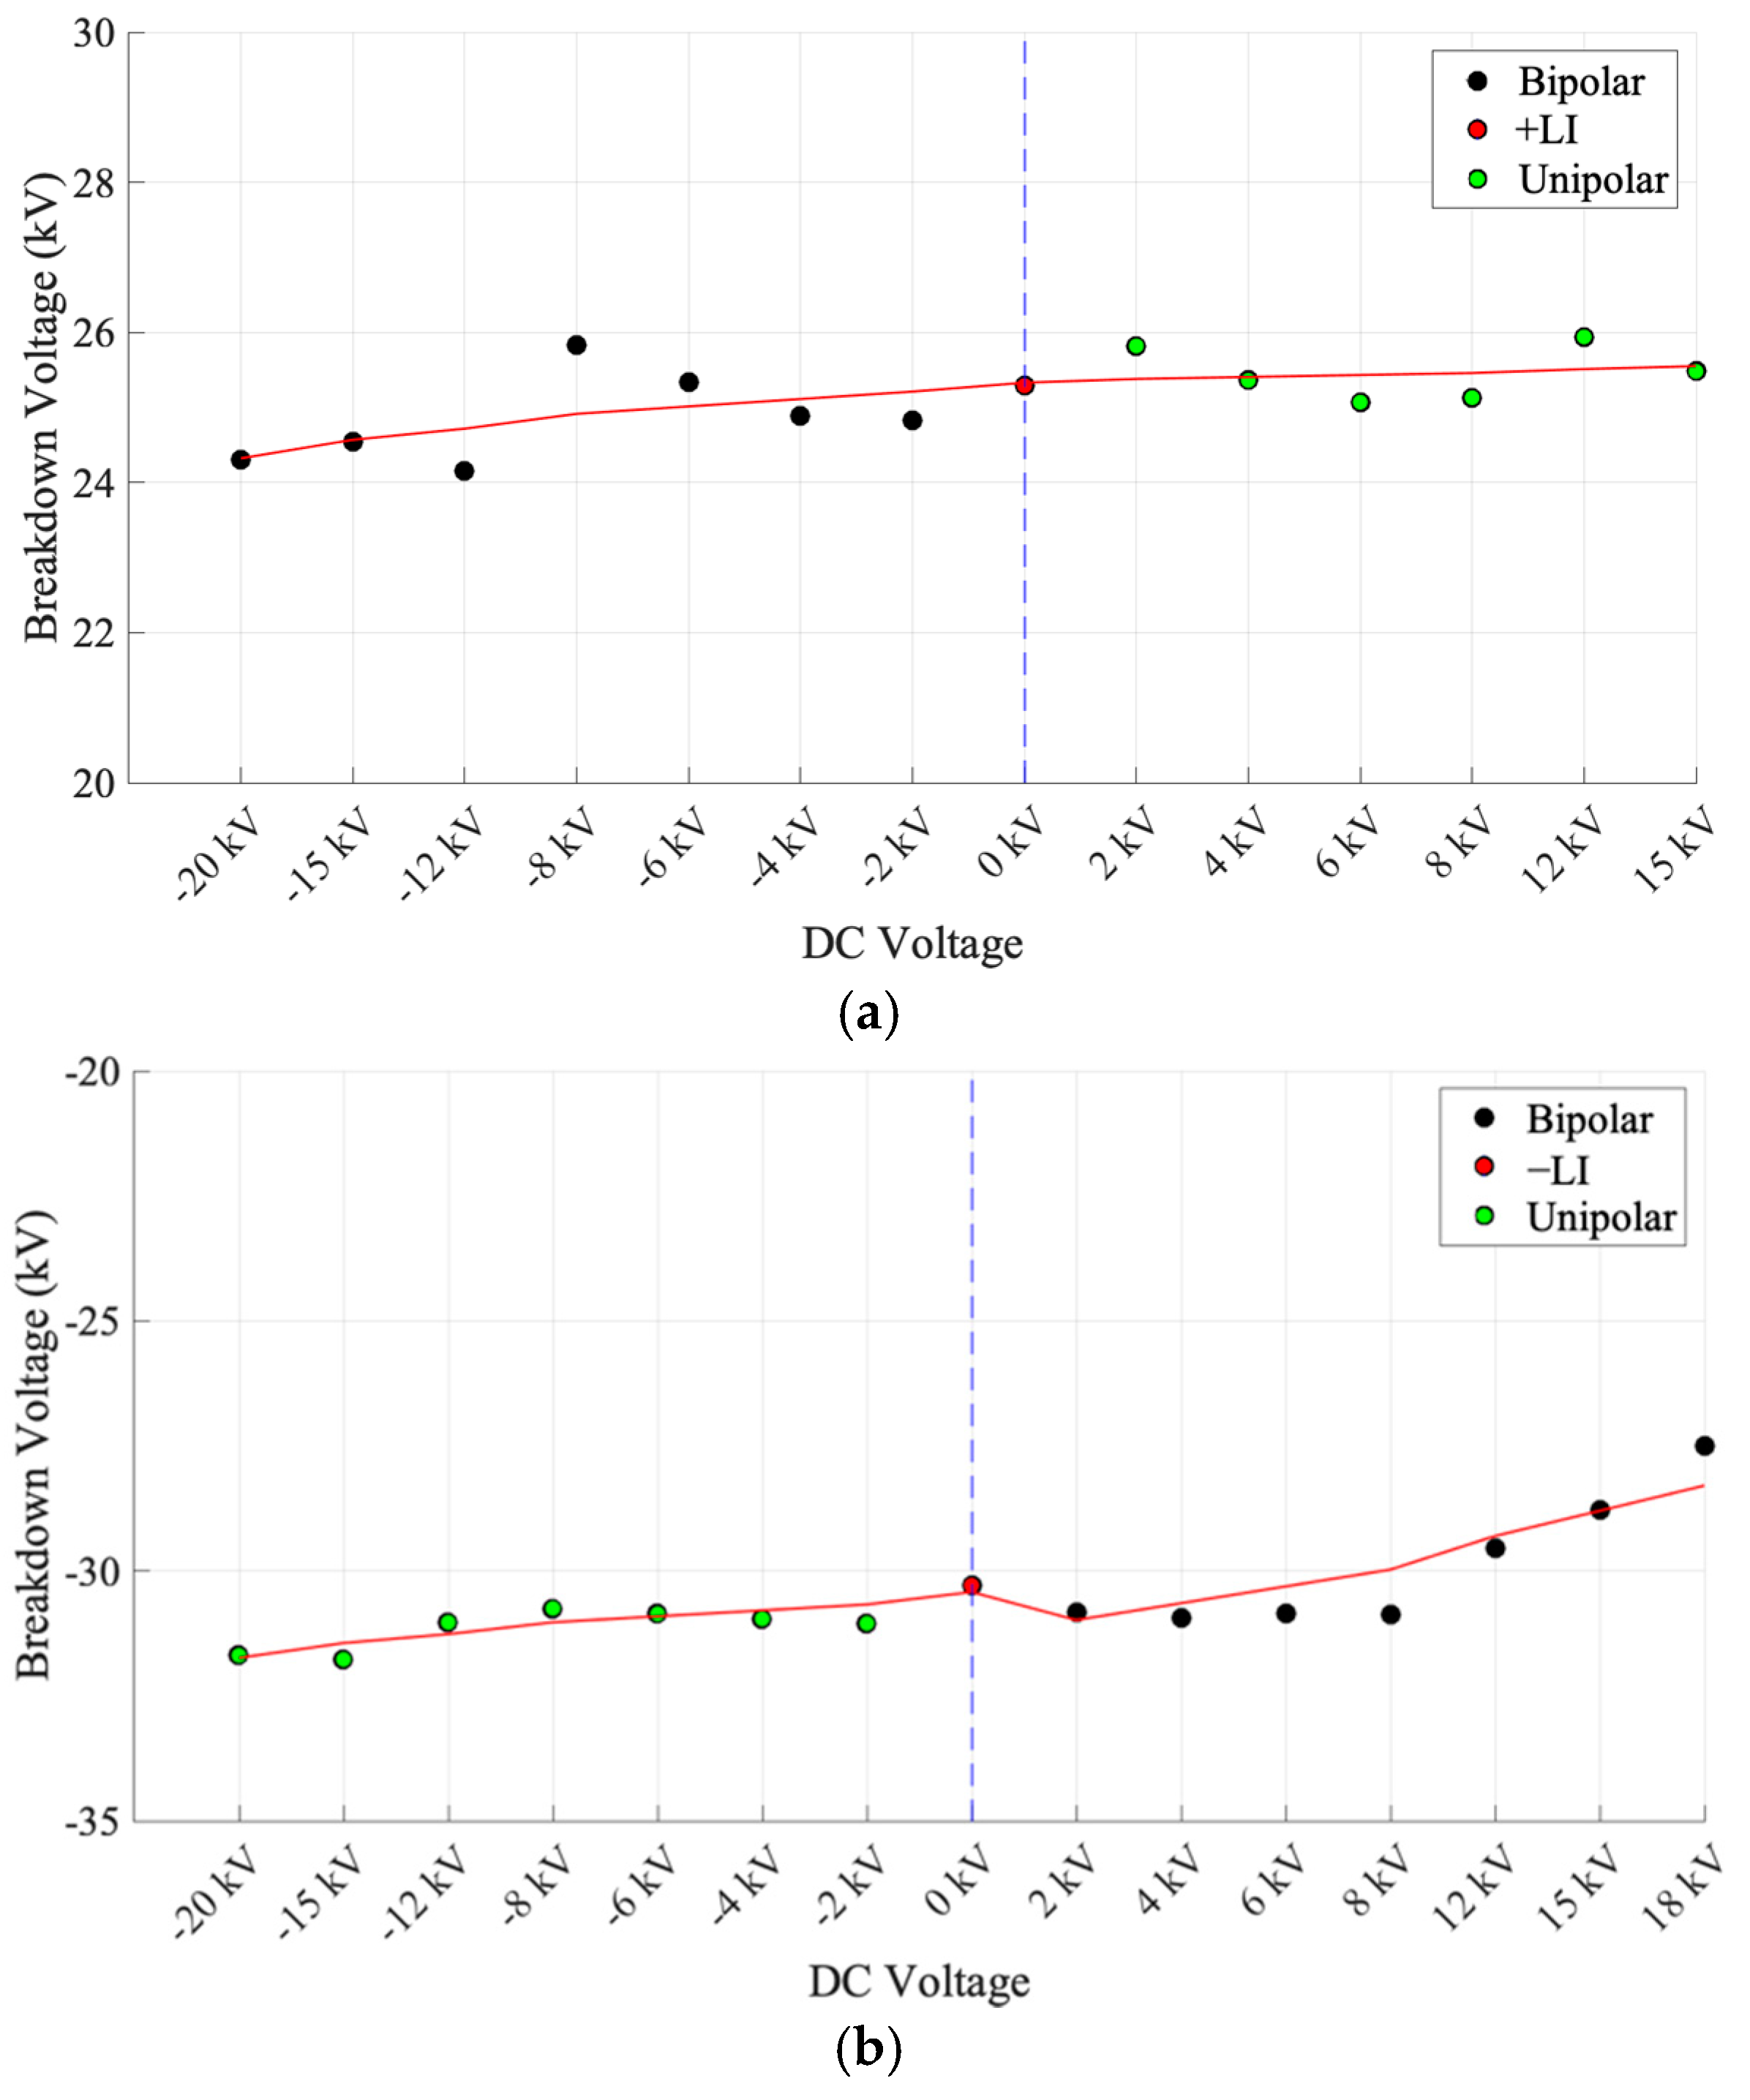
Comparing the breakdown voltage results under LI voltage stress with the results under CV voltage stress, it was observed that the applied DC voltage pre-stress had an effect on the breakdown voltage of the air, especially if we separate the experimental results according to the weakly and strong non-uniform field regions.
In less uniform electric field experiments, the breakdown voltage results under unipolar CV voltage stress increases with increasing DC voltage, while they decrease with increasing DC voltage under bipolar CV voltage stress. During superposition of LI voltage stress, it causes a very fast voltage rise or polarity change. In less uniform field experiments, the very fast voltage increase caused an increase in the breakdown voltage, while a very fast polarity change caused a decrease in the breakdown voltage. In the sphere–sphere electrode system, since the breakdown voltages under DC, AC and LI voltage stress are the same, breakdown voltage experiments in this type of electric field should be tested especially under bipolar CV stress.
Allen et al. [36] conducted investigations on the breakdown of air with the rod–plane electrode system under combined DC and impulse voltage. For positive impulse voltage, they obtained that the breakdown voltage at bipolar combined voltage (CV) decreased with increasing DC voltage and that breakdown voltage at unipolar CV increases with increasing DC voltage compared with under impulse alone. For negative impulse voltage, the breakdown voltage at both unipolar and bipolar CV decreased with increasing DC voltage. However, the time parameters of the impulse voltage used in this study are much larger compared to the time parameter of LI [36]. Okabe et al. [28] studied the insulation properties of GIS insulators under LI with DC voltage superimposed. SF6, oxygen and air are electron-affine gases [6]. In this study, experiments were performed in the four quadrants for the cylindrical epoxy model while only in the third quadrant region for the cylindrical FPR model and the conical spacer model [28]. For the cylindrical epoxy model, the breakdown voltage at unipolar CV increased only slightly compared to LI in their experiments. In contrast, the breakdown voltage at bipolar CV was significantly reduced compared to LI. While this decrease was 26% in the second quadrant, it was 38% in the fourth quadrant. In experiments performed only in the third quadrant for the cylindrical FPR model and the conical spacer model, they concluded that the breakdown voltage at CV stress increased by 20–30% compared to LI alone [28]. In addition, it was emphasized in [11,12,13] that the electrical properties of insulating materials, in which experiments were carried out under bipolar CV stress, were negatively affected, and the breakdown voltage decreased.
In the non-uniform electric field, the breakdown voltage results were analyzed by dividing them into strong and weak non-uniform fields. In weakly non-uniform field experiments, the breakdown voltages at unipolar CV increase on average with increasing DC voltage pre-stress compared to LI voltage stress. This increase in breakdown voltage is clearly visible at unipolar CV with positive DC voltage pre-stress for all gap spacing. Similarly, the breakdown voltage results at bipolar CV with negative DC voltage pre-stress slightly decreases with increasing DC voltage, as in less uniform field experiments. On average, when the results of the experiments with this electrode system are examined, it is seen that the fast polarity change reduced the dielectric strength of the air. In strongly non-uniform field experiments, the breakdown voltage results under bipolar CV stress significantly decrease with increasing DC voltage pre-stress except for experiments under bipolar CV with positive DC voltage pre-stress in needle–plane electrode systems. The breakdown voltage results under unipolar CV stress with negative DC voltage pre-stress increase with increasing DC voltage for two electrode systems. On the contrary, the breakdown voltage results under unipolar CV stress with positive DC voltage pre-stress slightly tend to increase with increasing DC voltage. But scattering was observed at the measured breakdown voltages in the experiments performed under this voltage type. The reason for this scattering is as explained in the first paragraph of the discussion section. In the strongly non-uniform electric field experiments, on average, the dielectric strength of air decreases significantly due to corona discharge pulse and fast polarity change when bipolar CV voltage stress was applied. According to these results, breakdown tests in strongly non-uniform electric fields should be tested especially under bipolar CV stress.

7. Conclusions

In this study, simulations and calculations were first performed to set up a test circuit for the generation and measurement of composite DC and LI high voltages. Then, breakdown voltage results under composite DC and LI voltage for less uniform and non-uniform electric fields with four different electrode systems were measured for different amplitude ±DC voltage pre-stress. The experimental results were correlated with electric field efficiency factors obtained by FEM.
If a very small coupling resistor is used in the composite DC and LI high voltage test circuit, the DC side is little affected by the LI. In order to eliminate this effect, the use of resistance of the order of MΩ was sufficient according to performed simulations. It has been seen that using a coupling capacitor on the LI side is important in this test circuit. If a very small capacitor for coupling is chosen, the efficiency factor of the impulse voltage at the CV point becomes very low. So, a high coupling capacitor value should be used to increase the efficiency factor. Moreover, the coupling capacitance will be exposed to a higher voltage than the applied voltage to the device under test in the case of bipolar superposition. Therefore, this loss in efficiency factor is acceptable up to a certain value according to experimental conditions.
The breakdown voltage under unipolar CV stress increased with increasing amplitude of DC voltage pre-stress for both positive and negative polarity in the less uniform electric field compared to LI voltage stress. On the contrary, the breakdown voltage under bipolar CV stress decreased with increasing amplitude of DC voltage pre-stress for both positive and negative polarity in the less uniform electric field compared to LI voltage stress. Especially in the strongly non-uniform electric field experiments, on average, the dielectric strength of air decreases significantly when bipolar CV voltage stress is applied.
In conclusion, the experimental results have shown that very fast polarity change in bipolar CV causes higher electrical stress compared to unipolar CV. It was clarified that the breakdown characteristics of air changed remarkably depending on the polarity combinations of DC and LI voltages. The proficiency tests of insulation systems should be preferred to be implemented by using the composite voltage of four polarity patterns. In this study, experiments were carried out in air for small gap spacing. In order to better understand and reveal the breakdown phenomena behavior of air under composite voltage, experiments can be continued with larger gap spacing. In addition, the behavior of dielectric materials under composite voltage can be expanded for impulse voltages with different time parameters.

Author Contributions

Conceptualization, M.M.I. and Ö.K.; methodology, M.M.I. and Ö.K.; software, M.M.I.; validation, Ö.K., F.S., M.R. and B.O.; investigation, M.M.I. and Ö.K.; resources, M.R.; writing—original draft preparation, M.M.I.; writing—review and editing, M.M.I., Ö.K., F.S., M.R. and B.O.; visualization, M.M.I. and F.S.; supervision, Ö.K., M.R. and B.O.; project administration, Ö.K. and M.R.; funding acquisition, M.R. All authors have read and agreed to the published version of the manuscript.

Funding

This research received no external funding.

Institutional Review Board Statement

Not applicable.

Informed Consent Statement

Not applicable.

Data Availability Statement

Not applicable.

Acknowledgments

We acknowledge support for the publication costs by the Open Access Publication Fund of the Technische Universität Ilmenau. The authors would like to thank the TU Ilmenau Center for Energy Technology of the Thuringian Energy Research Institute for the use of the high voltage diagnostic laboratory and the Technological Research Council of Turkey (TÜBİTAK) for 2214/A Ph.D. Scholarship Program and Marmara University Scientific Research Projects Commission for its support in the form of a grant (FEN-A-130219-0031).

Conflicts of Interest

The authors declare no conflict of interest.

References

  1. Pinzan, D.; Branco, F.; Haddad, M.A.; Slama, M.E.A.; Albano, M.; Waters, R.T.; Leite, H. Performance of Composite Outdoor Insulator Under Superimposed Direct and Switching Impulse Voltages. IEEE Trans. Power Deliv. 2020, 36, 1193–1201. [Google Scholar] [CrossRef]
  2. Azizian, F.M.; Farrag, M.E.; Reid, A.; Al-Naemi, F. Electrical Treeing in Power Cable Insulation under Harmonics Superimposed on Unfiltered HVDC Voltages. Energies 2019, 12, 3113. [Google Scholar] [CrossRef] [Green Version]
  3. Jovcic, D. High Voltage Direct Current Transmission: Converters, Systems and DC Grids, 2nd ed.; John Wiley & Sons Ltd.: Hoboken, NJ, USA, 2019. [Google Scholar]
  4. Papailiou, K.O. (Ed.) CIGRE Green Book Overhead Lines; Springer International Publishing: Paris, France, 2017. [Google Scholar]
  5. Datsios, Z.G.; Ioannidis, A.I.; Papadopoulos, T.A.; Tsovilis, T.E. A Stochastic Model for Evaluating the Lightning Performance of a −400 kV HVDC Overhead Line. IEEE Trans. Electromagn. Compat. 2021, 63, 1433–1443. [Google Scholar] [CrossRef]
  6. Küchler, A. High Voltage Engineering: Fundamentals-Technology-Applications, 5th ed.; Springer-Verlag: Berlin, Germany, 2017. [Google Scholar]
  7. IEC 60060-1:2010; High-Voltage Test Techniques—Part 1: General Definitions and test Requirements. IEC Publication 60060. International Electrotechnical Commission: Geneva, Switzerland, 2011.
  8. IEC 60071-1; Insulation Co-Ordination—Part 1: Definitions, Principles and Rules; IEC Publication 60071. International Electrotechnical Commission: Geneva, Switzerland, 2019.
  9. Hauschild, W.; Lemke, E. High-Voltage Test and Measuring Techniques, 2nd ed.; Springer-Verlag: Berlin, Germany, 2014. [Google Scholar]
  10. Ispirli, M.M.; Kalenderli, Ö.; Rock, M. The design and application of composite AC & DC and DC & LI high voltage test circuits. In Proceedings of the 13th International Conference on Electrical and Electronics Engineering (ELECO), Bursa, Turkey, 25–27 November 2021. [Google Scholar]
  11. Gabler, T.; Backhaus, K.; Götz, T.; Fritsche, R.; Linde, T.; Großmann, S. Investigation on the breakdown behaviour of oil-paper insulations at superimposed DC and lightning impulse voltage stress. In Proceedings of the VDE High Voltage Technology 2018, Berlin, Germany, 12–14 November 2018. [Google Scholar]
  12. Wang, J.; Wang, Z.; Wang, J.; Chang, Y.; Hu, Q.; Ni, X.; Li, Q. Insulation Characteristics of Spacer Filled with Different Gas Insulating Mediums under Superimposed Voltage of DC and Impulse. In Proceedings of the IEEE 20th International Conference on Dielectric Liquids (ICDL), Rome, Italy, 23–27 June 2019. [Google Scholar]
  13. Zha, W.; Qiu, Q.; Song, N.; Teng, Y.; Cao, S.; Sang, W.; Jing, L. Influence of Bubbles on Insulation Properties of LN2 for SFCL Under Lightning Impulse and DC Voltage. IEEE Trans. Appl. Supercond. 2019, 29, 1–6. [Google Scholar] [CrossRef]
  14. Arnold, P.; Tenbohlen, S.; Köhler, W.; Riechert, U.; Straumann, U. Fixed particles in coaxial SF6 arrangements at various voltage stresses. In Proceedings of the 2014 ICHVE International Conference on High Voltage Engineering and Application, Poznan, Poland, 8–11 September 2014. [Google Scholar]
  15. Du, B.; Chang, R.; Jiang, J.; Li, J. Temperature-dependent surface charge and flashover behaviors of oil-paper insulation under impulse with superimposed DC voltage. IEEE Access 2018, 6, 63087–63093. [Google Scholar] [CrossRef]
  16. Ma, J.; Zhang, Q.; Wu, Z.; Guo, C.; Wen, T.; Wang, G.; Gao, C. Breakdown characteristics of particle-contaminated HVDC GIL under superimposed voltage of DC and impulse. IEEE Trans. Dielectr. Electr. Insul. 2018, 25, 1439–1447. [Google Scholar] [CrossRef]
  17. Liu, H.; Li, Y.; Liu, Y.; Zhang, M.; Xu, X.; Liu, A. Electrical tree initiation properties in cross-linked polyethylene under dc-impulse composite voltages. IEEE Access 2018, 6, 62890–62897. [Google Scholar] [CrossRef]
  18. Meng, S.; Xu, X.; Liu, H.; Guo, Z.; Xie, Z.; Liu, A. Influence of DC pre-stress of initiation characteristics on electrical tree in XLPE under DC-impulse voltage. In Proceedings of the 5th Asia Conference on Power and Electrical Engineering (ACPEE), Chengdu, China, 4–7 June 2020. [Google Scholar]
  19. Zhu, L.; Du, B.; Li, Z.; Su, J.; Jiang, J.; Kong, X. Electrical Tree Characteristics in Polypropylene under Impulse Superimposed DC Voltage in LN2. IEEE Trans. Appl. Supercond. 2019, 29, 1–3. [Google Scholar] [CrossRef]
  20. Du, B.; Tian, M.; Su, J.; Han, T.; Zhu, W.; Kong, X.; Jiang, J. DC-Impulse Voltage-Dependent Electrical Tree Growth Characteristics of Epoxy Resin in LN2. IEEE Trans. Appl. Supercond. 2019, 29, 1–5. [Google Scholar] [CrossRef]
  21. Zhu, L.; Du, B.; Li, H.; Hou, K. Effect of polycyclic compounds fillers on electrical treeing characteristics in XLPE with DC-impulse voltage. Energies 2019, 12, 2767. [Google Scholar] [CrossRef] [Green Version]
  22. Han, C.; Li, Z.; Yang, Z.; Xiao, M.; Du, B. Conductivity and Surface Charge Properties of HTV SiR/SiC Composites under Impulse Superimposed on DC Voltage at Different Temperatures. In Proceedings of the 2nd International Conference on Electrical Materials and Power Equipment (ICEMPE), Guangzhou, China, 7–10 April 2019. [Google Scholar]
  23. Du, B.; Yang, Z.R.; Li, Z.L.; Li, J. Nonlinear conductivity and charge transport characteristics of silicone rubber/SiC composites under impulse superimposed on DC voltage. IEEE Trans. Dielectr. Electr. Insul. 2019, 26, 776–783. [Google Scholar] [CrossRef]
  24. Kwon, I.-S.; Kim, S.-J.; Asif, M.; Lee, B.-W. Evaluation of Electric Field and Space Charge Dynamics in Dielectric under DC Voltage with Superimposed Switching Impulse. Energies 2019, 12, 1836. [Google Scholar] [CrossRef] [Green Version]
  25. Kalenderli, Ö.; Önal, E. Design of composite high voltage generation circuits. In Proceedings of the 2016 National Conference on Electrical, Electronics and Biomedical Engineering (ELECO), Bursa, Turkey, 1–3 December 2016. [Google Scholar]
  26. Schon, K. High Voltage Measurement Techniques; Springer Nature: Cham, Switzerland, 2019. [Google Scholar]
  27. Gabler, T.; Backhaus, K.; Speck, J.; Fritsche, R.; Großmann, S. Experimental Investigation of Oil-Insulated Arrangements at High DC Voltage and Composite Voltage Stress Considering a Charge Carrier-Based Approach. In Proceedings of the CIGRE Session 2018, Paris, France, 26–31 August 2018; p. D1-106. [Google Scholar]
  28. Okabe, S.; Ueta, G.; Utsumi, T.; Nukaga, J. Insulation characteristics of GIS insulators under lightning impulse with DC voltage superimposed. IEEE Trans. Dielectr. Electr. Insul. 2015, 22, 1–9. [Google Scholar] [CrossRef]
  29. Chatterjee, S.; Hadi, A.S. Regression Analysis by Example, 5th ed.; John Wiley & Sons Inc.: Hoboken, NJ, USA, 2013. [Google Scholar]
  30. Yu, L.; Wang, H.; Che, J.; Lu, J.; Zheng, X. Outliers screening for photovoltaic electric power based on the least square method. In Proceedings of the 2016 Chinese Control and Decision Conference (CCDC), Yinchuan, China, 28–30 May 2016. [Google Scholar]
  31. Yining, D.; Mandi, N.; Qingyu, Z. The Empirical Analysis of the Influence of Urban Innovation Ability on the Economic Growth Based on the Least Square Regression Model (OLS). In Proceedings of the 2021 International Conference on Financial Management and Economic Transition (FMET 2021), Guangzhou, China, 27–29 August 2021. [Google Scholar]
  32. Ispirli, M.M.; Oral, B.; Kalenderli, Ö. Electric field analysis of 66 kV and 110 kV SiR insulators under combined AC–DC voltages. Energy Rep. 2022, 8, 361–368. [Google Scholar] [CrossRef]
  33. Kalenderli, Ö. Finite Element Method for Electrical Engineers; Lecture Notes in Electrical Engineering; Istanbul Technical University: Istanbul, Turkey, 1995. (In Turkish) [Google Scholar]
  34. Zimmerman, W.B. Multiphysics Modeling with Finite Element Methods; World Scientific Publishing Co., Inc.: Singapore, 2006; Volume 18. [Google Scholar]
  35. Özkaya, M. High voltage techniques. In Electrostatic Fields and Discharge Phenomena, 2nd ed.; Birsen Press: Istanbul, Turkey, 1996; Volume 1. (In Turkish) [Google Scholar]
  36. Allen, N.L.; Huang, C.F.; Cornick, K.J.; Greaves, D.A. Sparkover in the rod-plane gap under combined direct and impulse voltages. IEE Proc.-Sci. Meas. Technol. 1998, 145, 207–214. [Google Scholar] [CrossRef]
Figure 1. Example composite voltage (CV) waveform by the superimposed 20 kV − DC and 100 kV + LI voltage.
Energies 15 01353 g001
Figure 2. The generation and measurement test circuit: (a) combined voltage; (b) composite voltage.
Energies 15 01353 g002
Figure 3. The established LI and DC composite voltage experiment circuit on the simulation.
Energies 15 01353 g003
Figure 4. (a) The equivalent circuit of LI voltage side; (b) The equivalent circuit of DC voltage side.
Energies 15 01353 g004
Figure 5. The variation of efficiency factor with coupling capacitor.
Energies 15 01353 g005
Figure 6. The waveforms obtained as a result of the analysis made with 320 kΩ coupling resistor.
Energies 15 01353 g006
Figure 7. (a) The composite DC and LI voltage generation experimental setup; (b) the equivalent circuit of experimental setup.
Energies 15 01353 g007
Figure 8. (a) The voltage at input and output of coupling capacitor; (b) CV generated on the experimental setup.
Energies 15 01353 g008
Figure 9. Electrodes used for less uniform and non-uniform electric field experiments: (a) sphere–sphere; (b) rod (R = 6 mm)–plane; (c) rod (R = 1 mm)–plane; (d) needle–plane.
Energies 15 01353 g009
Figure 10. (a) Unipolar composite voltage (+DC and +LI); (b) unipolar composite voltage (−DC and −LI); (c) bipolar composite voltage (+DC and −LI); (d) bipolar composite voltage (−DC and +LI).
Energies 15 01353 g010
Figure 11. Four-quadrants diagram for assessment of breakdown voltage (UBD) under composite voltage.
Energies 15 01353 g011
Figure 12. Cumulative distribution function of breakdown values.
Energies 15 01353 g012
Figure 13. Variation of 50% breakdown voltage in less uniform electric field according to different +DC and −DC values: (a) +LI; (b) −LI.
Energies 15 01353 g013
Figure 14. High potential electrodes (brass) used in non-uniform electric field experiments: (a) rod electrode (R = 6 mm); (b) rod electrode (R = 1 mm); (c) needle electrode.
Energies 15 01353 g014
Figure 15. Variation of 50% breakdown voltage with rod (R = 6 mm)–plane electrode system according to different +DC and –DC values: (a) +LI; (b) –LI.
Energies 15 01353 g015
Figure 16. Variation of 50% breakdown voltage with rod (R = 1 mm)–plane electrode system according to different +DC and −DC values: (a) +LI; (b) −LI.
Energies 15 01353 g016
Figure 17. Variation of 50% breakdown voltage for needle–plane electrode system according to different +DC and −DC values: (a) +LI; (b) −LI.
Energies 15 01353 g017aEnergies 15 01353 g017b
Figure 18. The 3D model of rod (R = 6 mm)–plane electrode system.
Energies 15 01353 g018
Figure 19. The mesh form of rod (R = 6 mm)–plane electrode system.
Energies 15 01353 g019
Figure 20. The maximum electric field and electric field distribution for different electrode systems: (a) sphere–sphere (d = 10 mm); (b) needle–plane (d = 15 mm); (c) rod (R = 1 mm)–plane (d = 15 mm); (d) rod (R = 6 mm)–plane (d = 15 mm); (e) rod (R = 6 mm)–plane (d = 10 mm); (f) rod (R = 6 mm)–plane (d = 5 mm).
Energies 15 01353 g020
Figure 21. The positions of the initial electrons that triggered the breakdown mechanism between the electrodes before superposing LI voltage stress.
Energies 15 01353 g021
Figure 22. The efficiency factor calculated for different electrode systems and the relationship between efficiency factor, corona inception voltage and breakdown voltage.
Energies 15 01353 g022
Table 1. Measured ambient conditions for breakdown experiments in less uniform electric field.
ParameterMinimumMaximumArithmetic Mean
Absolute humidity (g/m3)7.079.238.67
Temperature (°C)21.823.823.21
Pressure (mmHg)719.31728.23722.74
Table 2. Measured ambient conditions for breakdown experiments with rod (R = 6 mm)–plane electrode system.
ParameterMinimumMaximumArithmetic Mean
Absolute humidity (g/m3)7.5310.749.7
Temperature (°C)21.626.824.16
Pressure (mmHg)715.71727.26720.09
Table 3. Measured ambient conditions for breakdown experiments with (R = 1 mm)–plane electrode system.
ParameterMinimumMaximumArithmetic Mean
Absolute humidity (g/m3)7.638.188.1
Temperature (°C)21.022.822.23
Pressure (mmHg)718.41729.96724.26
Table 4. Measured ambient conditions for breakdown experiments with needle–plane electrode system.
ParameterMinimumMaximumArithmetic Mean
Absolute humidity (g/m3)5.759.997.82
Temperature (°C)21.623.122.43
Pressure (mmHg)723.88727.78724.97
Publisher’s Note: MDPI stays neutral with regard to jurisdictional claims in published maps and institutional affiliations.

