
Energy-Use Inefficiency and Policy Governance in Central Asian Countries


Abstract
:1. Introduction
2. Literature Review and Contribution
2.1. Energy-Growth Nexus
2.2. Energy-Environmental Kuznets Curve (EEKC)
2.3. Energy-Use Inefficiency of CA Countries
3. Empirical Studies
3.1. Descriptive Analysis
3.2. Econometric Analysis: Methodology and Data
3.3. Econometric Analysis: Estimation Results
3.4. Econometric Analysis: Factor Compositions in Energy-Use Inefficiencies
3.5. The Case of Uzbekistan
4. Conclusions
Author Contributions
Funding
Institutional Review Board Statement
Informed Consent Statement
Data Availability Statement
Conflicts of Interest
Appendix A

| Kazakhstan | Kyrgyzstan | Tajikistan | Turkmenistan | Uzbekistan |
|---|---|---|---|---|
| Population (thousand, 2020) | ||||
| 18,754 | 6592 | 9538 | 6031 | 34,232 |
| Surface Area (thousand sq. km) | ||||
| 2725 | 200 | 141 | 488 | 447 |
| GDP per capita (current prices USD, 2020) | ||||
| 8733 | 1146 | 844 | 7967 | 1702 |
| Income Classification (2020) | ||||
| upper middle | lower middle | lower middle | upper middle | lower middle |
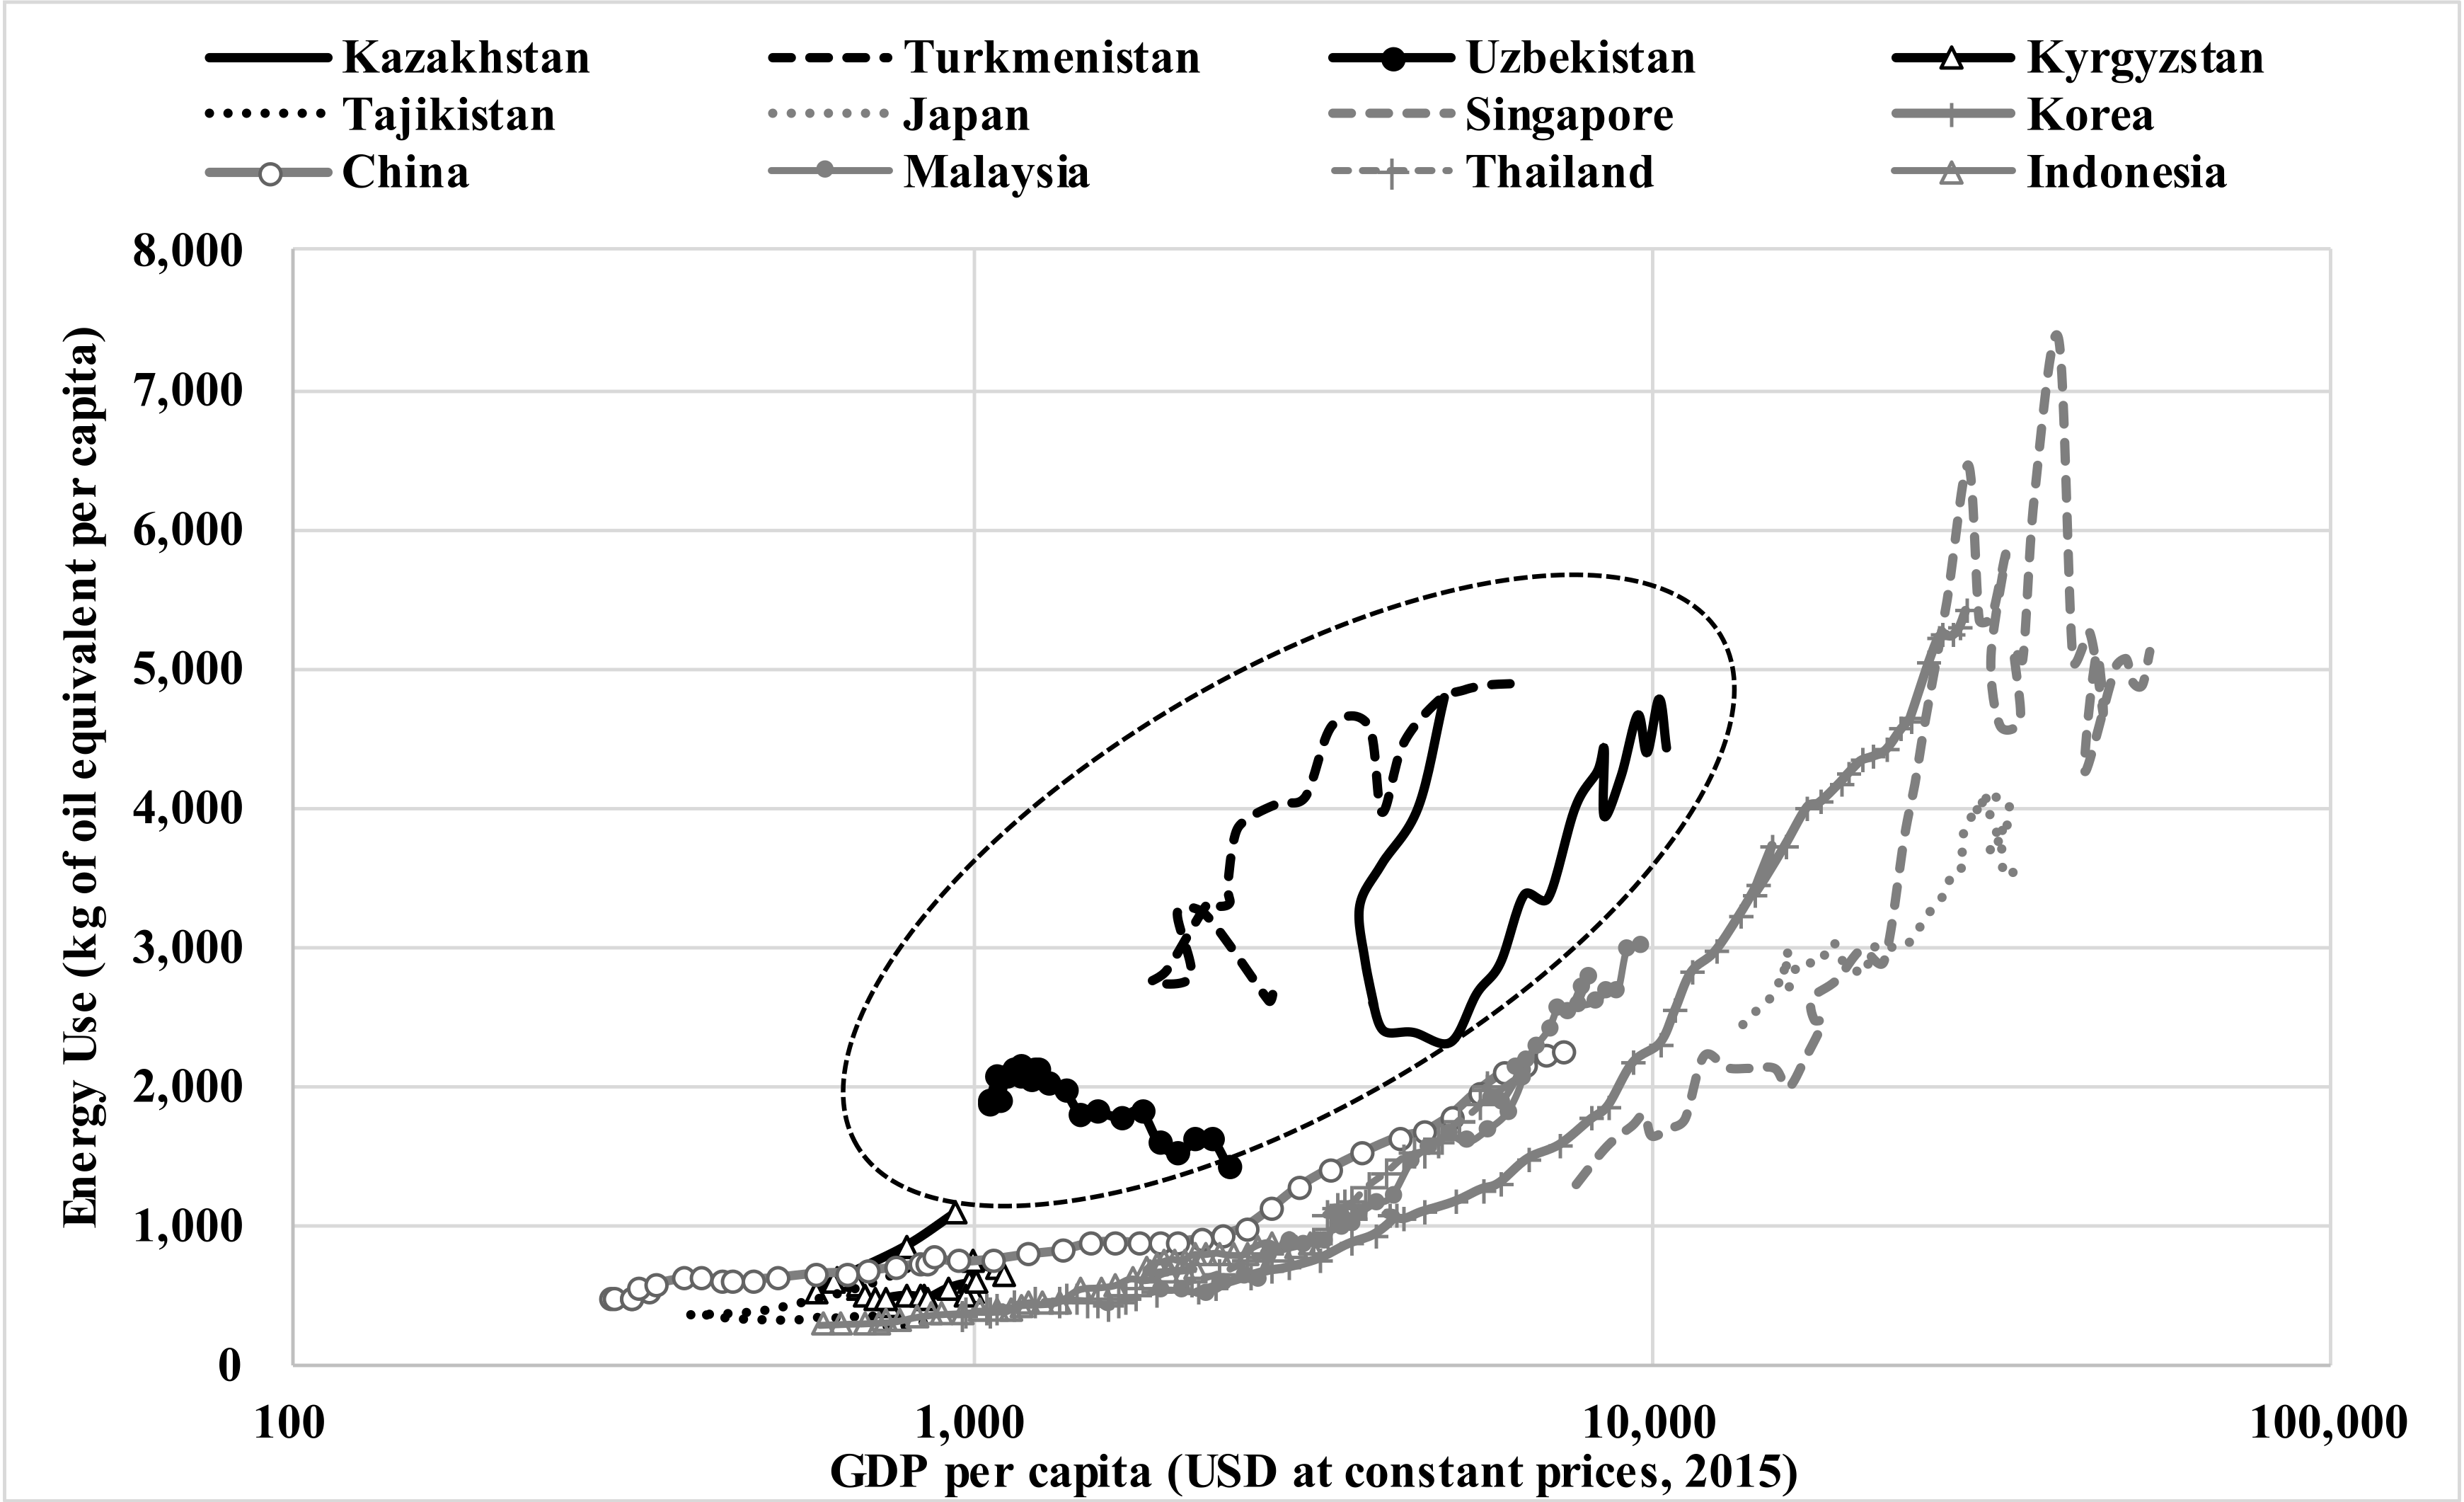
| Energy Use (kg of oil equivalent per capita, average for 1996–2014) | ||||
| 3511 | 552 | 336 | 3925 | 1843 |
| East Asia & Pacific (excluding high income): 1.567 | ||||
| Oil Rents (% of GDP, average for 1996–2019) | ||||
| 14.796 | 0.372 | 0.130 | 15.267 | 4.055 |
| East Asia & Pacific (excluding high income): 1.524 | ||||
| Natural Gas Rents (% of GDP, average for 1996–2019) | ||||
| 1.207 | 0.027 | 0.050 | 25.086 | 11.205 |
| East Asia & Pacific (excluding high income): 0.281 | ||||
| Coal Rents (% of GDP, average for 1996–2019) | ||||
| 1.339 | 0.147 | 0.115 | 0.000 | 0.101 |
| East Asia & Pacific (excluding high income): 1.035 | ||||
| Variables | Obs. | Mean | Std. Dev. | Min | Max |
|---|---|---|---|---|---|
| eng | 861 | 1477 | 1715 | 105 | 7794 |
| ypc | 912 | 6151 | 10,702 | 172 | 49,915 |
| nrr | 706 | 5.993 | 10.182 | 0.001 | 58.319 |
| gve | 383 | −0.168 | 0.866 | −1.604 | 2.236 |
| rgq | 383 | −0.284 | 0.892 | −2.214 | 2.142 |
| rol | 383 | −0.355 | 0.834 | −1.648 | 1.706 |
| cor | 383 | −0.458 | 0.840 | −1.625 | 2.229 |
| Variables | Levin, Lin & Chu Test | Fisher ADF Chi-Square | Fisher PP Chi-Square |
|---|---|---|---|
| ln eng | −1.798 ** | 71.693 *** | 128.777 *** |
| ln ypc | −1.968 ** | 91.554 *** | 274.895 *** |
| (ln ypc)2 | −2.060 ** | 86.051 *** | 341.777 *** |
| nrr | −6.113 *** | 320.314 *** | 64.189 *** |
| gve | −7.847 *** | 79.188 *** | 92.957 *** |
| rgq | −8.918 *** | 95.223 *** | 132.251 *** |
| rol | −6.501 *** | 72.084 *** | 59.643 * |
| cor | −6.549 *** | 61.532 * | 79.343 *** |
| gve | rgq | rol | cor | |
|---|---|---|---|---|
| gve | 1.000 | |||
| rgq | 0.912 | 1.000 | ||
| rol | 0.931 | 0.889 | 1.000 | |
| cor | 0.928 | 0.872 | 0.950 | 1.000 |
| VIF | 11.875 | 6.425 | 13.032 | 12.001 |
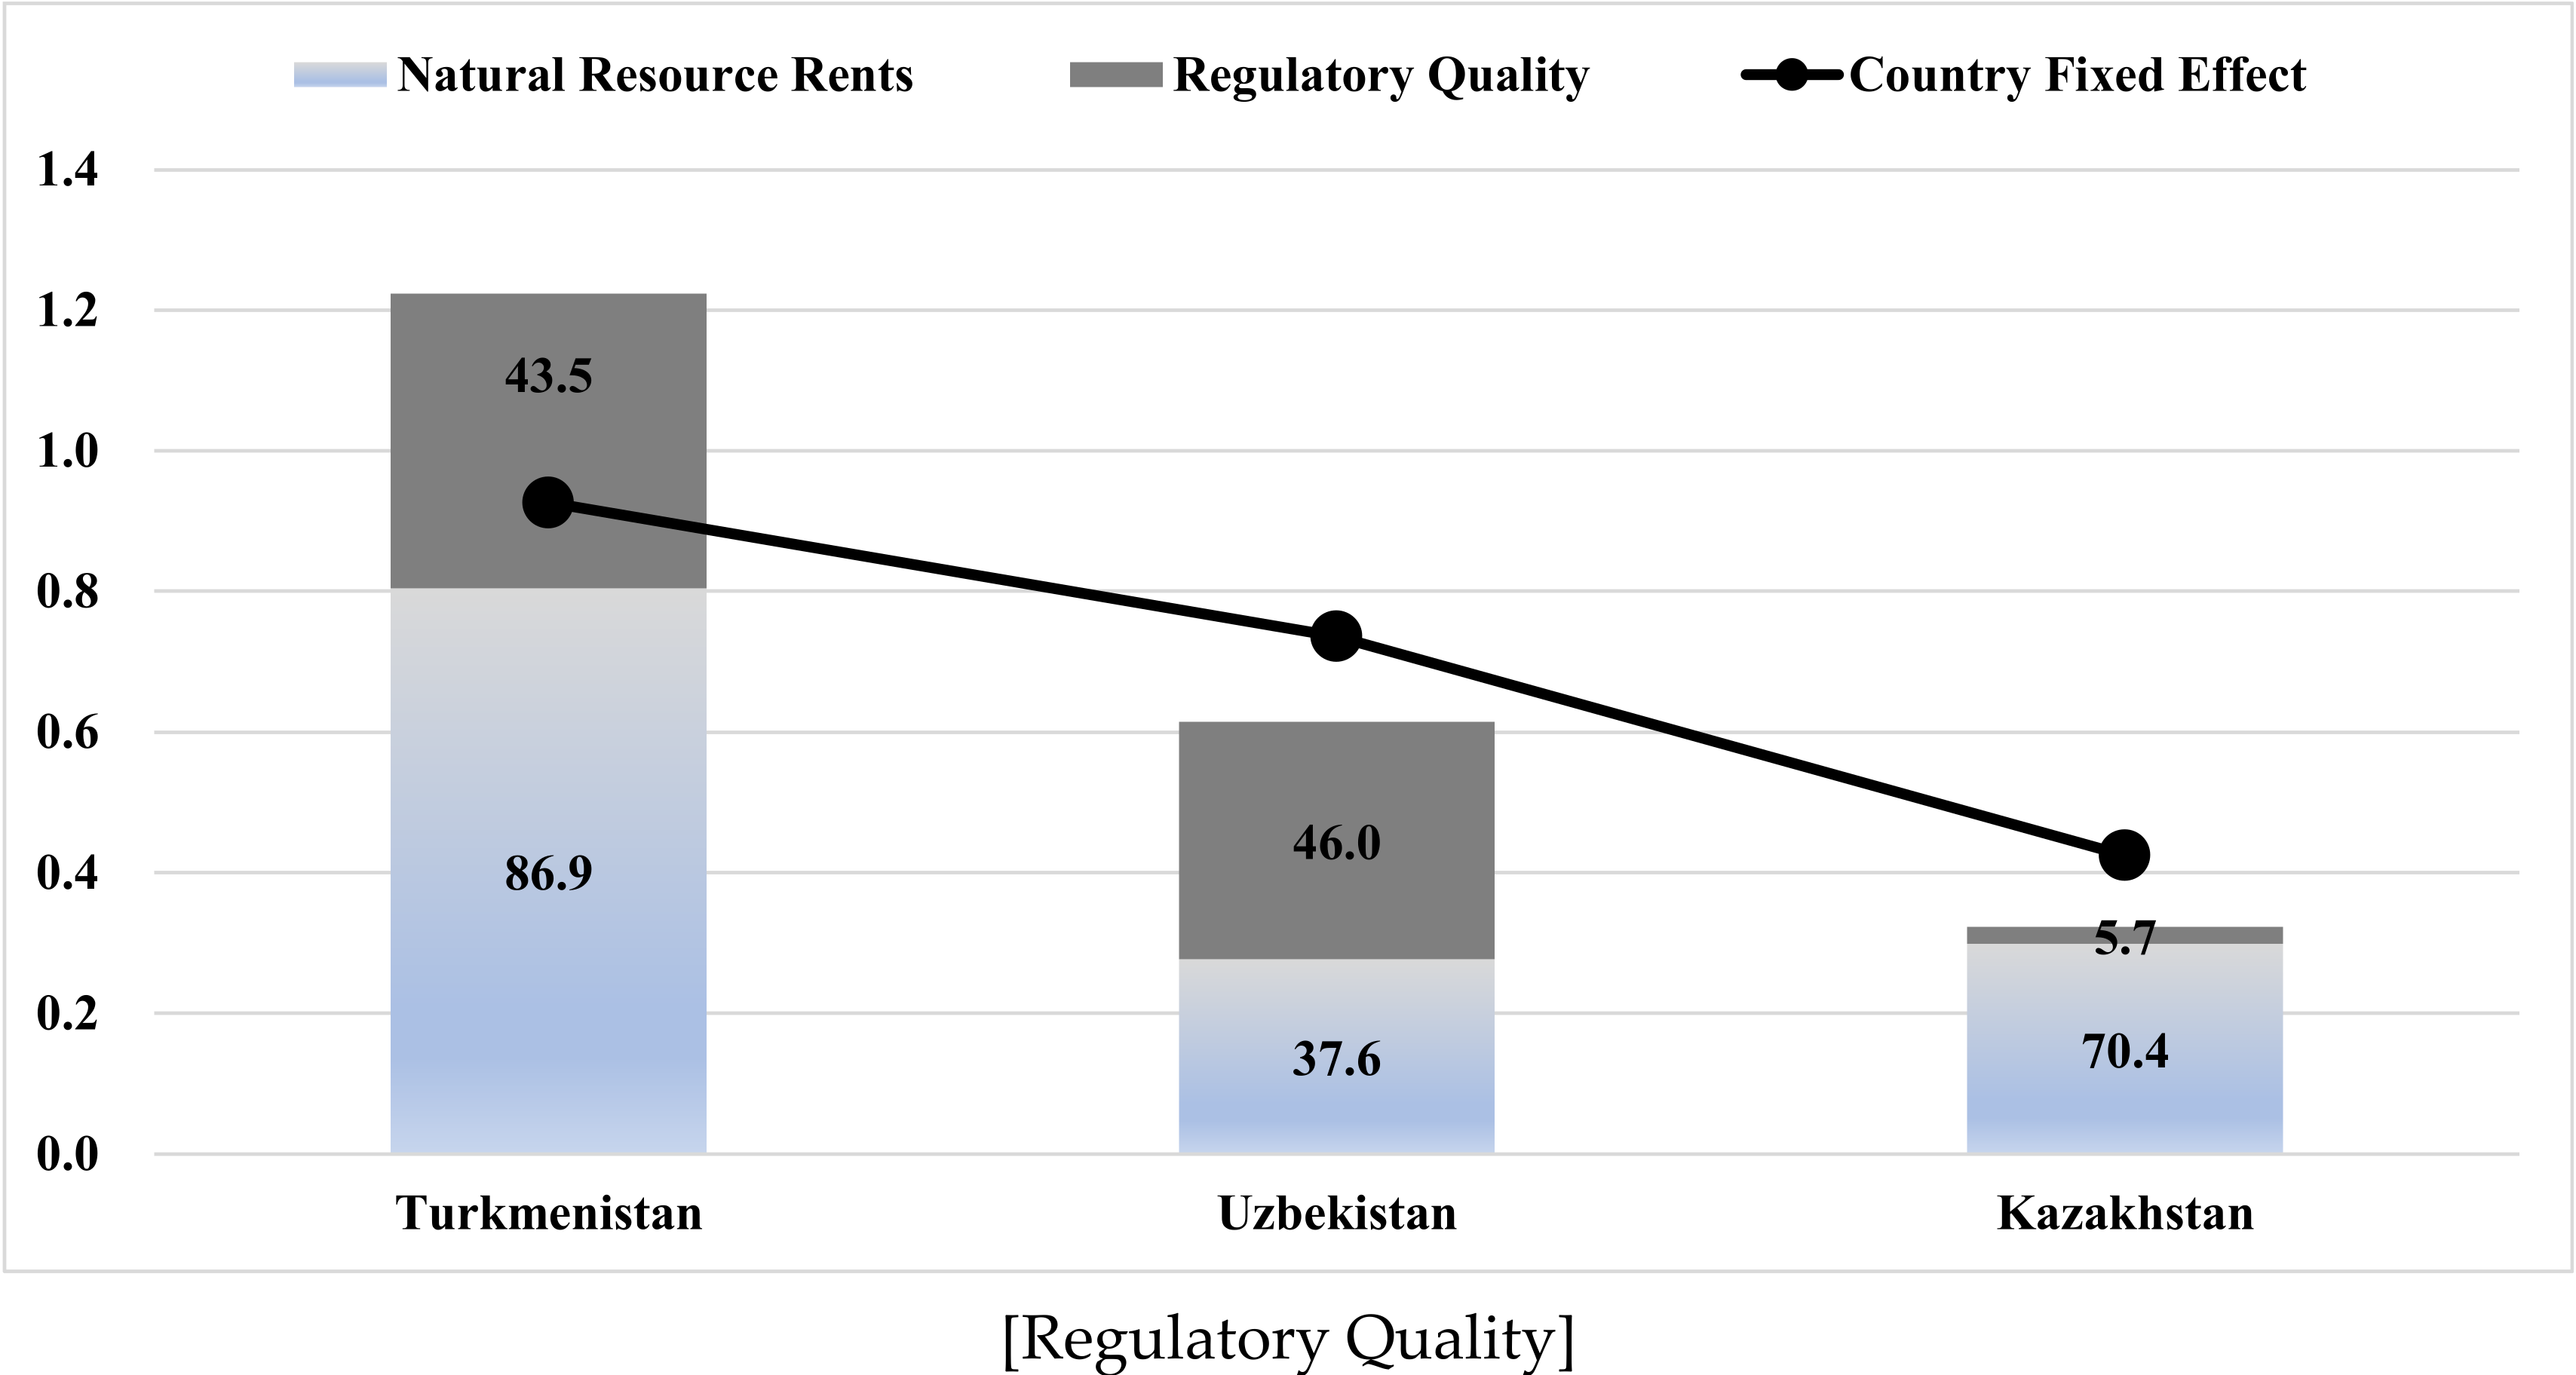
| [Regulatory Quality] | ||||||||
|---|---|---|---|---|---|---|---|---|
| Fixed Effects | nrr | (b)— China nrr | (c) × 0.020 | rgq | (e)— China rgq | (f) × −0.248 | (d) + (g) | |
| (a) | (b) | (c) | (d) | (e) | (f) | (g) | (h) | |
| Turkmenistan | 0.926 | 43.787 | 40.919 | 0.805 | −1.955 | −1.689 | 0.419 | 1.224 |
| Uzbekistan | 0.736 | 16.941 | 14.074 | 0.277 | −1.628 | −1.362 | 0.338 | 0.615 |
| Kazakhstan | 0.425 | 18.066 | 15.199 | 0.299 | −0.363 | −0.097 | 0.024 | 0.323 |
| China | 0.000 | 2.868 | - | - | −0.266 | - | - | - |
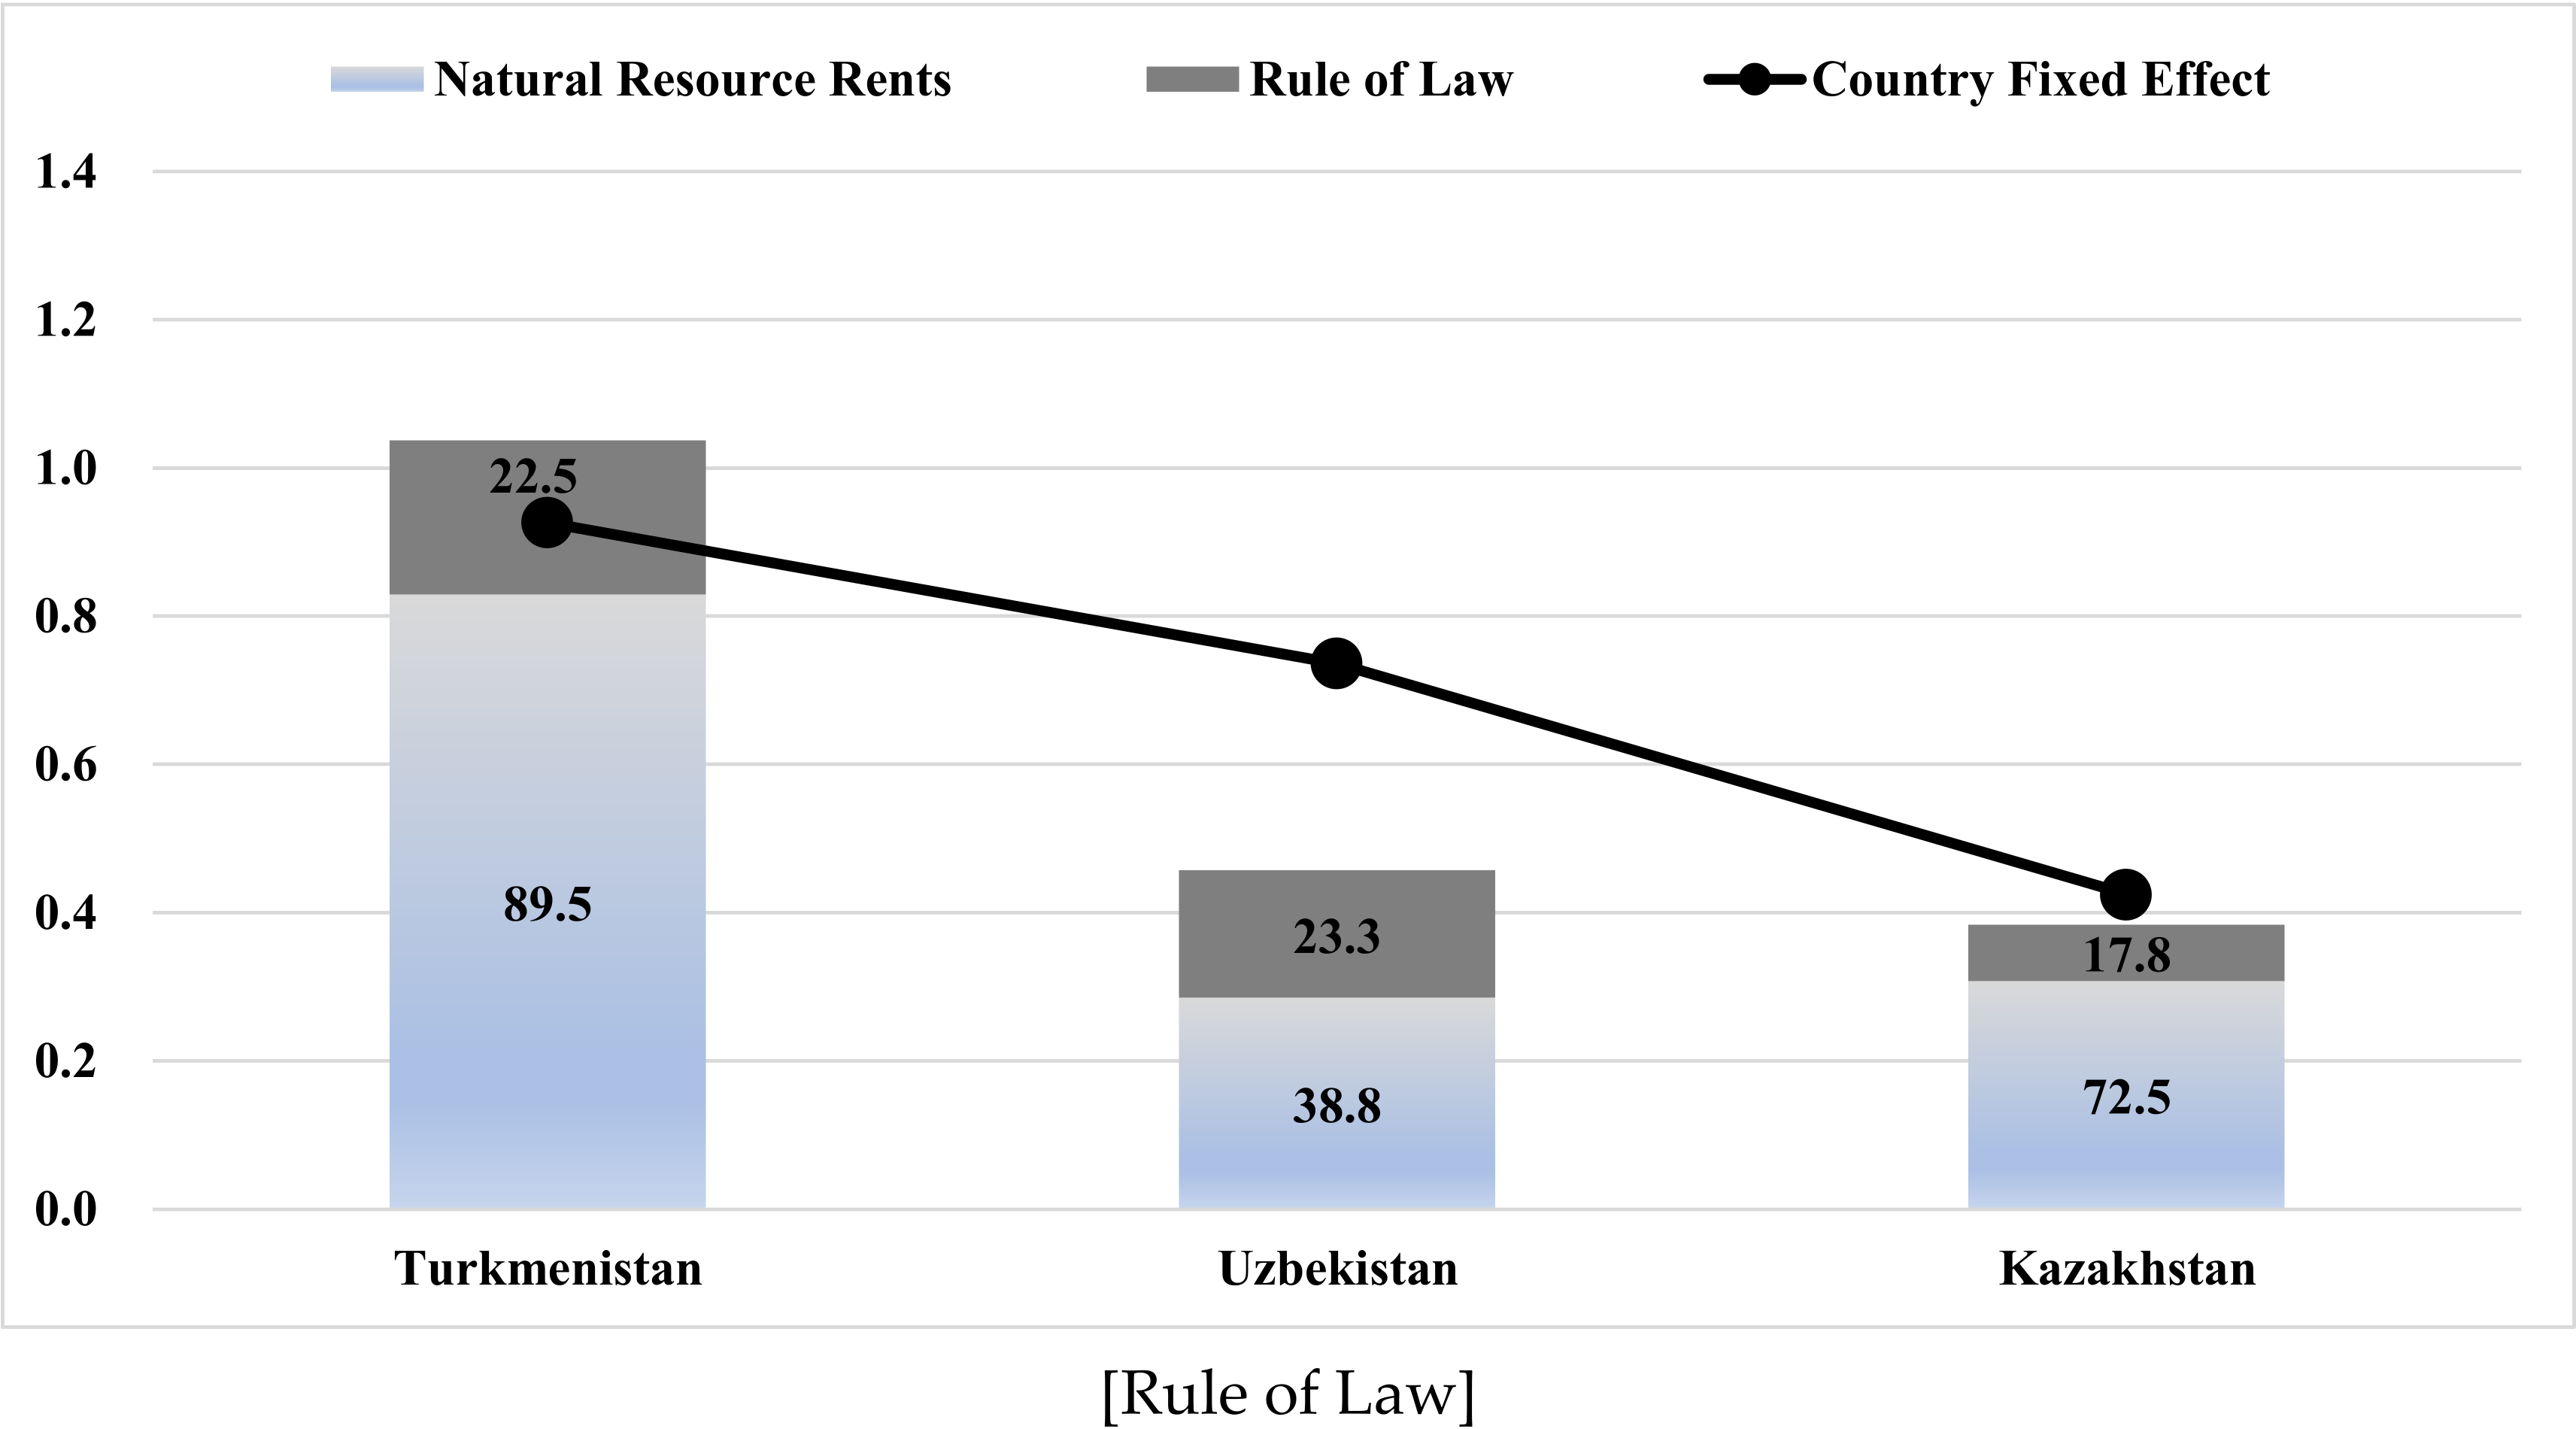
| [Rule of Law] | ||||||||
| Fixed Effects | nrr | (b)— China nrr | (c) × 0.020 | rol | (e)— China rol | (f) × −0.214 | (d) + (g) | |
| (a) | (b) | (c) | (d) | (e) | (f) | (g) | (h) | |
| Turkmenistan | 0.926 | 43.787 | 40.919 | 0.829 | −1.470 | −0.973 | 0.208 | 1.038 |
| Uzbekistan | 0.736 | 16.941 | 14.074 | 0.285 | −1.299 | −0.802 | 0.172 | 0.457 |
| Kazakhstan | 0.425 | 18.066 | 15.199 | 0.308 | −0.850 | −0.353 | 0.076 | 0.384 |
| China | 0.000 | 2.868 | - | - | −0.497 | - | - | - |
References
- Dorian, J.P.; Tojiev, U.; Tonkopy, M.S.; Alaibek, O.; Daxiong, Q. Energy in central Asia and northwest China: Major trends and opportunities for regional cooperation. Energy Policy 1999, 27, 281–297. [Google Scholar] [CrossRef]
- Dorian, J.P. Central Asia: A major emerging energy player in the 21st century. Energy Policy 2006, 34, 544–555. [Google Scholar] [CrossRef]
- Kaliakparova, G.S.; Gridneva, Y.E.; Assanova, S.S.; Sauranbay, S.B.; Saparbayev, A.D. International economic cooperation of Central Asian countries on energy efficiency and use of renewable energy sources. Int. J. Energy Econ. Policy 2020, 10, 539–545. [Google Scholar] [CrossRef]
- Kraft, K.; Kraft, A. On the relationship between energy and GNP. J. Energy Dev. 1978, 3, 401–403. [Google Scholar]
- Menegaki, A.N. A Guide to Econometric Methods for the Energy-Growth Nexus; Academic Publishing: London, UK, 2020. [Google Scholar]
- Asafu-Adjaye, J. The relationship between energy consumption, energy prices and economic growth: Time series evidence from Asian developing countries. Energy Econ. 2000, 22, 615–625. [Google Scholar] [CrossRef] [Green Version]
- Saboori, B.; Sulaiman, J. CO2 emissions, energy consumption and economic growth in association of Southeast Asian nations (ASEAN) countries: A cointegration approach. Energy 2013, 55, 813–822. [Google Scholar] [CrossRef]
- Lee, C.C.; Chang, C.P. Energy consumption and economic growth in Asian economies: A more comprehensive analysis using panel data. Resour. Energy Econ. 2008, 30, 50–65. [Google Scholar] [CrossRef]
- Fang, Z.; Chang, Y. Energy, human capital and economic growth in Asia Pacific countries—evidence from a panel cointegration and causality analysis. Energy Econ. 2016, 56, 177–184. [Google Scholar] [CrossRef]
- Menegaki, A.N.; Tugcu, C.T. Two versions of the index of sustainable economic welfare (ISEW) in the energy-growth nexus for selected Asian countries. Sustain. Prod. Consum. 2018, 14, 21–35. [Google Scholar] [CrossRef]
- Grossman, G.; Krueger, A. Environmental impacts of the North American Free Trade Agreement. In The U.S.-Mexico Free Trade Agreement; Garber, P., Ed.; MIT Press: Cambridge, MA, USA, 1993. [Google Scholar]
- Suri, V.; Chapman, D. Economic growth, trade and energy: Implications for the environmental Kuznets curve. Ecol. Econ. 1998, 25, 195–208. [Google Scholar] [CrossRef]
- Shahbaz, M.; Mahalik, M.K.; Shahzad, S.J.H.; Hammoudeh, S. Does the environmental Kuznets curve exist between globalization and energy consumption? Global evidence from the cross-correlation method. Int. J. Financ. Econ. 2019, 24, 540–557. [Google Scholar] [CrossRef] [Green Version]
- Pablo-Romero, M.P.; Sanchez-Braza, A. Residential energy environmental Kuznets curve in the EU-28. Energy 2017, 125, 44–54. [Google Scholar] [CrossRef]
- Mahmood, H.; Maalel, N.; Hassan, M.S. Probing the Energy-Environmental Kuznets Curve hypothesis in oil and natural gas consumption models considering urbanization and financial development in Middle East countries. Energies 2021, 14, 3178. [Google Scholar] [CrossRef]
- Hundie, S.K.; Daksa, M.D. Does energy-environmental Kuznets curve hold for Ethiopia? The relationship between energy intensity and economic growth. J. Econ. Struct. 2019, 8, 21. [Google Scholar] [CrossRef]
- Shahbaz, M.; Mutascu, M.; Azim, P. Environmental Kuznets curve in Romania and the role of energy consumption. Renew. Sustain. Energy Rev. 2013, 18, 165–173. [Google Scholar] [CrossRef] [Green Version]
- Chen, P.Y.; Chen, S.T.; Hsu, C.S.; Chen, C.C. Modeling the global relationships among economic growth, energy consumption and CO2 emissions. Renew. Sustain. Energy Rev. 2016, 65, 420–431. [Google Scholar] [CrossRef]
- Luzzati, T.; Orsini, M. Investigating the energy-environmental Kuznets curve. Energy 2009, 34, 291–300. [Google Scholar] [CrossRef]
- Pablo-Romero, M.P.; De Jesus, J. Economic growth and energy consumption: The Energy-Environmental Kuznets Curve for Latin America and the Caribbean. Renew. Sustain. Energy Rev. 2016, 60, 1343–1350. [Google Scholar] [CrossRef]
- Aruga, K. Investigating the Energy-Environmental Kuznets Curve Hypothesis for the Asia-Pacific Region. Sustainability 2019, 11, 2395. [Google Scholar] [CrossRef] [Green Version]
- Mehta, K.; Ehrenwirth, M.; Trinkl, C.; Zörner, W.; Greenough, R. The energy situation in Central Asia: A comprehensive energy review focusing on rural areas. Energies 2021, 14, 2805. [Google Scholar] [CrossRef]
- Dyussembekova, G.; Bayandina, G.; Zakirova, D.; Sartova, R.; Kalmenova, M. The electric energy sector of Kazakhstan: State and vision for the country taking into account the international trends. Int. J. Energy Econ. Policy 2019, 9, 179–186. [Google Scholar] [CrossRef]
- Gomez, A.; Dopazo, C.; Fueyo, N. The future of energy in Uzbekistan. Energy 2015, 85, 329–338. [Google Scholar] [CrossRef]
- Zheng, X.; Heshmati, A. An Analysis of Energy Use Efficiency in China by Applying Stochastic Frontier Panel Data Models. Energies 2020, 13, 1892. [Google Scholar] [CrossRef]
- Akram, R.; Chen, F.; Khalid, F.; Huang, G.; Irfan, M. Heterogeneous effects of energy efficiency and renewable energy on economic growth of BRICS countries: A fixed effect panel quantile regression analysis. Energy 2021, 215, 119019. [Google Scholar] [CrossRef]
- Song, F.; Yu, Y. Modelling energy efficiency in China: A fixed effects panel stochastic frontier approach. Econ. Political Stud. 2018, 6, 158–175. [Google Scholar] [CrossRef]
- Hausman, J. Specification tests in econometrics. Econometrica 1978, 46, 1251–1271. [Google Scholar] [CrossRef] [Green Version]
- Santos Silva, J.M.C.; Tenreyro, S. The log of gravity. Rev. Econ. Stat. 2006, 88, 641–658. [Google Scholar] [CrossRef] [Green Version]
- Head, K.; Mayer, T. Gravity equations: Workhorse, toolkit, and cookbook. In Handbook of International Economics; Gopinath, G., Helpman, E., Rogoff, K.S., Eds.; Elsevier: Oxford, UK, 2014. [Google Scholar]
- Levin, A.; Lin, C.F.; Chu, C. Unit root tests in panel data: Asymptotic and finite-sample properties. J. Econom. 2002, 108, 1–24. [Google Scholar] [CrossRef]
- Maddala, G.S.; Wu, S. A Comparative Study of Unit Root Tests with Panel Data and a New Simple Test. Oxf. Bull. Econ. Stat. 1999, 61, 631–652. [Google Scholar] [CrossRef]
- Choi, I. Unit Root Tests for Panel Data. J. Int. Money Financ. 2001, 20, 249–272. [Google Scholar] [CrossRef]
- Yuldassheva, O.; Goto, N.; Prescott, L. Assessment of energy transition through “MFA-based energy indicators set” in a transition economy—Uzbekistan. J. Hum. Environ. Symbiosis 2016, 28, 20–31. [Google Scholar]


| [OLS Estimation] | |||||
|---|---|---|---|---|---|
| (i) | (ii) | (iii) | (iv) | (v) | |
| Variables | ln eng | ln eng | ln eng | ln eng | ln eng |
| ln ypc | 1.064 *** | 0.982 *** | 0.973 *** | 0.980 *** | 0.999 *** |
| (42.152) | (13.923) | (13.982) | (13.707) | (13.378) | |
| (ln ypc)2 | −0.018 *** | −0.014 ** | −0.013 ** | −0.014 *** | −0.017 *** |
| (−5.939) | (−2.578) | (−2.589) | (−2.651) | (−2.928) | |
| nrr | 0.031 *** | 0.029 *** | 0.030 *** | 0.032 *** | |
| (10.272) | (10.709) | (10.935) | (11.823) | ||
| gve | −0.103 * | ||||
| (−1.796) | |||||
| rgq | −0.109 ** | ||||
| (−2.235) | |||||
| rol | −0.090 * | ||||
| (−1.680) | |||||
| cor | −0.050 | ||||
| (−0.808) | |||||
| Country fix effects | |||||
| Turkmenistan | 0.805 *** | ||||
| Uzbekistan | 0.695 *** | ||||
| Kazakhstan | 0.215 *** | ||||
| Mongolia | 0.091 * | ||||
| Kyrgyzstan | −0.038 | ||||
| Myanmar | −0.041 | ||||
| Nepal | −0.073 | ||||
| Tajikistan | −0.250 *** | ||||
| India | −0.291 *** | ||||
| Vietnam | −0.449 *** | ||||
| Cambodia | −0.468 *** | ||||
| Malaysia | −0.526 *** | ||||
| Pakistan | −0.537 *** | ||||
| Thailand | −0.605 *** | ||||
| Indonesia | −0.605 *** | ||||
| Korea | −0.613 *** | ||||
| Brunei | −0.626 *** | ||||
| Singapore | −0.788 *** | ||||
| Japan | −0.844 *** | ||||
| Philippines | −0.940 *** | ||||
| Sri Lanka | −0.996 *** | ||||
| Bangladesh | −1.242 *** | ||||
| Period fixed effects | Yes | Yes | Yes | Yes | Yes |
| Redundant VariableTest (F-value) | 4299.1 *** | 845.4 *** | 852.0 *** | 838.1 *** | 837.8 *** |
| Number of observation | 834 | 296 | 296 | 296 | 296 |
| [PPML Estimation] | |||||
| (i) | (ii) | (iii) | (iv) | (v) | |
| Variables | ln eng | ln eng | ln eng | ln eng | ln eng |
| ln ypc | 0.998 *** | 1.050 *** | 0.994 *** | 1.021 *** | 1.002 *** |
| (13.638) | (14.883) | (16.269) | (15.506) | (14.023) | |
| (ln ypc)2 | −0.021 *** | −0.020 *** | −0.014 ** | −0.017 *** | −0.015 ** |
| (−2.749) | (−2.752) | (−2.547) | (−2.778) | (−2.254) | |
| nrr | 0.021 *** | 0.019 *** | 0.020 *** | 0.020 *** | |
| (4.926) | (6.106) | (6.286) | (5.727) | ||
| gve | −0.181 * | ||||
| (−1.900) | |||||
| rgq | −0.248 *** | ||||
| (−3.715) | |||||
| rol | −0.214 *** | ||||
| (−3.172) | |||||
| cor | −0.233 *** | ||||
| (−3.535) | |||||
| Country fix effects | |||||
| Turkmenistan | 0.926 *** | ||||
| Uzbekistan | 0.735 *** | ||||
| Kazakhstan | 0.424 *** | ||||
| Mongolia | 0.212 | ||||
| Brunei | −0.002 | ||||
| Kyrgyzstan | −0.035 | ||||
| Nepal | −0.072 | ||||
| Korea | −0.156 | ||||
| Malaysia | −0.172 | ||||
| Myanmar | −0.189 | ||||
| India | −0.255 * | ||||
| Singapore | −0.278 | ||||
| Tajikistan | −0.285 | ||||
| Thailand | −0.330 *** | ||||
| Japan | −0.387 | ||||
| Vietnam | −0.411 *** | ||||
| Pakistan | −0.442 *** | ||||
| Indonesia | −0.455 *** | ||||
| Cambodia | −0.520 *** | ||||
| Philippines | −0.766 *** | ||||
| Sri Lanka | −0.889 *** | ||||
| Bangladesh | −1.218 *** | ||||
| Period fixed effects | Yes | Yes | Yes | Yes | Yes |
| Number of observation | 834 | 296 | 296 | 296 | 296 |
Publisher’s Note: MDPI stays neutral with regard to jurisdictional claims in published maps and institutional affiliations. |
© 2022 by the authors. Licensee MDPI, Basel, Switzerland. This article is an open access article distributed under the terms and conditions of the Creative Commons Attribution (CC BY) license (https://creativecommons.org/licenses/by/4.0/).
Share and Cite
Taguchi, H.; Asomiddin, A. Energy-Use Inefficiency and Policy Governance in Central Asian Countries. Energies 2022, 15, 1299. https://doi.org/10.3390/en15041299
Taguchi H, Asomiddin A. Energy-Use Inefficiency and Policy Governance in Central Asian Countries. Energies. 2022; 15(4):1299. https://doi.org/10.3390/en15041299
Chicago/Turabian StyleTaguchi, Hiroyuki, and Aktamov Asomiddin. 2022. "Energy-Use Inefficiency and Policy Governance in Central Asian Countries" Energies 15, no. 4: 1299. https://doi.org/10.3390/en15041299
APA StyleTaguchi, H., & Asomiddin, A. (2022). Energy-Use Inefficiency and Policy Governance in Central Asian Countries. Energies, 15(4), 1299. https://doi.org/10.3390/en15041299