Article

A Framework Based on Machine Learning for Analytics of Voltage Quality Disturbances

by
Azam Bagheri
1,
Roger Alves de Oliveira
2,*,
Math H. J. Bollen
2 and
Irene Y. H. Gu
3
1
AI & Future Technologies, Industrial and Digital Solutions, ÅF Pöyry AB (Afry), 411 19 Gothenburg, Sweden
2
Electric Power Engineering, Luleå University of Technology, 931 87 Skellefteå, Sweden
3
Department Electrical Engineering, Chalmers University of Technology, 412 96 Gothenburg, Sweden
*
Author to whom correspondence should be addressed.
Energies 2022, 15(4), 1283; https://doi.org/10.3390/en15041283
Submission received: 5 January 2022 / Revised: 3 February 2022 / Accepted: 8 February 2022 / Published: 10 February 2022

Abstract

:
This paper proposes a machine-learning-based framework for voltage quality analytics, where the space phasor model (SPM) of the three-phase voltages before, during, and after the event is applied as input data. The framework proceeds along with three main steps: (a) event extraction, (b) event characterization, and (c) additional information extraction. During the first step, it utilizes a Gaussian-based anomaly detection (GAD) technique to extract the event data from the recording. Principal component analysis (PCA) is adopted during the second step, where it is shown that the principal components correspond to the semi-minor and semi-major axis of the ellipse formed by the SPM. During the third step, these characteristics are interpreted to extract additional information about the underlying cause of the event. The performance of the framework was verified through experiments conducted on datasets containing synthetic and measured power quality events. The results show that the combination of semi-major axis, semi-minor axis, and direction of the major axis forms a sufficient base to characterize, classify, and eventually extract additional information from recorded event data.

1. Introduction

Among power quality (PQ) disturbances, three of the main voltage events are voltage dip, voltage swell, and (voltage or supply) interruption. Each of these events can result in undesired process or production interruptions or malfunctioning of sensitive loads such as PLC controllers, industrial installations, etc. [1]. Mitigation or compensation of these events results in a more reliable and high-quality electrical power supply.
Standard methods for PQ analytics are part of the RMS-voltage framework, where the RMS-voltage is used for detection, classification, and characterization, as prescribed in IEC 61000-4-30 [2] and IEEE 1564 [3]. The term “rms voltage variations”, which is generally used in IEEE power-quality standards, is a clear reference to the existence of such an RMS-voltage-based framework. Within the IEC document, the one-cycle rms voltage is used to characterize dips, swells, and interruptions, A 10 or 12-cycle rms voltage is used to characterize slow variations in voltage magnitude. The RMS-based framework has resulted in the extensive use of power-quality monitoring to develop large volumes of statistical data and common benchmarks [3]. However, the standardization appears to have stopped further innovation and development, for example, to remove limitations regarding event characterization, the three-phase character of most of the measurements, and extending the methodology to voltage and current transients [4,5]. Event characterization aims to obtain single event characteristics (SECs) that can be used to interpret the corresponding voltage event and its impact on the grid and equipment connected to the grid [6,7,8,9]. The method proposed in [6] was based on wavelet transform and used for the detection of voltage dips. Voltage dip characterization in terms of magnitude and phase-angle jump is defined in [7]. By such a characterization, the authors of [7] define four types of voltage dips (from A to D; in [8], the so-called ABC classification is extended to seven types (from A to F)). Space vector was proposed in [9] for characterizing voltage dips and swells. The well-known SECs based on rms voltages are “residual voltage” and “duration” [10]. These characteristics are defined for any dip, swell, and interruption. The characteristics are also defined for unbalanced and multi-stage events, but for those, they are less easy to interpret [11,12]. In order to obtain more precise characteristics for multi-stage events, a segmentation technique is needed to decompose the event recording into stationery (pre-event, during-event, and post-event) and non-stationary (transition) segments [6,7,13].
In order to allow better interpretation of unbalanced voltage dips, the symmetric component algorithm (SCA) [8] and six-phase algorithm (SPA) [14] were proposed. Both introduce three additional SECs: “characteristic voltage” (CV), “positive-negative factor” (PNF) and dip type (DT) [8,14]. Another limitation of the RMS-based framework is that some dip characteristics, e.g., point-on-wave, unbalance and phase-angle jump, and characteristics of voltage transients require other parameters than RMS voltage [15,16].
The space-phasor model (SPM) [17] forms a more comprehensive model for PQ analytics compared with the RMS-based model [4,9]. The SPM model-based SECs are based on the ellipse parameters: semi-minor axis, semi-major axis, and the direction of the ellipse, allowing complete characterization for both balanced and unbalanced events [4,9]. The method proposed in [9] was based on signal processing tools and inferences from the experts to define the steps for feature extraction, segmentation, classification, and characterization. No machine learning (ML) or deep learning (DL) algorithms were applied in [9]. Moreover, ref. [9] does not discuss the possibility of applying space-vector for the pre-processing of waveforms and does not show a comparison with benchmarking algorithms for event classification as SCA and SPA.
Apart from the mentioned RMS-Model limitations, the large number of installed PQ monitors in power grids leads to a large amount of data. This incentivizes using artificial intelligence (AI)-based methods. The first type of artificial intelligence method was based on human expertise to define features and perform tasks such as classification and identification of power quality events. Expert systems were applied in [13] for the classification of different types of voltage dips concerning the underlying causes based on pre-defined rules. The identification and classification of voltage and current disturbances in power systems by the expert system were proposed in [18] in 2007.
Driven by the huge improvements in computer processing, another group of algorithms that teach themselves through data samples was applied to power quality. This group based on training data is called machine learning (ML). ML was applied for similar applications as the expert system [19,20,21,22,23,24]. Most of the applications are established pre-labeled data by unsupervised learning, e.g., shallow neural networks [19,20,21,24] and support vector machines [22,23]. Few works apply unsupervised learning: Ref. [25] applies principal component analysis and [26] k-means clustering.
Since 2018, deep learning (DL), a subset of machine learning based on multiple hidden layers of neural networks, has gained attention to power quality. Diverse DL techniques were applied to power quality data such as convolutional neural networks (CNNs), long-short-term memory (LSTM), generative adversarial networks (GANs), and deep autoencoder (DAE). CNNs are applied for the classification of PQ disturbances as in [27,28,29,30,31], voltage dip classification [5], recognition of voltage dip causes [32], and prediction of harmonics [33,34,35]. LSTM is applied to classification of events [36,37], recognition of voltage dip causes [38], voltage dip classification [39], and harmonic prediction [33]. GANs are applied to the classification of PQ events [40]. DAE is applied in the feature extraction in the classification of PQ events [27], unsupervised feature learning for clustering of daily-harmonics variations [41,42], and spectral data [43].
Most of the works on ML and DL applied synthetic data for the training and testing of their algorithms. Such synthetic data sets might not correspond to the same information as measurements. However, they provided the knowledge for enabling the extraction of additional information from a large amount of data. Such ML and DL methods can be used as input for automatic decision-making by smart grids. However, the existing set of single-event characteristics, based on the rms-model, is a limitation for developing machine-learning tools and such automatic decision-making. New frameworks should be developed to provide analytics of large power quality data sets.
This paper further extends the earlier works and proposes a complete framework that receives the SPM complex values as an input and then proceeds with three successive steps: (a) event data extraction and classification, (b) characterization, and (c) additional information extraction. These three steps are essential for the framework, but they can be filled in using different algorithms. In this paper, to illustrate the framework, the Gaussian anomaly detection (GAD) method is used in the first step to extract event data as anomalous data from the entire recording. The principal component analysis (PCA) method is applied in the second step to calculate the SECs from the extracted event data. The resulted SECs are transferred to the third step to extract additional information about the event, such as the location of the electrical fault that led to a voltage dip. The main contributions of the proposed framework are:
  • The proposed SPM-based framework enables instantaneous event detection since it does not use any low-pass filter such as the RMS-based model. It also provides the same basic characteristics (semi-minor, semi-major axes, ellipse rotating angle) for dip, swell, and interruption events;
  • The framework uses fully automatic machine learning (ML) methods (e.g., GAD, PCA) for voltage event analytics that do not need any human involvement during the entire process;
  • The framework is applicable to all types of voltage events by just adjusting pre-defined setpoints for different event types;
  • The framework is scalable to a large amount of data, which is important for modern power systems in which a huge amount of data is recorded continuously.
The proposed framework is applied to both measured and synthetic voltage events, and the results are compared with the results from existing methods. The remainder of this paper is organized as follows: Section 2 illustrates the proposed framework and its different modules (event detection, event characterization, and information extraction modules) and the applied ML method (GAD and PCA) in each module. Section 3 presents the results, and Section 4 the discussion. Section 5 concludes this paper.

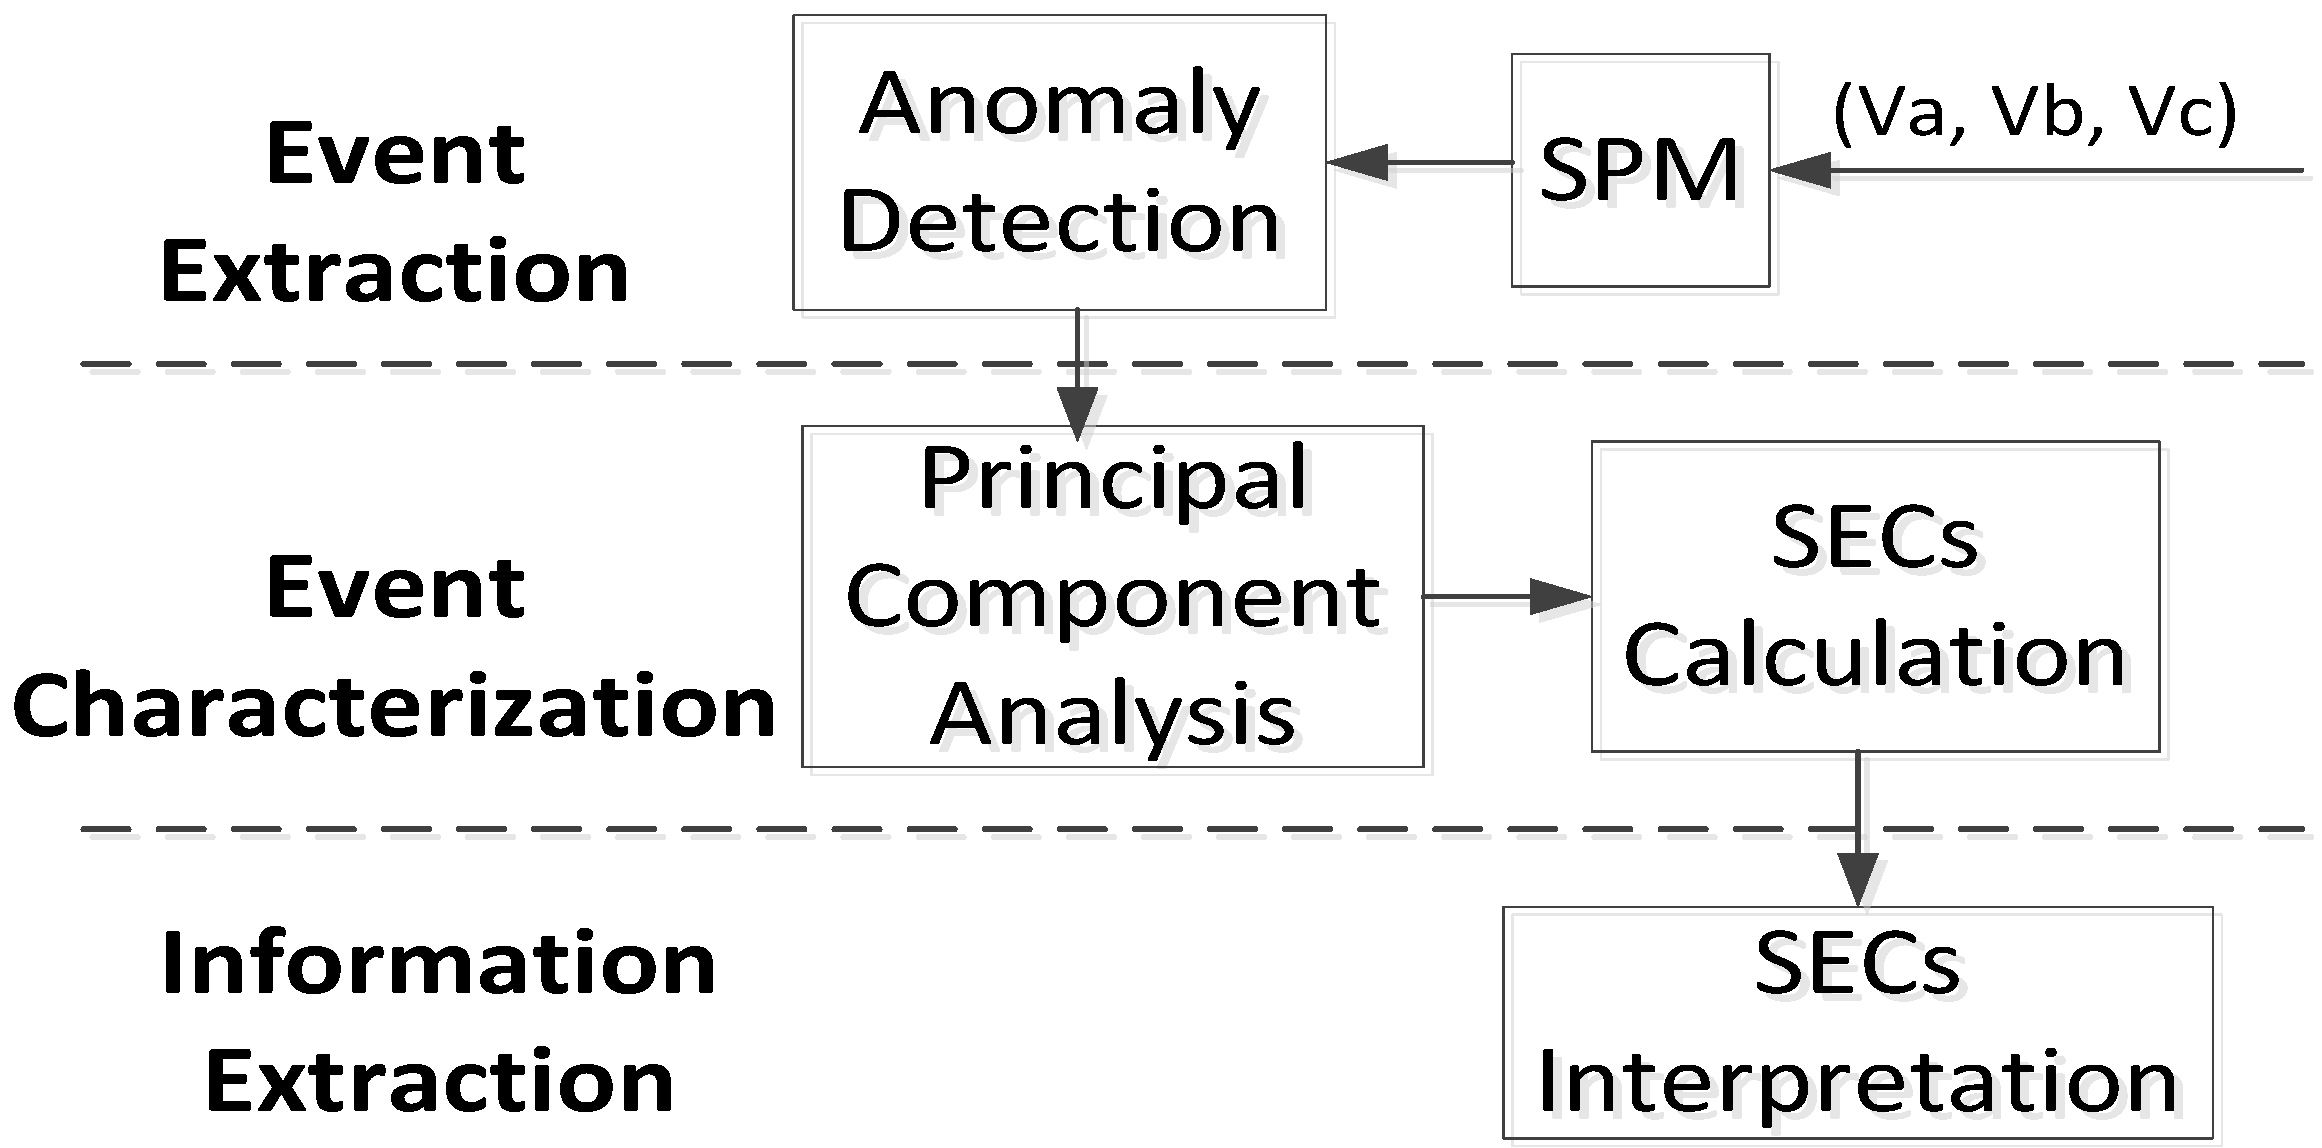
2. Proposed Framework for Voltage Event Analytics

The proposed framework for voltage event analytics consists of three modules:
  • Event data extraction and classification: the event data extraction distinguishes between normal data and deviated data. The event data extraction step concerns the choice of a selection function and the choice of a threshold; common choices for voltage dip detection are 1-cycle RMS voltage and 90% of the nominal voltage [2]. The event classification aims at putting similar events into the same class [2]. Voltage events are typically divided into four main groups: transients, voltage dips, voltage swells, and interruptions. Further, voltage dips are categorized according to their origins, such as electrical faults, motor starting, or transformer energizing [9,44]. Fault-based dips are classified into seven different classes regarding the type of the fault;
  • Event characterization: this step aims at calculating efficient SECs of the corresponding event such as event duration, depth of dip, and phase-angle-jump;
  • Extracting additional information: this step aids in interpreting given SECs from the previous step to extract information about the event’s origin, its impacts, etc.
The flow diagram of the proposed framework is shown in Figure 1, indicating the main steps of this framework: even extraction, event characterization, and information extraction. The framework applies different machine learning methods for each step. The following subsections describe the applied measured data and corresponding pre-processing tasks, as well as developing machine-learning methods for voltage event analytics applied in the first and second steps.

2.1. Measured Data

The PQ continuously monitors samples of the three-phase voltage streams among other electrical quantities (e.g., current and harmonics). The space phasor model of the sampled three-phase voltage signals is given by:
x [ n ] = 2 3 [ V a [ n ] + α V b [ n ] + α 2 V c [ n ]
where V a ,   V b , and V c are three-phase voltage signals, n = 1 ,   ,   N denotes the number of samples, α = e j 2 π / 3 , and x   ( N × 1 ) is a row vector of complex values. Partitioning data vector x into real and imaginary parts, the resulted data matrix X is:
X = [ x R       x I   ] n × 2
where x R contains the real part, and x I   is the imaginary part of all SPM samples. During normal voltage conditions, the space phasor model, in the complex plane, is approximately in the shape of a circle where its radius (or modulus of the SPM) varies typically between 0.9 and 1.1 pu. During a voltage dip, the modulus drops below 0.9 pu (or another selected threshold), and for an unbalanced dip, it even varies with time. For a voltage swell, the modulus exceeds 1.1 pu (or another selected threshold). Once a modulus of the SPM drops crosses one of these thresholds, the event detection is triggered, and PQ monitors records during-event data as well as several pre-event and post-event cycles. Thereby, further precise voltage event analytics depends on how accurately the during-event samples are extracted from pre-event and post-event samples. A typical recorded voltage event by a PQ monitor is shown in Figure 2. The waveform (upper left side), a modulus of an SPM as a function of time (lower left side), and the SPM (right side) of a typical voltage dip event. The pre-event and post-event segments are considered normal voltages since the corresponding modulus is within the thresholds. The during-event segment results in an ellipse inside the inner circle (dip threshold), where the modulus also drops below 0.9 pu. The SPM modules recover over 0.9 pu. Such a recovery occurs twice every cycle. Therefore, it would result in a method that detects a voltage dip every 10 ms. This way, to obtain the whole dip recording, the last recovery over the threshold is considered as dip end.

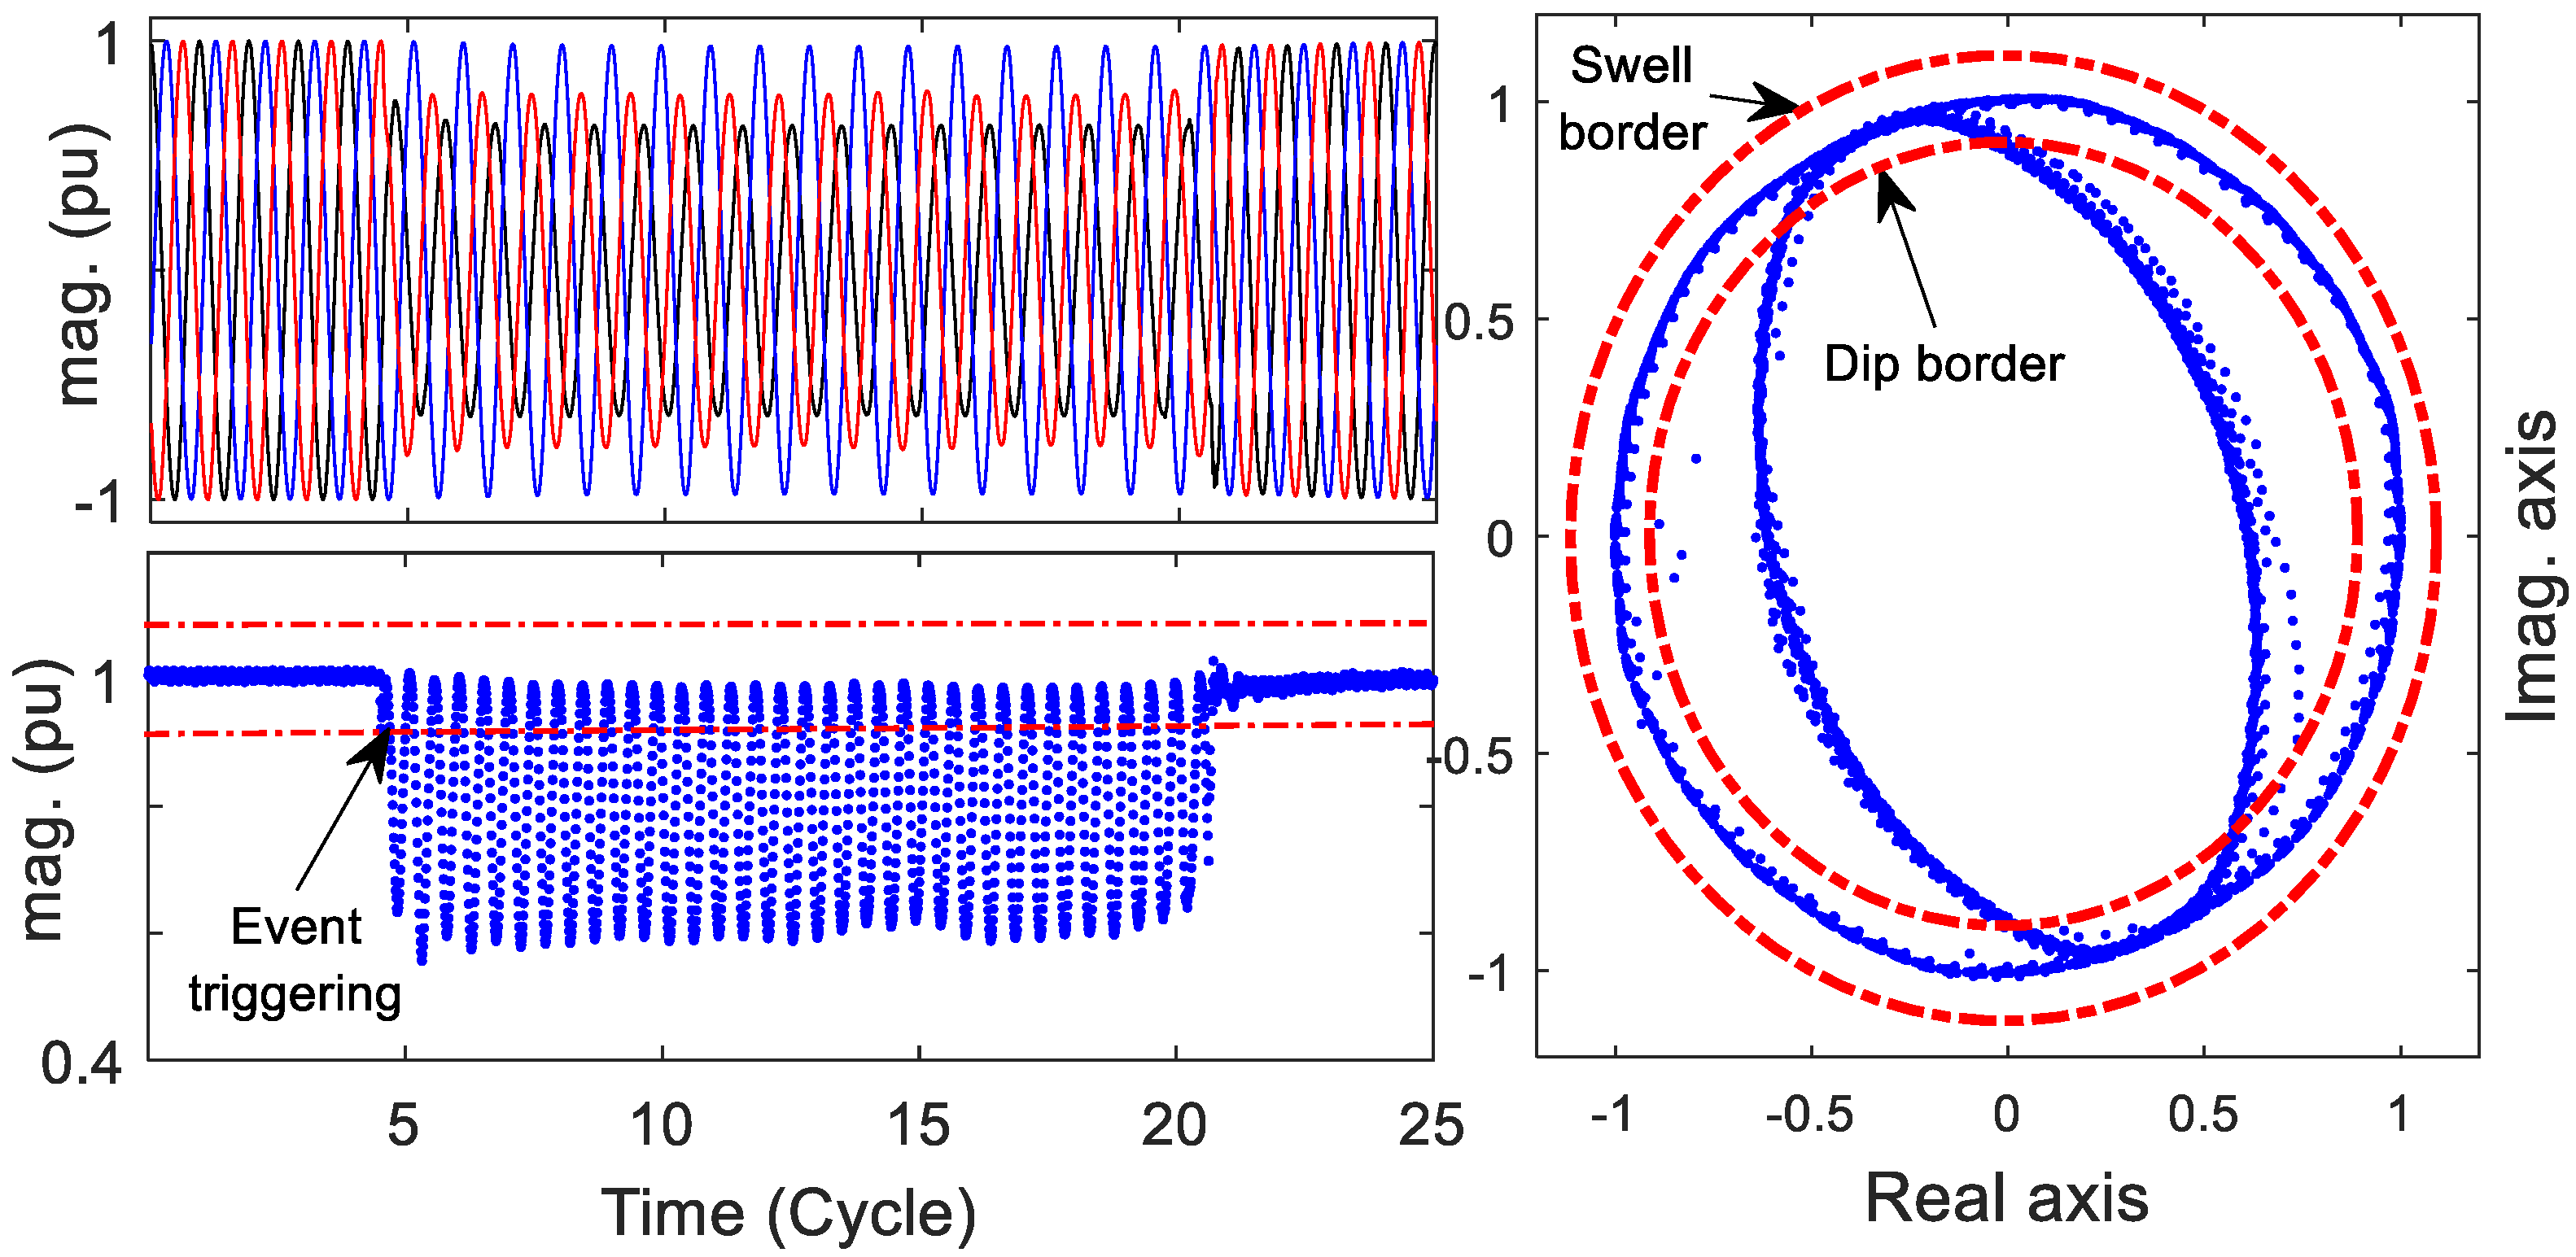
2.2. Extracting Voltage Event (Anomalous) Samples Using GAD Method

From a machine learning viewpoint, the anomaly detection technique is used to find observations that do not correspond to an expected pattern [45]. The proposed framework uses Gaussian-based anomaly detection to distinguish the voltage event samples from normal samples belonging to the pre-event and post-event segments. Given the measured data matrix X = [ x R x I   ] in (2), the assigned Gaussian distribution, for each dimension (i.e., column of the data matrix), is determined as follows:
p ( x j ; μ j , δ j 2 ) = 1 2 π δ j 2 e ( x ( j ) μ j ) 2 2 δ j 2
where j = R   or   I denotes the dimension of the data matrix. μ j and δ j 2 are the mean and standard variance of the j -th dimension, given by the following equations:
  μ j = 1 N i = 1 N x j ( i )
δ j 2 = 1 N i = 1 N ( x j ( i ) μ j ) 2
By the estimated Gaussian distribution for each test data sample x i ( j ) , the corresponding z -score is obtained as follow:
z ( i ) = | x j ( i ) μ j | δ j
A sample declared to be anomalous if:
z ( i ) > N 1 N t γ / 2 , N 1 2 ( N 2 ) + t γ / 2 , N 1 2
where N is a total number of samples and the t γ / 2 , N 1 is a threshold used to refer to a sample as anomalous. It is obtained from t-distribution at a confidence level of γ 2 N [46]. The anomalous samples are saved in event data matrix denoted as Y = [ y R ,   y I ] .

2.3. PCA Applications for Calculating the Single-Event Characteristics

Principal component analysis (PCA) finds a lower-dimensional representation of data. If the dimension of data is reduced into only two dimensions, the data is projected by the PCA into two data vectors u 1 and u 2 . The vector u 1 is the principal direction of variation of the data, and u 2 the secondary direction of the variation [47].
To develop a PCA technique, from the given event data matrix Y , the matrix M = [ m R , m I ] K × 2 is constructed where:
m R = y R h μ R
m I = y I h μ I
where h is a unitary K × 1 column vector, and μ R and μ I are empirical means of y R and y I , respectively. Next, the covariance matrix C is calculated as follow:
C = 1 2 M T M
where stands for outer product, M T is a transpose of matrix M , and C is 2 × 2 symmetric matrix that results in two orthogonal eigenvectors ( u 1 ,   u 2 ) [28]. By projecting the original data matrix Y into these eigenvectors, the projected data Y ˜ = [ y ˜ 1 ,   y ˜ 2 ] is in an ellipse shape, and y ˜ 1 ,   y ˜ 2 vectors tend to the ellipse semi-minor and major axis. Therefore, the magnitude of ellipse axes and the rotating angle is derived as follows:
The semi-major axis ( A y ) , semi-minor axis ( A x ), and rotating angle of the ellipse ( φ ) (the direction of the semi-major axis) are obtained as follows:
A x = | y ˜ 1 |
A y = | y ˜ 2 |
φ = y ˜ 1
Further, the duration of the event is determined by dividing the number of anomalous samples ( k ) by the sampling frequency ( f s ) as d = K f s .

2.4. Extracting Additional Information Using Single-Event Characteristics

This module extracts information about the voltage event, such as its type, underlying cause, etc., using the single-event characteristics.

2.4.1. Transient and Non-Transient Events

The “event duration” can be defined as the time between the first drop of the SPM modulus below the threshold and the last recovery above the threshold. By using this “event duration” characteristic, the voltage disturbances can be divided into “transient” and “non-transient” events. A transient event has a duration of less than one cycle. The discussion below is mainly for non-transient events; for transient events, a separate set of characteristics is needed. The SPM, as used in this paper, allows for a clear distinction between transient and non-transient events, something that was not possible with the rms-based approach.

2.4.2. Voltage Event Type

Based on the semi-minor and semi-major axes, a distinction can be made between a dip, swell, and interruption as follows:
Voltage dip: δ i n t e r r u p t i o n < A y < δ d i p ;
Voltage swell: A x > δ s w e l l ;
Voltage interruption: A y < δ i n t e r r u p t i o n .
The combination where A y > δ d i p and A x < δ s w e l l would be normal voltage and not lead to triggering as a voltage event. It is worth noting that these definitions largely but not completely correspond to the definitions according to IEC 61000-4-30 [2]. The IEC definitions are based on the deviation of the RMS voltage from its nominal value. Typical thresholds are 90% of the nominal voltage for voltage dips, 110% for voltage swells, and 10% for voltage interruption. The definitions based on ellipse parameters are different but not more arbitrary than the standard ones.

2.4.3. Unbalance Type

The unbalance type (UT) provides information about which phasor(s) are involved in voltage events. The UT characteristic is determined according to the direction of the semi-major axis. The rules in Table 1 show the relationship between the ellipse-rotating angle (i.e., the direction of the semi-major axis) and the UT characteristic. For instance, the first rule says once the rotating angle φ is in the range ( 0 , 30 ] , then the UT is I b , which means the event is taking place between phase “ b ” and neutral. For this case, the notation means that the angle φ is between 0 and 30 degrees, including 30 degrees; i.e., 0 < φ 30 .

2.4.4. Electrical Fault Type Detection and Localization

By the single-event characteristics, a dip or swell is assigned to one class of an extended ABC classification [8,14]. The recognition of the ABC class allows estimating the original type and location of a fault. The dip class is obtained as represented in Column 4 of Table 2 by UT, zero-sequence ( z 0 ) and semi-major axis ( A x ). The dip class is dependent on the type of fault and the winding connection between the fault and monitoring locations. It allows obtaining information on the type and location of the related fault, even when there is no information from the protection system. The relation between fault types and dip classes, which are also referred to as dip types [8,14], can be obtained as shown in Table 2. In Table 2, “<1” means that the length of the semi-major axis is somewhere between unity and the length of the semi-minor axis. The table only considers DY and YY-connected transformers, where the latter gives the same transformation as two DY transformers. Additional rules can be added for other transformer types [8]. The dip class alone cannot determine if the dip is at higher or lower voltage levels. However, faults at lower voltage levels result in shallow dips, whereas severe dips are either due to faults at the same or a higher voltage level.

3. Results

This section aims at verifying the performance of the proposed framework for analyzing the recorded voltage event data. Voltage dip measurements are used to illustrate the framework’s effectiveness.

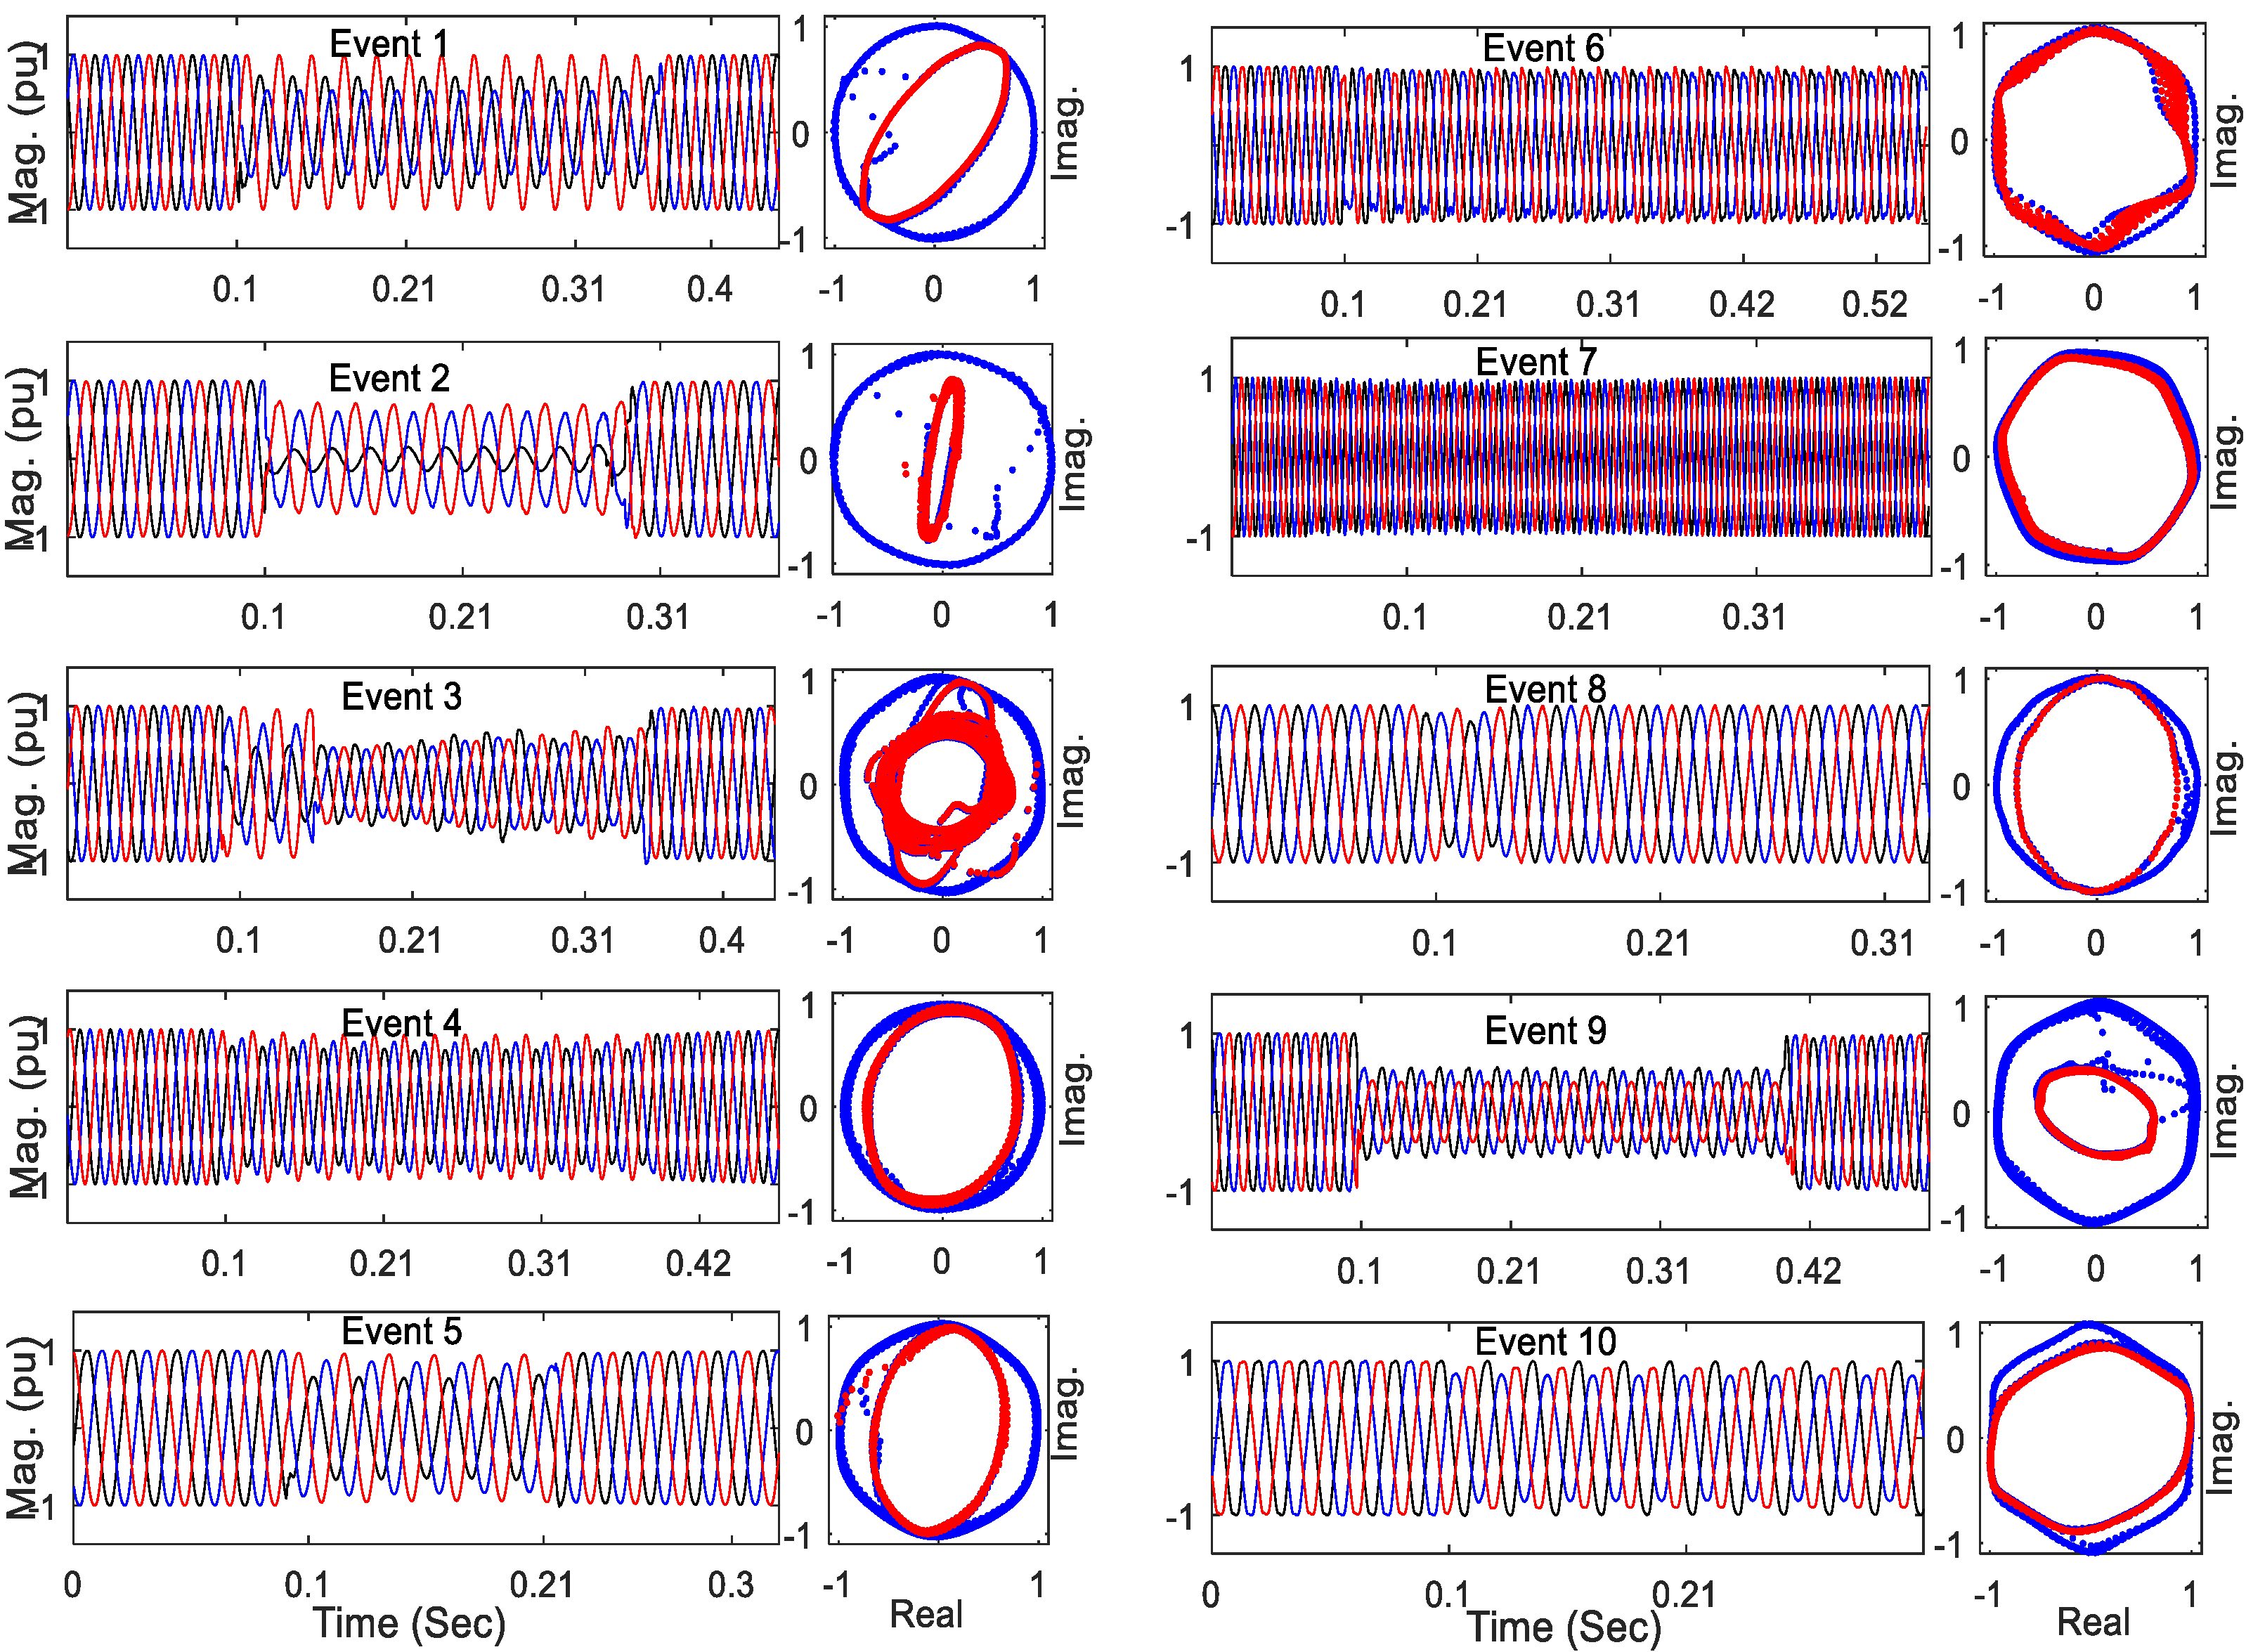
3.1. Measured Voltage Event Data

We applied about 200 different voltage dips measured at a distributed level to evaluate the performance of the proposed framework in terms of voltage event detection and characterization. However, due to lack of space, we show the results of only 10 examples. The three-phase voltage waveforms and the corresponding SPM of these 10 examples are shown in Figure 3. The SPM of the whole data is shown in blue, and the SPM of during-event data, extracted by GAD, is shown in red. The numerical results of event characterization, using the PCA method, are shown in Table 3. The zero-sequence parameter is zero for all the examples.
For instance, for the second event (Ev. 2), semi-major ( A x ) and semi-minor ( A y ) axes are equal to 0.77 pu and 0.11 pu, respectively. The rotating angle of the ellipse is 81.5 ° . This results in dip class F with significant voltage drop in phase “a” and consequently unbalanced type I a . The event lasts for about 215 ms. The event is due to a two-phase-to-ground fault above a Dy transformer, at a higher voltage level (above 10 kV). The third event (Ev. 3) is a multi-stage dip that consists of two event segments. The first segment is an unbalanced short-duration dip that lasts for about three cycles (60 ms). The next segment is a balanced dip. The GAD method extracted both segments as one event. By using PCA, the equivalent semi-major and semi-minor axes for the whole event are calculated as 0.66 pu and 0.56 pu, respectively.
The second segment lasts for about 11 cycles (220 ms), during which there is no big difference between semi-minor and major axes (0.1 pu). Alternatively, the PCA can be applied to each event segment separately, as in [4]. Ev. 6 is a heavy distorted shallow dip for which the SPM is a heavily distorted circle. The semi-minor and semi-major axes of the corresponding ellipse are 1.01 pu and 0.93 pu, respectively. The event lasts for 293 ms. The heavy distortion and the fact that this is only present during part of the cycle points to transformer energizing as the origin for this event.

3.2. Comparison with Symmetric-Component and Six-Phase Algorithms

In this sub-section, the proposed framework (in terms of A y , A y , ϕ , and DT) is compared with two benchmarking methods (SCA and SPA) in terms of voltage dip characterization. Different synthetic dips, presented in [14] and shown in Table 4, are applied to all three methods. The synthetic dips are applied to these three methods, and the obtained characterization results are shown in Table 5. Events 1 through 4 are due to single-phase faults; they show the same voltage drop in phase “a”, 50%, but with different PAJs. The results for the SCA are shown in Columns 2–4 of Table 5; the SPA results are shown in Columns 6–8. The results of the proposed framework are shown in Columns 8–11. All three methods result in the same dip type for three first events. The large PAJ (−40 ° ) in Event 4 impacts the SPA algorithm and results in wrong unbalance type characteristics. Considering Event 1, the calculated CV characteristic by SCA and SPA methods and the calculated semi-minor axis by the proposed framework are all equal to 0.67 pu. Similarly, the values of the semi-major axis and PNF characteristics are the same and equal to 1 pu. Due to PAJ in Events 2–4, the semi-major axis increases, and the semi-minor axis decrease. The calculated PNF by the SCA remains 1 pu for all events, but the calculated PNF by the SPA for Event 4 increases to 1.04 pu. The CV and A y characteristics decrease with increasing PAJ.
Events 5–8 are due to phase-to-phase faults, including PAJ of 0, −17.8, −25.8, and −33.4 ° , respectively. In this case, the PAJ has more impact on SPA, which results in the wrong unbalance type for Events 7 and 8.
Events 9–12 are synthesized voltage dips obtained by adding load effects on Events 5–8. The PNF and A x characteristics are no longer equal to 1 pu. The load effect makes that the SCA results in the incorrect unbalance type for Events 11 and 12. The same impact is seen for the SPA. The load effect impacts the semi-minor and major axes much more than the rotating angle of the SPM ellipse and shows that the rotating angle of the ellipse is a robust parameter for voltage dip classification. The results show that there is a strong correlation between CV and semi-minor axis as well as between PNF and semi-major axis.

4. Discussion

In general, the results presented in this paper show that the GAD method is a suitable method for extracting event data from recorded voltage waveforms in a three-phase system and that the PCA facilitates calculating efficient single value characteristics for the voltage event. Some of the advantages of the proposed SPM-based framework are:
  • The possibility of instantaneous event detection, since it does not use any low-pass filter such as the one-cycle rms voltage. This results in a higher time resolution for the event duration, which is especially important for short-duration events. It also becomes much more straightforward to obtain the point-on-wave for event start and event end;
  • The possibility to provide the same basic characteristics (semi-minor, semi-major axes, direction of semi-major axis) and triggering algorithm for dips, swells, and interruptions. The use of these three characteristics gives a better characterization of voltage events in a three-phase system than the rms-based method. The proposed characterization is also more robust than the benchmarking algorithms proposed earlier for the characterization of three-phase events (SCA, SPA);
  • The same triggering algorithm can be used for voltage transients. It becomes possible to use a unique distinction between transients and non-transient events;
  • The possibility of visualizing exact transitions segments as points between circles/ellipses corresponding to the pre-, post-, and during-event segments. The SPM-based method can also be used as a base for event segmentation; further work towards this is recommended;
  • The SPM is also a better reference for the performance of three-phase equipment, such as three-phase electrical motors, as the SPM is aligned with the rotating nature of such equipment. This can be either a physical rotation (in the case of three-phase electrical motors) or an emulated one in the control algorithm (in the case of three-phase power-electronic converters;
  • In this paper, the method was applied to short-duration events, but a similar characterization can be applied to normal supply voltage variations. The existing method (as in IEC 61000-4-30) is to give (10/12-cycle, 120/150-cycle, and 10 minute) values of the three rms voltages and the voltage unbalance. Under the SPM-based method, this would be replaced by the semi-major axis, semi-minor axis, and direction of the semi-major axis;
  • The method uses machine-learning tools during the first two steps. Further machine-learning techniques can be applied during the second step, for example, for event segmentation. Machine-learning tools can also be used for the analysis of large amounts of events during step three;
  • The framework can unify a large amount of distinct event duration in a unified representation. The duration of events as voltage dips can be different for each waveform. Thus, the number of samples for each event can also be different; the number of stages can also imply a different number of samples. The framework keeps the original information in the SPM, which is not duration-dependent as RMS methods;
  • The SPM is the main contribution and the novelty presented in this framework. The steps for anomaly detection, event characterization, and information extraction can next be filled up with different ML methods. The choice of what is the best ML method is beyond the scope of this paper.
An obvious disadvantage of the proposed method is that it is not applicable to single-phase systems, installations, or equipment. The proposed method also does not allow for a characterization of the zero-sequence component. The latter is, however, equivalent to a single-phase system, and relatively simple methods are available or can be developed.

5. Conclusions

This paper proposes a machine learning-based framework that aims at handling large voltage event analytics in terms of event detection, event characterization, and information extraction, accepting a space phasor model (SPM) as input data. In the first step, the framework applies the Gaussian-based anomaly detection (GAD) to extract the during-event segments from the recorded data. Then, the principal component analysis (PCA) is used to derive semi-minor and semi-major axis values and consequently single event characteristics (SECs). The SEC draws additional information about the corresponding event, which is useful for event mitigation and decision-making in the (smart) grid. The effectiveness of the framework was verified through the analysis of voltage dip datasets. The proposed framework was shown to be more robust under phase-angle jump and load effect than existing methods.
Some recommendations for further works are:
  • Although the analysis of this work is focused on voltage dips, it is recommended to apply the framework to other voltage variations. For instance, the framework can be applied to measurements of transients to obtain SECs without the need for filtering;
  • The framework can be extended to the pre-processing of waveforms to evaluate harmonic distortion;
  • The framework can be used as the pre-processing in supervised ML/DL. The labels can be related to the origin and impact of the disturbances. Additional information as waveforms of current can provide more features to such a task;
  • The SPM can also be employed in unsupervised DL. Since the framework can keep the original information of waveforms in a unified representation, it makes it easier to cluster a large number of events with different durations. The application of clustering algorithms could provide the most common patterns of events for a large amount of events waveforms;
  • Further works can employ different and evaluate the optimum choice for ML and DL methods in the steps of anomaly detection, event characterization, and information extraction.

Author Contributions

Investigation and writing, A.B.; writing, editing, R.A.d.O.; writing, editing, supervision, and project administration, M.H.J.B.; writing, supervision, I.Y.H.G. All authors have read and agreed to the published version of the manuscript.

Funding

This research received external funding from the Swedish Energy Agency (project P39437-1 and P42979-1) as well as joint funding from Energiforsk and the Swedish Transport Administration (project 36267).

Conflicts of Interest

The authors declare no conflict of interest.

Abbreviations

CV Charactheristic Voltage
DLDeep Learning
DTDip Type
GADGaussian-based Anomaly Detection
MLMachine Learning
PAJPhase-Angle Jump
PCAPrincipal Component Analysis
PLCProgrammable Logic Controller
PNFPositive Negative Factor
PQPower Quality
SCASymmetric Component Algorithm
SECSingle Event Charachteristic
SPASix-phase Algorithm
SPMSpace Phasor Model
UTUnbalance Type

References

  1. Bollen, M.H. Understanding Power Quality Problems: Voltage Sags and Interruptions; IEEE Press: Piscataway, NJ, USA, 2000. [Google Scholar]
  2. International Electrotechnical Commission (IEC). Testing and Measurement Techniques-Power Quality Measurement Methods; IEC Standard 61000-4-30; International Electrotechnical Commission (IEC): Geneva, Switzerland, 2009. [Google Scholar]
  3. IEEE Guide for Voltage Sag Indices. IEEE Std. pp. 1564–2014. Available online: https://ieeexplore.ieee.org/document/6842577 (accessed on 15 December 2021).
  4. Bagheri, A.; Bollen, M.H.; Gu, I.Y. Improved characterization of multi-stage voltage dips based on the space phasor model. Electr. Power Syst. Res. 2018, 154, 319–328. [Google Scholar] [CrossRef]
  5. Bagheri, A.; Gu, I.Y.; Bollen, M.H.; Balouji, E. A robust transform-domain deep convolutional network for voltage dip classification. IEEE Trans. Power Deliv. 2018, 33, 2794–2802.–2802. [Google Scholar] [CrossRef]
  6. Gencer, Ö.; Öztürk, S.; Erfidan, T. A new approach to voltage sag detection based on wavelet transform. Int. J. Electr. Power Energy Syst. 2010, 32, 133–140. [Google Scholar] [CrossRef]
  7. Bollen, M.H.; Gu, I.Y. Signal Processing of Power Quality Disturbances; John Wiley & Sons: Hoboken, NJ, USA, 2006; Volume 30. [Google Scholar]
  8. Bollen, M.H. Characterisation of voltage sags experienced by three-phase adjustable-speed drives. IEEE Trans. Power Deliv. 1997, 12, 1666–1671. [Google Scholar] [CrossRef]
  9. Ignatova, V.; Granjon, P.; Bacha, S. Space vector method for voltage dips and swells analysis. IEEE Trans. Power Deliv. 2009, 24, 2054–2061. [Google Scholar] [CrossRef] [Green Version]
  10. Voltage Dip Immunity of Equipment and Installations, CIGRE/CIRED/UIE Working Group C4.110, April 2010. Available online: www.uie.org; www.e-cigre.org (accessed on 15 December 2021).
  11. Madrigal, M.; Rocha, B.H. A contribution for characterizing measured three-phase unbalanced voltage sags algorithm. IEEE Trans. Power Deliv. 2007, 22, 1885–1890. [Google Scholar] [CrossRef]
  12. Thakur, P.; Singh, A.K. Unbalance voltage sag fault-type characterization algorithm for recorded waveform. IEEE Trans. Power Deliv. 2013, 28, 1007–1014. [Google Scholar] [CrossRef]
  13. Styvaktakis, E.; Bollen, M.H.; Gu, I.Y. Expert system for classification and analysis of power system events. IEEE Trans. Power Deliv. 2002, 17, 423–428. [Google Scholar] [CrossRef]
  14. Bollen, M.H.; Zhang, L.D. Different methods for classification of three-phase unbalanced voltage dips due to faults. Electr. Power Syst. Res. 2003, 66, 59–69. [Google Scholar] [CrossRef]
  15. Wang, Y.; Bagheri, A.; Bollen, M.H.; Xiao, X.Y. Single-event characteristics for voltage dips in three-phase systems. IEEE Trans. Power Deliv. 2016, 32, 832–840–840. [Google Scholar] [CrossRef]
  16. Wang, Y.; Bollen, M.H.; Bagheri, A.; Xiao, X.Y.; Olofsson, M. A quantitative comparison approach for different voltage dip characterization methods. Electr. Power Syst. Res. 2016, 133, 182–190–190. [Google Scholar] [CrossRef]
  17. Barros, J.; Pérez, E. Automatic detection and analysis of voltage events in power systems. IEEE Trans. Instrum. Meas. 2006, 55, 1487–1493. [Google Scholar] [CrossRef]
  18. Reaz, M.B.I.; Choong, F.; Sulaiman, M.S.; Mohd-Yasin, F.; Kamada, M. Expert System for Power Quality Disturbance Classifier. IEEE Trans. Power Deliv. 2007, 22, 1979–1988. [Google Scholar] [CrossRef] [Green Version]
  19. Gaing, Z.-L. Wavelet-based neural network for power disturbance recognition and classification. IEEE Trans. Power Deliv. 2004, 19, 1560–1568. [Google Scholar] [CrossRef] [Green Version]
  20. Mishra, S.; Bhende, C.N.; Panigrahi, B.K. Detection and classification of power quality disturbances using S-transform and probabilistic neural network. IEEE Trans. Power Deliv. 2007, 23, 280–287. [Google Scholar] [CrossRef]
  21. Valtierra-Rodriguez, M.; Romero-Troncoso, R.d.; Osornio-Rios, R.A.; Garcia-Perez, A. Detection and classification of single and combined power quality disturbances using neural networks. IEEE Trans. Ind. Electron. 2013, 61, 2473–2482. [Google Scholar] [CrossRef]
  22. Ericsti, H.; Uçar, A.; Demir, Y. Wavelet-based feature extraction and selection for classification of power system disturbances using support vector machines. Electr. Power Syst. Res. 2010, 80, 743–752. [Google Scholar] [CrossRef]
  23. Axelberg, P.G.V.; Gu, I.Y.-H.; Bollen, M.H.J. Support vector machine for classification of voltage disturbances. IEEE Trans. Power Deliv. 2007, 22, 1297–1303. [Google Scholar] [CrossRef]
  24. Santoso, S.; Powers, E.J.; Grady, W.M.; Parsons, A.C. Power quality disturbance waveform recognition using wavelet-based neural classifier. II. Application. IEEE Trans. Power Deliv. 2000, 15, 229–235. [Google Scholar] [CrossRef]
  25. Gursoy, E.; Niebur, D. Independent component analysis for harmonic studies. In Time-Varying Waveform Distortions Power Systems; Wiley & Sons: The Atrium, UK, 2009; Volume 6, p. 217. [Google Scholar]
  26. Asheibi, A.; Stirling, D.; Sutanto, D. Analyzing harmonic monitoring data using supervised and unsupervised learning. IEEE Trans. Power Deliv. 2008, 24, 293–301. [Google Scholar] [CrossRef] [Green Version]
  27. Liu, H.; Hussain, F.; Shen, Y.; Arif, S.; Nazir, A.; Abubakar, M. Complex power quality disturbances classification via curvelet transform and deep learning. Electr. Power Syst. Res. 2018, 163, 1–9. [Google Scholar] [CrossRef]
  28. Cai, K.; Cao, W.; Aarniovuori, L.; Pang, H.; Lin, Y.; Li, G. Classification of power quality disturbances using wigner-ville distribution and deep convolutional neural networks. IEEE Access 2019, 7, 119099–119109. [Google Scholar] [CrossRef]
  29. Wang, S.; Chen, H. A novel deep learning method for the classification of power quality disturbances using deep convolutional neural network. Appl. Energy 2019, 235, 1126–1140. [Google Scholar] [CrossRef]
  30. Gong, R.; Ruan, T. A New Convolutional Network Structure for Power Quality Disturbance Identification and Classification in Micro-Grids. IEEE Access 2020, 8, 88801–88814. [Google Scholar] [CrossRef]
  31. Tian, J.; Wang, B.; Li, J.; Wang, Z. Adversarial Attacks and Defense for CNN based Power Quality Recognition in Smart Grid. IEEE Trans. Netw. Sci. Eng. 2021. Available online: https://ieeexplore.ieee.org/abstract/document/9652053/authors#authors (accessed on 15 December 2021).
  32. Zanoni, M.; Chiumeo, R.; Tenti, L.; Volta, M. Automated tool based on deep learning to assess voltage dips validity: Integration in the QuEEN MV network monitoring system. Renew. Energy Power Qual. J. 2021, 19, 235–240. [Google Scholar] [CrossRef]
  33. Balouji, E.; Bäckström, K.; McKelvey, T.; Salor, Ö. Deep-learning-based harmonics and interharmonics predetection designed for compensating significantly time-varying eaf currents. IEEE Trans. Ind. Appl. 2020, 56, 3250–3260. [Google Scholar] [CrossRef]
  34. Zjavka, L. Power quality statistical predictions based on differential, deep and probabilistic learning using off-grid and meteo data in 24-hour horizon. Int. J. Energy Res. 2021, 1–15. [Google Scholar] [CrossRef]
  35. Severoglu, N.; Salor, O. Statistical Models of EAF Harmonics Developed for Harmonic Estimation Directly from Waveform Samples Using Deep Learning Framework. IEEE Trans. Ind. Appl. 2021, 57, 6730–6740. [Google Scholar] [CrossRef]
  36. Gu, D.; Gao, Y.; Li, Y.; Zhu, Y.; Wu, C. A Novel Label-guided Attention Method for Multilabel Classification of Multiple Power Quality Disturbances. IEEE Trans. Ind. Inform. 2021. Available online: https://ieeexplore.ieee.org/abstract/document/9558707 (accessed on 15 December 2021).
  37. Özer, İ.; Efe, S.B.; Özbay, H. CNN/Bi-LSTM-based deep learning algorithm for classification of power quality disturbances by using spectrogram images. Int. Trans. Electr. Energy Syst. 2021, 31, e13204. [Google Scholar] [CrossRef]
  38. Zheng, Z.; Qi, L.; Wang, H.; Zhu, M.; Chen, Q. Recognition method of voltage sag causes based on Bi-LSTM. IEEJ Trans. Electr. Electron. Eng. 2020, 15, 418–425. [Google Scholar] [CrossRef]
  39. Balouji, E.; Gu, I.Y.H.; Bollen, M.H.J.; Bagheri, A.; Nazari, M. A LSTM-based deep learning method with application to voltage dip classification. In Proceedings of the 2018 18th International Conference on Harmonics and Quality of Power (ICHQP), Ljubljana, Slovenia, 13–16 May 2018; pp. 1–5. [Google Scholar]
  40. Jian, X.; Wang, X. A novel semi-supervised method for classification of power quality disturbance using generative adversarial network. J. Intell. Fuzzy Syst. 2021, 40, 3875–3885. [Google Scholar] [CrossRef]
  41. Ge, C.; Oliveira, R.A.d.; Gu, I.Y.-H.; Bollen, M.H.J. Deep Feature Clustering for Seeking Patterns in Daily Harmonic Variations. IEEE Trans. Instrum. Meas. 2021, 70, 1–10, Art no. 2501110. [Google Scholar] [CrossRef]
  42. Ge, C.; Oliveira, R.A.D.; Gu, I.Y.H.; Bollen, M.H.J. Unsupervised deep learning and analysis of harmonic variation patterns using big data from multiple locations. Electr. Power Syst. Res. 2021, 194, 107042. [Google Scholar] [CrossRef]
  43. De Oliveira, R.A.; Ravindran, V.; Ronnberg, S.K.; Bollen, M.H.J. Deep Learning Method with Manual Post-Processing for Identification of Spectral Patterns of Waveform Distortion in PV Installations. IEEE Trans. Smart Grid 2021, 12, 5444–5456. [Google Scholar] [CrossRef]
  44. Yalcin, T.; Ozdemir, M. Pattern recognition method for identifying smart grid power quality disturbance. In Proceedings of the 2016 17th International Conference on Harmonics and Quality of Power (ICHQP), Belo Horizonte, Brazil, 16–19 October 2016; pp. 903–907. [Google Scholar]
  45. Chandola, V.; Banerjee, A.; Kumar, V. Anomaly detection: A survey. ACM Comput. Surv. (CSUR) 2009, 41, 1–58. [Google Scholar] [CrossRef]
  46. Pang, G.; Shen, C.; van den Hengel, A. Deep anomaly detection with deviation networks. In Proceedings of the 25th ACM SIGKDD International Conference on Knowledge Discovery & Data Mining, Anchorage, AK, USA, 4–8 August 2019; pp. 353–362. [Google Scholar]
  47. Smith, L.I. A Tutorial on Principal Components Analysis; University of Otago: Otago, New Zealand, 2002. [Google Scholar]
Figure 1. The flow diagram of the proposed framework for voltage event analytics.
Energies 15 01283 g001
Figure 2. The waveform (upper left), the modulus of the SPM as a function of time (lower left), and the corresponding SPM (right) of a typical voltage dip. The dashed lines and circles show the dip/swell detection border (thresholds).
Energies 15 01283 g002
Figure 3. (Left): The Waveforms of measured voltage dips at MV level (10 kV); (right): the corresponding SPM. The during-event segments extracted by GAD are shown in red.
Energies 15 01283 g003
Table 1. Relation between rotating angle ( φ ) and Unbalance Type (UT) characteristic.
Range   of   φ UTMain UnbalanceSignificant Drop or Swell in:
( 0 ,   30 ] I b between phase “ b ” and neutral Phase “b
( 30 ,   60 ] I I c between phase “a” and “bPhases “a” and “b
( 60 ,   90 ] I a between phase “ a ” and neutralPhase “a
( 90 ,   120 ] I I b between phase “a” and “cPhases “a” and “c
( 120 ,   150 ] I c between phase “ c ” and neutralPhases “c
( 150 ,   180 ] I I a between phase “b” and “cPhases “b” and “c
Table 2. Voltage Dip/Swell Classification Using Single-Event Characteristics.
UT z 0 A x ClassFault Type and Location
I0 1DTwo-phase above/below Dy transformer
Phase-to-ground above/below Yy transformer
I0 < 1 FTwo-phase-to-ground above/below Dy transformer
II0 1CPhase-to-ground above/below Dy transformer
Two-phase above/below Yy transformer
Two-phase at monitoring level
II0 < 1 GTwo-phase-to-ground above/below Yy transformer
I 0 1BPhase-to-ground at monitoring level
II 0 < 1 ETwo-phase-to-ground at monitoring level
I 0 A x A y 1 HPhase-to-ground at monitoring level in a high-impedance-earthed system
I/II 0 < 1 I Two-phase-to-ground at monitoring level in a high-impedance-earthed system
I/II0 A x A y < 1 AThree-phase fault at any level
Table 3. Numerical Results of Proposed Framework for 10 Measured Voltage Dips.
Ev. A x   ( p u ) A y   ( p u ) φ ° UT l   ( m s ) ClassOrigin Fault
Ev. 11.010.4450.2 I I c 215CTwo-phase-to-ground
Ev. 20.770.1181.5 I a 176FTwo-phase-to-ground
Ev. 30.660.5658.3 I I I 235AThree-phase fault
Ev. 40.950.7372.6 I a 254BSingle-phase-to-ground
Ev. 51.00.6479.4 I a 98BSingle-phase-to-ground
Ev. 61.010.93- I I I 293ATransformer energizing
Ev. 70.960.89- I I I 391AThree-phase fault
Ev. 80.990.7980.5 I a 20BSingle-phase-to-ground
Ev. 90.590.38159 I I a 270CTwo-phase or single-phase-to-ground
Ev. 101.030.3815.1 I b 235BSingle-phase-to-ground
Table 4. Synthetic Dips Due to Single- or Two-Phase Faults [15].
Fault TypeEvent V a V b V c PAJ
Single-Phase FaultEvent 10.5−0.5 − i0.87−0.5 + i0.870
Event 20.47 − i0.17−0.5 − i0.87−0.5 + i0.87−20
Event 30.43 − i0.25−0.5 − i0.87−0.5 + i0.87−30
Event 40.38 − i0.32−0.5 − i0.87−0.5 + i0.87−40
Phase-to-Phase FaultEvent 51−0.5 − i0.43−0.5 + i0.430
Event 61−0.65 − i0.41−0.35 + i0.410
Event 71−0.72 − i0.38−0.28 + i0.380
Event 81−0.78 − i0.33−0.22 + i0.330
Phase-to-Phase Fault
with Impact of Load
Event 90.85−0.43 − i0.37−0.43 + i0.370
Event 100.85−0.55 − i0.35−0.3 + i0.35−20
Event 110.85−0.61 − i0.32−0.24 + i0.32−30
Event 120.85−0.66 − i0.28−0.19 + i0.28−40
Table 5. Three Methods during Synthetic Dips.
SCASPAProposed Framework
Ev.CVPNFDTCVPNFDT A y A x φ ° DT
One-Phase Fault10.671 I a 0.671 I a 0.67190 I a
20.661 I a 0.661 I a 0.661.0686 I a
30.641 I a 0.641 I a 0.621.0184 I a
40.631 I a 0.61.04 I I c 0.61.0283 I a
Phase-to-Phase Fault50.501 I I a 0.501 I I a 0.501180 I I a
60.501 I I a 0.501 I I a 0.501170 I I a
70.491 I I a 0.471.01 I c 0.491.01165 I I a
80.491 I I a 0.401.04 I c 0.491.02160 I I a
Phase-to-Phase Fault
with Impact of Load
90.430.85 I I a 0.430.85 I I a 0.430.85179 I I a
100.430.85 I I a 0.450.85 I I a 0.40.87169 I I a
110.400.86 I c 0.400.86 I c 0.350.88165 I I a
120.340.89 I c 0.340.89 I c 0.310.90161 I I a
Publisher’s Note: MDPI stays neutral with regard to jurisdictional claims in published maps and institutional affiliations.

