Article

Power Supply of Wireless Sensors Based on Energy Conversion of Separated Gas Flows by Thermoelectrochemical Cells

1
Department of Chemistry and Technology of Materials, Yuri Gagarin State Technical University of Saratov, 410054 Saratov, Russia
2
Department of Functional Nanosystems and High-Temperature Materials, National University of Science and Technology «MISiS», 119049 Moscow, Russia
3
Engeneering Center, Plekhanov Russian University of Economics, 115093 Moscow, Russia
4
Institute of Biochemical Physics Named after N.M. Emanuel of the Russian Academy of Sciences, 119334 Moscow, Russia
5
Department of Power Supply for Industrial Enterprises, Samara State Technical University, Syzran Branch, 446001 Syzran, Russia
6
Department of Power and Electrical Engineering, Yuri Gagarin State Technical University of Saratov, 410054 Saratov, Russia
*
Authors to whom correspondence should be addressed.
Energies 2022, 15(4), 1256; https://doi.org/10.3390/en15041256
Submission received: 29 December 2021 / Revised: 5 February 2022 / Accepted: 8 February 2022 / Published: 9 February 2022

Abstract

:
This article deals with the creation of a power supply system of wireless sensors which take measurements and transmit data at time intervals, the duration of which is considerably less than the activation period of sensors. The specific feature of the power supply system is the combined use of devices based on various physical phenomena. Electrical energy is generated by thermoelectrochemical cells. The temperature gradient on the sides of these cells is created by a vortex tube. A special boost DC/DC converter provides an increase in the output voltage of thermoelectrochemical cells up to the voltage that is necessary to power electronic devices. A supercapacitor is used to store energy in the time intervals between sensor activation. A study of an experimental sample of the power supply system for wireless sensors was conducted. Using the model in MATLAB + Simulink program, the possibility and conditions for creating the considered system for a particular type of wireless sensor were shown.

Graphical Abstract

1. Introduction

The rapid depletion of mineral resources has spurred the development of alternative energy sources. Solar panels, wind turbines, and geothermal power plants are gradually replacing traditional energy sources [1]. However, in addition to resource saving, such energy sources have another important characteristic—compactness. Often, in order to supply power to a small facility, it is necessary to install power lines. This is especially true when the power consumption of an object is tens of watts or less.
Alternative energy sources are quite easily scalable, which makes them indispensable in areas where it is not advisable to build a power transmission line, and, moreover, to build a fully fledged power plant [2]. Some kinds of alternative energy sources are already known for most areas. For example, for places with high solar activity, solar panels are well suited. For coastal, mountainous, or other locations with strong winds, wind turbines are indispensable.
Nevertheless, the gas industry still needs compact energy sources—gas pipelines cover thousands of kilometers and require the monitoring of various parameters, such as temperature and pressure, over their entire length [3,4,5]. At present, the power supply of such sensors is carried out by accumulators, the replacement interval of which is about 1 year. However, under conditions of low temperatures, the battery life is significantly reduced [6]. Thus, the constant need to monitor and replace accumulators in hard–to–reach locations causes companies to incur additional losses. The development of a wireless sensor node (WSN) network requires innovative technical solutions in the field of autonomous power sources [7]. Recently, a trend in the construction of WSN power supply systems based on the collection and accumulation of environmental energy has been intensively developed. For WSN power supply, devices using solar energy, wind energy, waste heat energy, and the energy of electromagnetic waves and vibration have been developed [8,9,10]. As environmental energy has an unstable nature, hybrid power supply systems that harvest the energy of different physical natures can be applied to increase the reliability of WSN operation [11,12].
Thermoelectrochemical cells, capable of converting the temperature gradient into electrical energy, are a promising and widely studied system [13]. With their ability to harvest low-temperature-gradient energy, the main disadvantage is the need for heat removal from the cold side. There is no temperature gradient in gas flows, but it can be created artificially using the Ranque–Hilsch effect [14].
This paper proposes and analyzes the WSN power supply system, which can be applied to gas transportation by pipelines. The source of electric energy in this system is a thermoelectrochemical cell. A temperature gradient on the module’s sides is created by the separation of gas flows using a vortex tube. Using the converted energy of the gas stream into electrical energy is one way to increase the stability of the energy system.

2. Components Review

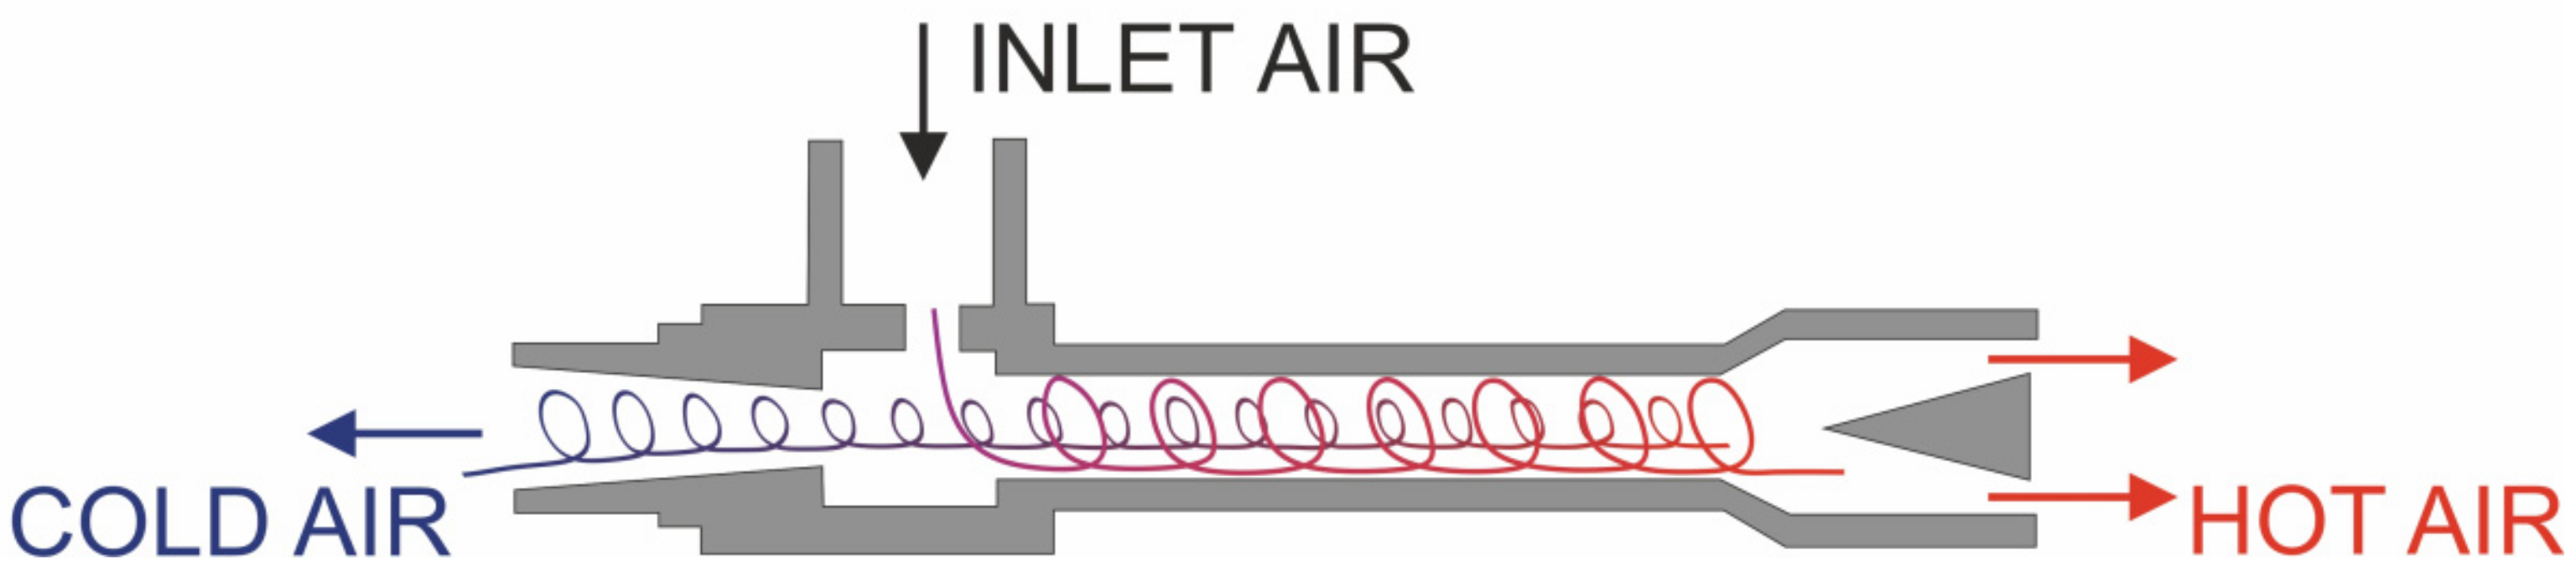
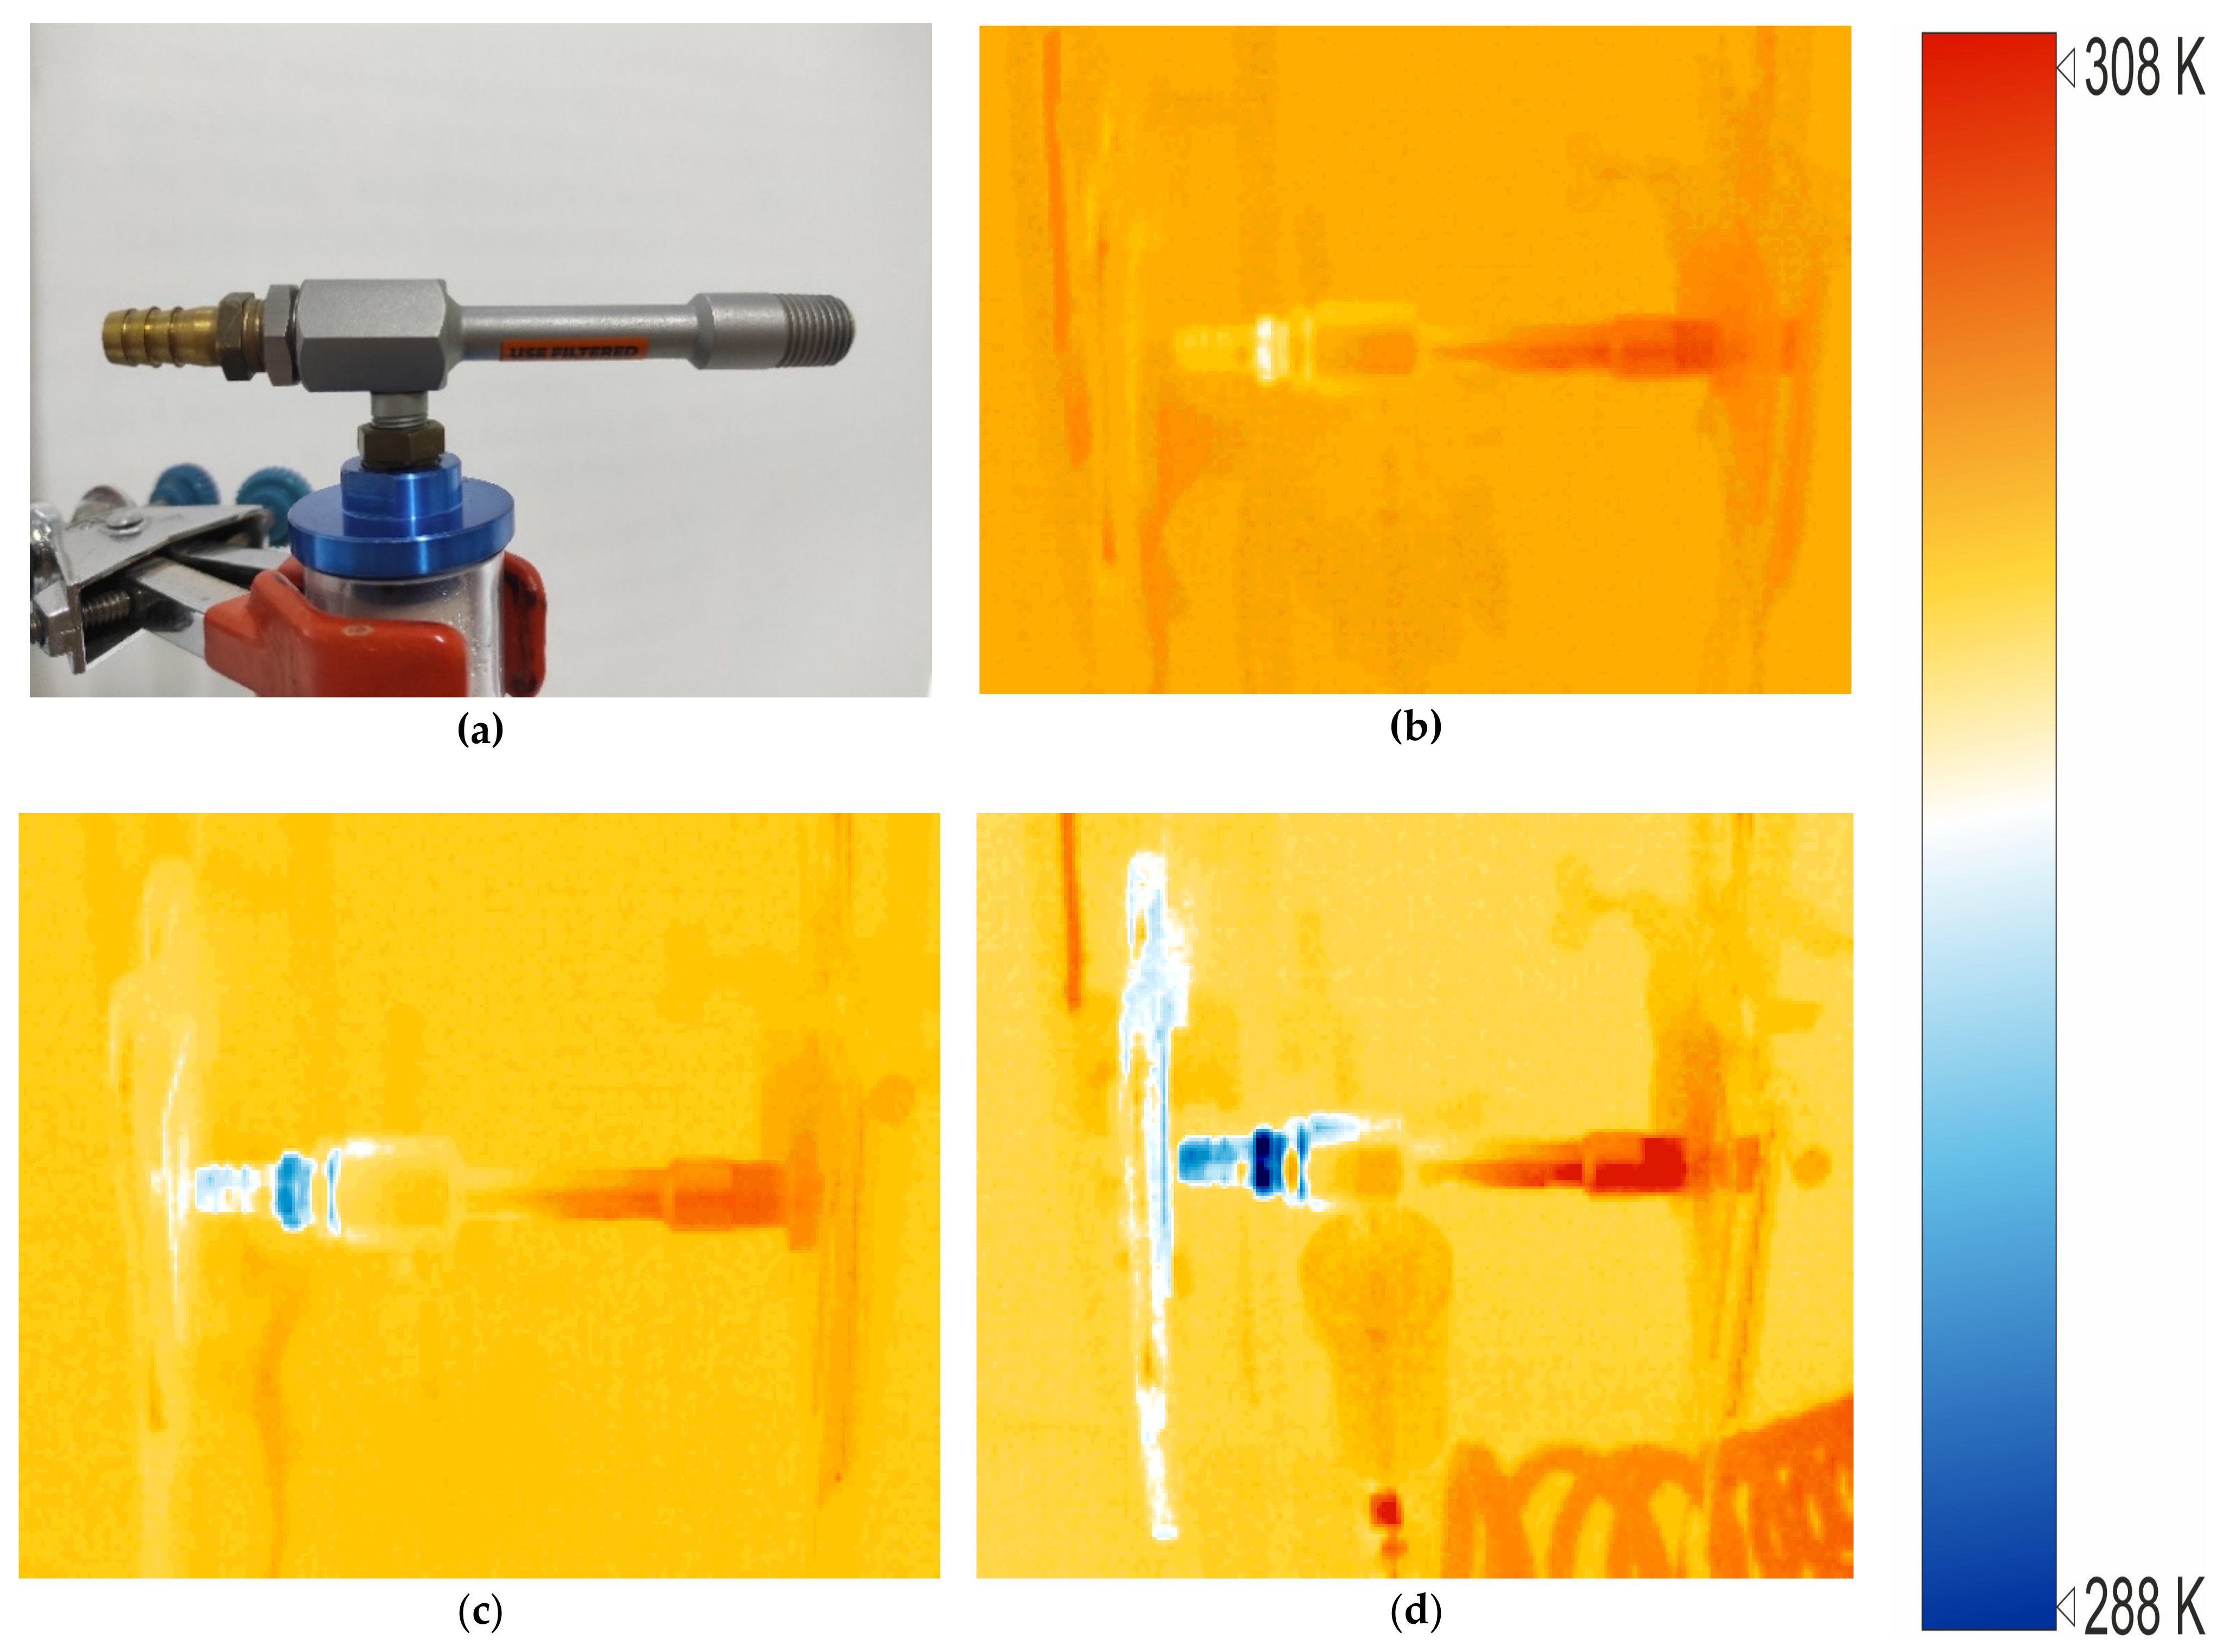
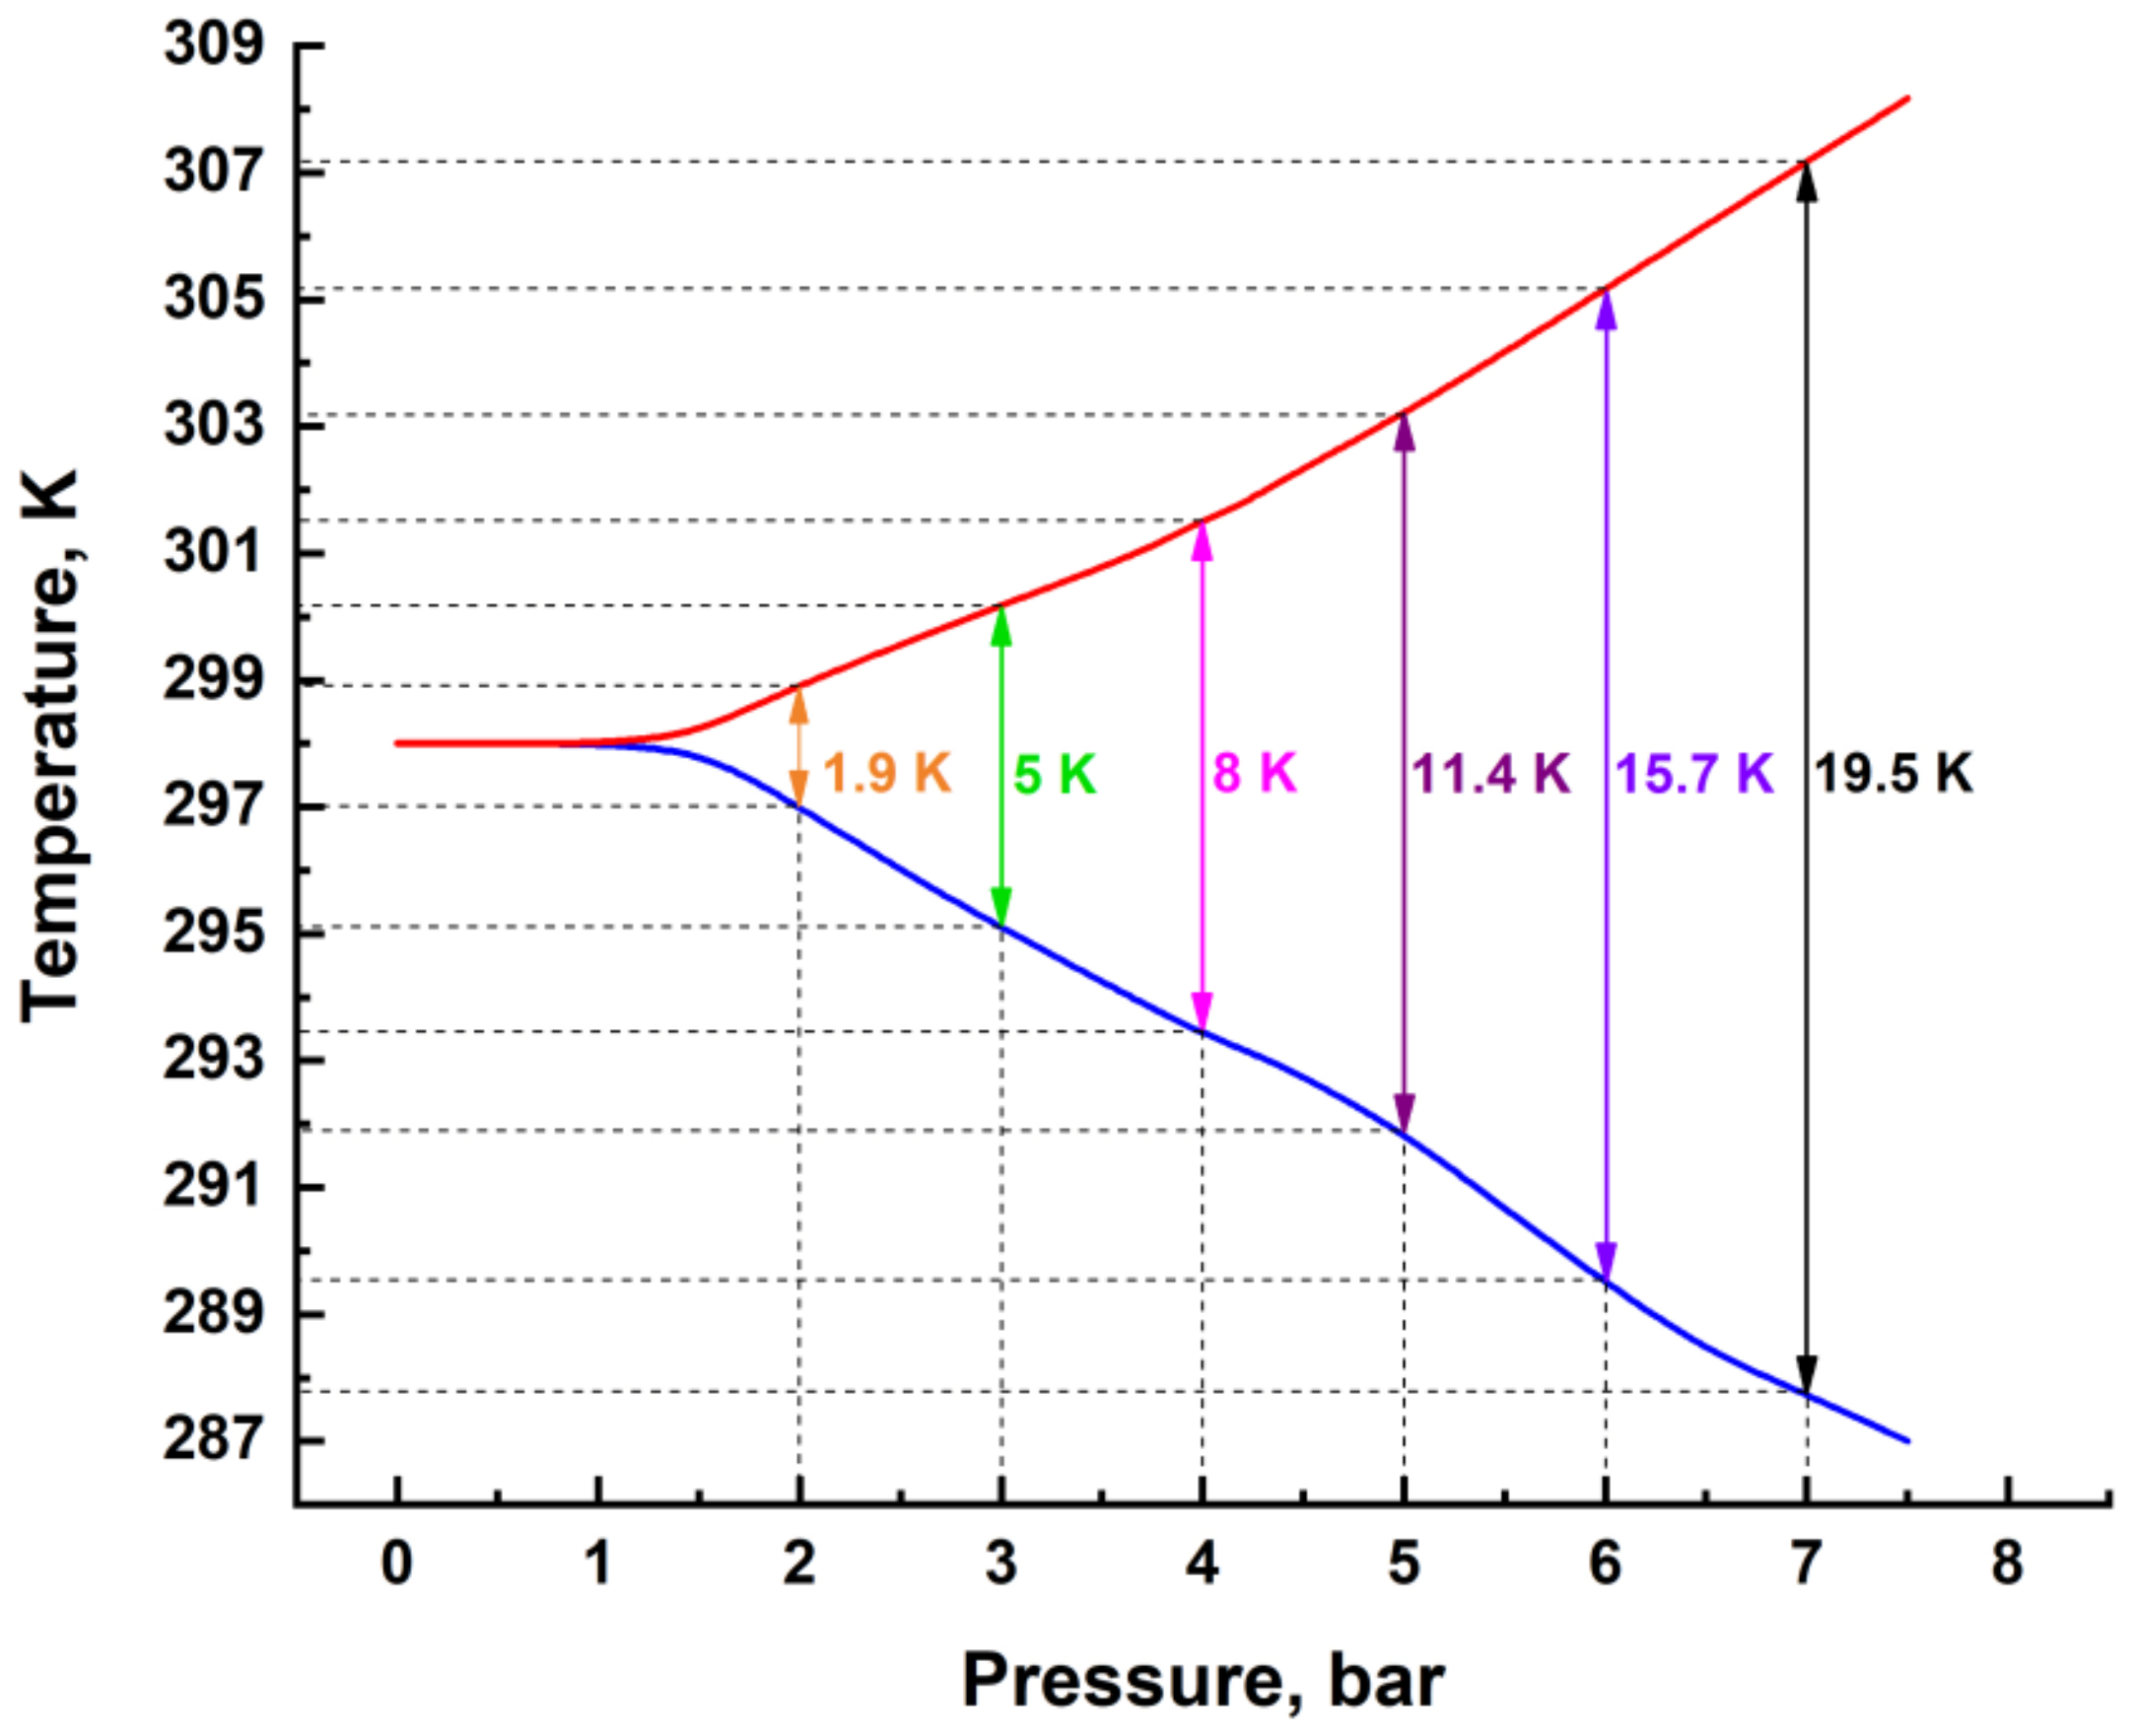
2.1. Ranque–Hilsch Vortex Tube

A Ranque–Hilsch vortex tube is a device in which two gas flows with different temperatures can be generated using compressed gas (Figure 1). Vortex tubes vary widely in geometry, particularly in their diameter/length ratio [14,15].
The efficiency of the tube depends on its geometrical dimensions, the setting of the constriction angle, and is directly proportional to the gas pressure at the inlet [13]. However, there is an inflection point at which the outlet nozzle clogging and efficiency decrease. Nevertheless, at the maximum inlet flow pressure, a small-size vortex tube is able to create a temperature gradient of 50 K [16].
The flow velocity and temperature in the vortex tube are interdependent. When the control valve on the hot end is opened, the cold air flow decreases and the temperature drops. The percentage of the total amount of incoming air that comes out of the cold end is called the “cold fraction”.
Figure 2 shows the results of a NexFlow 50002H small vortex tube at inlet pressures of 1, 2, and 3 bar and an ambient air temperature of 297 K. The cold fraction is 50%. Copper plates of thickness 0.5 mm with thermal pads glued on were used as temperature indicators for the most efficient temperature harvesting. A Testo 875-1i thermal imager was used to record the temperature.
When comparing the temperatures in Figure 2b–d, it can be seen that, as the pressure increases, the temperature of the cooled plate decreases, and the temperature of the heated plate increases.
It follows that the temperature difference can be represented as a function of the inlet gas pressure
Δ T = f P , k
where k is the coefficient of the cold fraction.

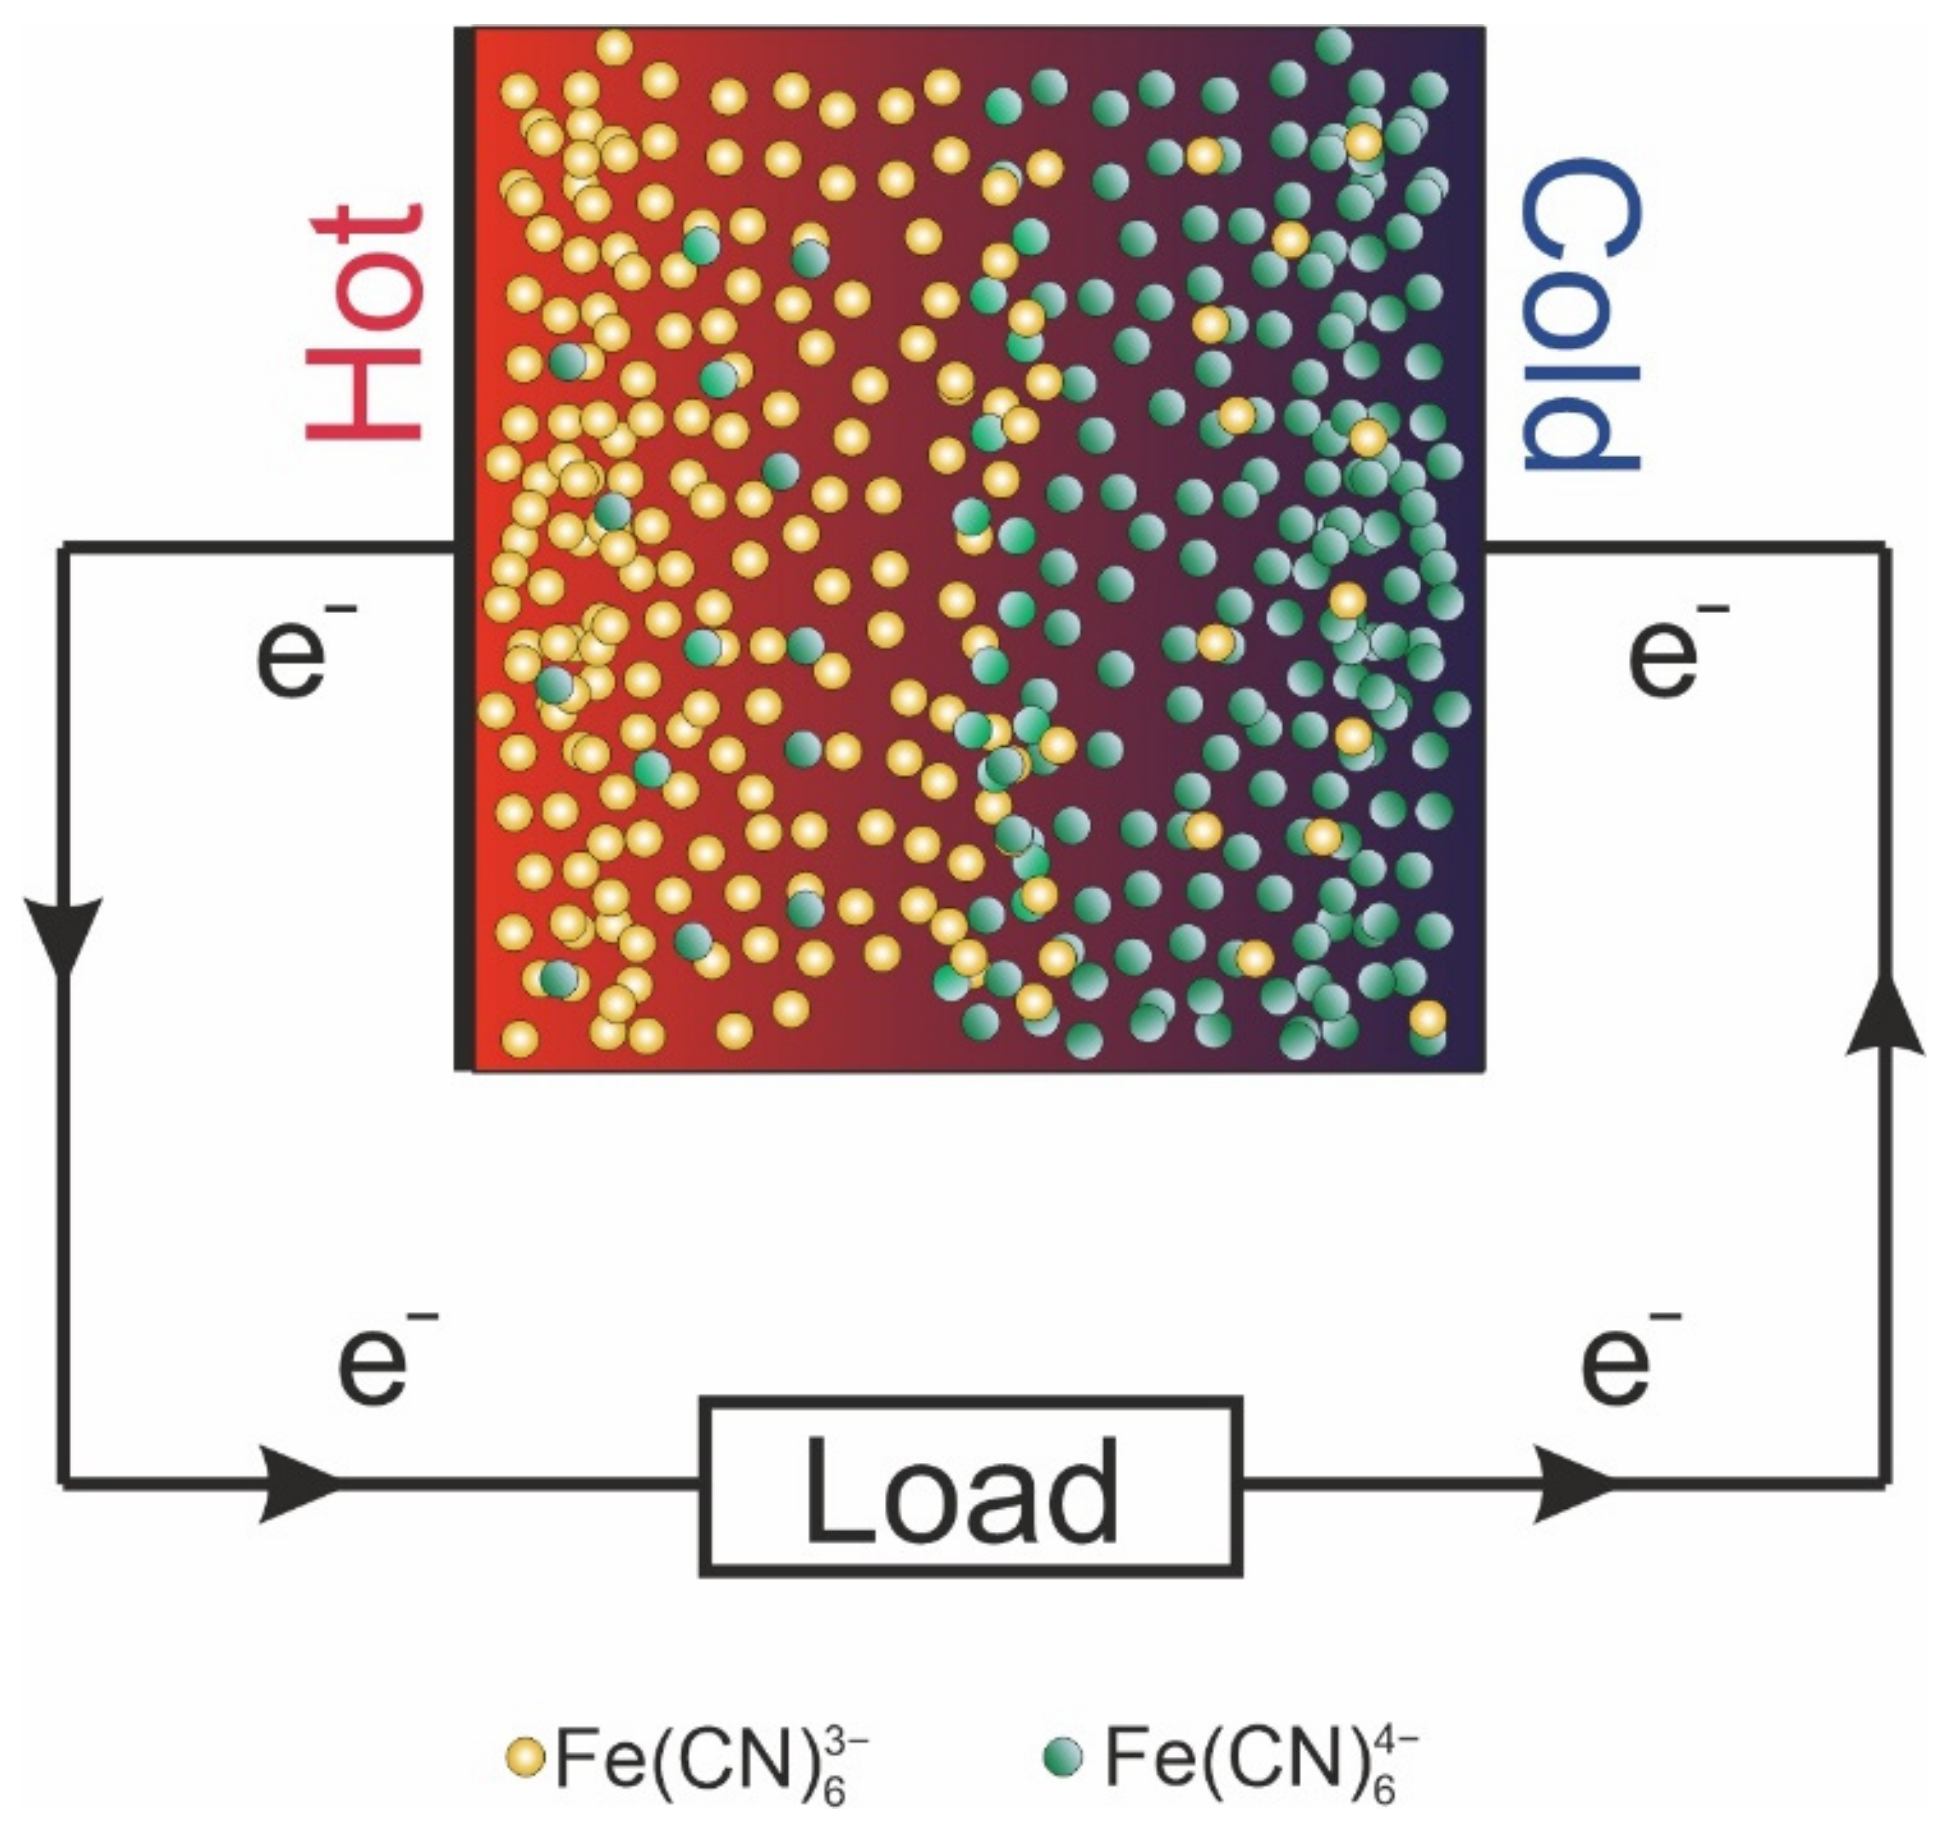
2.2. Temperature Gradient Conversion

Thermoelectric converters have been developing rapidly in recent decades. The most widespread are thermoelectric converters based on the Seebeck effect, where temperature differences are converted into electricity.
Thermoelectric converters are categorized as semiconductor and electrochemical. Solid-state thermocouples operate according to the Seebeck effect, i.e., the direct conversion of temperature into voltage [17]. They consist of two doped semiconductor materials, one n-type containing free electrons and the other p-type containing free holes. When a temperature gradient is created between them, mobile charge carriers tend to diffuse toward the cold end, and the accumulation of charge at one end creates an electrostatic potential. The main characteristic of a thermocouple is the quality factor ZT:
Z T = σ S 2 T λ
where σ is the electrical conductivity, S is the Seebeck coefficient, T is the temperature, and λ is the thermal conductivity. Solid-state thermoelectric generators (TEGs) have long been studied and improved by the scientific community [18,19]
The main advantages of TEGs are
  • No moving parts or working fluids inside the TEG;
  • Long service life, especially with permanent heat sources;
  • No economies of scale: TEG can be used for micro-generation in a very limited space or for generating huge amounts of energy;
  • Silent operation;
  • Any operating position is possible, which makes TEGs suitable for embedded systems [20].
However, the operating temperature range of solid-state thermoelectric converters makes its own adjustments—effective conversion begins with a temperature difference of 100 K [21]. On the other hand, a less studied and actively developing area is thermoelectrochemical power [22].
Thermoelectrochemical cells (thermocells, TEC), like TEGs, operate on the Seebeck effect. However, unlike solid-state thermogenerators, thermocells have ions present in a liquid state as charge carriers inside thermocells. When a temperature difference is applied to the electrodes, reduction and oxidation occur at the respective electrodes. The electron lost through oxidation passes through the external circuit. ZT can be used to describe the characteristics of thermocouples with typical values two orders of magnitude lower than those of TEGs. In terms of properties, thermocells have a much higher S, but suffer from very low electrical conductivity. Unlike solid-state thermoelectric generators, thermoelectrochemical cells are capable of generating energy at small temperature gradients (ΔT < 100 K) [23,24]. At the same time, the use of a liquid electrolyte imposes a significant limitation on the operating temperature range—from 273 to 373 K.
Nevertheless, compared to thermoelectric generators, in terms of commercialization, thermocells are very economical because the materials used to manufacture them are readily available.
According to literature sources [25,26], the Seebeck coefficient of TEC reaches 7 mV/K. But, although these values are listed as “Seebeck coefficients”, the temperature-dependent potential difference measured in these systems arises because of a different mechanism to that which occurs in classical redox electrolytes.
However, in the case of classical thermoelectrochemical systems, the reaction cannot proceed indefinitely. A system based on [Fe(CN)6]3−/[Fe(CN)6]4− was described in [22,27,28]. In this system, a semi-infinite reaction takes place (Figure 3), which allows a significant increase in the lifetime of the TEC.
Although the Seebeck coefficient of this system is only 1.4 mV/K, due to a significant increase in the lifetime, it is the most promising in terms of long-term use. Increasing the efficiency of such a system is possible by modifying the electrolyte [29] and improving the electrodes [30].
A typical I–V curve of TEC is shown in Figure 4a. Based on it at ΔT = 20 K, the short-circuit current is about 0.11 mA/cm2 and open-circuit voltage is about 65 mV.
Analysis of the I–V curves shows that they are shifted almost in parallel when the temperature difference ΔT on the electrodes is changed. The open-circuit voltage UOC and, accordingly, the slope of the curves depends on the electrolyte concentration. This allows us to represent the cell as an equivalent two-terminal circuit (Figure 4b), in which the EMF of ETEC is equal to the open-circuit voltage VOC, and the internal resistance is determined by the formula
R I N = V O C I S C
where ISC is the short-circuit current.
The TEC output voltage is determined by the formula
V L O A D = E T E C · R L O A D R I N + R L O A D
where
E T E C = S · Δ T
Power transferred to the load:
P T E C = R L O A D · E T E C R I N + R L O A D 2
Maximum power value if RIN=RLOAD, in this case:
P T E C . m a x = E T E C 2 4 · R L O A D = V O C · I S C 4

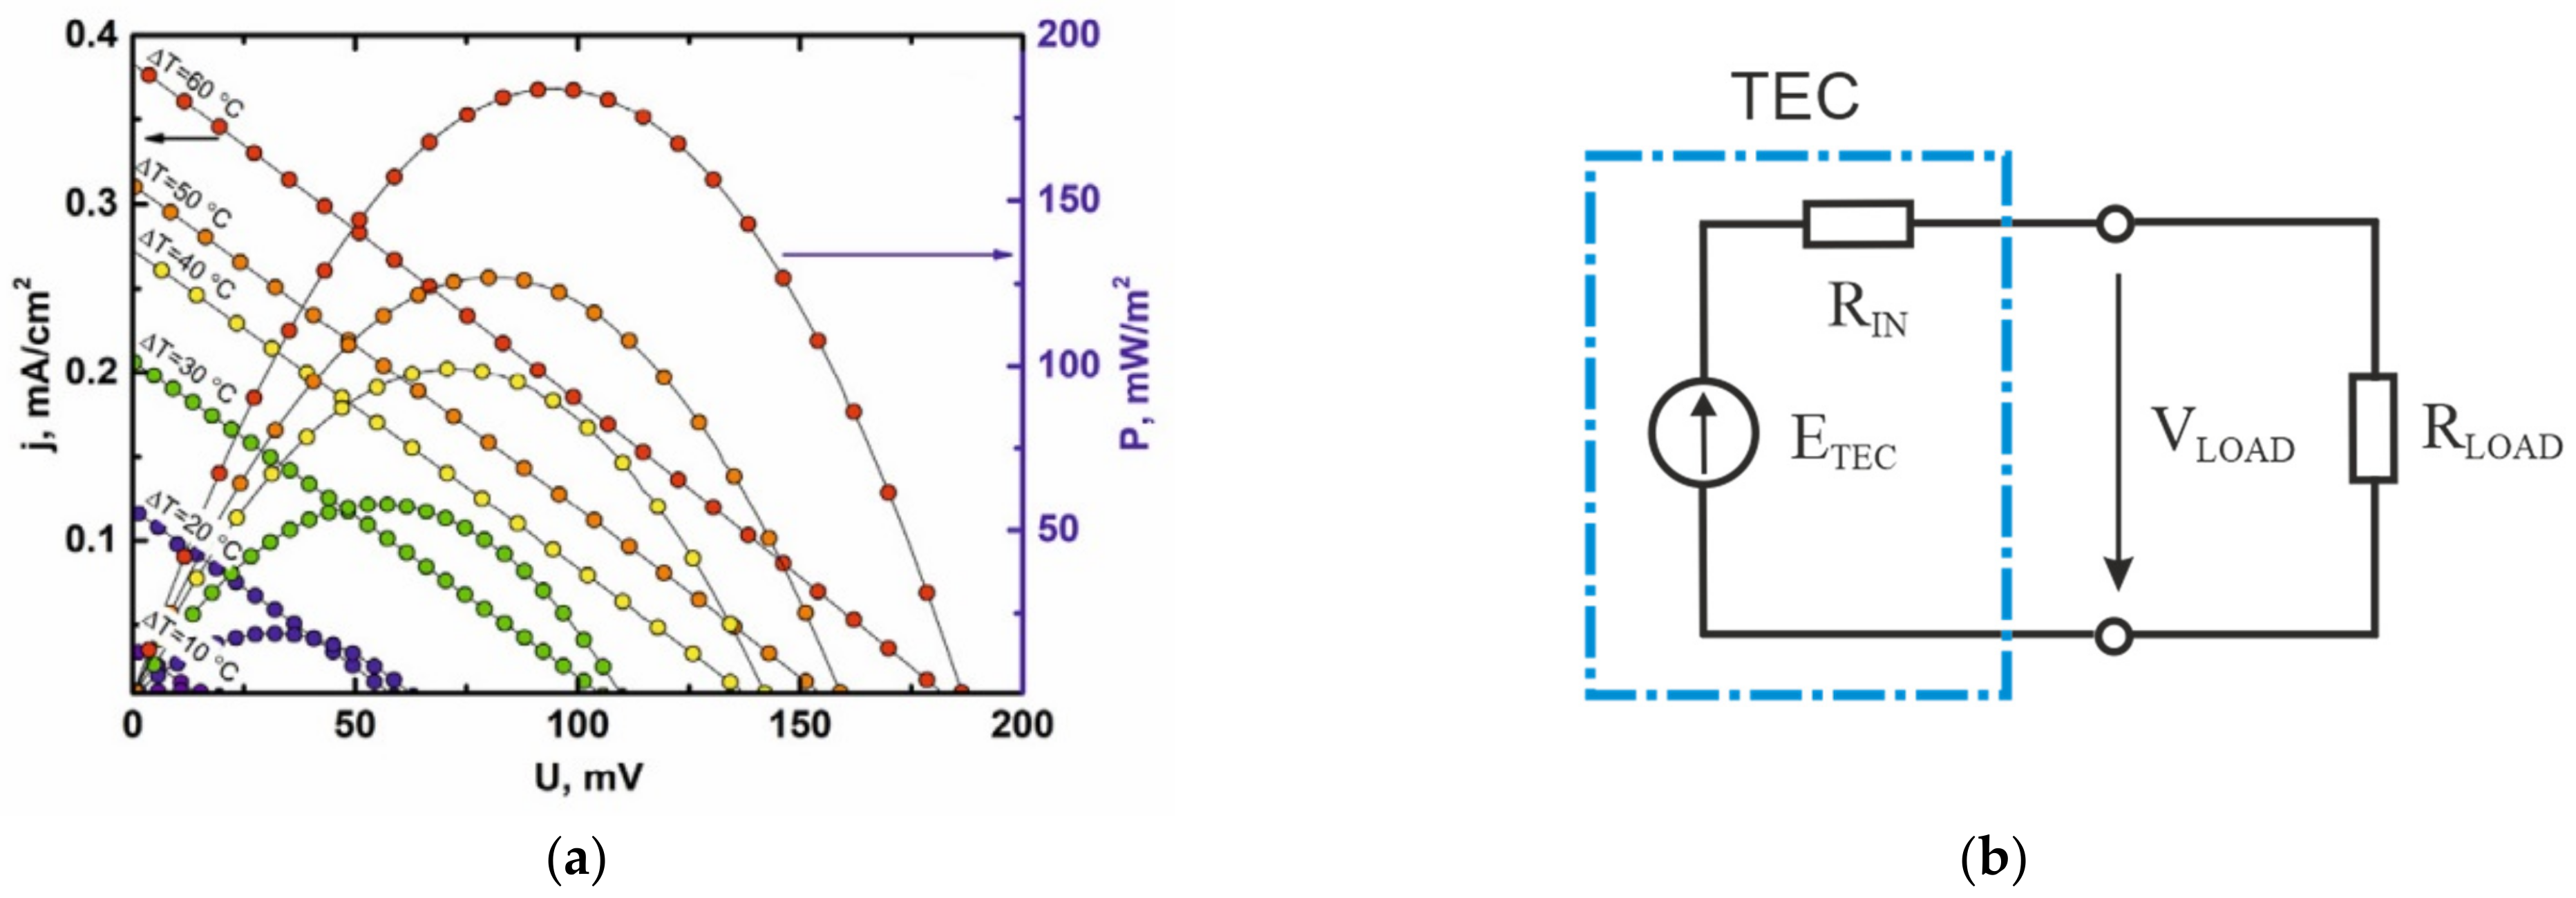
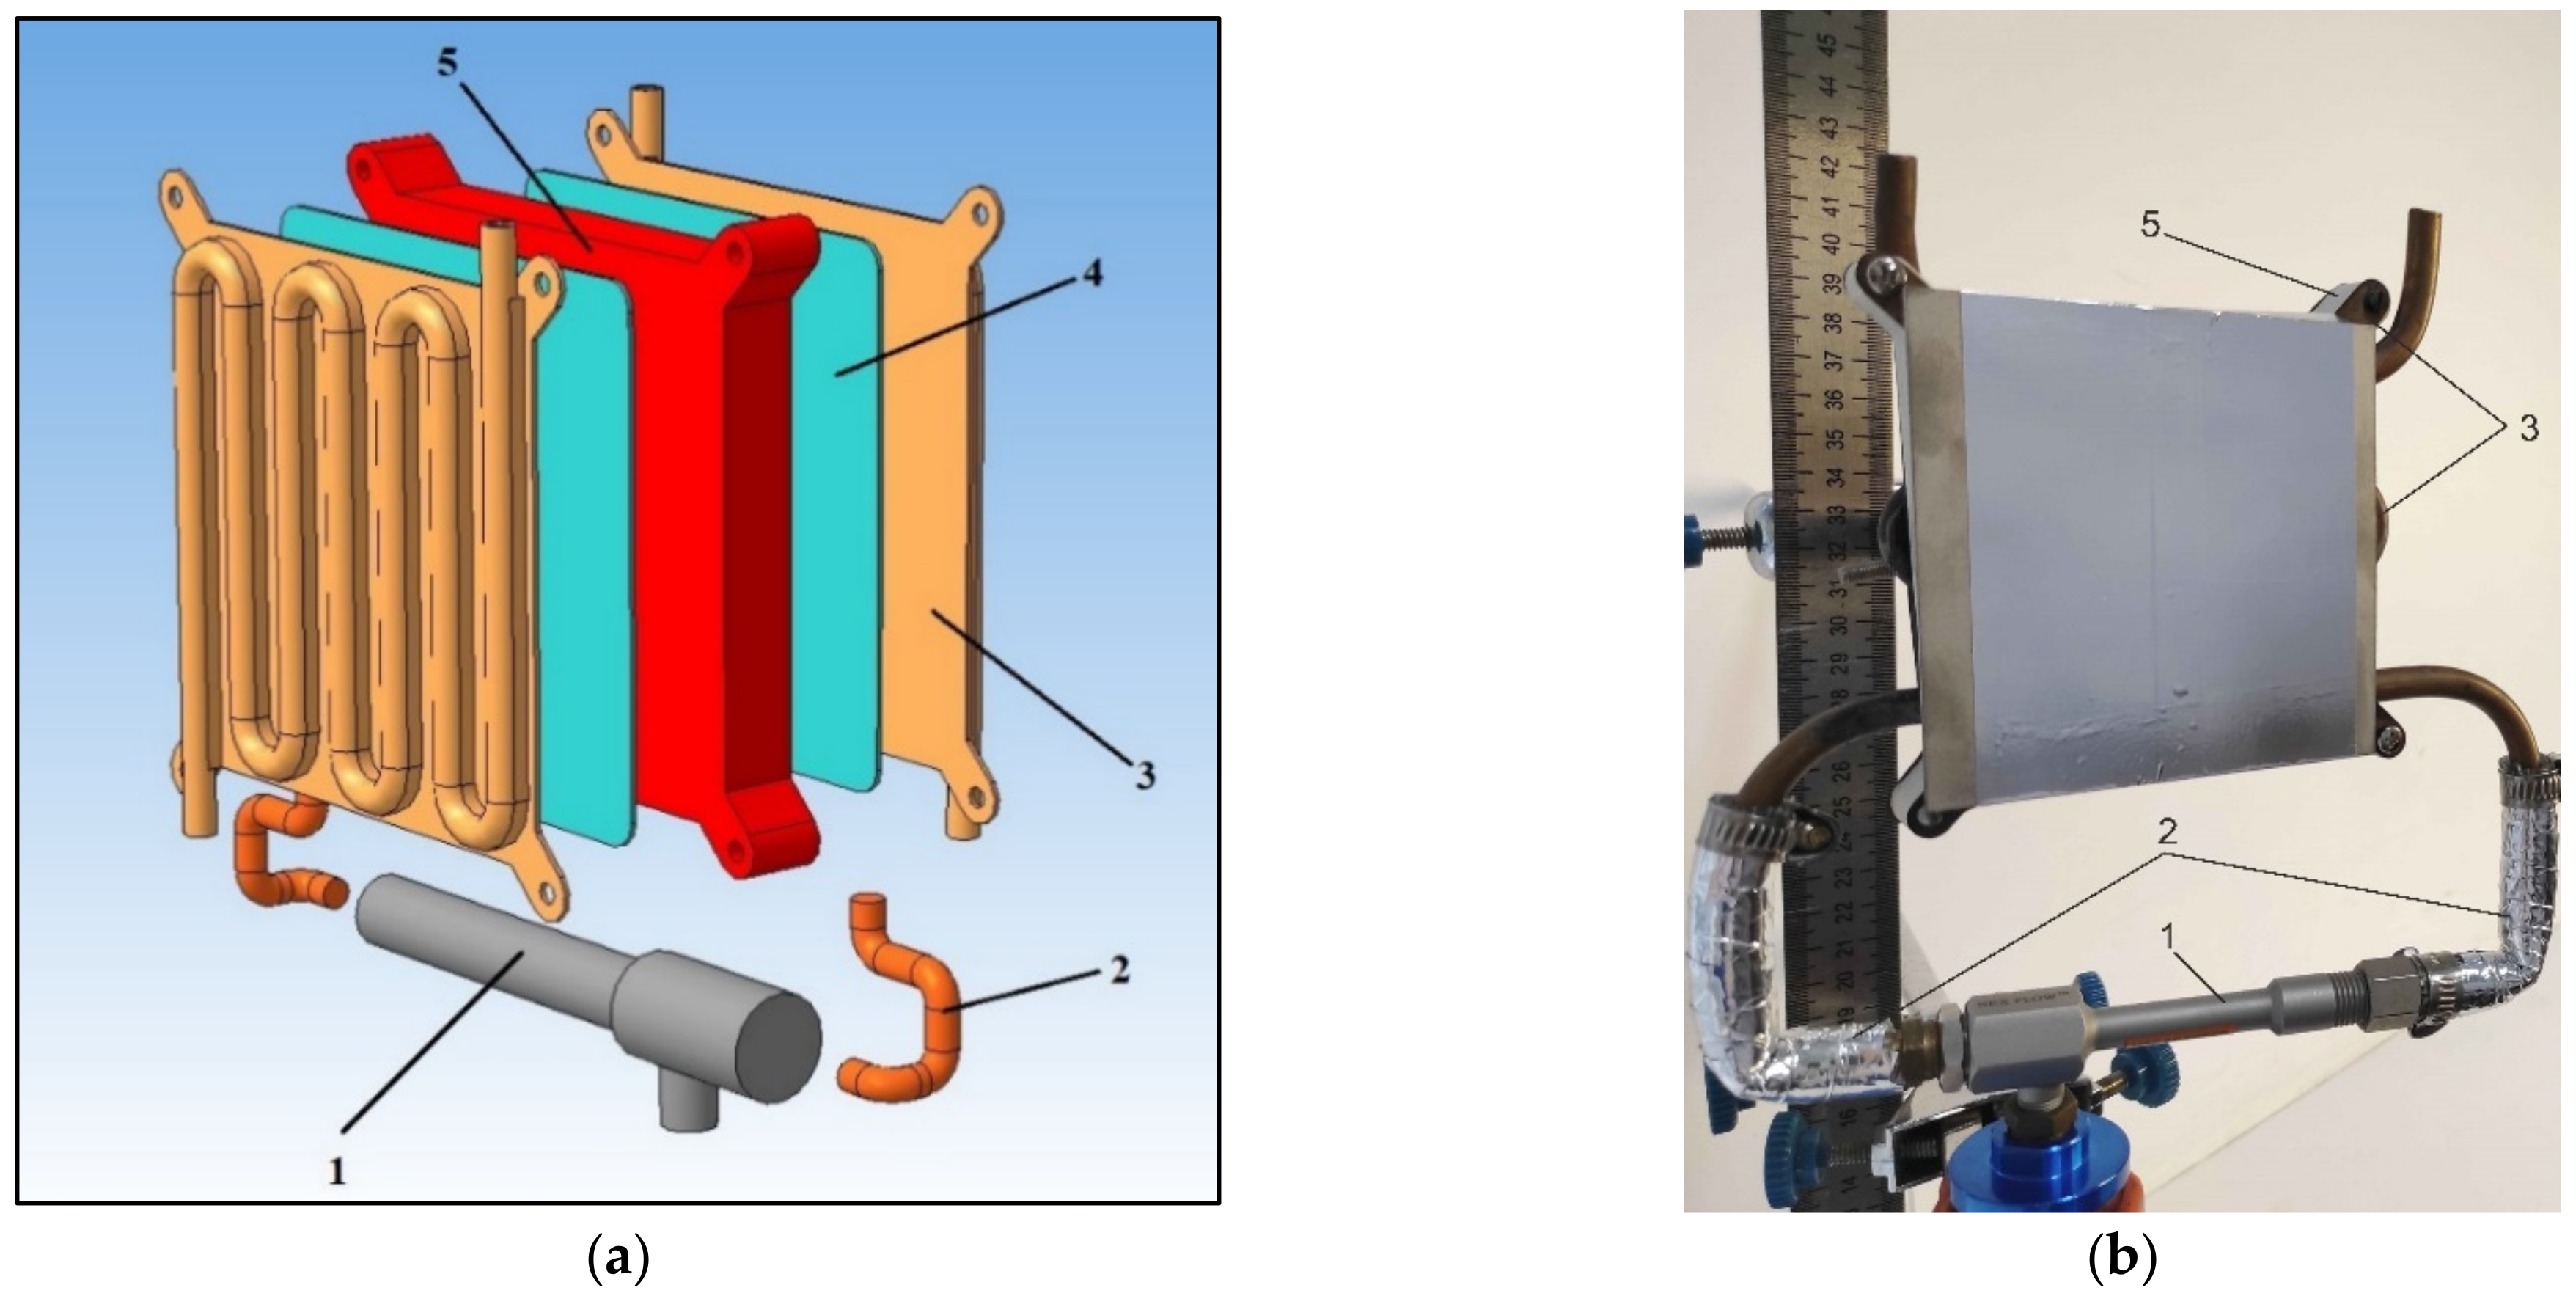
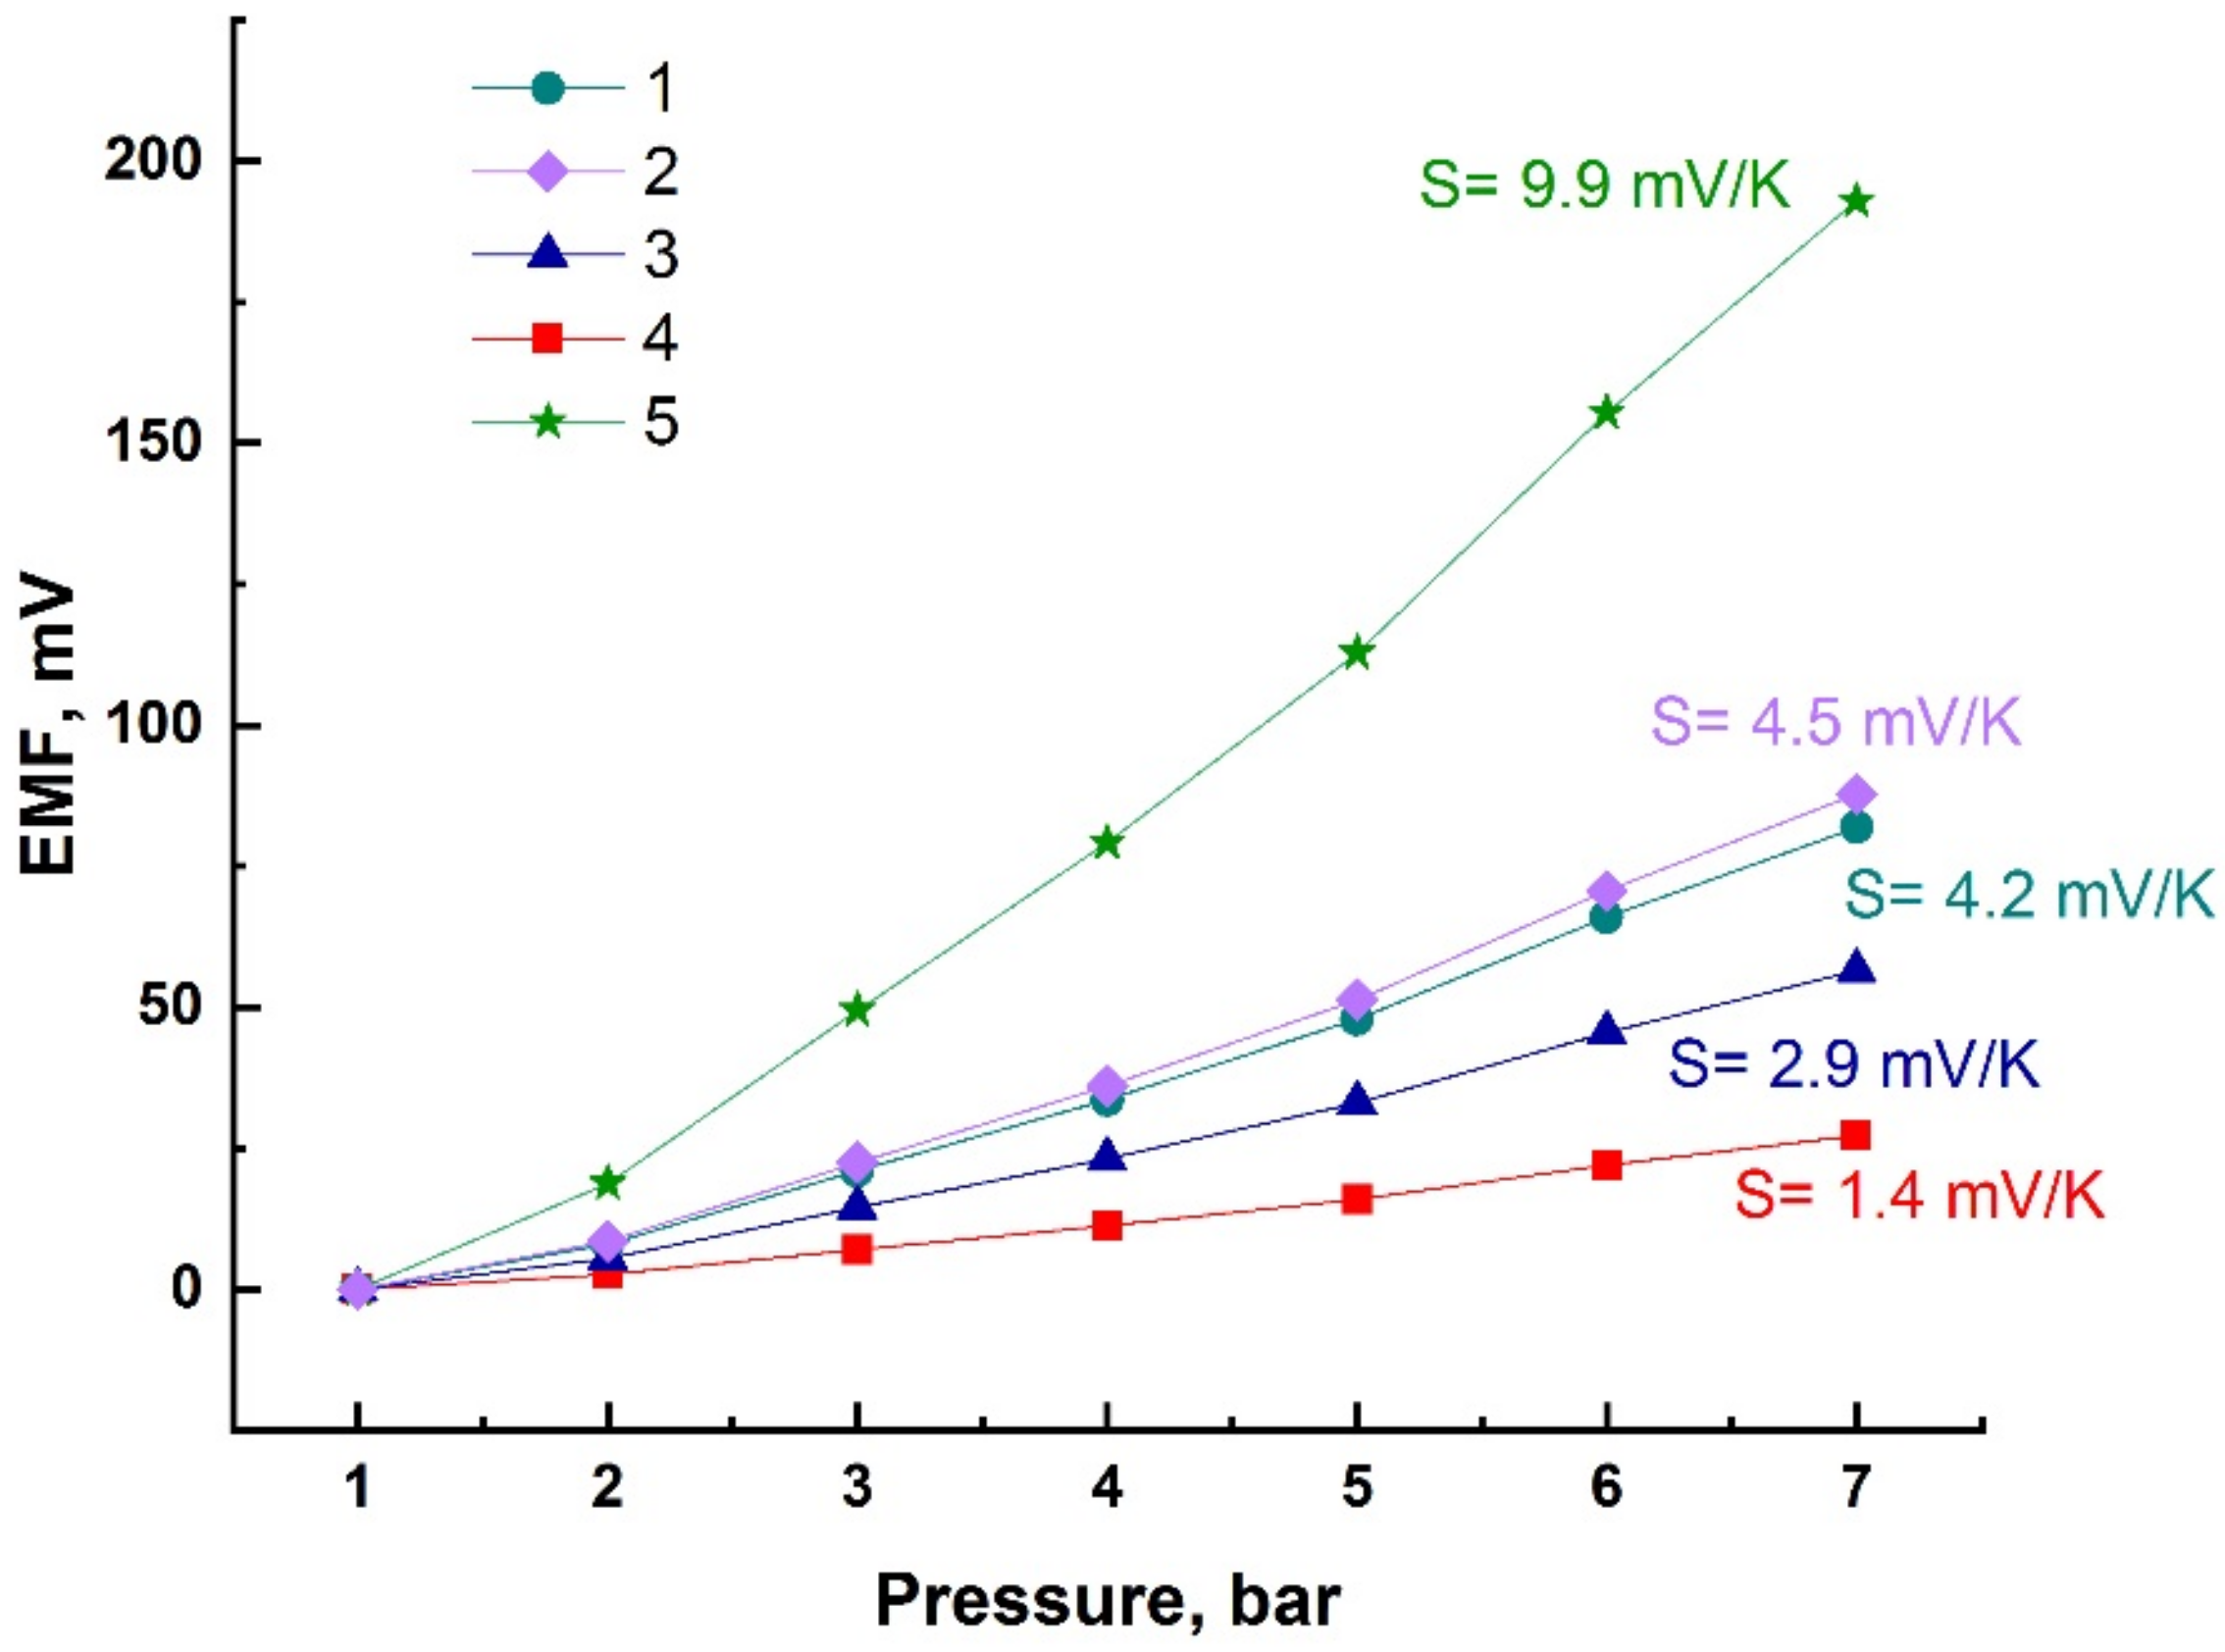
2.3. Design and Characteristics of Energy Converter

Based on the above, there are three independent systems—a gas pipeline through which gas flows under pressure up to 10 MPa (100 bar); a vortex tube of Ranque–Hilsch, which is able to separate the gas flow with the creation of a temperature gradient (Equation (1)); and a thermoelectric converter, which is able to convert the energy of the temperature gradient into electrical energy (Equations (4)–(6)).
The concept implies the use of a special device that provides the most efficient conversion of gas flow energy to the temperature difference. As a prototype, it is proposed to use curved pipes made of a material with high thermal conductivity tightly fitted to the body of the thermoelectric converter (Figure 5).
Thus, a vortex tube connected directly to the gas line will generate a constant temperature gradient. Hot and cold air streams from each of the tube outlets will be collected using the above-described fixture and transmitted to the thermoelectric converter. The temperature gradient will be converted into electrical energy, which can be used to power the sensors and send the collected information.
Depending on the final size of the vortex tube, both solid-state thermogenerators and thermoelectrochemical cells can be used.
The gas flows, having passed through the tubes, are returned back to the system without polluting the environment or causing additional losses.
Thus, the system eliminates the need for a power line along the entire pipeline, as well as the need for constant battery replacement. In fact, the system consumes the energy of the compressor station pumping gas through the pipeline. The simplicity of the system allows it to operate for a long time without any intervention.
To study the possibility of converting the energy of the gas flow into electricity, the NEX FLOW 50002H vortex tube was chosen as the object of the study, and the cold fraction was 50%. The compressed air flow was provided by an ELECTROLITE 470/100/10 compressor. An oil trap was installed to prevent the ingress of oil from the compressor into the vortex tube. In order to prevent the compressor heat from influencing the measurement results, the compressor was moved 10 m away from the system.
The main criteria for the choice of materials in the development of the gas flow energy harvesting system is high thermal conductivity. The optimal material for the radiator is copper, which has a high thermal conductivity coefficient of 400 W/(m·K).
As the air flow is largely dissipated when hitting an obstacle, the best way to collect heat/cold air energy is to use a copper tube.
To ensure maximum heat transfer between the tube and the heat sink, the tube was folded into a “coil” shape, so that the smaller area will provide maximum contact between the tube and the plate.
The geometric dimensions of the copper plates are 100 × 100 × 1 mm. The mass of each of the plates with a soldered copper tube is 0.2 kg.
The operation of the system consisting of a vortex tube and a copper heat harvester was studied in the pressure range of 1 to 7.5 bar at the vortex tube inlet. The system was brought to a steady state when the copper plates were fully and uniformly heated. The temperature was measured with a thermocouple connected to an APPA 207 multimeter. Then, the pressure was increased. The results are shown in Figure 6.
Figure 6 shows that, at pressures below 2 bar, the temperature difference is practically absent. This is explained by the operation mode of the vortex tube and the heat exchange with the ambient air.
With increasing air pressure above 2 bar, the temperature difference increases almost linearly.
The theoretical efficiency of the system was calculated assuming that the temperature of the compressed gas is equal to the ambient air temperature. Then, the power of compressed air converted into heat energy is
P a i r = 2.3 · P 1 · Q · l g p 2 p 1
where p1 is the atmospheric pressure, p2 is the final pressure, and Q is the air flow per s.
In our case, at an atmospheric pressure of 0.1 MPa, final pressure in the tube of 0.7 MPa, and air flow of 95·10−5 m3 s−1, the heat energy is 184.6 W.
When the tube is set to the symmetrical mode, the hot and cold streams have a power of about 30 W each. In this case, the efficiency of the vortex tube is about 32%.
The conversion efficiency to temperature difference is calculated from the heating rate of the copper heat exchanges.
η = m · Δ T · C P v t · τ
where m is the mass of heat exchanges, C is the specific heat capacity of copper, τ is the warm-up time, and Pvt is the flow power at one end of the vortex tube.
The temperature of the heat exchanges becomes stable in 5 min, and the conversion efficiency is 8.5%.
In summary, for this model, the efficiency of compressed air energy conversion to a temperature difference is about 2.7%.
Based on the results shown in Figure 6, Formula (5), and some data on Seebeck coefficients for TEC given in articles by other authors, a summary plot of the dependence of the thermoelectrochemical cell EMF on the pressure at the inlet of the vortex tube was plotted (Figure 7).
The efficiency of the conversion of gas flow energy into electrical energy was calculated according to the data given in the literature (Table 1).
Although the system efficiency is extremely low, Figure 7 and the hypothetical output power results show that, depending on the cell used, the system EMF can range from units to hundreds of millivolts (193 mV at S = 9.9 mV/K), and the system power is in units of milliwatts.

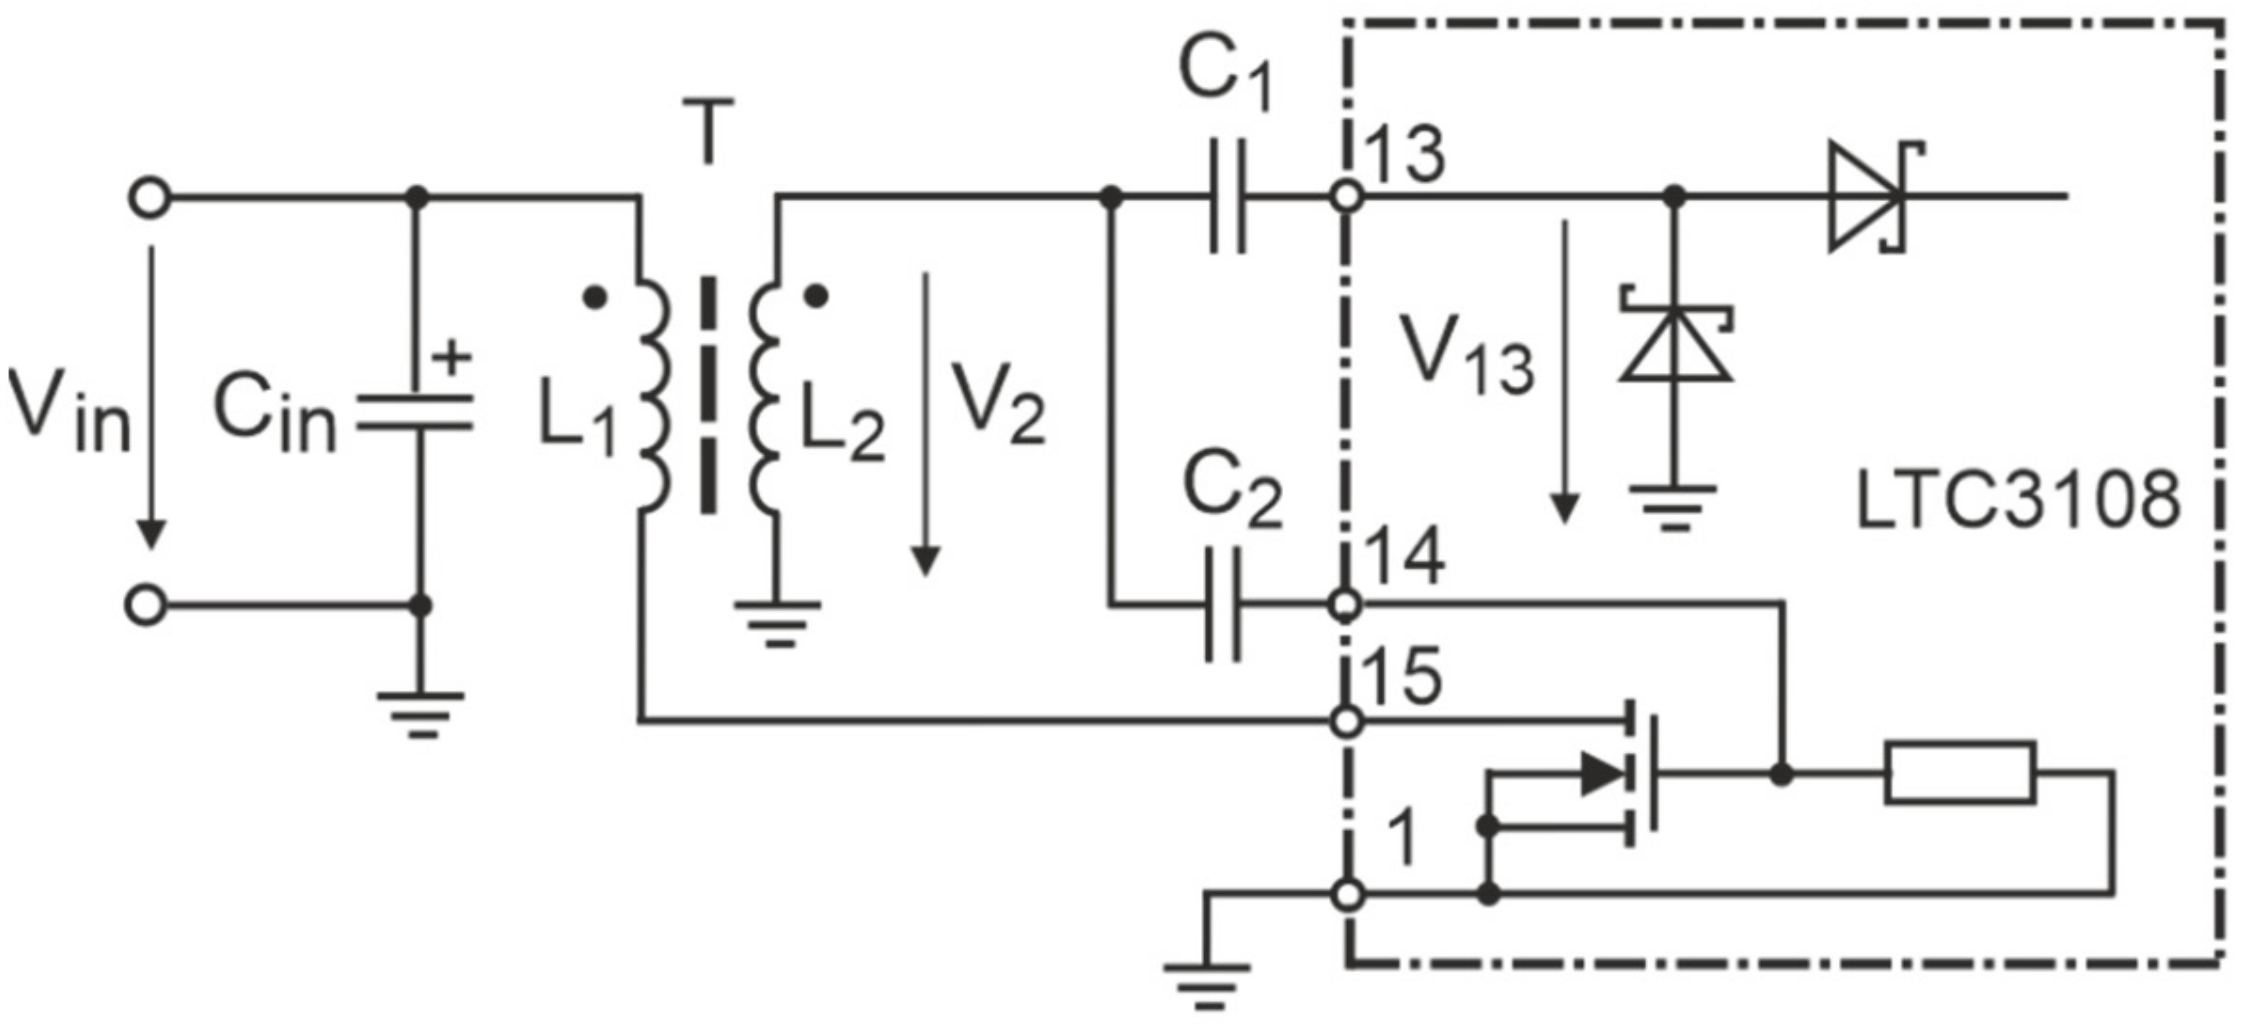
2.4. DC/DC Boost Converter

The output voltage of TEC in the no-load mode varies from 20 to 200 mV. When a load is connected, it decreases according to the resistance of the load circuit. Therefore, the problem arises of increasing the voltage to 3.3 to 5 V, which is necessary to supply electronic devices.
One solution to the problem is to connect the required number of cells in series [29]. For example, in the case where the power of one cell is enough to operate some sensors with low power consumption.
Another way is to use a voltage step-up DC/DC converter. Realization of this variant involves the choice of topology of the converter and element base for its construction. Additionally, because of ultra-low input voltages, the possibility of using key elements in the form of bipolar transistors is excluded, since the threshold voltage of a typical bipolar transistor is about 0.5~0.7 V. In addition, the significant collector–emitter voltage drop leads to a very low circuit efficiency.
In [35], they presented a DC converter that allows obtaining an output voltage of 1.2 V at an input voltage of 200 mV. In environmental energy harvesting and storage systems, a DC boost converter with an ultra-low initial voltage can be used [36]. When the converter is connected to a power source with a voltage of 40 mV or more, voltages are formed on the converter outputs, which are necessary to supply the WSN. A DC/DC boost converter with similar characteristics is described in [37].
An effective solution to the problem of rising voltages is proposed in [38].
A promising technical solution is provided in [39]. The proposed converter can start from a fully discharged state at an input voltage of ±13 mV and increase its output voltage to 5 V. The experimental results demonstrated efficiencies of up to 85% and near-perfect impedance matching over the entire input voltage range.
Linear Technology has developed and manufactured microcircuits that are designed to create autonomous power supply systems that function based on environmental energy harvesting using photoelectric, piezoelectric, electromagnetic, thermoelectric, and other converters. The LTC3108 chip [40] can be used in a TEC power supply system. This chip is a two-stage DC/DC step-up converter, which starts operating at an input voltage of 20 mV or higher. At the same time, the chip allows realizing the control functions of capacitor charging processes and the regulation of several voltages in the system, in which the average power consumption is very low, but there can be periodic load pulses with higher current consumption.
A simplified scheme of the first stage of the step-up DC/DC converter based on the LTC3108 chip is shown in Figure 8. The built-in MOSFET switch, the external miniature transformer T, and the isolation capacitor C2 form a resonant Armstrong oscillator. The frequency of oscillation is determined by the inductance L2 of the transformer secondary and the total capacitance of the circuit, which includes the capacitance of capacitor C2 and the parasitic capacitance of the circuit. Usually, the oscillation generation occurs in the range of 10–100 kHz. The alternating voltage received from the secondary winding is raised and rectified using a charge pump circuit.
The characteristics of the step-up DC/DC converter based on the LTC3108 chip depend largely on the parameters of the step-up transformer T. Changing the transformation ratio can ensure the operation of the converter in an optimal mode for different values of the output voltage of TEC.
In [41] the experimental study of a DC/DC converter based on the LTC3108 chip (Figure 8) using an LPR6235-752SMR transformer is given [42]. Such a transformer has a transformation ratio of 1:100. The primary and secondary windings inductances of this transformer are 7.5 µH and 75 mH, respectively, and the magnetic coupling ratio is 0.95. The following capacitor parameters were taken for the experiment: Cin = 220 µF, C1 = 1 nF, C2 = 330 pF.
The study was carried out for several values of the input voltage Vin. Figure 9 shows oscillograms of voltages V2 at the secondary winding of transformer T and V13 at the input of the rectifier in the LTC3108 chip (pin 13 of the chip).
It was found that the self-excitation of the oscillator in the LTC3108 chip occurs at an input voltage of 22 mV. However, the generator is unstable as long as the voltage is less than 32 mV. With further increase in input voltage, the stable operation of the generator is observed. And as long as the voltage Uin is less than 40 mV, the shape of voltages V2 and V13 is sinusoidal. The experiment also showed that the oscillation frequency is not constant. In particular, when changing the input voltage from 32 to 62 mV, the oscillation frequency decreases from 62.3 to 34.9 kHz.

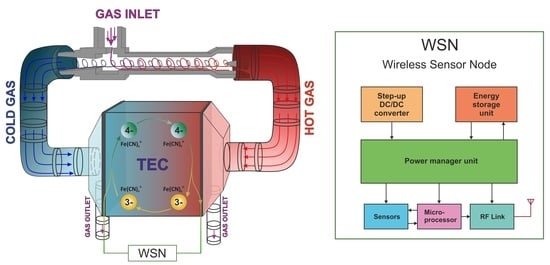
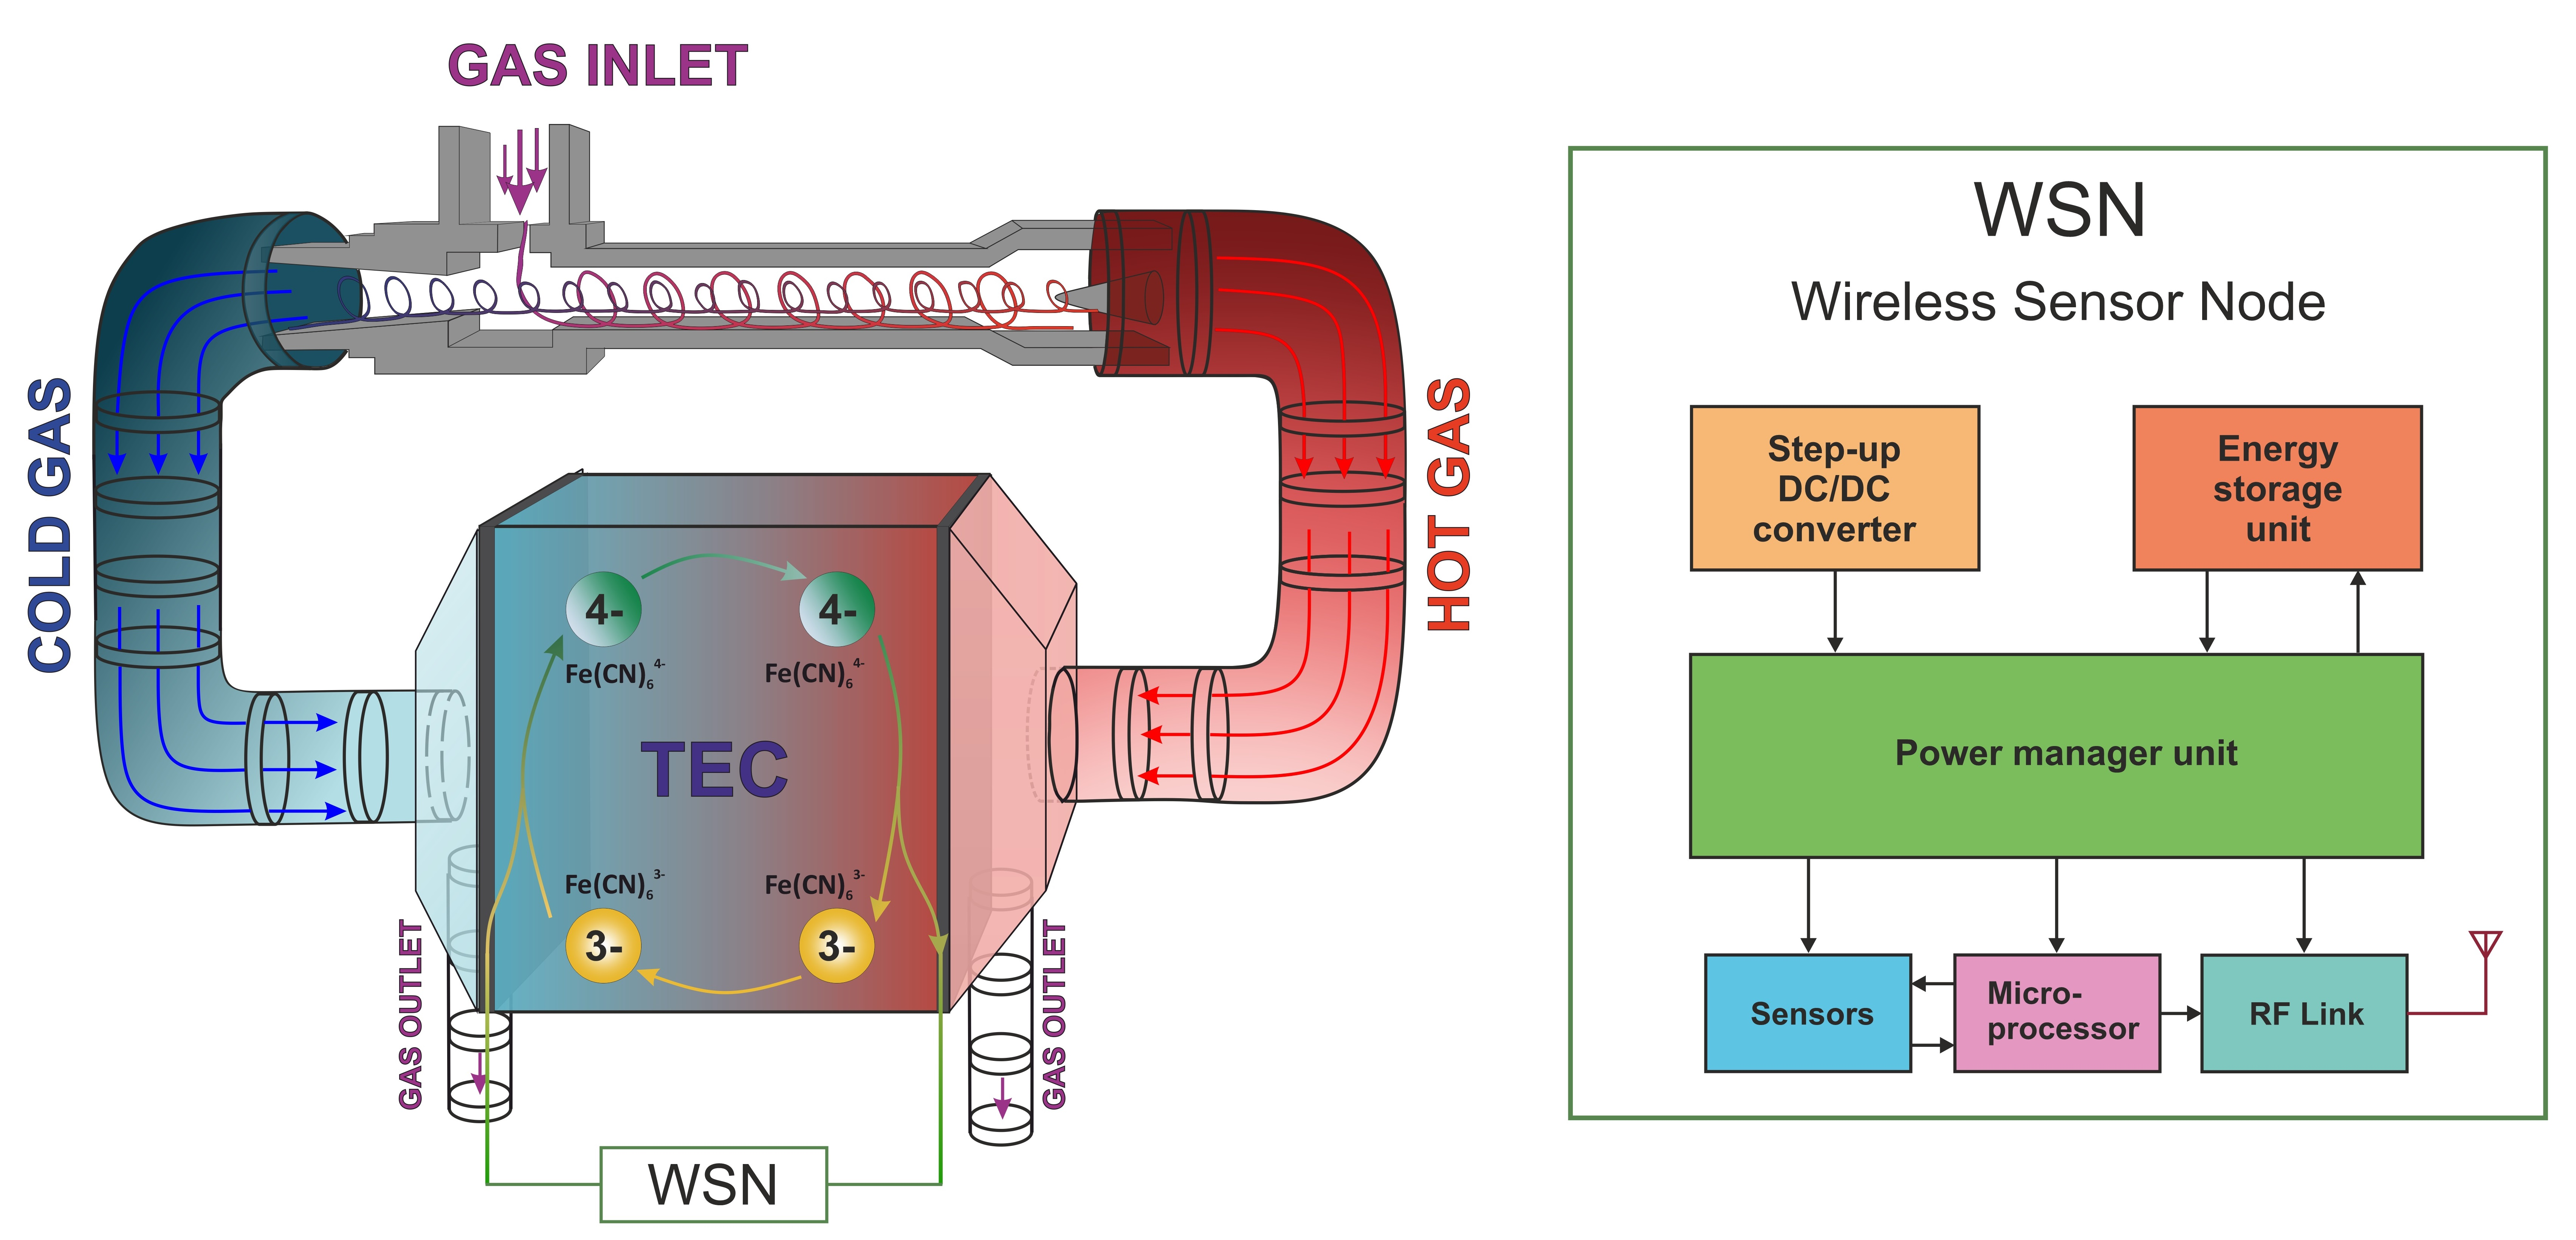
3. Designed and Simulation of Power Supply System

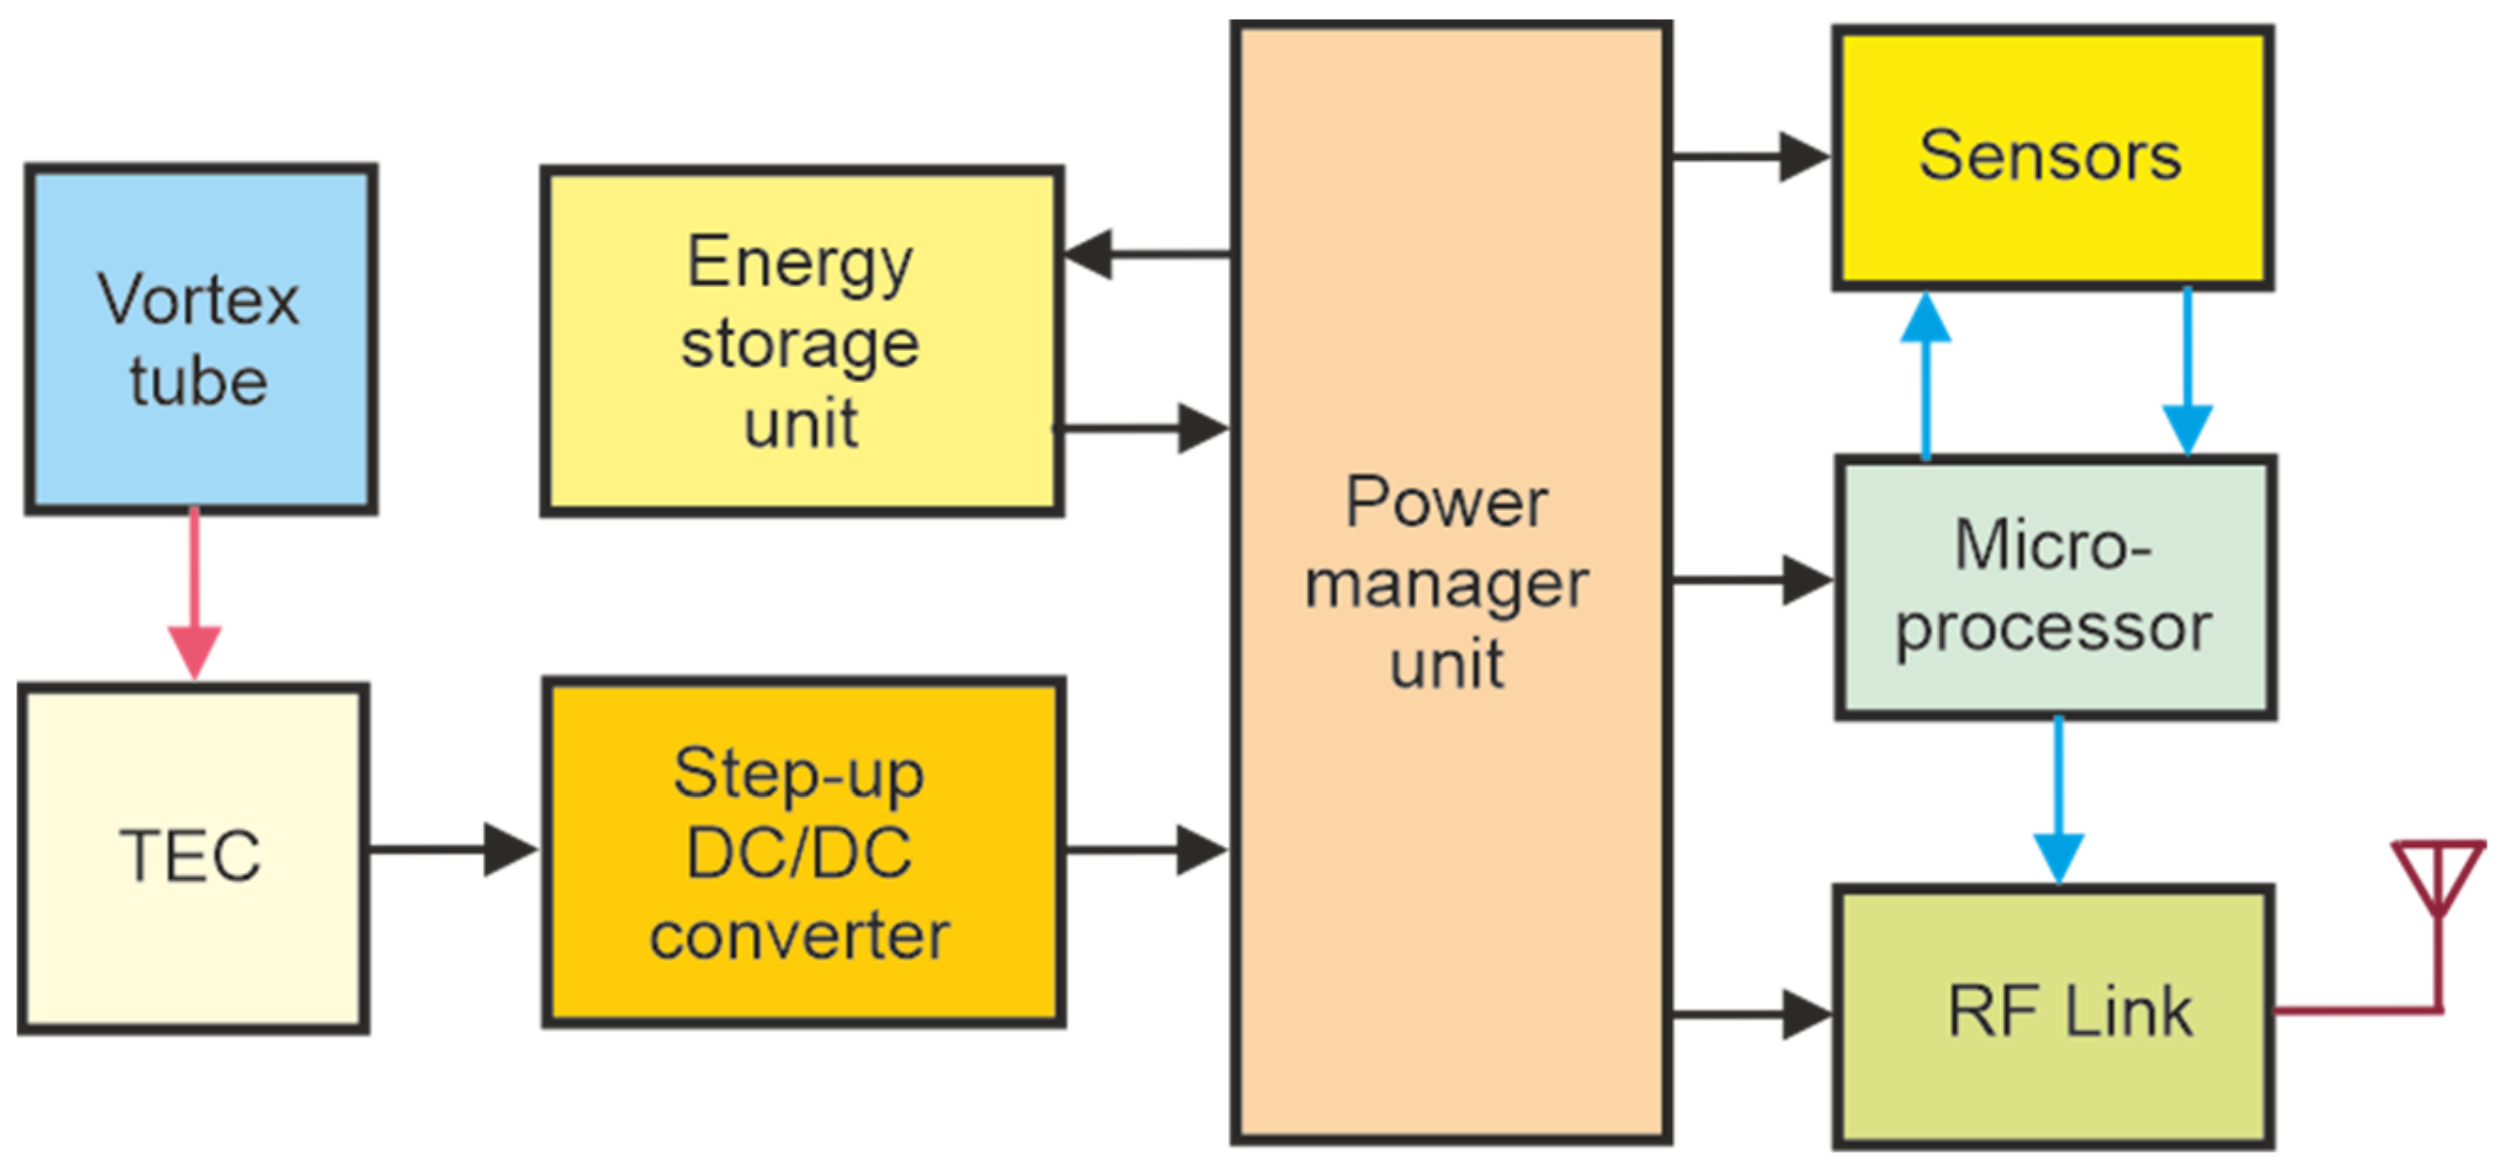
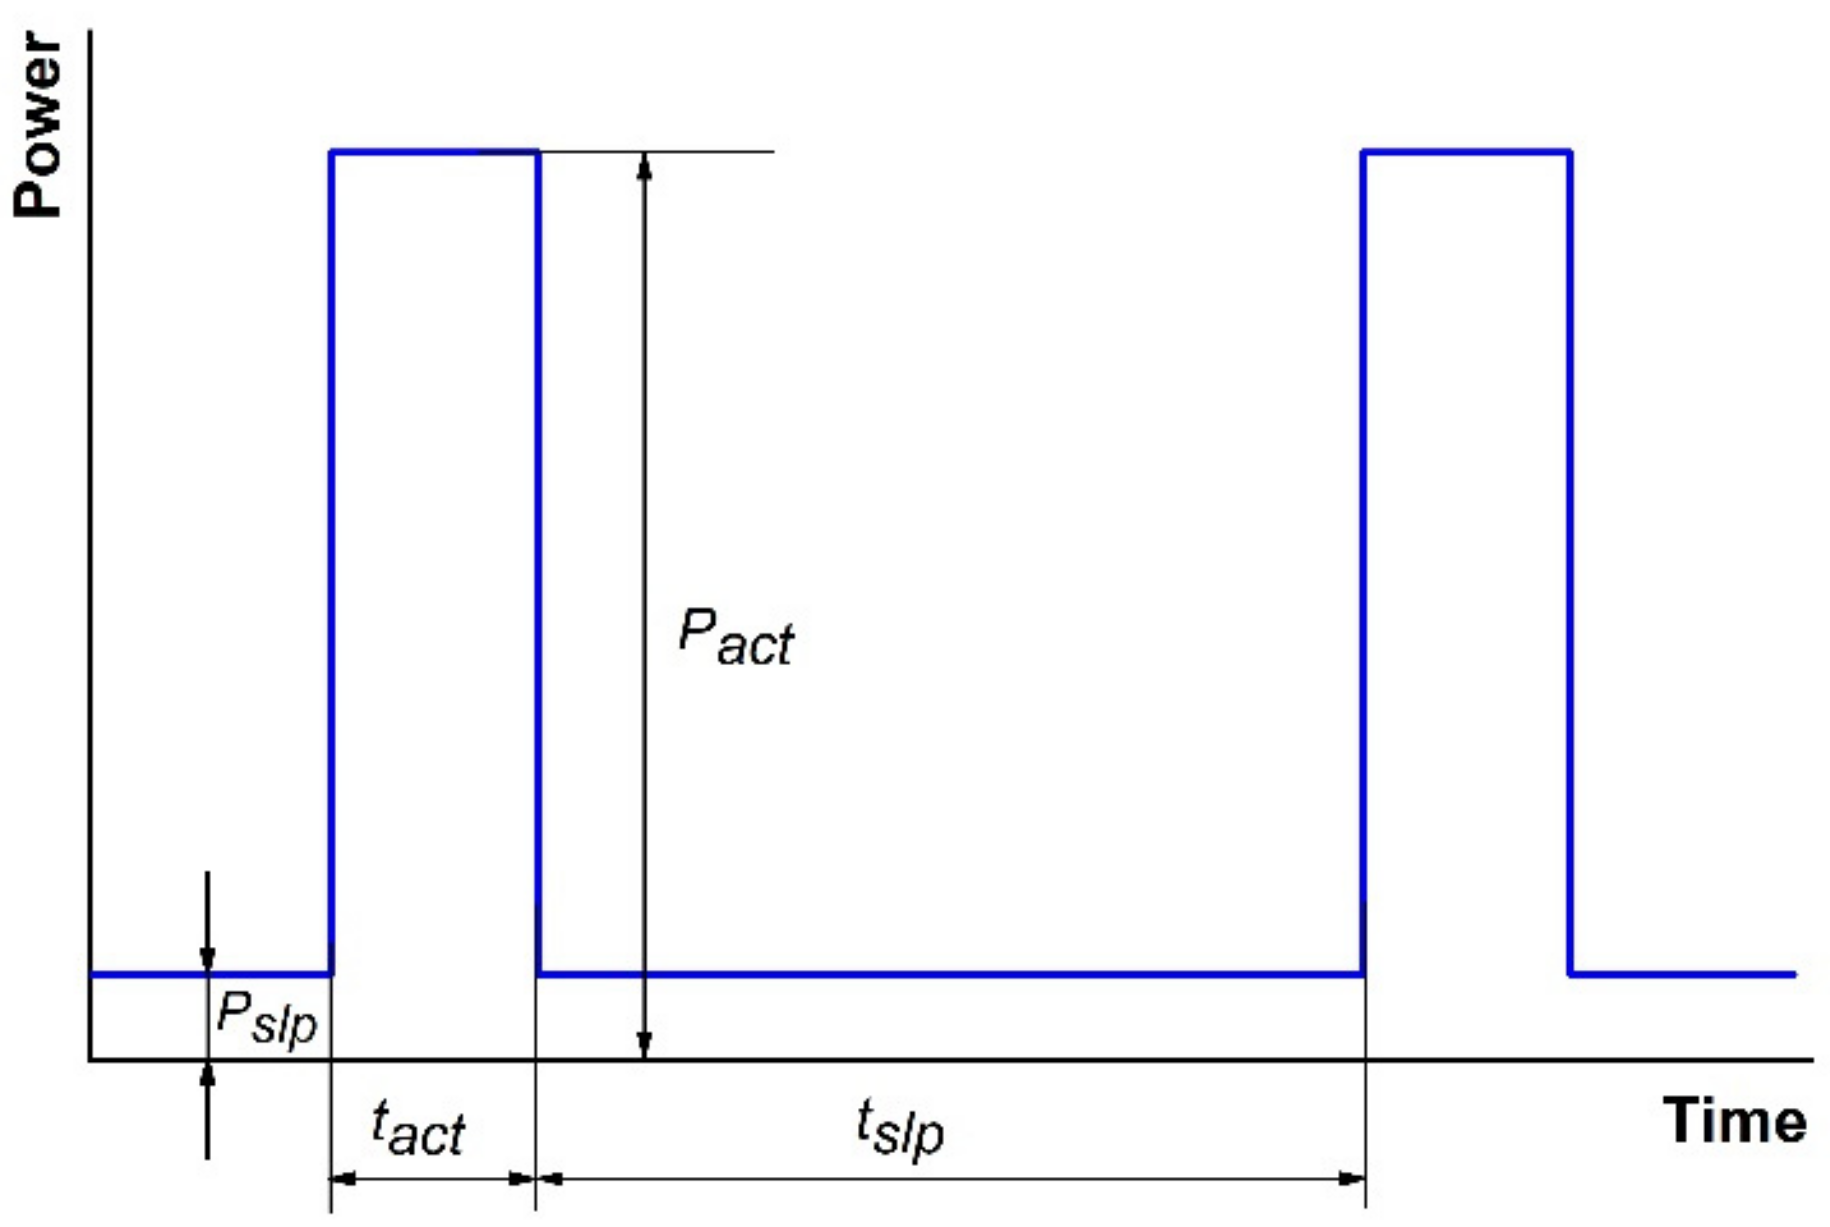
3.1. Block Diagram of a Power Supply System for Wireless Sensor Node
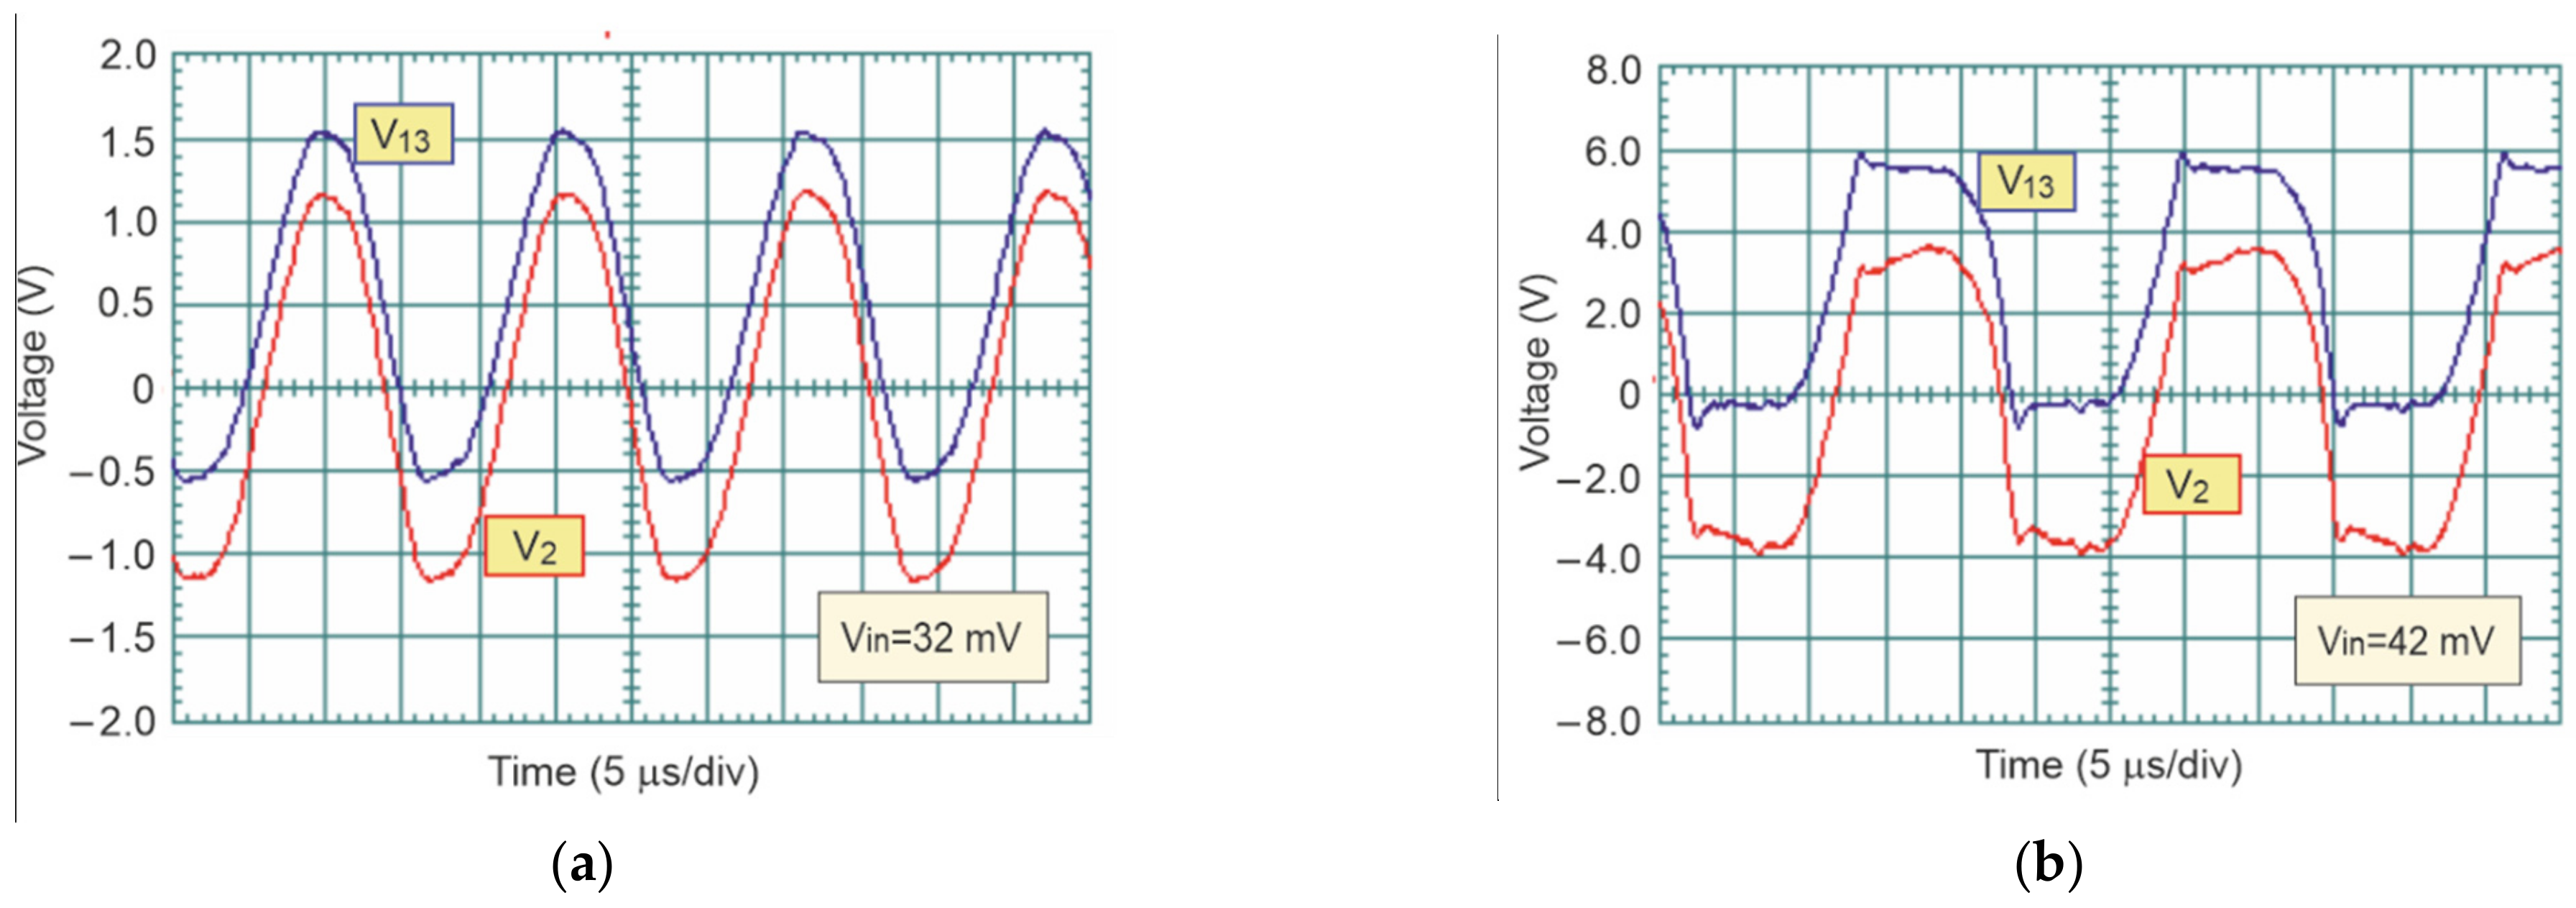
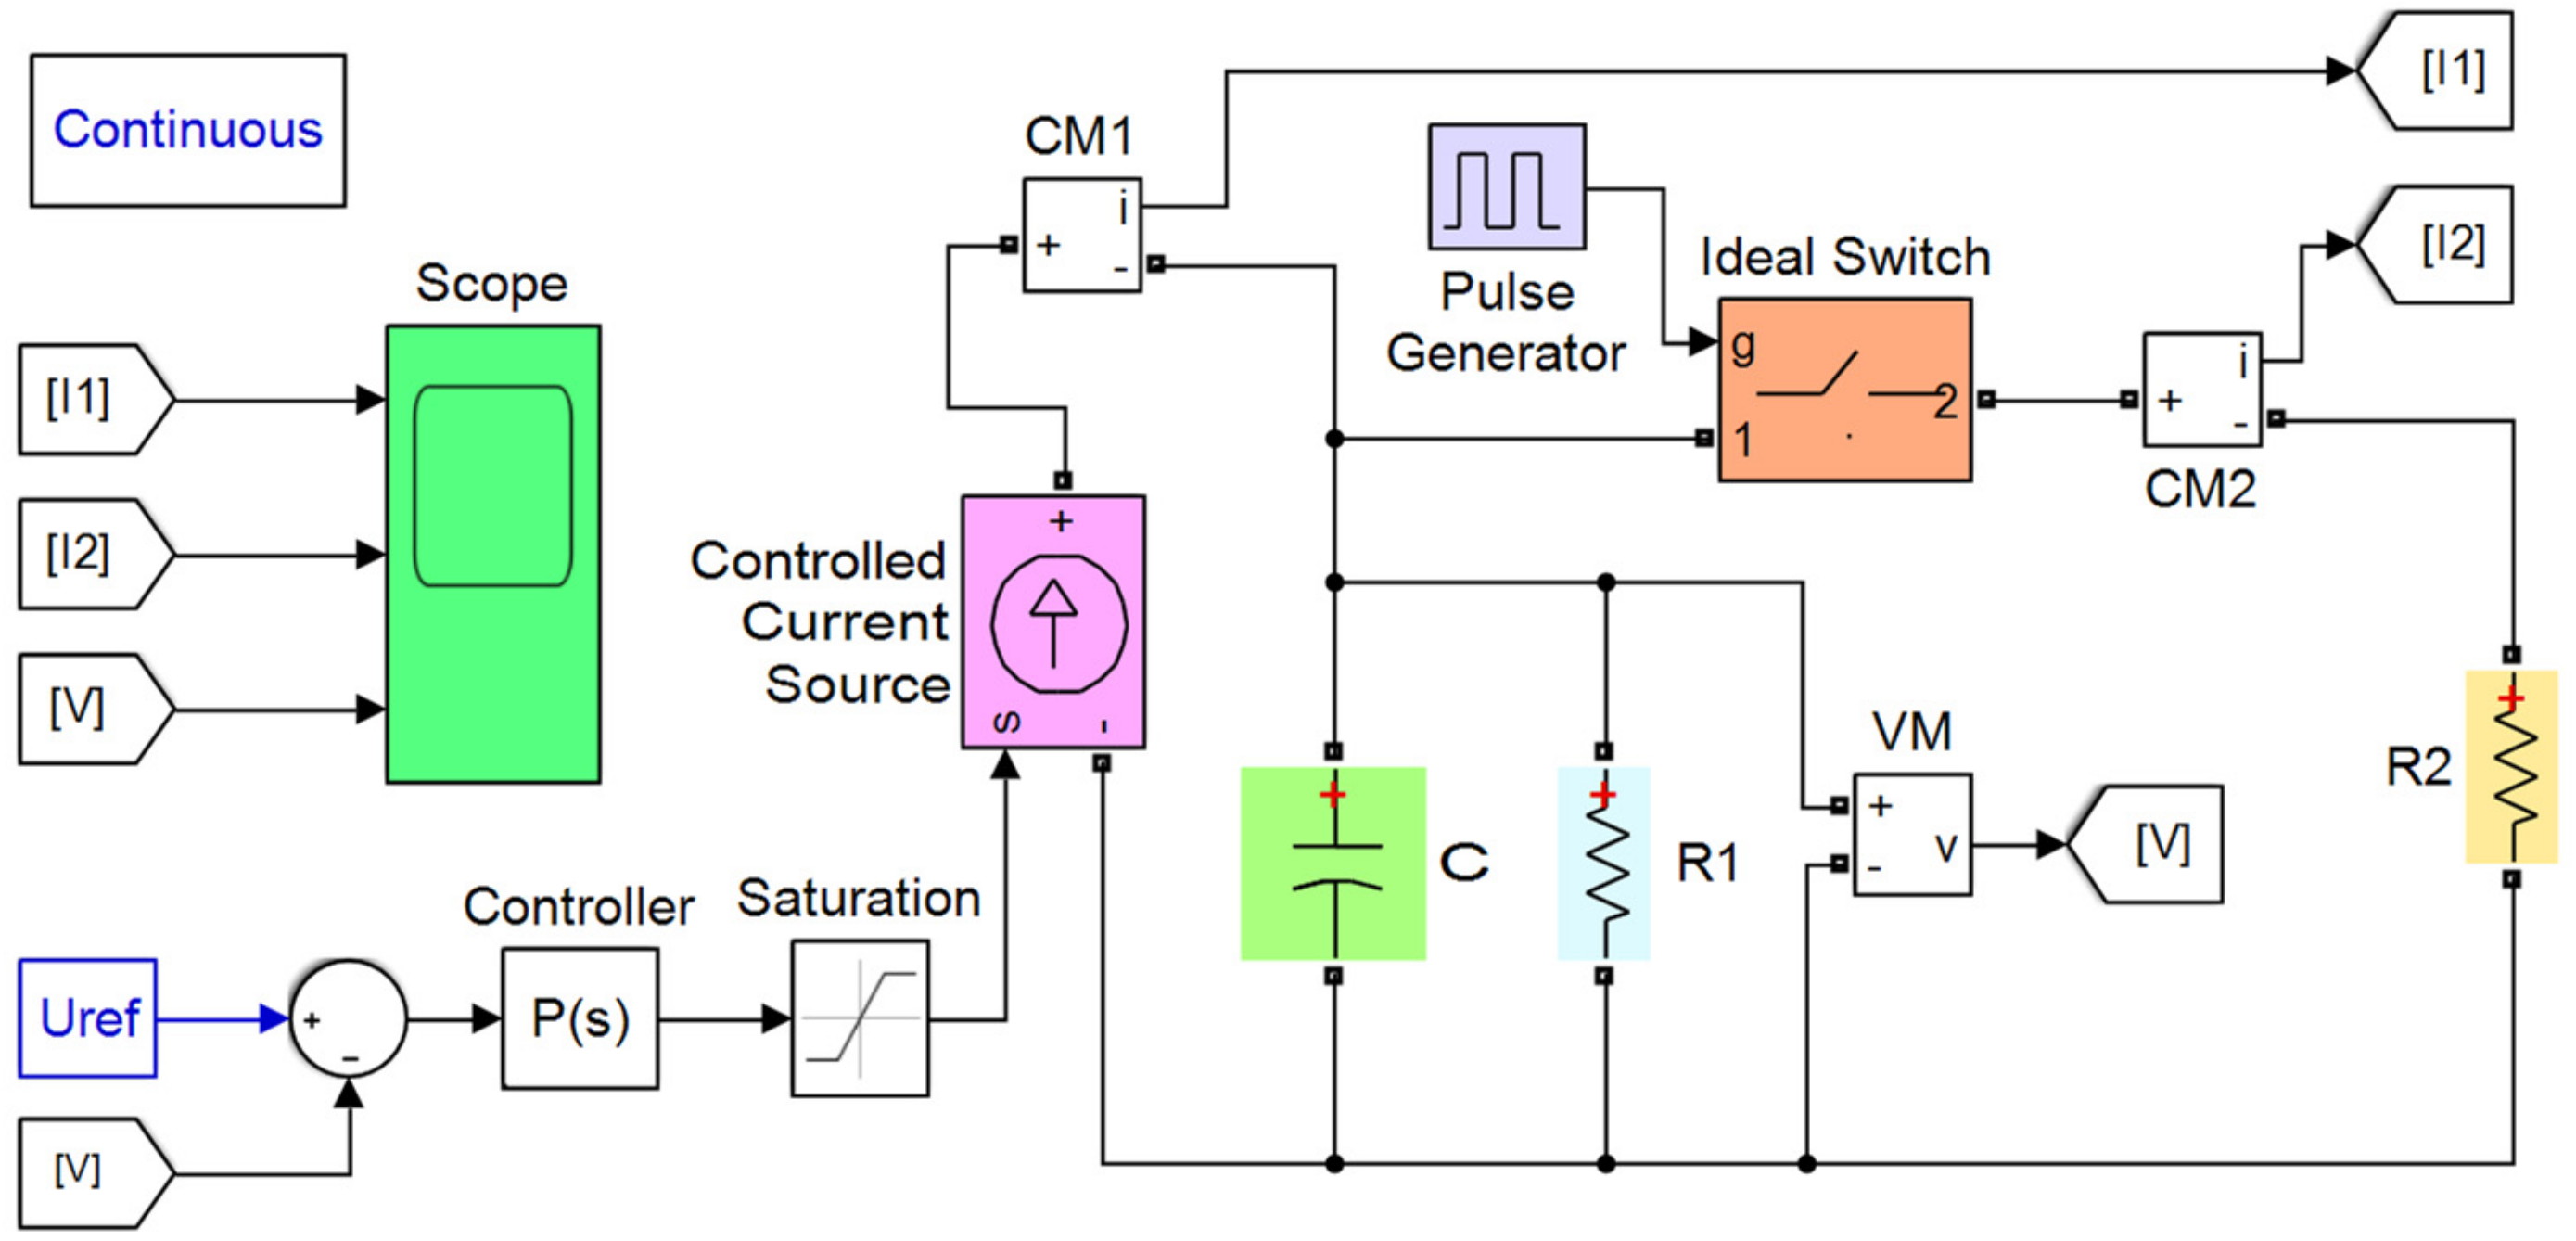
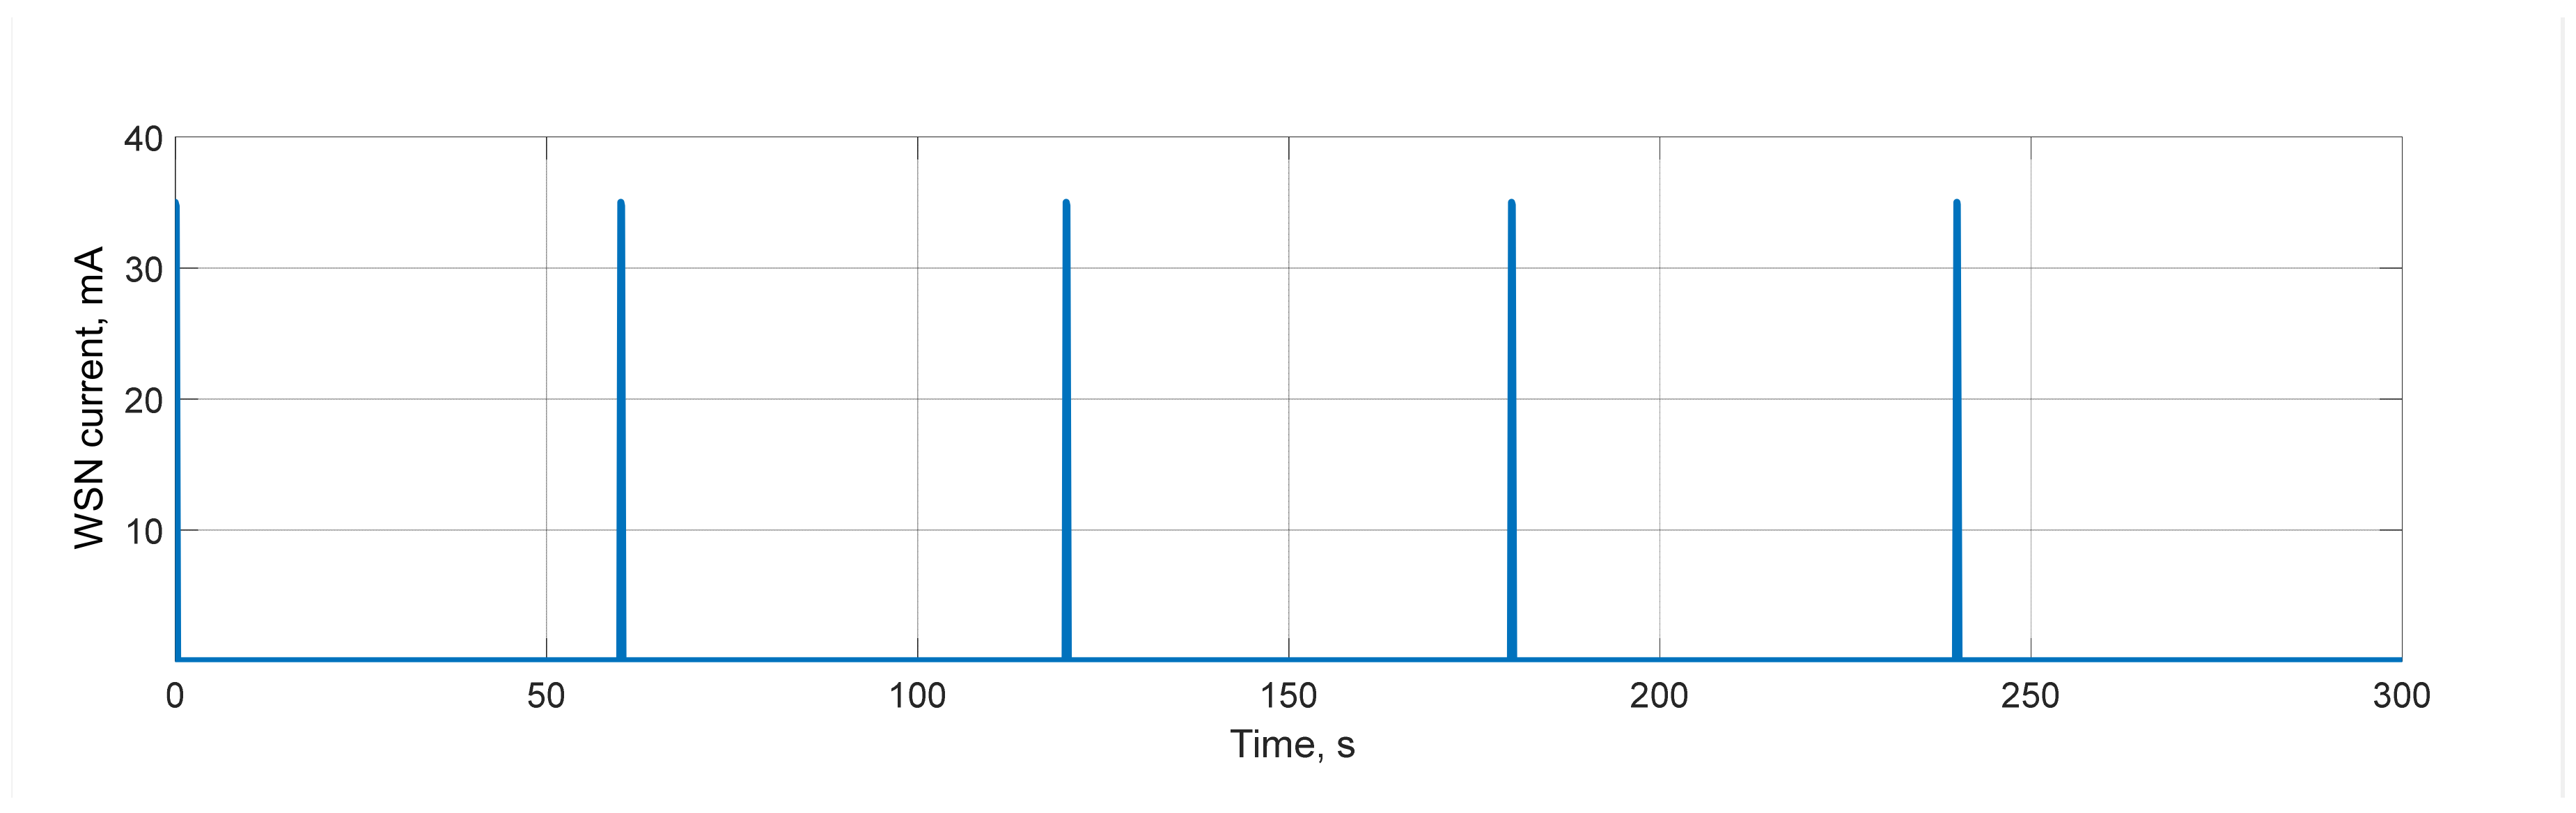
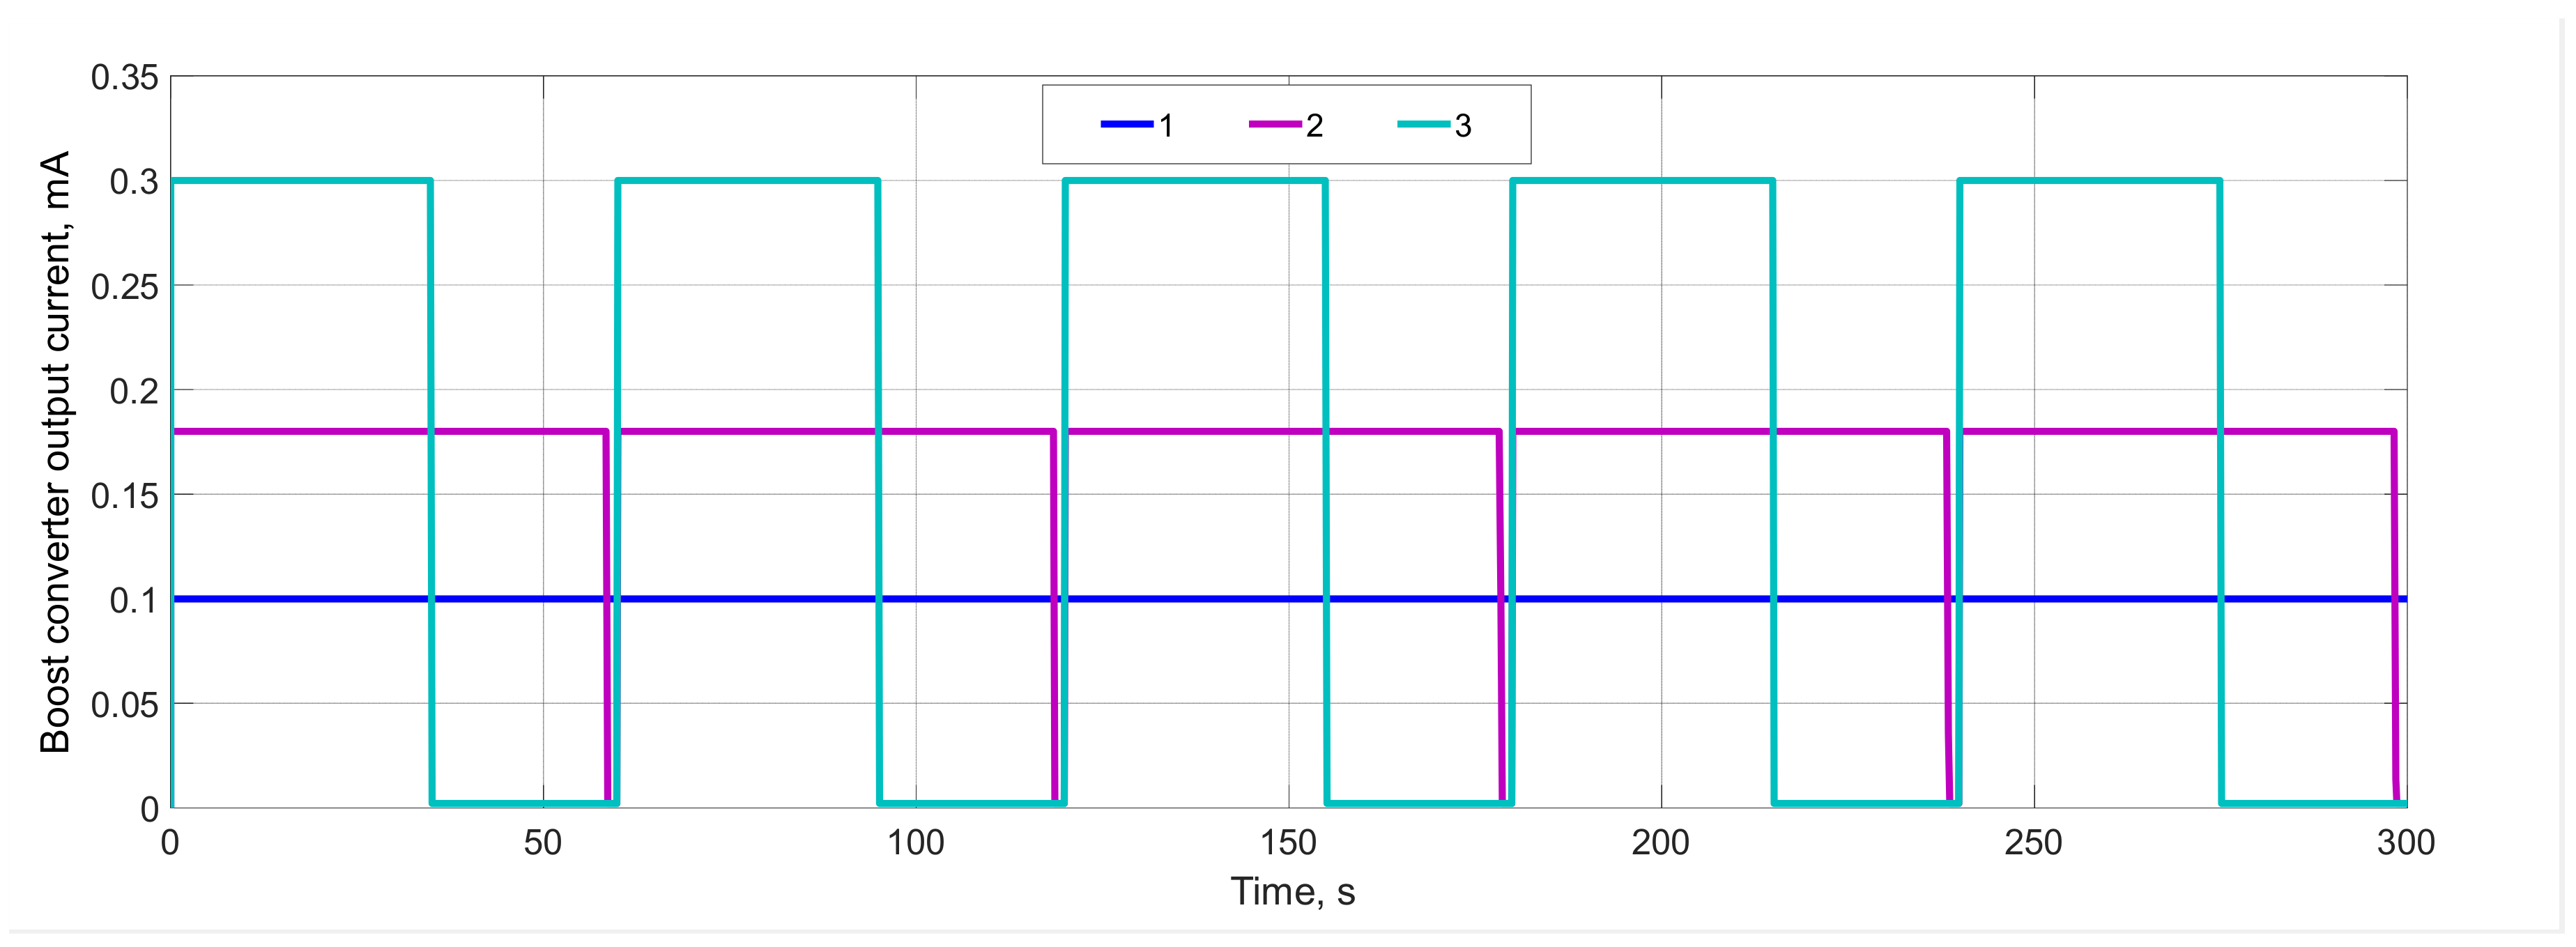
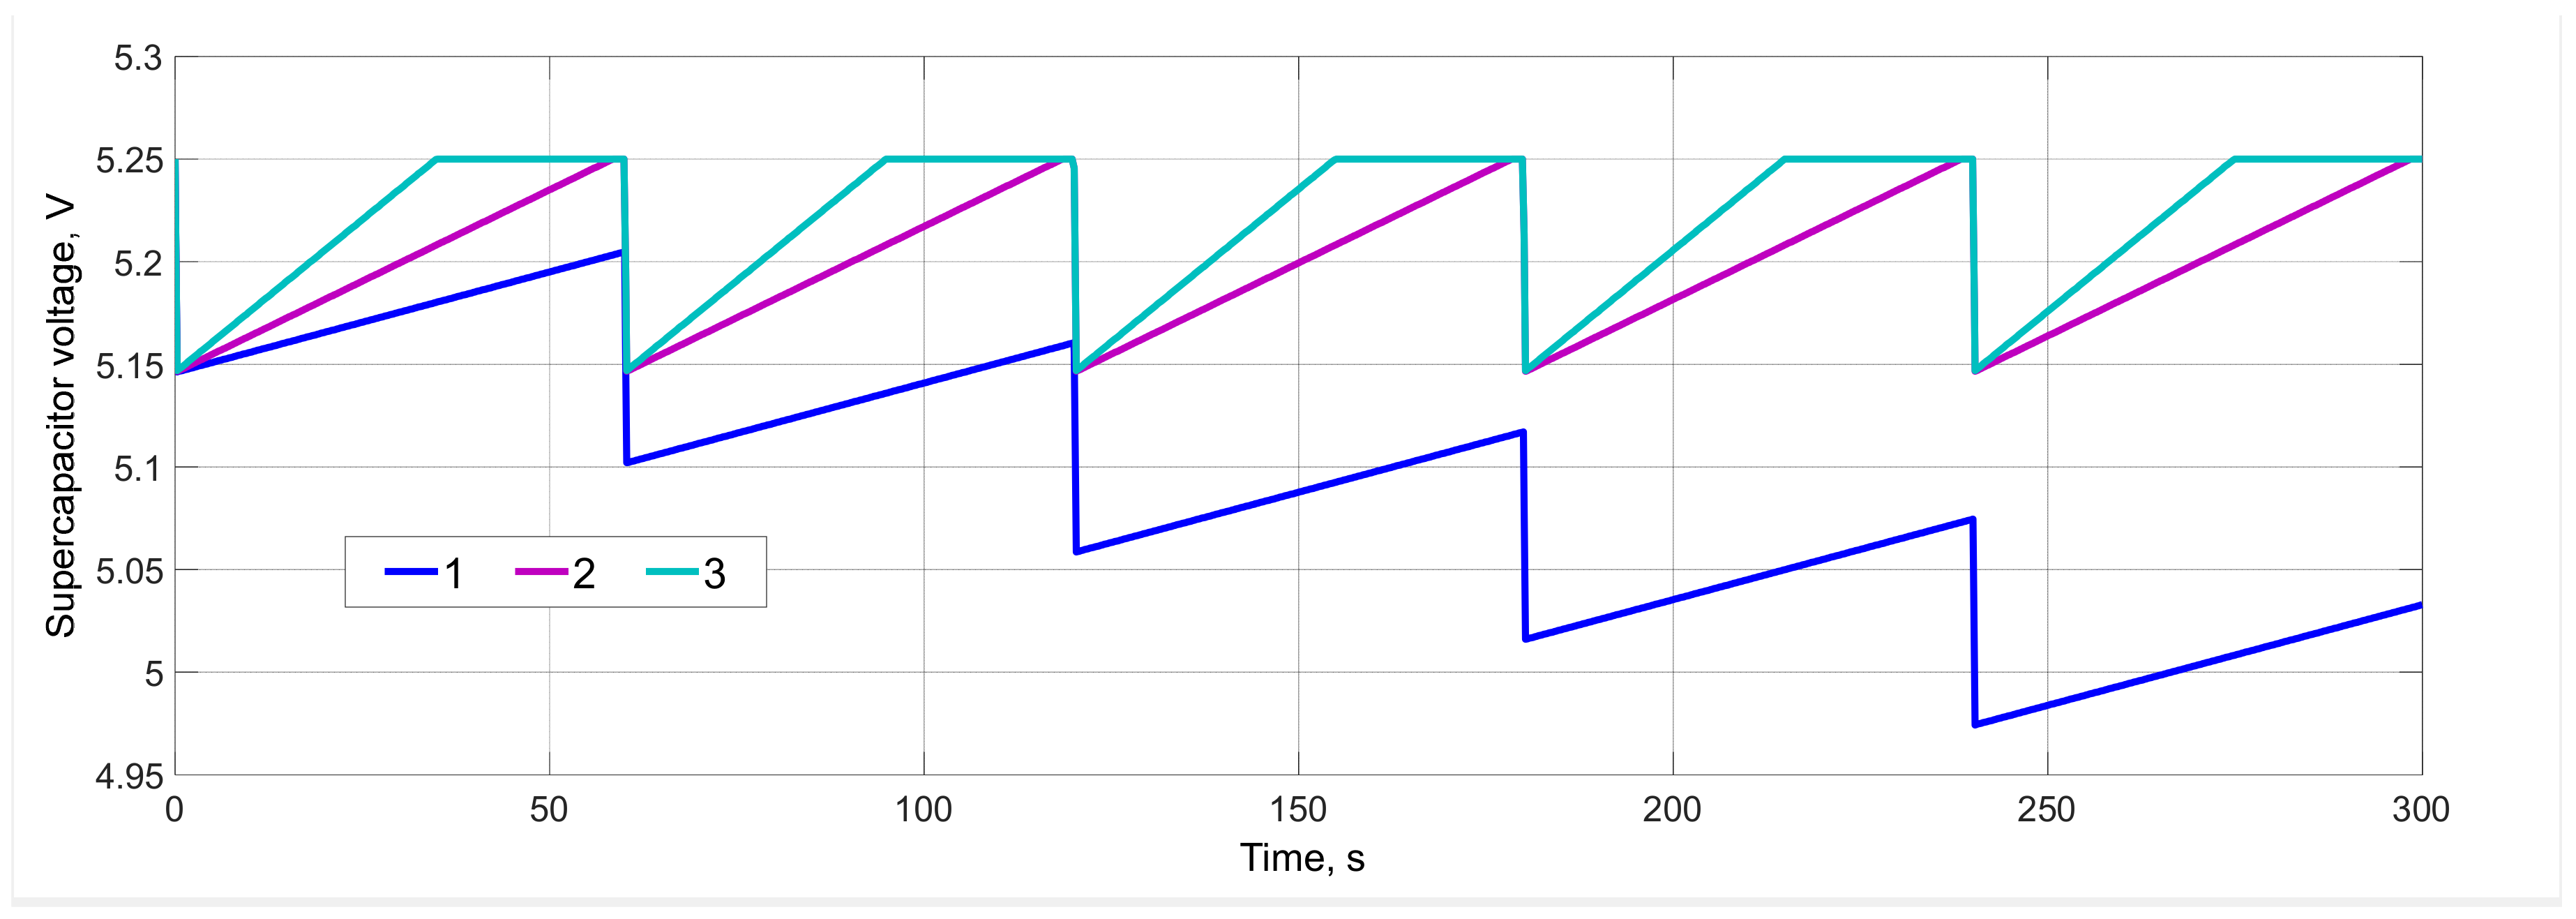
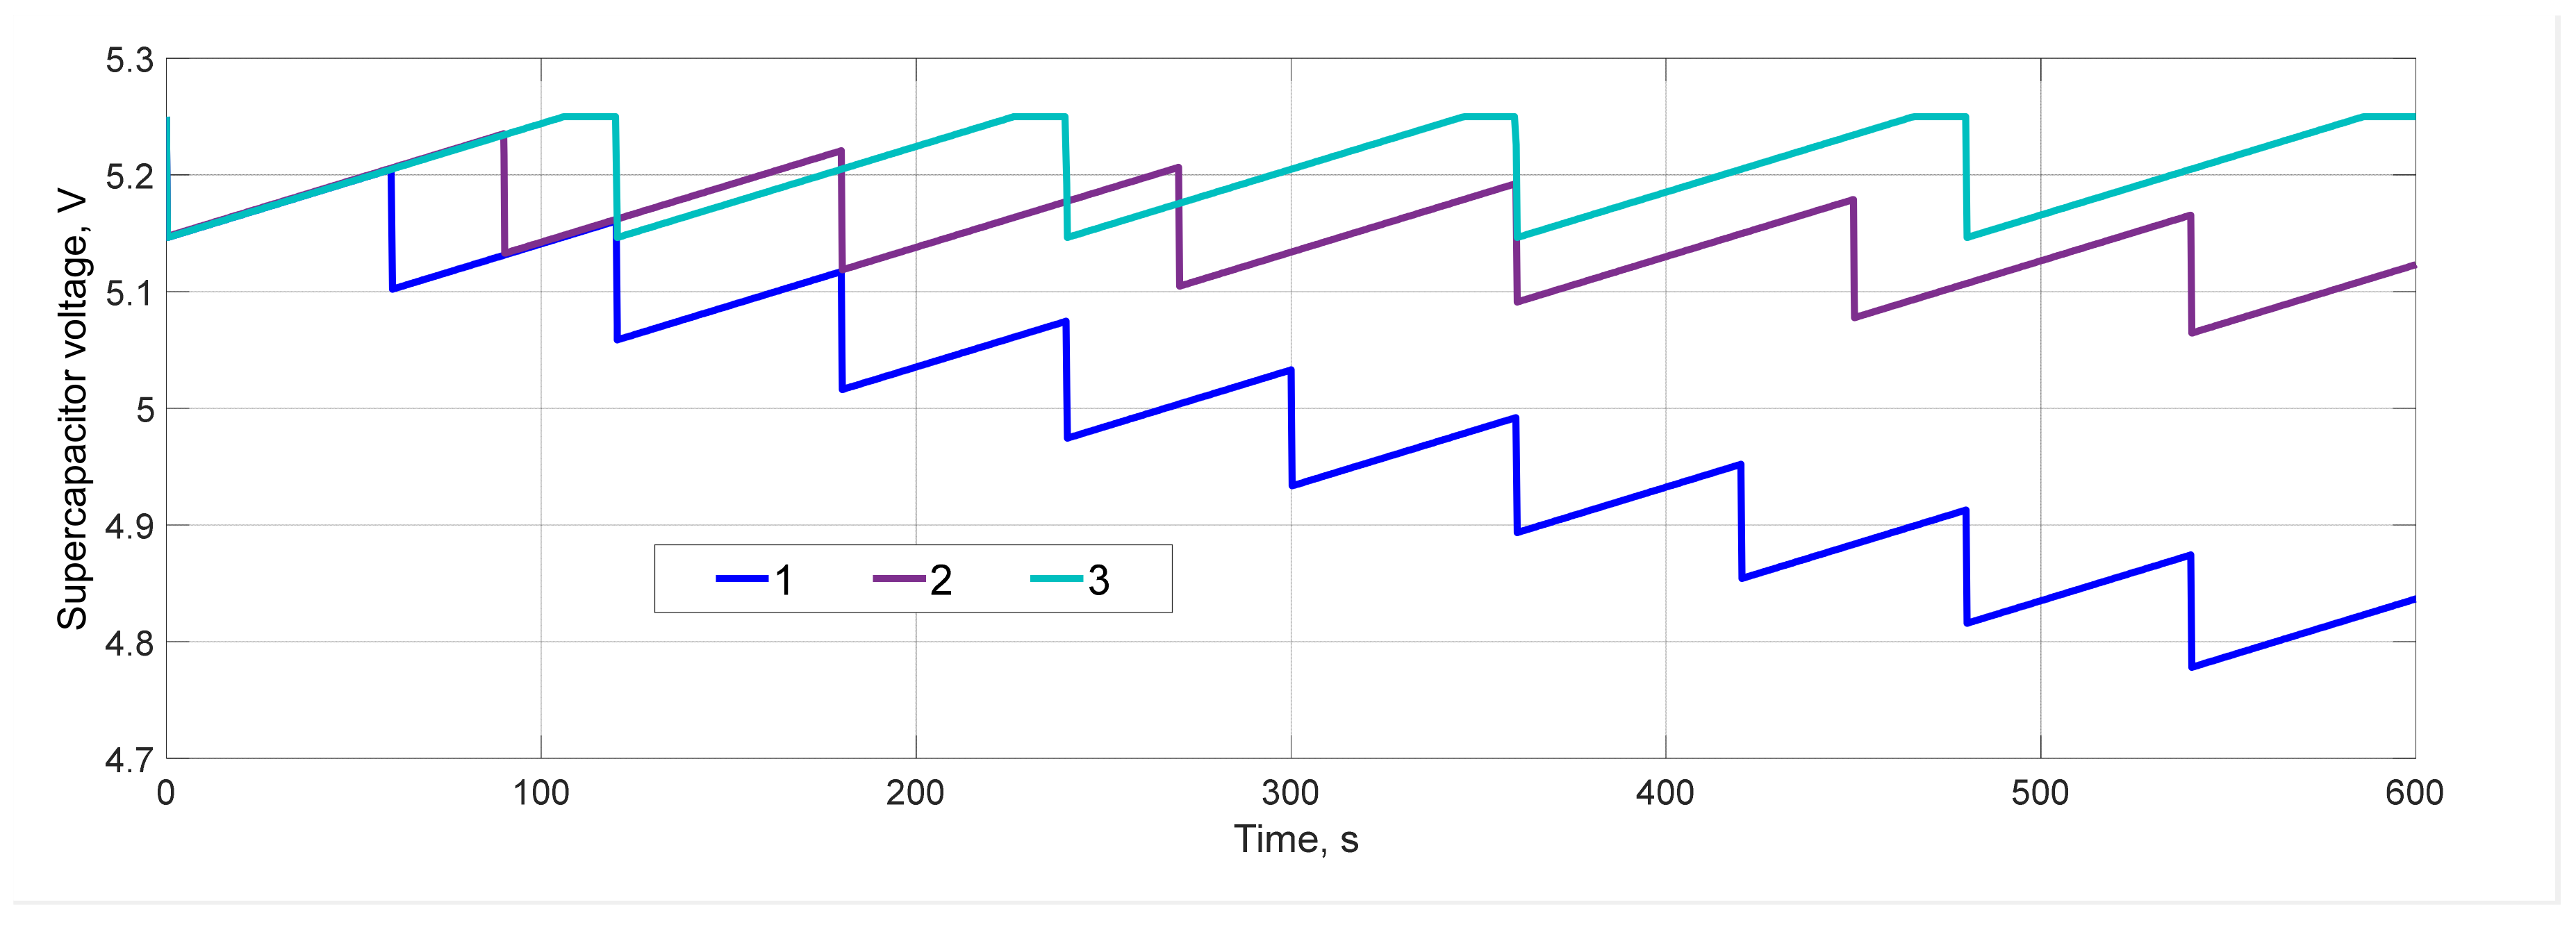
Based on the above, a WSN power supply system can be built. Its block diagram is shown in Figure 10. The vortex tube creates a temperature gradient on the sides of TEC due to the separation of gas flows. TEC convert the temperature gradient into a potential difference, which is applied to the input of the DC/DC boost converter. The output voltage of the boost converter has a value sufficient to power the electronic components of the WSN.
An essential element of the WSN power supply system is the energy storage unit, which uses supercapacitors (electric double-layer capacitors). The power manager unit forms the charge–discharge path of the supercapacitor and provides the necessary voltages to the sensors, microprocessor, and RF link.
Most wireless sensors operate in the pulsed mode in order to optimize power consumption. The load graph of the power supply system of such sensors is shown in Figure 11. During the active mode, the monitored parameters are measured and the received information is transmitted during the duration of tact. The device circuits consume power Pact. Then, the device is switched to the sleep mode, in which the power consumption decreases to the value Pslp. The duration of this state is tslp.
WSN average power consumption:
P A v g = P a c t · D + P s l p · 1 D
where
D = t a c t t a c t + t s l p
For example, consider the power consumption graph of the wireless temperature sensor presented in [43]. It is built on an LTC5901-IPM module with an LTC2484 analog–to–digital converter and is equipped with an LTP5901 radio module. It uses a thermistor as the sensor, which is powered by an LT6654 low-noise reference voltage source.
The duration of the active mode of the device is about 300 ms. The power consumption in this mode does not exceed 1.6 mW. In the sleep mode, the power consumption is reduced to 40 µW. If the sensor is activated once every 10 s, the duty cycle D will be 0.03. Therefore, according to (8), the average value of power consumption will be 87 µW.
In [44], they considered power supply issues of wireless sensor nodes for building energy management applications. It was shown that WSNs in the active mode consume 10–100 mW, and, in the sleep mode, consumption decreases to 10–50 μW. The duration of the active mode is 90 ms, so the average power value when WSNs are turned on once every 5 min does not exceed 50 µW.

3.2. Simulation

For the stable operation of WSN, it is necessary to fulfill the condition
η C O N V · P T E C > P A v g
where ηCONV is the efficiency of the DC/DC step-up converter, PTec is the power delivered by TEC to the load is calculated by Formula (6), and PAvg is the average value of power consumed by WSN is calculated by Formula (10).
If this condition is met, the energy generated by TEC will be sufficient to charge the supercapacitor to a value that will ensure the functioning of the WSN in active mode and to compensate for the energy consumption in sleep mode. In this case, the important task is to choose the parameters of the supercapacitor.
The voltage V(t)SC on the supercapacitor varies from a minimum value of VSC.min at the end of the active mode of WSN operation to a maximum value of VSC.max during charging in sleep mode. The average value of this voltage during the WSN operation cycle will be
V S C = 1 T 0 T V S C t d t
where T = t a c t + t s l p .
The average value of the power that can be transmitted by the step-up converter in the WSN supply circuit can be determined according to the formula
η C O N V · P T E C = V S C · I C O N V
where ICONV is the output current of the DC/DC boost converter.
Formulas (12) and (13) mean that, for a given value of output power, TEC, and efficiency of the step-up DC/DC converter, it should satisfy the condition
I C O N V < η C O N V · P T E C / V S C
To study the supercapacitor charge–discharge processes in the WSN power supply system (Figure 10), a simulation model in the MATLAB environment with the Simulink extension package was developed. The scheme of the model is shown in Figure 12.
The step-up DC/DC converter is represented by the controlled current source block, to the control input of which a signal from the output of the P-controller is fed through the saturation block. At the input of the P-controller comes the difference between the set maximum voltage value on the supercapacitor and the current value of this voltage. The value of the current determined by Formula (14) is entered into the saturation block setting window as the value of the upper limit. The value of the lower limit is zero.
The power consumption of the WSN in sleep mode is simulated by resistor R1. The operation of the WSN in the active mode is simulated by resistor R2, which is connected in parallel with supercapacitor C through the ideal switch block. The WSN operation algorithm is defined by the pulse generator block, in the setting window of which are entered the values of period T and the relative pulse duration determined by Formula (11).
The model allows us to study the processes in the power supply system under different combinations of parameters forming its elements and algorithms of WSN operation. As an example, the simulation results are given below, assuming that TEC are produced according to the technology outlined in [32]. In this case, based on Figure 7 and Table 1, we determined that, if the pressure at the vortex tube inlet varies from 5 to 7 bar, the load capacity of the power system ranges from 0.46 to 1.54 mW. These data were calculated for the case when the efficiency of the voltage step-up converter is 60%. According to Formula (14), in the indicated vortex tube inlet pressure range, the output current limit of the DC/DC boost converter will be limited in values of 0.1 to 0.3 mA. It is assumed that the average value of voltage on the supercapacitor is about 5 V.
The duration of the active mode is 300 ms, with a current consumption of 18 mA. In the sleep mode, the current consumption is reduced to 3 µA. The capacity of the supercapacitor was assumed to be 0.1 F, according to the recommendations for the LTC3108 chip [40]. Figure 13, Figure 14 and Figure 15 show the simulation results for three values of pressure at the inlet of the vortex tube.
It was assumed that the initial voltage on the supercapacitor is 5.25 V. During the WSN activation time, the voltage on the supercapacitor decreases, then increases along a trajectory that depends on the output current of the DC/DC step-up converter.
At a pressure of 5 bar, the generated power is not sufficient for the stable operation of the power supply system. When the WSN is in sleep mode, the supercapacitor does not have time to recharge the required energy reserve. Therefore, by the moment of subsequent activation of the WSN, the voltage on the supercapacitor becomes lower than it was at the beginning of the previous cycle.
At a pressure of 6 bar, the supercapacitor has time to charge while the WSN is in sleep mode. Therefore, at this pressure, the power supply system works stably.
At a pressure of 7 bar, the supercapacitor voltage reaches the setpoint value much earlier than the sleep mode ends. The system works stably with a power reserve.
The results of the simulation of the power supply system show that, during pressure fluctuations at the vortex tube inlet, the stable operation of the WSN can be ensured by reducing its activation frequency.
Figure 16 shows virtual oscillograms of the supercapacitor voltages obtained by simulating the WSN power supply system at different values of the activation period. The pressure at the inlet of the vortex tube was 5 bar.
The obtained oscillograms show that, when the period duration increases from 60 to 90 s, the system approaches the stability limit. If the duration of the WSN activation period is 120 s, stable operation of the power supply system is observed.

4. Conclusions

This paper investigates the possibility of supplying a wireless sensor node using a thermoelectrochemical cell that converts the energy of separated gas flows into electrical energy. The focus is on the conversion of gas flow energy into electrical energy and the method of its accumulation by the example of the described TEC.
By the example of the developed model of the gas flow energy converter into a temperature gradient and based on the power of TECs given in the literature, the efficiency of gas flow energy conversion into electrical energy was calculated.
A virtual step-up DC/DC converter model simulating supercapacitor charging and energy transfer to power a wireless sensor node was created. Based on the data of TEC, step-up DC/DC converter, and vortex tube, calculations of the power supply efficiency for WSN were made.
Based on the dependence of the output power of the TEC on the pressure at the inlet of the vortex tube, the WSN power system operation modes were determined. It was shown that the system was unstable when the pressure was insufficient. However, the stability of the system could be improved by increasing its activation period.

Author Contributions

Conceptualization, D.A.; methodology, I.A.; software, N.G., N.K. and D.A.; validation, A.Z.; formal analysis, M.V.; investigation, D.A., N.K. and I.A.; data curation, N.G.; writing—original draft preparation, D.A.; writing—review and editing, I.A. and A.Z.; visualization, D.A. and N.G.; supervision, N.G.; project administration, D.A.; funding acquisition, D.A. All authors have read and agreed to the published version of the manuscript.

Funding

This research was funded by FASIE according to the contract 16771GU/2021. The research was supported by the grant of the President of the Russian Federation MC-2204.2022.1.3.

Conflicts of Interest

The authors declare no conflict of interest. The funders had no role in the design of the study; in the collection, analyses, or interpretation of data; in the writing of the manuscript; or in the decision to publish the results.

References

  1. Volkov, A.A.; Sukneva, L.V. BIM-technology in tasks of the designing complex systems of alternative energy supply. Procedia Eng. 2014, 91, 377–380. [Google Scholar] [CrossRef] [Green Version]
  2. Kodirov, D.; Muratov, K.; Tursunov, O.; Ugwu, E.I.; Durmanov, A. The use of renewable energy sources in integrated energy supply systems for agriculture. IOP Conf. Ser. Earth Environ. Sci. 2020, 614, 012007. [Google Scholar] [CrossRef]
  3. Inaudi, D.; Glisic, B. Reliability and field testing of distributed strain and temperature sensors. In Proceedings of the Smart Structures and Materials 2006: Smart Sensor Monitoring Systems and Applications, San Diego, CA, USA, 30 March 2006; Volume 6167, p. 61671D. [Google Scholar]
  4. Ukil, A.; Braendle, H.; Krippner, P. Distributed temperature sensing: Review of technology and applications. IEEE Sens. J. 2011, 12, 885–892. [Google Scholar] [CrossRef] [Green Version]
  5. Feng, X.; Han, Y.; Wang, Z.; Liu, H. Structural performance monitoring of buried pipelines using distributed fiber optic sensors. J. Civ. Struct. Health Monit. 2018, 8, 509–516. [Google Scholar] [CrossRef]
  6. Junie, P.; Dinu, O.; Eremia, C.; Stefanoiu, D.; Petrescu, C.; Savulescu, I. A WSN based monitoring system for oil and gas transportation through pipelines. IFAC Proc. Vol. 2012, 45, 1796–1801. [Google Scholar] [CrossRef]
  7. Mahdal, M.; Wagnerová, R.; Frischer, R. Alternative methods of power supply for autonomous intelligent wireless sensors. In Proceedings of the 2011 12th International Carpathian Control Conference (ICCC), Velke Karlovice, Czech Republic, 25–28 May 2011; pp. 258–261. [Google Scholar]
  8. Prauzek, M.; Konecny, J.; Borova, M.; Janosova, K.; Hlavica, J.; Musilek, P. Energy Harvesting Sources, Storage Devices and System Topologies for Environmental Wireless Sensor Networks: A Review. Sensors 2018, 18, 2446. [Google Scholar] [CrossRef] [Green Version]
  9. Antony, S.M.; Indu, S.; Pandey, R. An efficient solar energy harvesting system for wireless sensor network nodes. J. Inf. Optim. Sci. 2020, 41, 39–50. [Google Scholar] [CrossRef]
  10. Grossi, M. Energy Harvesting Strategies for Wireless Sensor Networks and Mobile Devices: A Review. Electronics 2021, 10, 661. [Google Scholar] [CrossRef]
  11. Deng, F.; Yue, X.; Fan, X.; Guan, S.; Xu, Y.; Chen, J. Multisource Energy Harvesting System for a Wireless Sensor Network Node in the Field Environment. IEEE Internet Things J. 2019, 6, 918–927. [Google Scholar] [CrossRef]
  12. Qi, N.; Yin, Y.; Dai, K.; Wu, C.; Wang, X.; You, Z. Comprehensive optimized hybrid energy storage system for long-life solar-powered wireless sensor network nodes. Appl. Energy 2021, 290, 116780. [Google Scholar] [CrossRef]
  13. Liu, Y.; Wang, H.; Sherrell, P.C.; Liu, L.; Wang, Y.; Chen, J. Potentially Wearable Thermo-Electrochemical Cells for Body Heat Harvesting: From Mechanism, Materials, Strategies to Applications. Adv. Sci. 2021, 8, 2100669. [Google Scholar] [CrossRef]
  14. Nimbalkar, S.U.; Muller, M.R. An experimental investigation of the optimum geometry for the cold end orifice of a vortex tube. Appl. Therm. Eng. 2009, 29, 509–514. [Google Scholar] [CrossRef]
  15. Behera, U.; Paul, P.J.; Dinesh, K.; Jacob, S. Numerical investigations on flow behaviour and energy separation in Ranque–Hilsch vortex tube. Int. J. Heat Mass Transf. 2008, 51, 6077–6089. [Google Scholar] [CrossRef]
  16. Hamdan, M.O.; Al-Omari, S.A.; Oweimer, A.S. Experimental study of vortex tube energy separation under different tube design. Exp. Therm. Fluid Sci. 2018, 91, 306–311. [Google Scholar] [CrossRef]
  17. Twaha, S.; Zhu, J.; Yan, Y.; Li, B. A comprehensive review of thermoelectric technology: Materials, applications, modelling and performance improvement. Renew. Sustain. Energy Rev. 2016, 65, 698–726. [Google Scholar] [CrossRef]
  18. Riffat, S.B.; Ma, X. Thermoelectrics: A review of present and potential applications. Appl. Therm. Eng. 2003, 23, 913–935. [Google Scholar] [CrossRef]
  19. Mamur, H.; Ahiska, R. A review: Thermoelectric generators in renewable energy. Int. J. Renew. Energy Res. 2014, 4, 128–136. [Google Scholar]
  20. Champier, D. Thermoelectric generators: A review of applications. Energy Convers. Manag. 2017, 140, 167–181. [Google Scholar] [CrossRef]
  21. Montecucco, A.; Siviter, J.; Knox, A.R. The effect of temperature mismatch on thermoelectric generators electrically connected in series and parallel. Appl. Energy 2014, 123, 47–54. [Google Scholar] [CrossRef] [Green Version]
  22. Dupont, M.F.; MacFarlane, D.R.; Pringle, J.M. Thermo-electrochemical cells for waste heat harvesting–progress and perspectives. Chem. Commun. 2017, 53, 6288–6302. [Google Scholar] [CrossRef]
  23. Im, H.; Kim, T.; Song, H.; Choi, J.; Park, J.S.; Ovalle-Robles, R.; Yang, H.D.; Kihm, K.D.; Baughman, R.H.; Lee, H.H.; et al. High-efficiency electrochemical thermal energy harvester using carbon nanotube aerogel sheet electrodes. Nat. Commun. 2016, 7, 10600. [Google Scholar] [CrossRef] [Green Version]
  24. Artyukhov, D.; Kiselev, N.; Gorshkov, N.; Kovyneva, N.; Ganzha, O.; Vikulova, M.; Gorokhovsky, A.; Offor, P.; Boychenko, E.; Burmistrov, I. Harvesting Waste Thermal Energy Using a Surface-Modified Carbon Fiber-Based Thermo-Electrochemical Cell. Sustainability 2021, 13, 1377. [Google Scholar] [CrossRef]
  25. Bonetti, M.; Nakamae, S.; Huang, B.T.; Salez, T.J.; Wiertel-Gasquet, C.; Roger, M. Thermoelectric energy recovery at ionic-liquid/electrode interface. J. Chem. Phys. 2015, 142, 244708. [Google Scholar] [CrossRef] [Green Version]
  26. Bonetti, M.; Nakamae, S.; Roger, M.; Guenoun, P. Huge Seebeck coefficients in nonaqueous electrolytes. J. Chem. Phys. 2011, 134, 114513. [Google Scholar] [CrossRef] [Green Version]
  27. Artyukhov, D.; Kiselev, N.; Gorshkov, N.; Burmistrov, I. Research of the influence of electrolyte concentration on thermo-electrochemical cells efficiency. Proc. Environ. Sci. Eng. Manag. 2019, 6, 319–327. [Google Scholar]
  28. Hu, R.; Cola, B.A.; Haram, N.; Barisci, J.N.; Lee, S.; Stoughton, S.; Wallace, G.; Too, C.; Thomas, M.; Gestos, A. Harvesting waste thermal energy using a carbon-nanotube-based thermo-electrochemical cell. Nano Lett. 2010, 10, 838–846. [Google Scholar] [CrossRef]
  29. Duan, J.; Feng, G.; Yu, B.; Li, J.; Chen, M.; Yang, P.; Feng, J.; Liu, K.; Zhou, J. Aqueous thermogalvanic cells with a high Seebeck coefficient for low-grade heat harvest. Nat. Commun. 2018, 9, 5146. [Google Scholar] [CrossRef] [Green Version]
  30. Kim, J.H.; Kang, T.J. Diffusion and Current Generation in Porous Electrodes for Thermo-electrochemical Cells. ACS Appl. Mater. Interfaces 2019, 11, 28894–28899. [Google Scholar] [CrossRef]
  31. Burmistrov, I.; Gorshkov, N.; Kovyneva, N.; Kolesnikov, E.; Khaidarov, B.; Karunakaran, G.; Cho, E.-B.; Kiselev, N.; Artyukhov, D.; Kuznetsov, D.; et al. High seebeck coefficient thermo-electrochemical cell using nickel hollow microspheres electrodes. Renew. Energy 2020, 157, 1–8. [Google Scholar] [CrossRef]
  32. Kim, T.; Lee, J.S.; Lee, G.; Yoon, H.; Yoon, J.; Kang, T.J.; Kim, Y.H. High thermopower of ferri/ferrocyanide redox couple in organic-water solutions. Nano Energy 2017, 31, 160–167. [Google Scholar] [CrossRef]
  33. Yang, H.D.; Tufa, L.T.; Bae, K.M.; Kang, T.J. A tubing shaped, flexible thermal energy harvester based on a carbon nanotube sheet electrode. Carbon 2015, 86, 118–123. [Google Scholar] [CrossRef]
  34. Zhou, H.; Liu, P. High Seebeck coefficient electrochemical thermocells for efficient waste heat recovery. ACS Appl. Energy Mater. 2018, 1, 1424–1428. [Google Scholar] [CrossRef]
  35. Richelli, A.; Colalongo, L.; Tonoli, S.; Kovacs-Vajna, Z.M. A 0.2–1.2V DC/DC boost converter for power harvesting applications. IEEE Trans. Power Electron. 2009, 24, 1541–1546. [Google Scholar] [CrossRef]
  36. Carlson, E.; Strunz, K.; Otis, B. 20 mV input boost converter for thermoelectric energy harvesting. In Proceedings of the 2009 Symposium on VLSI Circuits, Kyoto, Japan, 16–18 June 2009; pp. 162–163. [Google Scholar]
  37. Yu, H.; Wu, H.; Wen, Y.; Ping, L. An ultra-low input voltage DC-DC boost converter for micro-energy harvesting system. In Proceedings of the 2nd International Conference on Information Science and Engineering, Hangzhou, China, 4–6 December 2010; pp. 86–89. [Google Scholar]
  38. Gruber, J.M.; Mathis, S. P3.6-Efficient Boost Converter for Thermoelectric Energy Harvesting. Proc. Sens. 2017, 2017, 642–645. [Google Scholar]
  39. Dillersberger, H.; Deutschmann, B.; Tham, D. A bipolar ± 13 mV self-starting and 85% peak efficiency DC/DC converter for thermoelectric energy harvesting. Energies 2020, 13, 5501. [Google Scholar] [CrossRef]
  40. Ultralow Voltage Step-Up Converter and Power Manager LTC3108. Available online: http://www.linear.com/LTC3108 (accessed on 21 December 2021).
  41. Artyukhov, D.; Burmistrov, I.; Artyukhov, I. Electric Power Supply of Wireless Sensors by Thermo-Electrochemical Cells. In Proceedings of the 2019 16th Conference on Electrical Machines, Drives and Power Systems (ELMA), Varna, Bulgaria, 6–8 June 2019; pp. 1–5. [Google Scholar]
  42. Coupled Inductors LPR6235. Available online: http://www.coilcraft.com (accessed on 21 December 2021).
  43. Lokere, K. Wireless Precision Temperature Sensor Powers Itself, Forms Own Network, Enabling Easy Deployment in Industrial Environments. LT J. Analog. Innov. 2014, 24, 26–31. [Google Scholar]
  44. Wang, W.; Cionca, V.; Wang, N.; Hayes, M.; O’flynn, B.; O’mathuna, C. Thermoelectric energy harvesting for building energy management wireless sensor networks. Int. J. Distrib. Sens. Netw. 2013, 9, 232438. [Google Scholar] [CrossRef]
Figure 1. Schematic of a Ranque–Hilsch vortex tube.
Energies 15 01256 g001
Figure 2. (a) NexFlow 50002H vortex tube; thermogram of the vortex tube; (b) inlet gas pressure is 1 bar; (c) inlet gas pressure is 2 bar; (d) inlet gas pressure is 3 bar.
Energies 15 01256 g002
Figure 3. Schematic of a thermoelectrochemical cell with a [Fe(CN)6]3−/[Fe(CN)6]4− redox couple.
Energies 15 01256 g003
Figure 4. (a) Voltage output and the corresponding power output of TEC [31]; (b) electrical model of TEC.
Energies 15 01256 g004
Figure 5. (a) Elements of the system for converting the energy of the gas flow into electrical energy; (b) system for converting the energy of the gas flow into electrical energy: 1—Ranque–Hilsch vortex tube; 2—connecting pipes; 3—plate of heat-conducting material with coil; 4—thermal pad; 5—thermoelectric converter.
Energies 15 01256 g005
Figure 6. Dependence of copper plate temperatures on the pressure at the inlet of the vortex tube.
Energies 15 01256 g006
Figure 7. Dependence of the thermoelectrochemical cell EMF on the pressure at the vortex tube inlet, calculated on the basis of literature data: 1 – [29], 2 – [31], 3 – [32], 4 – [33], 5 – [34].
Energies 15 01256 g007
Figure 8. Simplified scheme of the first stage of the DC/DC step-up converter.
Energies 15 01256 g008
Figure 9. Voltages oscillograms: (a) Input voltage is 32 mV; (b) Input voltage is 42 mV.
Energies 15 01256 g009
Figure 10. Block diagram of the WSN power supply system.
Energies 15 01256 g010
Figure 11. Load graph of the WSN power supply system.
Energies 15 01256 g011
Figure 12. Simulation model of the WSN power supply system.
Energies 15 01256 g012
Figure 13. Virtual oscillograms of the WSN current.
Energies 15 01256 g013
Figure 14. Virtual oscillograms of boost converter output current. Inlet pressures of the vortex tube: 5 bar (1), 6 bar (2), and 7 bar (3).
Energies 15 01256 g014
Figure 15. Virtual oscillograms of supercapacitor voltage. Inlet pressures of the vortex tube: 5 bar (1), 6 bar (2), and 7 bar (3).
Energies 15 01256 g015
Figure 16. Virtual oscillograms of supercapacitor voltage. WSN activation periods: 60 s (1), 90 s (2), and 120 s (3).
Energies 15 01256 g016
Table 1. The efficiency of gas flow energy conversion into electrical energy.
Specific PowerHypothetical Output Power, mWη, %Ref.
1.1 mW K−2 m−24.42.4×10−3[29]
0.64 mW K−2 m−22.561.4×10−3[32]
234 mW/m2 (ΔT = 20 K)2.341.26×10−3[33]
26 mW/m2 (ΔT = 20 K)0.261.4×10−4[34]
21 mW/m2 (ΔT = 20 K)0.211.1×10−4[31]
Publisher’s Note: MDPI stays neutral with regard to jurisdictional claims in published maps and institutional affiliations.

