Article

System Performance and Pollutant Emissions of Micro Gas Turbine Combined Cycle in Variable Fuel Type Cases

College of Energy and Power Engineering, North China University of Water Resources and Electric Power, 36 North Ring Road, Jinshui District, Zhengzhou 450011, China
*
Author to whom correspondence should be addressed.
Energies 2022, 15(23), 9113; https://doi.org/10.3390/en15239113
Submission received: 28 October 2022 / Revised: 13 November 2022 / Accepted: 28 November 2022 / Published: 1 December 2022

Abstract

:
This study focuses on an investigation of the operating performance and pollutant emission characteristics of a micro gas turbine combined cycle using biomass gas, replacing natural gas. The models of both recuperative cycle micro gas turbines with a waste heat utilization system and a micro gas-steam turbine combined cycle system are established. When the gas turbine works at 100 kW and the same types of fuel are burnt, the recuperative cycle system consumes less fuel than the gas-steam combined cycle system. The electric efficiency of the recuperative cycle system can reach more than 29%, which is higher than 24% of the gas-steam combined system. The combined cycle thermal efficiency of the recuperative system is as high as 66%, with 36% waste heat utilization efficiency. The electrical efficiency of the recuperative cycle system in the biomass gas case decreases, while that of the gas-steam combined cycle system undergoes little change. When the gas turbine power output increases from 50 kW to 100 kW, the electrical efficiency and combined cycle thermal efficiency increases, but the thermal efficiency of waste heat utilization of recuperative cycle decreases, the NOX and SO2 emissions gradually rise. Under the same working conditions, the NOX emissions of the recuperative cycle system are greater than that of the steam-gas combined cycle system.

1. Introduction

A micro gas turbine is a kind of power device with a single power range of 25–300 kW. Its basic characteristics are good fuel flexibility, low emissions, high power density and low maintenance costs, etc. It is often used in small distributed power generation and co-generation systems, and is one of the most promising energy technologies of the 21st Century [1]. The fuel of micro gas turbines is usually natural gas. Due to the low sulfur content in natural gas, SO2 has a very small concentration in flue gas, and the pollutants are mainly NOX [2].
The micro gas turbine system can be divided into a simple cycle system, a recuperative cycle system, a reheat cycle system, an intermediate cooling cycle system, and a combined cycle system according to different thermal cycles.
The combined cycle system includes a gas-steam combined cycle system, a combined heat and power generation system, etc. A micro gas turbine combined power generation system has many advantages in terms of energy efficiency, environmental friendliness, and economic performance.
Rocha et al. [3] conducted full load and part load performance tests on the triplet power generation pilot plant based on a micro-turbine, and the experimental results showed that the power generation efficiency of the triplet power generation system with natural gas as fuel was 22.6%, and the energy utilization coefficient of the system reached 56.3%. Rosato et al. [4] evaluated the dynamic performance of the natural gas micro turbine co-generation system, and the results showed that, compared with a traditional system consisting of a natural gas boiler (which produces heat) and a central State grid (which produces electricity), the micro gas turbine co-generation system had a 13.4% reduction in primary energy consumption and an 18.9% reduction in CO2 equivalent emissions. Co-generation systems have a cost advantage of up to 20.9% over conventional systems in terms of gas consumption. Pehnt [5] evaluated the impact of micro co-generation distributed energy systems on the environment. The results showed that the micro gas turbine co-generation system had an advantage over the gas-fired power plants in terms of greenhouse gas emissions.
Biomass gasses (including biogas, straw gas, pine gas, etc.) are mainly made from crop straw, forestry waste, edible fungus residue, livestock feces, sewage sludge, and other substances containing biological bodies as raw materials via pyrolysis or gasification decomposition at high temperatures. At present, many experts have conducted in-depth research on biomass utilization. Tamer et al. [6] verified the development model based on experimental data, where peach pits were used as biomass in gasifiers; the data obtained were critical for the potential use of these biomass energy sources. Grace et al. [7] evaluated the value pathway through the pyrolysis and gasification of Brazilian stone fruit seeds in a study of syngas performance. The gas quality of the generator was improved. Rafael et al. [8] used waste materials such as corn cob and rice husk as raw materials to study the influence of mixing ratios on the low calorific value of syngas. The results provided a reference for the better utilization of biomass gas. Oisín et al. [9] studied and analyzed the application of biological waste resources in a small gasification plant to the cogeneration system using thermodynamic models, and confirmed the potential application of biological waste to power generation and heating from the grid.
Although biomass energy has the advantages of wide distribution, large reserves, and easy access, its energy distribution is characterized by decentralized distribution, limited by collection and transportation costs, a small economic collection radius, and low economic efficiency of large-scale centralized biomass energy utilization models [10]. The application of biomass energy in micro gas turbine distributed generation has become one of the main bio-energy utilization schemes. On the other hand, biomass is a renewable energy and, as a substitute for fossil fuels, can reduce environmental pollution caused by fossil fuel combustion. Therefore, the use of bio-fuels in gas turbines has attracted the attention of many researchers [11].
The application of biomass gas to the micro gas turbine system is feasible in theory. Wang [12] showed that when fuel with low heating value was used, according to the Friuli Greig formula, the compressor was kept running at the operating condition point and the turbine flow rate was increased by reducing turbine inlet temperature to ensure the safe operation of the gas turbine. This can not only effectively improve the utilization efficiency of biomass, but also provide more choices for the micro gas turbine fired by natural gas. Sara et al. [13] studied the environmental impact of using bio-methane from organic waste generated by residential buildings to provide energy for a group of residential buildings in the distributed generation mode, which provided references and suggestions for the development of micro-gas turbines still under development. Nikpey et al. [14] conducted experimental research on the operating performance of a 100 kW micro gas turbine under full and partial loads with different proportions of natural gas and biogas mixture as fuel. The results showed that, compared to natural gas, the operating parameters, such as electrical efficiency, pressure ratio, and compressor outlet temperature, underwent no obvious change. A large number of studies have proved the feasibility of the application of biomass gas in micro gas turbine combined power generation systems, and have constantly promoted research progress.
The use of simulation software for biomass gas used in the processes of power generation systems by gas microturbines is a feasible and efficient method. System models of biomass gasification and integrated micro gas turbine power generation have been established, and simulations have been carried out, acquiring the main performance index of gas turbine systems [15,16]. When a gas turbine uses biomass gas fuel with different heating values, the change in fuel composition will affect its safe operation, so it is very important to analyze the operation performance of a gas turbine burning different biomass gasses. Cáceres et al. [17] established a dynamic model of a biogas micro gas turbine system for distributed power generation, and the results showed that biogas can be used as fuel in natural gas micro turbines, and the average electric efficiency can reach 33%. Somehsaraei et al. [18] analyzed the influences of biogas on engine performance under different working conditions by changing the power demand. Compared with natural gas fuel, the mass flow rate, pressure ratio, and electric efficiency of gas turbines were reduced, and electric efficiency was further reduced when the methane fraction in biogas decreased. In the grid-connected operation of the unit, the operation output is adjusted according to the demand of the power grid. Therefore, research on the partial load operation characteristics of the gas turbine is of great significance to the optimization of the combined cycle system of the gas turbine. Kim [19] explored the variation rule of operation performance of the recuperative cycle gas turbine under partial load. The results showed that the inlet and outlet temperatures of the turbine and the power generation efficiency of the gas turbine decreased with the decrease in power output. Caresana et al. [20] reported the experimental results of the co-generation of a 100 kW gas turbine and the operation results of partial power and heat loads. Tests showed that thermal priority operation is the most efficient mode, while co-generation with power priority is the least efficient mode. The maximum thermal power recovered is about 160 kW, and the thermal efficiency and total efficiency are about 44% and 74%, respectively. Thu et al. [21] analyzed a mini gas turbine co-generation system with a power of 65 kW and a waste heat recovery system of 112 kW, and conducted experiments on various power demands during part load and full load operations. The results presented strongly suggested that micro gas turbines should operate at full power output.
The study of pollution discharge is helpful to the development of environmental protection. The pollutants of micro gas turbines mainly come from the combustion reaction between fuel and O2 in the combustion chamber, and are mainly affected by fuel composition, combustion chamber temperature, excess air coefficient and other parameters. Chiariello et al. [22] studied pollutant emission characteristics of micro gas turbines burning pure vegetable oil and fossil fuel mixtures. The experimental results of five kinds of fuel fired under two different operating conditions show that there is no significant difference in CO and NOx emissions from micro turbines. Rabou et al. [23] found that the emissions of CO, un-burned hydrocarbons and NO are very low when power output exceeds 70%. Zhao et al. [24] proposed measures such as appropriately increasing the excess air coefficient to reduce NOX emission concentration at the combustion chamber outlet without affecting combustion efficiency.
At present, in terms of the micro gas turbine and its combined power generation, research has mainly focused on the use of natural gas, biogas, and a mixture of natural gas and biogas, while there have been few studies on the use of biomass gas as a fuel for the micro gas turbine. In addition, a comparative analysis of the operational performance and pollutant emission laws of natural gas, biogas, and biomass gas in different micro gas turbine combined cycle systems under partial load conditions also requires further research and discussion.
Based on a T100 micro gas turbine, the recuperative cycle micro gas turbine power generation model and gas-steam combined power generation model have been established. Natural gas was used as fuel to verify the reliability of the model. The performance differences of both combined cycle systems with different fuel gasses were analyzed, and the operational performance and pollutant emissions under partial load conditions were studied.

2. The System and Modeling

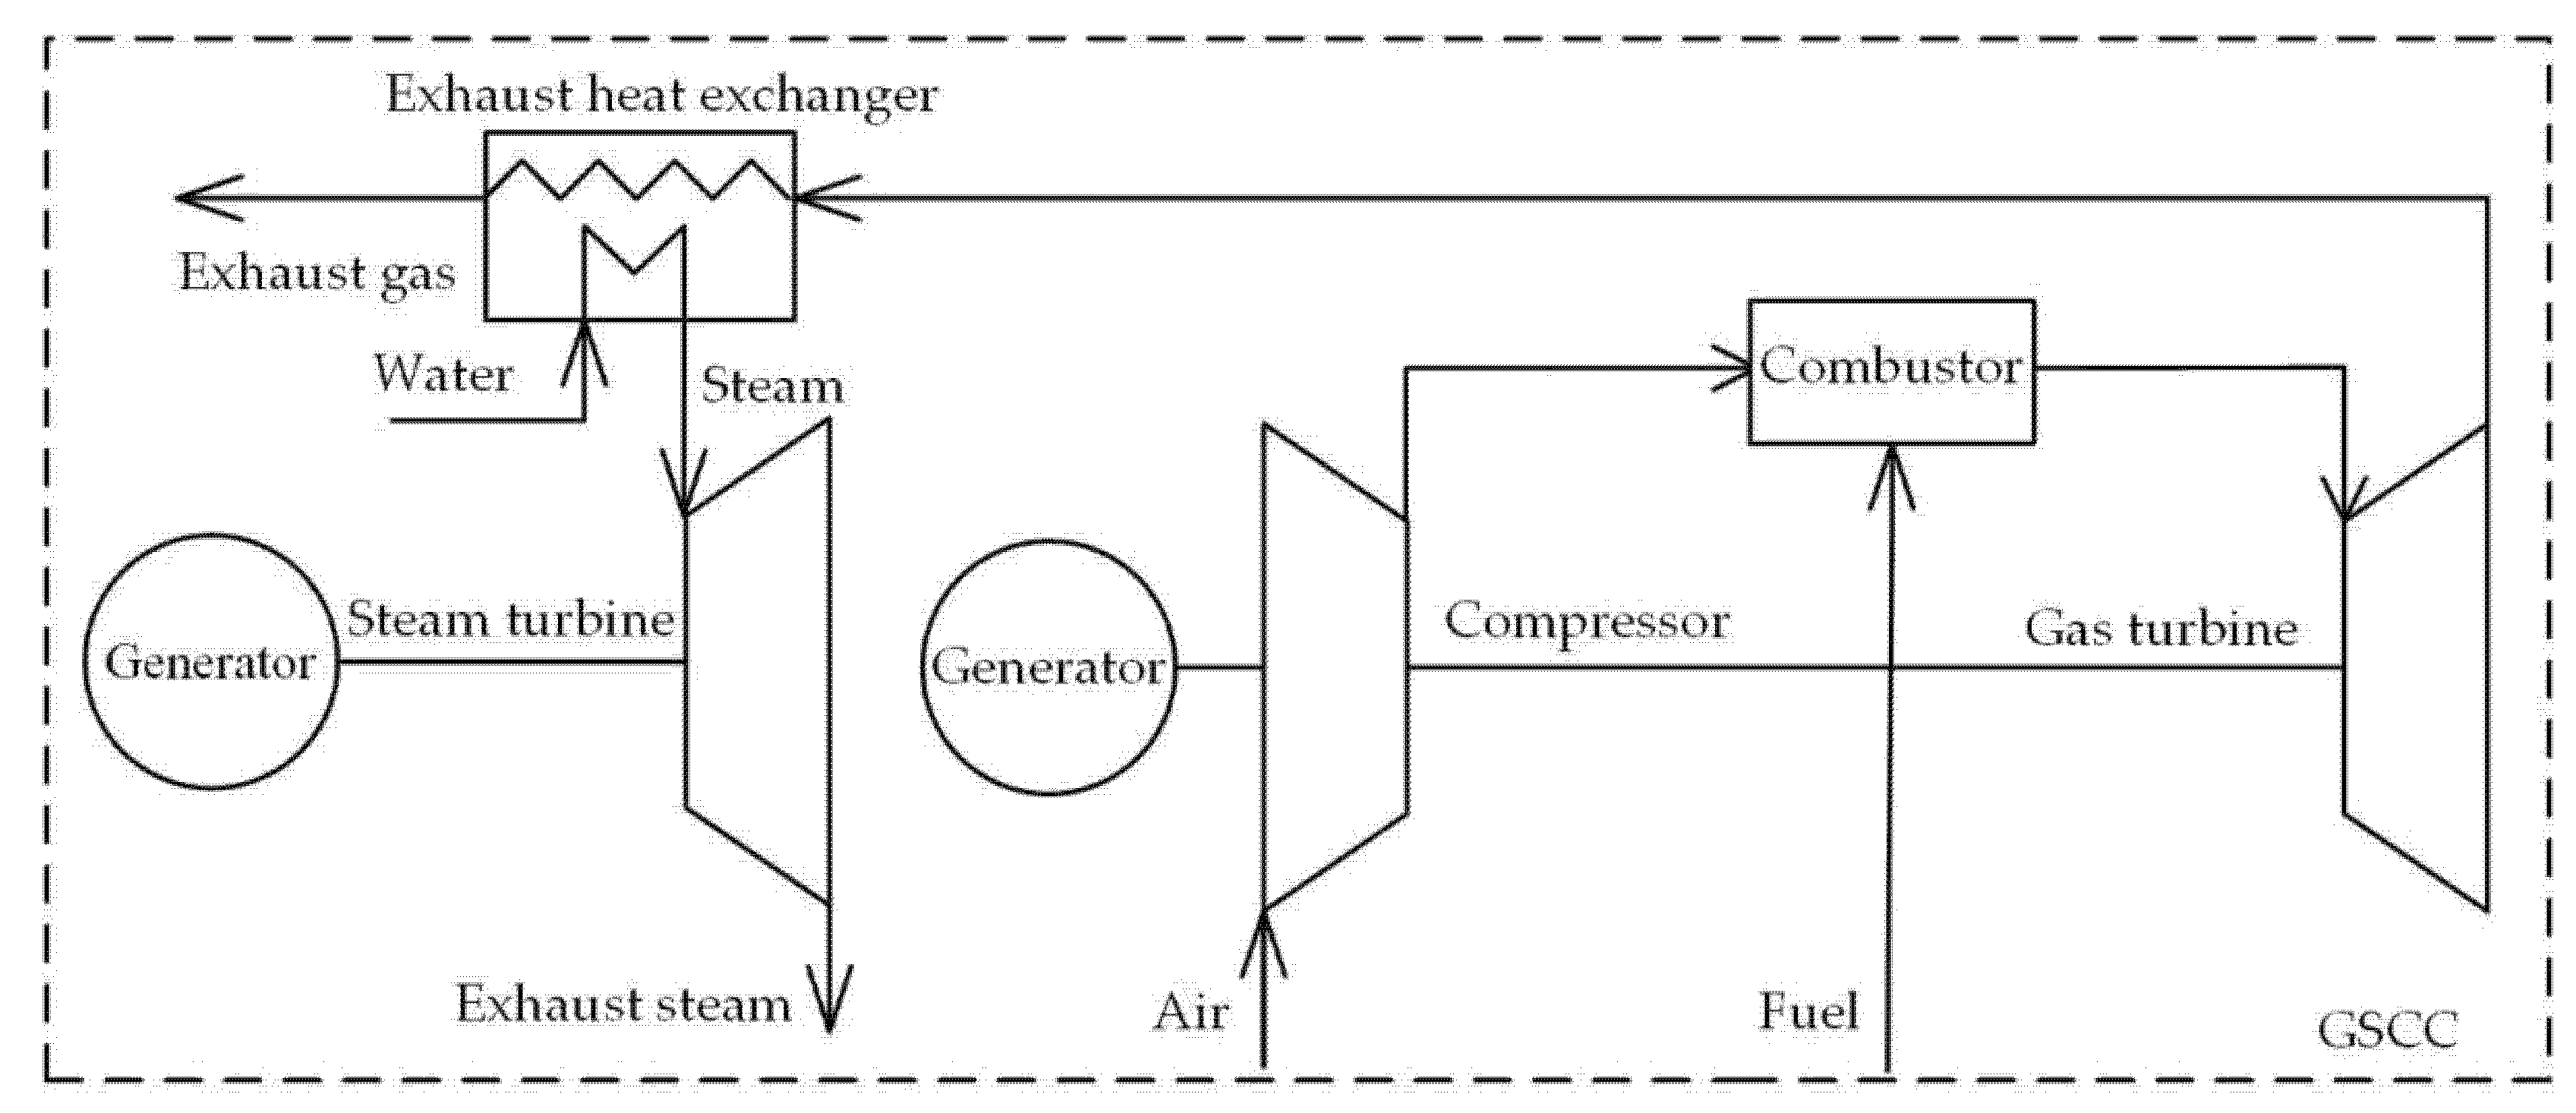
2.1. The Combined Cycle Systems

The micro gas turbine system model is established based on Aspen software. In this paper, the aspen software modules required for system simulation are introduced as shown in Table 1.
The biomass gas micro-turbine combined power generation system studied in this paper mainly includes: a recuperative cycle micro gas turbine with waste heat utilization system and a micro gas-steam turbine combined power generation system. The flow charts of both systems are shown in Figure 1 and Figure 2.
It can be seen from Figure 1 that the recuperative cycle micro gas turbine system is mainly composed of the micro gas turbine, a recuperator, an exhaust heat exchanger, and other components. Its operating process is as follows: the air is compressed by the compressor (Compr) and then enters the recuperator (Heater) as the temperature rises. Both the air and fuel enter the combustor (RGibbs), and react to generate high-temperature and high-pressure gas, which enters the turbine (Compr) to generate. The gas from the turbine (Compr) outlet enters the recuperator (Heater) for heating air from the compressor (Compr), and then the discharged flue gas enters the exhaust heat exchanger (MHeatX) for further heating of the water supply, where the water absorbs the exhaust gas’s heat and becomes hot water.
The parameter setting of the exhaust heat exchanger (MHeatX): due to the high temperature of the flue gas at the outlet of the recuperator (Heater), the temperature range is 200 °C~300 °C, which can be used to recover this part of the heat. The outlet hot water temperature of the feed water exhaust heat exchanger (MHeatX) is set at 70 °C [25], the feed water pressure at 0.6 Mpa, and the smoke exhaust temperature at 100 °C by changing the feed water flow.
It can be seen from Figure 2 that the micro gas-steam combined cycle system is mainly composed of a micro gas turbine, an exhaust heat exchanger, a steam turbine, and other components. An exhaust heat exchanger (MHeatX) directly generates steam at a certain temperature and pressure by using the heat in the flue gas, and the steam flows into a turbine (Compr), thus driving a generator to generate electricity.
The outlet steam parameters in the exhaust heat exchanger (MHeatX) need to match the settings of the steam turbine (Compr) design parameters. When the operating condition of the gas turbine (Compr) changes, the mass flow rate of the superheated steam generated and the output power will be affected. The steam turbine (Compr) used is the micro steam turbine of N0.07–1.27 and N0.05–1.27, for which the output power is between 30–50 kW. The feed water pressure is set to 1.27 MPa, and the feed water temperature is set at 15 °C. The mass flow rate of water can be changed to maintain the temperature of steam working at 300 °C. In order to consider the safety of variable working conditions, the end difference of the exhaust heat exchanger should be ensured to be no less than 40 °C, and the minimum exhaust temperature should be no less than 90 °C [26], therefore, the exhaust temperature of the exhaust heat exchanger should be set at 100 °C.
The main parameter settings of the recuperative gas turbine combined cycle system are shown in Table 2(a), most input parameter settings of the micro gas-steam combined cycle are the same as the recuperative gas turbine combined cycle system, but there are still some differences, which are shown in Table 2(b).

2.2. System Performance Index

According to the energy flow chart, and considering the energy input and loss of each part, the following calculation formula is listed.
When the sensible heat of fuel is ignored, the heat brought into the system by fuel (Qr) is the product of mass flow rate (Gr) and the lower heating value of fuel (LHVgas), and it can be calculated as follows:
Q r = G r × L H V gas
Gas turbine power generation (Pg) is the difference between gas turbine output power (Pgt) and compressor loss power (Pgc), and its calculation formula is as follows:
P g = P gt P gc
Gas turbine power generation efficiency (η1) is the ratio of a gas turbine power generation (Pg) to fuel energy entering the gas turbine system (Qr), and the gas turbine power generation efficiency is defined as follows:
η 1 = P g Q r × 100 %
The flue gas at the outlet of the recuperator still has a certain temperature, which can be used to heat cold water and supply hot water. The heat (Qw) is the product of the mass flow rate of water supply (Gw) and the enthalpy difference between hot water (hout) and cold water (hin), which is expressed as follows:
Q w = G w × ( h out h in )
The thermal efficiency of waste heat utilization (η2) is the ratio of the heat recovered from waste heat (Qw) and the energy of fuel entering the gas turbine system (Qr), and the thermal efficiency of waste heat utilization is represented as follows:
η 2 = Q w Q r × 100 %
The combined efficiency of recuperative cycle (η3) is the ratio of the sum of gas turbine power generation (Pg) and heat recovery and utilization (Qw) of the energy of fuel entering the gas turbine system (Qr), and it can be formulated as:
η 3 = P g + Q w Q r × 100 %
The combined efficiency of the gas-steam combined cycle (η4) is the ratio of the sum of the output power of the gas turbine (Pg) and the output power of the steam turbine (Ps) to the energy of the fuel entering the gas turbine system (Qr), and the formulas are as follows:
η 4 = P g + P s Q r × 100 %

2.3. Pollutant Generation Calculation

Gas turbine flue gas pollutant emission characteristics, mainly associated with the combustion process and fuel characteristics, and major influencing factors include fuel and air mass flow rate, the gas turbine load, temperature, and the combustion product in the retention period of the high temperature combustion chamber.
The combustion process in the gas turbine is a process of oxygen enrichment, and exhaust pollutants mainly include NOx, SO2, etc.
NOX emitted by gas turbines mainly belongs to thermal NOX, which is mainly affected by the temperature of the combustion chamber. The SO2 emission of the gas turbine is mainly determined by the total sulfur in fuel.
The concentration of NO (ρNO) can be calculated by (in this paper, the concentration of NOX in dry flue gas when the oxygen content is 15% of the standard state):
ρ NO = φ NO × 21 15 21 φ O 2 × 10 6
The concentration of NO2 ( ρ NO 2 ) can be defined as follows:
ρ NO 2 = φ NO 2 × 21 15 21 φ O 2 × 10 6
The concentration of SO2 ( ρ SO 2 ) can be calculated by (the concentration of SO2 should not be corrected to 15% O2, that is, the measured concentration is adopted instead of being converted according to oxygen [27]):
ρ SO 2 = φ SO 2 × 10 6

2.4. Fuel Analysis

In this paper, the fuel gasses are selected as natural gas [28], biogas [29], pine gas [30], and straw gas [31], in which pine gas and straw gas are from biomass gasification under the condition of the optimal air-fuel ratio. The main fuel gas composition analysis is shown in Table 3.

2.5. Assumptions and Study Cases

In the simulation process, the following assumptions have been considered:
  • The ambient temperature was set at 15 °C and the atmospheric pressure was set to 101.325 kPa. The compressor operated at its working point with the steady air mass flow rate and the unchanged compressor pressure ratio.
  • The power output of MGT changed with the fuel mass flow rate, accordingly, the other important parameters had their values at different power load cases.
  • The types of fuel studied included natural gas, biogas, straw gas, and pine gas, which have different heating values. The power output should be kept as 100 kW, 90 kW, 70 kW, and 50 kW. The operation performance and combustion emissions of both gas turbine combined cycle systems at different cases will be studied in the following sections.

3. Results and Analysis

3.1. Validating the Model

To validate the reliability of the recuperative cycle micro gas turbine model, using natural gas as fuel, the simulation results were compared with T100 design parameters. The results indicate that the recuperative cycle micro gas turbine model can calculate the operating performance parameters with high accuracy, and the error of most samples is substantially less than 1%. The comparison results are shown in Table 4.

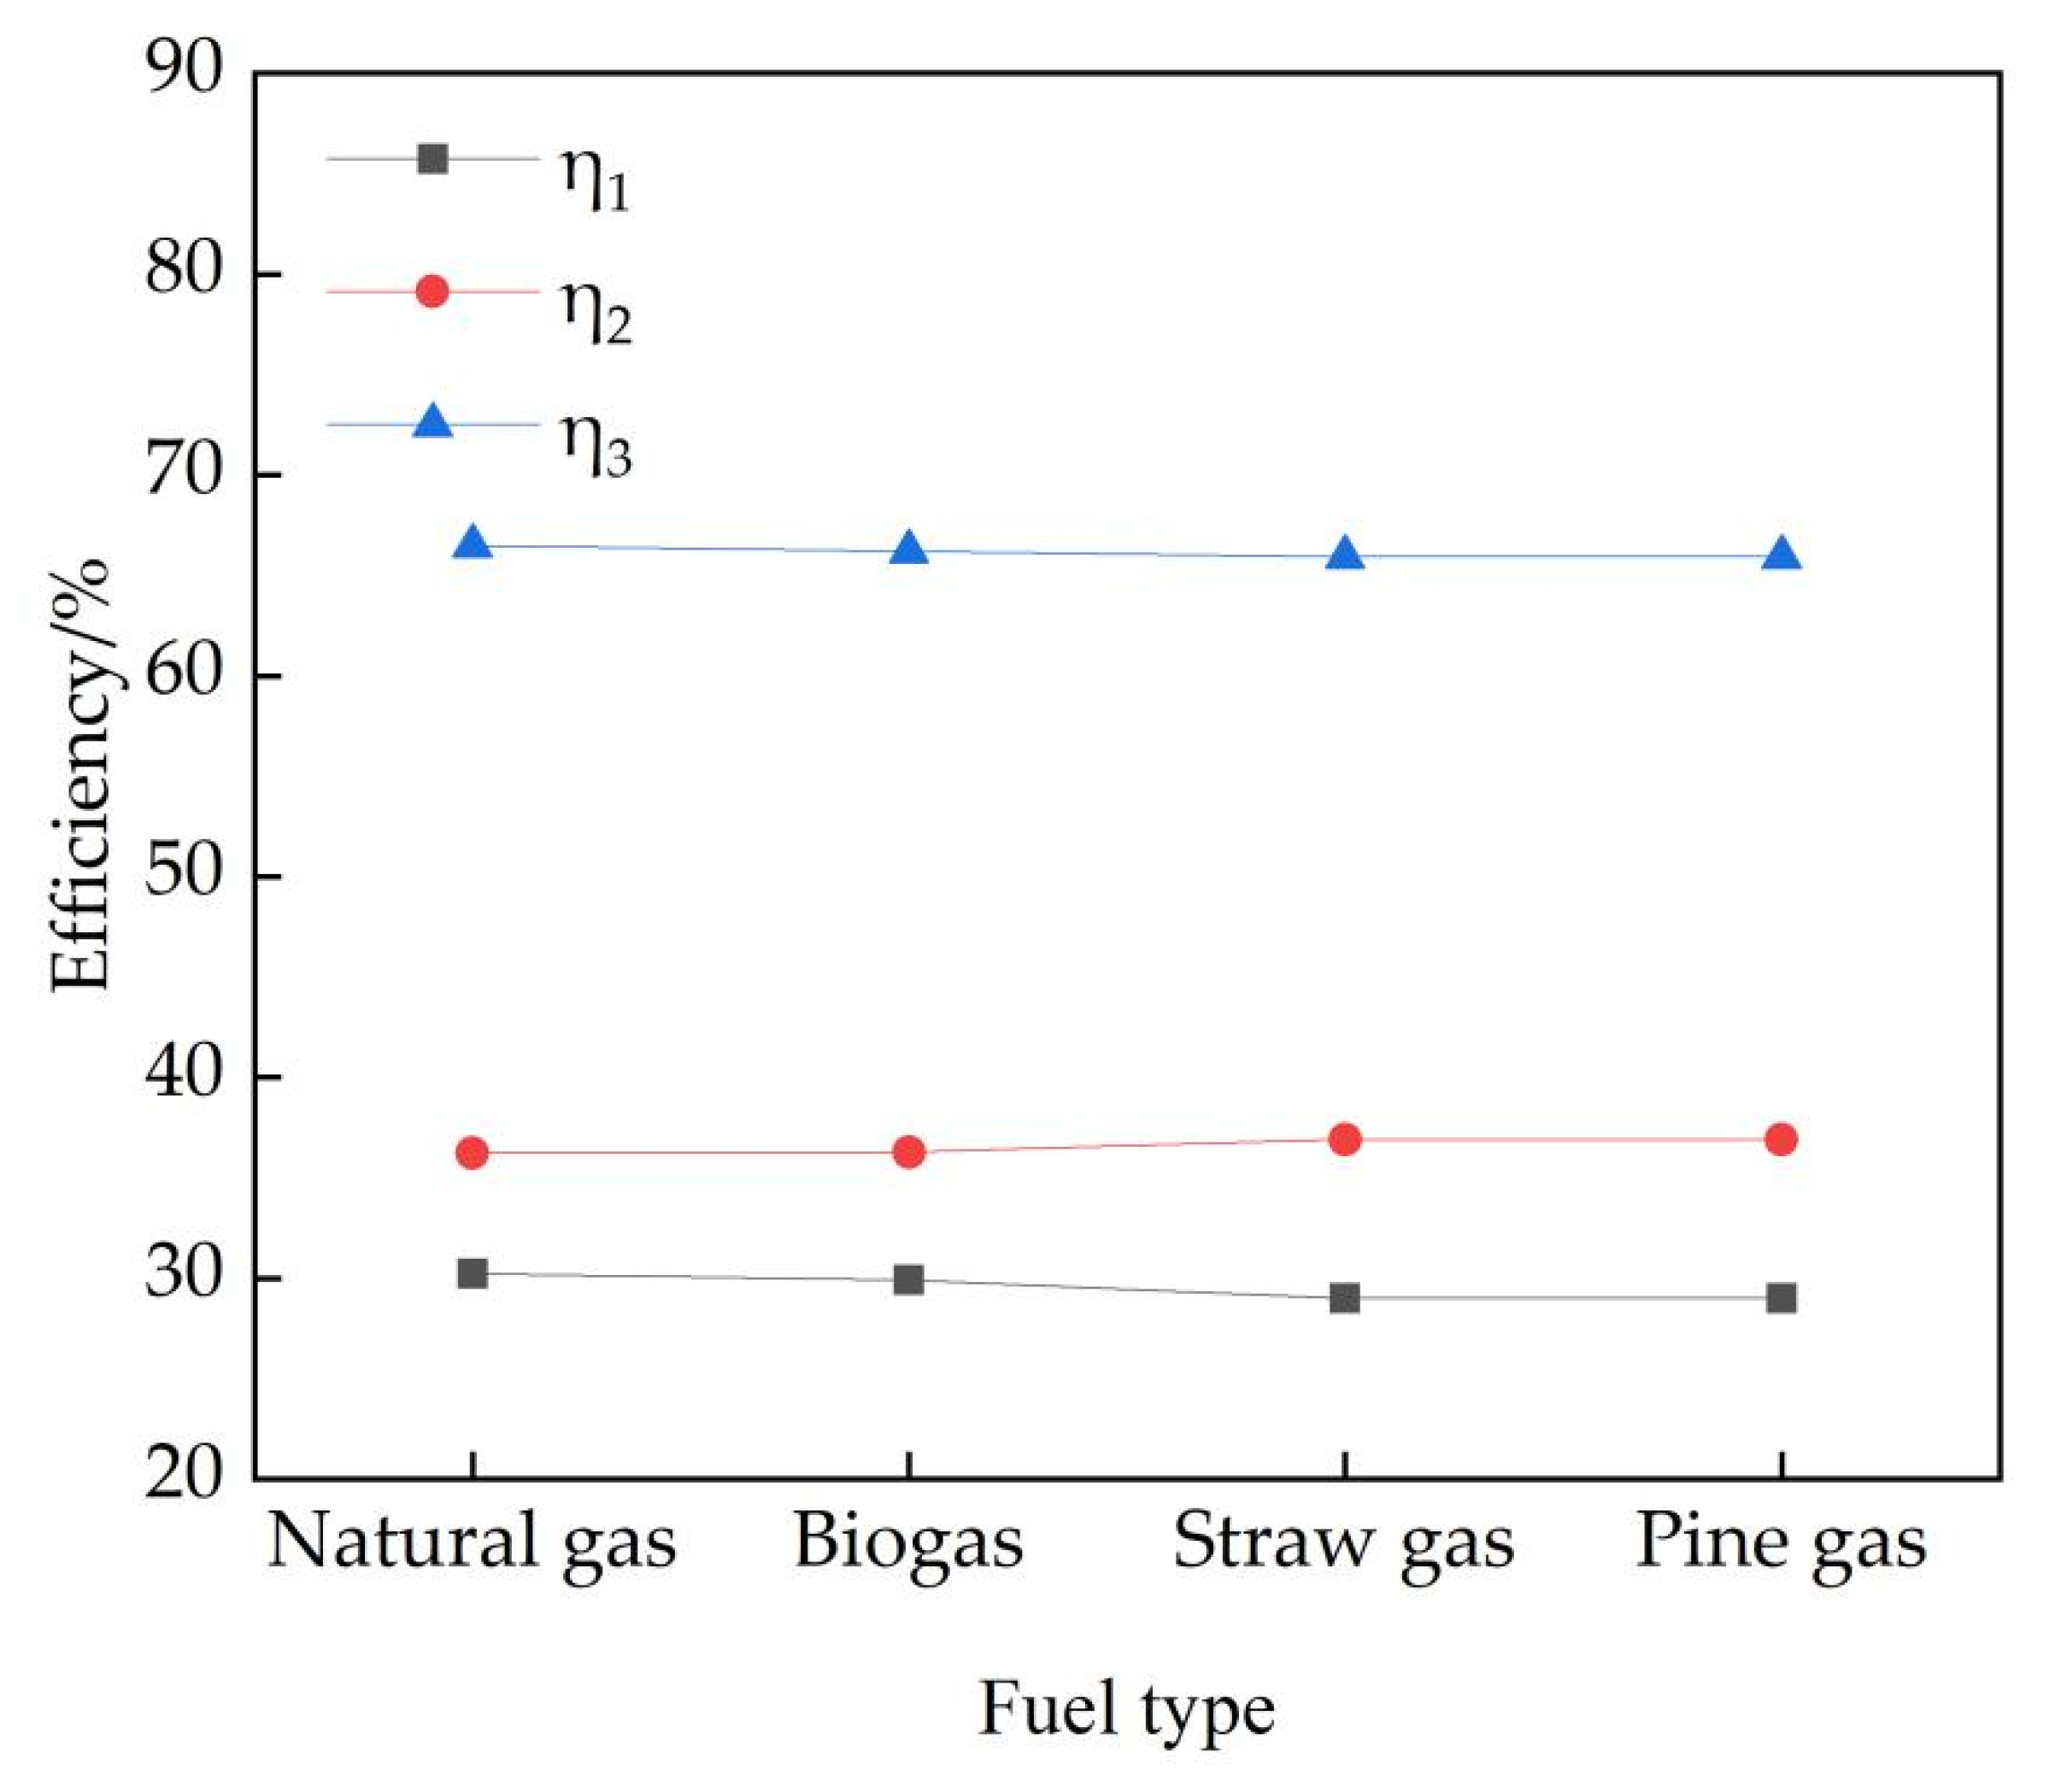
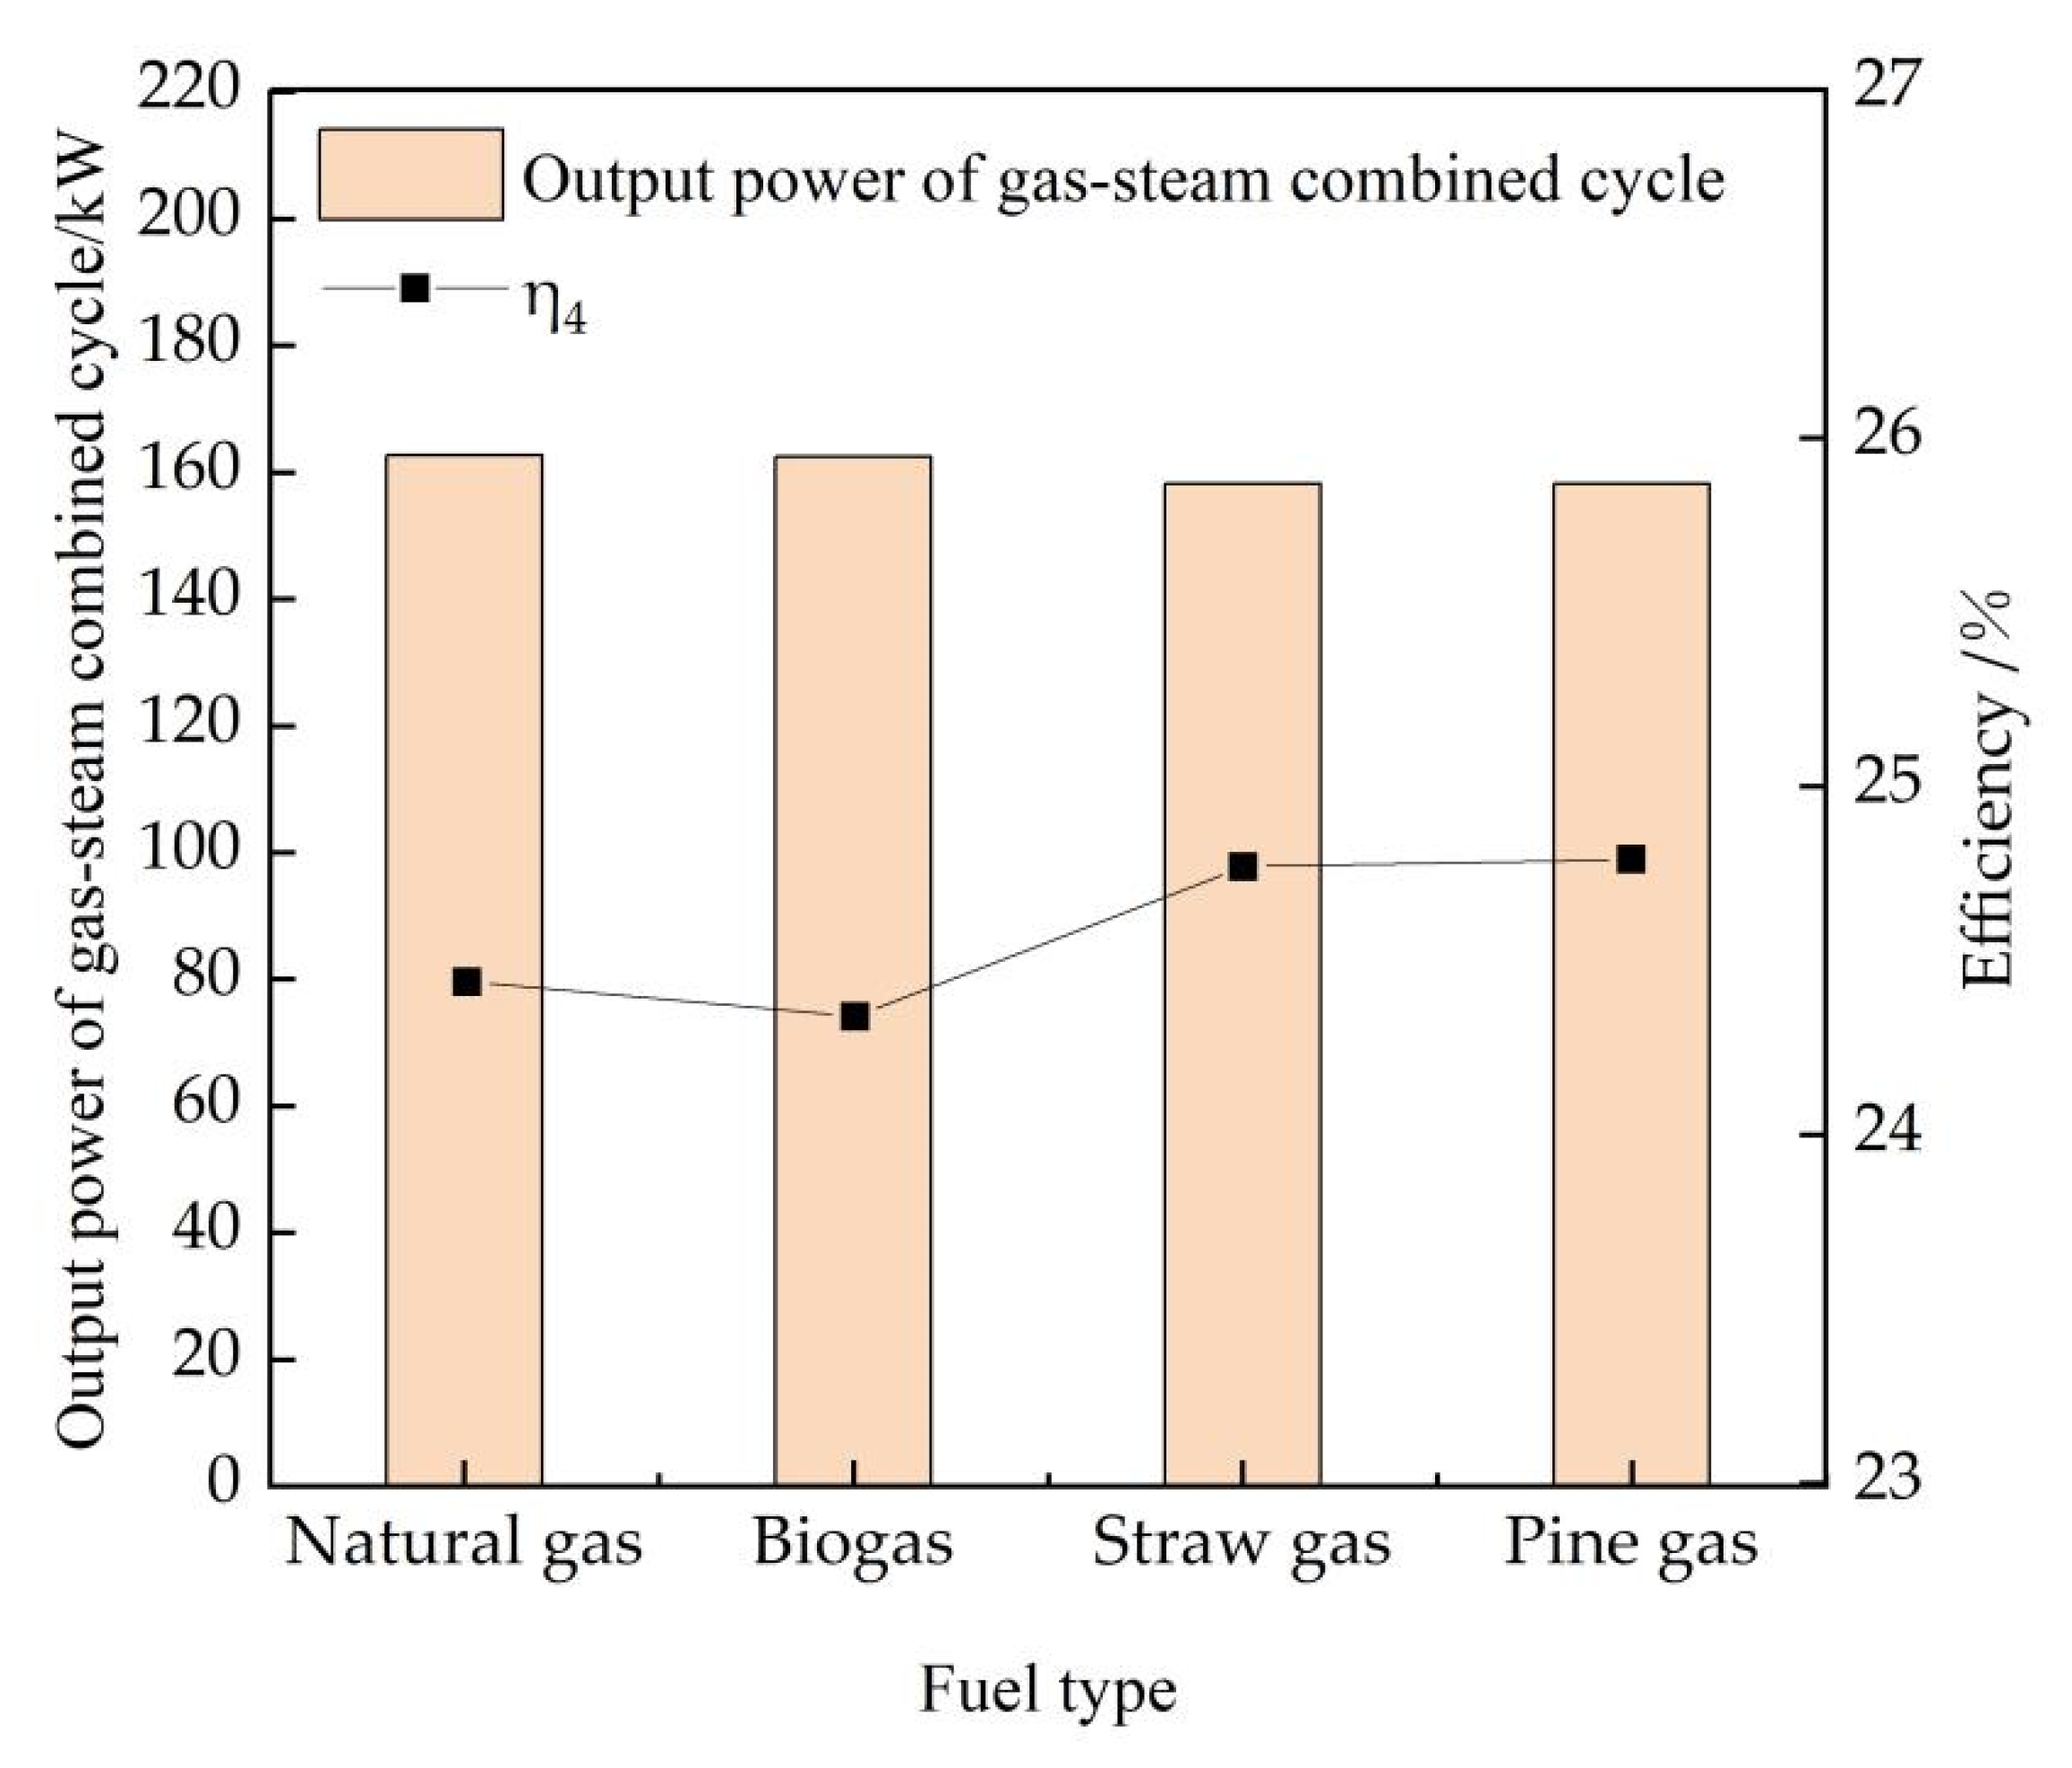
3.2. Influence of Biomass Gas Types on Combined Cycle Performance

Based on the system models built, four types of fuel are used to study the combined cycle performance. When the gas turbine power output reaches 100 kW, the operating parameters and performance are observed as presented in Table 5 and Figure 3 and Figure 4.
It can be seen from Table 5, for the same types of fuel, when the power output is at 100 kW, the fuel consumption of the recuperative cycle system is far less than that of the gas-steam combined cycle system. However, there is little difference in the gas flow rate between both systems. Both fuel flow rate and gas flow rate increase with the decline in lower heating value. In the recuperative cycle system, the fuel flow of the natural gas system and gas flow are 0.0074 kg/s and 0.7908 kg/s, respectively. The fuel flow of the biomass gas system expanded by 1.42 times, 7.23 times, and 7.04 times, respectively, while the gas flow rate rose only 1.33%, 6.75%, and 6.59%. In the gas-steam combined cycle system, the fuel flow rate and gas flow rate of the natural gas system are 0.0148 kg/s and 0.7982 kg/s, respectively. The fuel flow rate of biomass gas systems increases 1.41 times, 6.61 times, and 7.44 times, respectively, while the gas flow rate rose only 2.62%, 12.27%, and 11.94%.
When the same fuel is used and the gas turbine output power is the same, the combustor outlet temperature and turbine outlet temperature of the recuperative cycle system are higher than those of the gas-steam combined cycle system.
In the recuperative cycle system, the combustor outlet temperature and turbine outlet temperature of the natural gas system are the highest, at 1233.7 K and 949.84 K, respectively, while both the combustor outlet temperature and turbine outlet temperature of the biomass gas system gradually decrease, and the combustor outlet temperature reduces by 11.10 K, 64.40 K, and 64.60 K, respectively. The turbine outlet temperature drops 7.61 K, 49.90 K, and 50.20 K, respectively. In the gas-steam combined cycle system, the combustor outlet temperature and turbine outlet temperature of the natural gas system are the highest, at 1183.8 K and 906.54 K, respectively, while the combustor outlet temperature and turbine outlet temperature of the biomass gas system gradually decrease, and the combustion chamber outlet temperature reduces by 20.80 K, 104.90 K, and 105.1 K, respectively. The turbine outlet temperature becomes less than 14.33 K, 81.82 K, and 82.21 K respectively.
A recuperator is added to the recuperative cycle system, which can recover and utilize the flue gas heat of the turbine to raise the air temperature, so as to facilitate the combustion reaction in the combustor, resulting in a higher combustor temperature and smaller fuel flow.
When biomass fuel replaces natural gas fuel, biomass gas contains more inert gases, which is not conducive to the combustion reaction, while natural gas has a higher heating value, so the combustion reaction degree in the combustor is higher than that of biomass gas, so the required natural gas flow rate is also lower than that of biomass gas.
Figure 3 is the efficiency of the recuperative cycle with different types of fuel. The power generation efficiency (η1) gradually declines with the decrease of heating value of the fuel. The efficiency (η1) in natural gas case can reach 30.23%, while the efficiency (η1) of biomass gas cases is reduced by 0.32%, 1.22%, and 1.22%, respectively. The thermal efficiency of waste heat utilization (η2) shows a trend of rising first and then decreasing. The thermal efficiency of gas turbine waste heat utilization (η2) for the natural gas is 36.24%, and those of biomass gas systems increases by 0.05%, 0.67%, and 0.66%, respectively. The thermal efficiency of the combined cycle system (η3) shows a decreasing trend. The combined cycle thermal efficiency (η3) for the natural gas case is 66.48%, and those of the biomass gas cases are reduced by 0.12%, 0.56%, and 0.57%, respectively.
Figure 4 is the power output and electrical efficiency of the gas-steam combined cycle system (η4) with different types of fuel.
The power output of the gas-steam turbine system consists of a gas turbine output of 100 kW and a steam turbine output (ranging from 30 kW to 70 kW). When different fuels are used, the power generation efficiency of the gas-steam turbine system is mainly determined by the ratio of the sum of the 100 kW gas turbine and steam turbine output power to the total input energy of the system.
The electrical efficiency (η4) decreases first and then increases. The electrical efficiency (η4) for the natural gas case is 24.40%, and that of the biomass gas cases is improved by −0.10%, 0.37%, and 0.39%, respectively. The power output of the natural gas system is 162.64 kW, and those of the biomass gas systems are reduced by 0.21 kW, 4.41 kW, and 4.50 kW, respectively.
When the same fuel is used, the power generation efficiencies of the recuperative cycle gas turbine (η1) are higher than that of steam-gas combined cycle system (η4), which are only 24.44%, 24.34%, 24.77%, and 24.79%, respectively.
Since the recuperative cycle gas turbine adds a heating water system, the thermal efficiency of the system is further improved. Although the combined cycle gas turbine system is less efficient, it provides more high grade electric energy. When different types of fuel are used, the output power of the recuperative cycle gas turbine system is 100 kW, while those of the steam-gas combined cycle systems are 162.64 kW, 162.43 kW, 158.23 kW, and 158.14 kW, respectively.
When biomass gas is used instead of natural gas, the fuel flow is larger and the combustor temperature is lower, which ultimately leads to the decrease in gas turbine efficiency.

3.3. Performance Analysis under Partial Load Conditions

The different gas turbine load can be acquired though adjusting the fuel mass flow rate, at the same time, the relevant parameters accordingly change. When the gas turbine load increases from are 50 kW to 100 kW, the operational performance and main parameters are shown in Figure 5 and Figure 6.
It can be seen from Figure 5 that when different kinds of fuel are used, the efficiency (η1) of the gas turbine in the recuperative cycle system increases with the increase in the load. The power generation efficiency (η1) of the natural gas system expands from 18.03% to 30.24%, and those of the biomass gas system changes from 17.83%, 17.30%, and 17.30% to 29.90%, 29.01%, and 29.01%, respectively.
The waste heat utilization efficiency (η2) of the recuperative cycle system decreases with the increase in the load. The waste heat utilization efficiency (η2) of the gas turbine using the natural gas dropped from 43.06% to 36.24%, and those using biomass gas dropped from 43.02%, 43.42%, and 43.43% to 36.30%, 36.91%, and 36.90%, respectively.
In the process of load increase, although the flue gas temperature at the gas turbine outlet significantly changes, the flue gas flow increases relatively little, so the recoverable heat in the flue gas slightly increases. With the increase in load, the energy into the gas turbine system significantly increases. Comparing both values, the latter increases more, in that the waste heat utilization efficiency shows a decreasing trend with the increase in load.
The combined cycle thermal efficiencies (η3) of the recuperative cycle system magnify with the rise in the load, which goes up from 61.90% to 66.48% for natural gas and from 60.85%, 60.72%, and 60.73% to 66.20%, 65.92%, and 65.91% for biomass gas, respectively.
It can be seen from Figure 6 that when different kinds of fuel are used, the combined cycle electric efficiency of the gas-steam gas turbine system (η4) increases with the increase in load.
The change curve of the power generation efficiency of the gas-steam turbine system with the load is mainly calculated based on the ratio of the sum of the output power of the gas turbine and the steam turbine to the total input energy of the system when the output power of the gas turbine increases from 50 kW to 100 kW.
With the load increasing from 50 kW to 100 kW, the combined cycle electric efficiency (η4) of natural gas system expands from 20.40% to 24.44%, and the combined cycle electric efficiency (η4) of biomass gas systems expands from 20.32%, 20.53%, and 20.55% to 24.34%, 24.77%, and 24.79%, respectively.

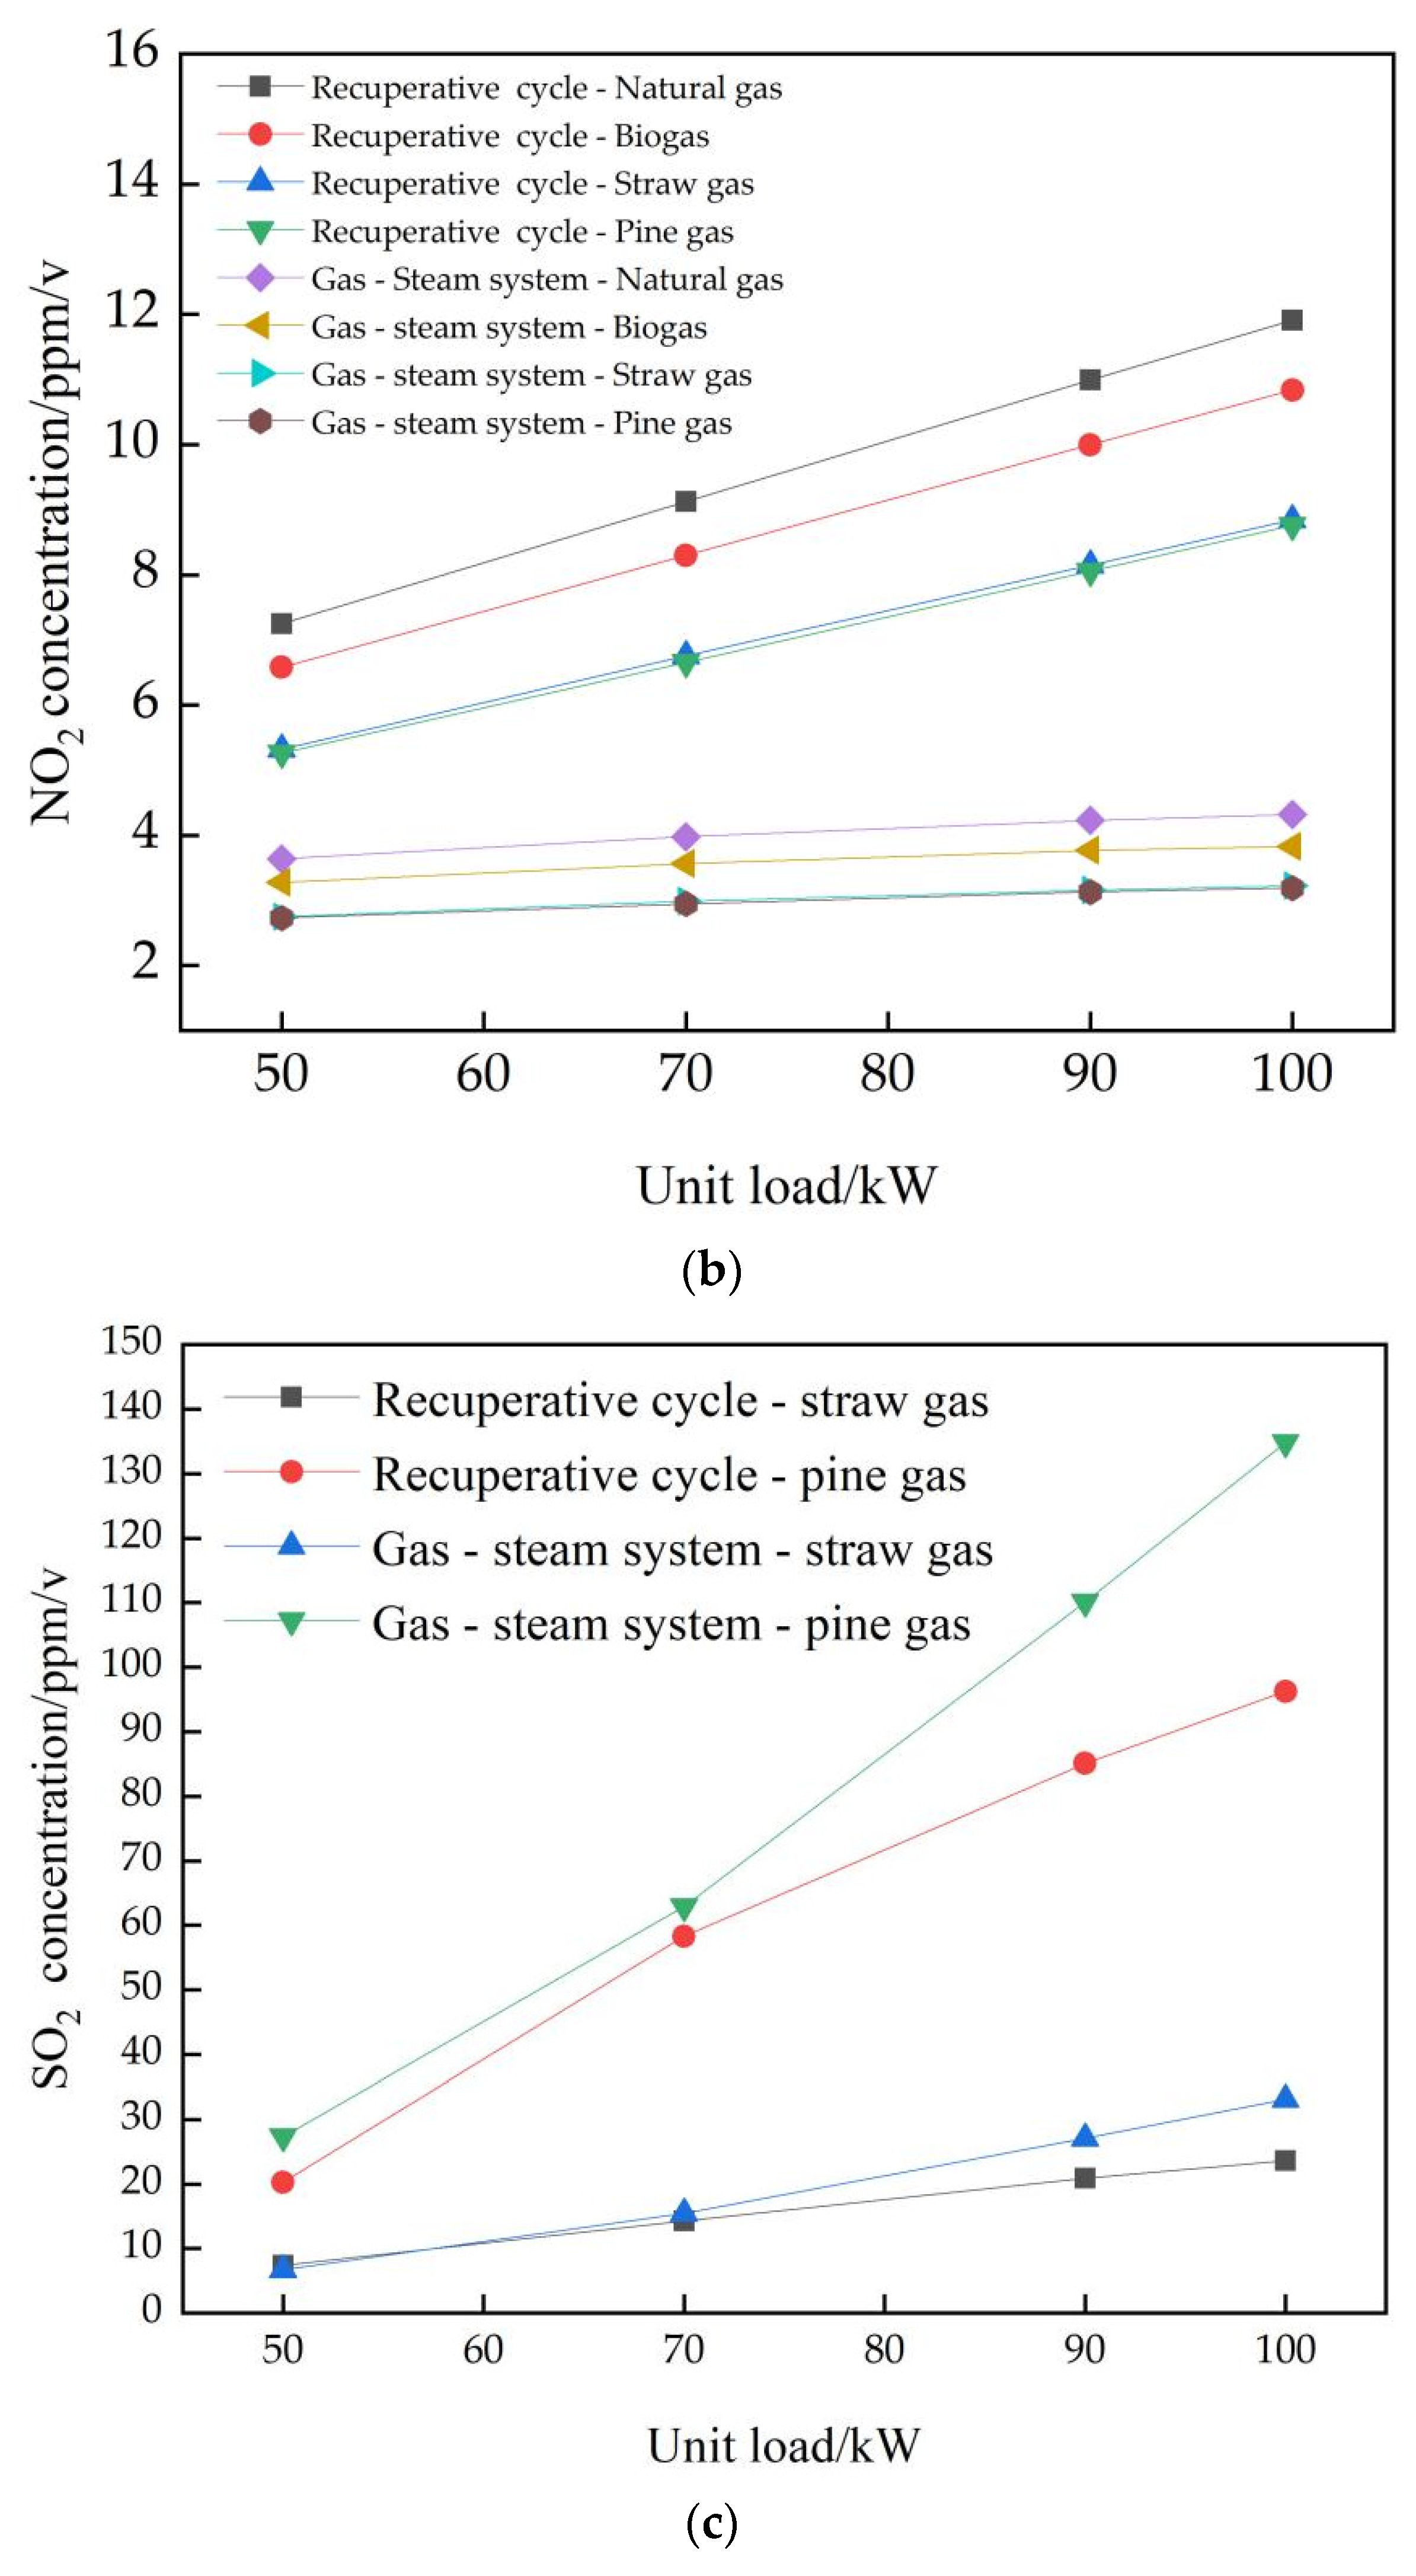
3.4. Pollutant Emission

When the gas turbine load increases from 50 kW to 100 kW, the emissions of NO, NO2 and SO2 change with the fuel types. The change processes are shown in Figure 7.
Due to the denitrification and nitrogen reduction technologies used in the actual gas turbine operation, such operations are not carried out in the simulation process, and due to the limitations of the simulation process itself, the simulation data and the design data are biased. This paper focuses on the analysis of NOX emissions with unit load variation law.
Figure 7a is the NO emissions chart of the gas turbine system under partial load operation. It can be seen that, in both systems, the increase in load leads to the gradual rise in combustor outlet temperature, which results in the increase of NO emissions. In the recuperative cycle system, the combustor outlet temperature for the natural gas case is the highest, and its NO emission is the largest, while the combustion chamber outlet temperature of the pine gas system is the lowest, and NO emission is the smallest.
In the recuperative cycle system, with the rise in load, NO emissions increase. For the natural gas system, the NO emission at 50 kW is 75.91 ppm, which goes up with an increase in load and reaches 452.97 ppm at 100 kW power load. For the biomass gas system, the NO emissions at 50 kW are 65.51 ppm, 40.68 ppm, and 40.25 ppm, respectively, which rise with an increase in the power load and reach 393.31 ppm, 248.84 ppm, and 246.2 ppm at 100 kW power load, respectively.
In the gas-steam combined cycle system, for the natural gas system, the NO emission at 50 kW is 31.55 ppm, which goes up with an increase in the power load and reaches 141.76 ppm at 100 kW power load.
For the biomass gas system, the NO emissions at 50 kW are 26.14 ppm, 14.78 ppm, and 14.63 ppm, respectively, that improve with the increase in power load and reach 114.18 ppm, 59.36 ppm, and 58.75 ppm at 100 kW power load, respectively.
When the same fuel is used and at the same load, the combustor temperature of the gas-steam combined cycle is much lower than that of the recuperative cycle system, so the NO emission is smaller. When straw gas and pine gas are used in both systems, NO emissions are relatively close, because the exit temperature of the combustor is almost the same when they are used in both systems.
Figure 7b shows the NO2 emission chart under partial load operation.
NO accounts for more than 95% of NOX generated in the gas turbine combustion process. Under the condition of the full mixing of air and fuel, the production of NO2 is small. NO2 is mainly generated through the reaction of NO and HO2 [32], and NO2 is easy to decompose and generates NO. Therefore, in the process of gas turbine combustion, the production of NO2 is not only far less than that of NO, but also gently increases with the increase of load.
In the recuperative cycle system, with the rise of power load, NO2 emissions increase. For the natural gas system, the NO2 emission at 50 kW is 7.25 ppm, and it reaches 11.91 ppm at 100 kW power load. For the biomass gas system, the NO2 emissions at 50 kW are 6.58 ppm, 5.32 ppm, and 5.26 ppm, respectively, and reach 10.84 ppm, 8.85 ppm, and 8.76 ppm at 100 kW power load, respectively.
In the gas-steam combined cycle system, for the natural gas system, the NO2 emission at 50 kW is 3.64 ppm, and reaches 4.32 ppm at 100 kW power load. For biomass gas system, the NO2 emissions at 50 kW are 3.28 ppm, 2.75 ppm, and 2.73 ppm, respectively, and reach 3.83 ppm, 3.23 ppm, and 3.19 ppm at 100 kW power load, respectively.
The replacement of natural gas fuel by biomass gas leads to the reduction of combustor temperature, which is conducive to the reduction of NOX emissions, thus reducing environmental pollution.
It can be seen from Figure 7c that the SO2 emission of pine gas is much higher than that of straw gas, because the sulfur content of the pine gas is greater than that of straw gas. With the increase in load, the increase in fuel flow and combustor temperature leads to increasing SO2 emissions.
With the increase in power load, SO2 emissions increase. For the recuperative cycle system, the SO2 emission at 50 kW is 7.44 ppm, 20.29 ppm, respectively, and reaches 23.63 ppm, 96.28 ppm at 100 kW power load. For the gas-steam combined cycle system, the SO2 emissions at 50 kW are 6.73 ppm, 27.38 ppm, respectively, and reach 33.14 ppm, 134.83 ppm at 100 kW power load.
As the components of biomass gas contain S element, SOX pollutants that cannot be generated by natural gas fuel are generated. Before burning biomass gas, SOX emissions can be reduced by using a simple desulfurization device.

4. Conclusions

The main objectives of this work were to investigate the operational performance and pollutant emissions of biomass gas (biogas, pine gas, and straw gas, etc.) when applied in the recuperative cycle system and the gas-steam combined cycle system. The developed model was found to be reliable and able to predict, with high accuracy, the performance parameters of the micro gas turbine system under different operational conditions.
(1) When the output power of the micro gas turbine is 100 kW, the fuel consumption of the recuperative cycle system is much lower than that of the gas-steam combined system. The outlet temperature of the combustion chamber of the recuperative cycle system is higher than that of the gas-steam combined system, and its electrical efficiency can reach 29%, which is more than 24% of the gas-steam combined system.
(2) When using biomass gasses instead of natural gas, under the same output power condition, the biomass gas mass flow rates required by the two systems increase by more than 1 to 7 times, but the gas flow only increases by 1.01~1.06 times (recuperative cycle system) and 1.02~1.12 times (gas-steam system). Compared with the natural gas system, both the combustion chamber outlet temperature and the electrical efficiency of the recuperative cycle system of biomass gas system accordingly decrease, while the electrical efficiency of the gas-steam combined cycle system changes little or slightly increases. The exhaust heat of the turbine in the recuperative cycle system is further utilized to improve the total thermal efficiency of the system. Whether using natural gas or biomass gas, the waste heat utilization efficiency of the recuperative cycle can reach 36%.
(3) With the decline of load, the electrical efficiency of the recuperative cycle system decreases, but the thermal efficiency of waste heat utilization increases. The waste heat utilization efficiencies of the biomass gas system are slightly higher than that of the natural gas system. The combined cycle thermal efficiency of both systems decreases with the decline in load.
(4) Under all working conditions, NOX emission at a higher outlet temperature of the combustion chamber is larger, so NOX emission of the recuperative cycle system is greater than that of the steam-gas combined cycle system, and the NOX emission gradually decreases when the biomass gas replaces the natural gas system. The influence of temperature on SO2 emissions is less than that of the sulfur content.

Author Contributions

Conceptualization, X.Z. and Y.W.; methodology, Y.W.; software, Y.W.; validation, X.Z., Y.W. and W.Z., formal analysis, Q.W.; investigation, Y.W.; resources, A.W.; data curation, Y.W.; writing—original draft preparation, X.Z.; writing—review and editing, X.Z.; project administration, A.W.; funding acquisition, A.W. All authors have read and agreed to the published version of the manuscript.

Funding

This work was supported by the Key Scientific Research Project of Colleges and Universities of Henan Province (grant number 21A480006), the Key Science and Technology Project of Henan Province (grant number 212102311055).

Data Availability Statement

Author’s own data obtained from calculations performed by the author.

Conflicts of Interest

The authors declare no conflict of interest.

Nomenclature

SymbolSignificance
Q r The heat of fuel entering the gas turbine system (kJ/s)
G r Fuel mass flow rate (kg/s)
L H V gas The lower heating value of fuel (kJ/kg)
P g Gas turbine output power (kW)
P gt Turbine output power (kW)
P gc Compressor loss power(kW)
η 1 The power generation efficiency of gas turbine (%)
Q w The heat of waste heat recovery and utilization (kJ/s)
G w Mass flow of water supply (kg/s)
h in The enthalpy of cold-water inlet (kJ/kg)
h out The enthalpy of hot-water outlet (kJ/kg)
MGTMicro gas turbine
GSCCGas-steam combined cycle
η 2 The thermal efficiency of waste heat utilization (%)
η 3 The combined cycle efficiency of recuperative cycle (%)
η 4 The electric efficiency of gas-steam combined cycle (%)
P s The output power of steam turbine (kW)
ρ NO The concentration of NO in dry flue gas at turbine outlet (ppm)
φ NO The measured volume content of NO in dry flue gas (%)
φ O 2 The measured oxygen content in dry flue gas (%)
ρ NO 2 The concentration of NO2 in the dry flue gas at the turbine outlet (ppm)
φ NO 2 The measured NO2 volume content in dry flue gas (%)
ρ SO 2 The concentration of SO2 in the dry flue gas at the turbine outlet (ppm)
φ SO 2 The measured volume content of SO2 in dry flue gas (%)
EHEExhaust heat exchanger

References

  1. Pilavachi, P.A. Mini- and micro-gas turbines for combined heat and power. Appl. Therm. Eng. 2002, 22, 2003–2014. [Google Scholar] [CrossRef]
  2. Xu, G. Jiangsu Province Gas Power Plant’s environmental protection status and policy trends. Gas Turbine Technol. 2017, 30, 9–15. [Google Scholar]
  3. Rocha, M.S.; Andreos, R.; Simões-Moreira, J.R. Performance tests of two small trigeneration pilot plants. Appl. Therm. Eng. 2012, 41, 84–91. [Google Scholar] [CrossRef]
  4. Antonio, R.; Sergio, S.; Giovanni, C. Energy, environmental and economic dynamic performance assessment of different micro-cogeneration systems in a residential application. Appl. Therm. Eng. 2013, 59, 599–617. [Google Scholar]
  5. Martin, P. Environmental impacts of distributed energy systems—The case of micro cogeneration. Environ. Sci. Policy 2008, 11, 25–37. [Google Scholar]
  6. Ismail, T.M.; Abd El-Salam, M.; Monteiro, E.; Rouboa, A. Fluid dynamics model on fluidized bed gasifier using agro-industrial biomass as fuel. Waste Manag. 2018, 73, 476–486. [Google Scholar] [CrossRef] [PubMed]
  7. Ghesti, G.F.; Silveira, E.A.; Guimarães, M.G.; Evaristo, R.B.; Costa, M. Towards a sustainable waste-to-energy pathway to pequi biomass residues: Biochar, syngas, and biodiesel analysis. Waste Manag. 2022, 143, 144–156. [Google Scholar] [CrossRef] [PubMed]
  8. Gomez, R.D.; Palacio, M.; Arango, J.F.; Avila, A.E.; Mendoza, J.M. Evaluation of the energy generation potential by an experimental characterization of residual biomass blends from Córdoba, Colombia in a downdraft gasifier. Waste Manag. 2021, 120, 522–529. [Google Scholar] [CrossRef]
  9. De Priall, O.; Gogulancea, V.; Brandoni, C.; Hewitt, N.; Johnston, C.; Onofrei, G.; Huang, Y. Modelling and experimental investigation of small-scale gasification CHP units for enhancing the use of local biowaste. Waste Manag. 2021, 136, 174–183. [Google Scholar] [CrossRef]
  10. Fan, L.; Zhang, Y. The problems and countermeasures existing in the biomass power generation industry in my country. J. North China Electr. Power Univ. (Soc. Sci.) 2010, 1, 11–13. [Google Scholar]
  11. Gupta, K.K.; Rehman, A.; Sarviya, R.M. Bio-fuels for the gas turbine: A review. Renew. Sustain. Energy Rev. 2010, 14, 2946–2955. [Google Scholar] [CrossRef]
  12. Wang, M.; Bai, H. The adjustment and characteristics of the gas turbine work point when burning low thermal value gas. Gas Turbine Technol. 2003, 16, 48–51. [Google Scholar]
  13. Evangelisti, S.; Clift, R.; Tagliaferri, C.; Lettieri, P. A life cycle assessment of distributed energy production from organic waste: Two case studies in Europe. Waste Manag. 2017, 64, 371–385. [Google Scholar] [CrossRef] [PubMed] [Green Version]
  14. Nikpey, H.; Assadi, M.; Breuhaus, P.; Mørkved, P.T. Experimental evaluation and ANN modeling of a recuperative micro gas turbine burning mixtures of natural gas and biogas. Appl. Energy 2014, 117, 30–41. [Google Scholar] [CrossRef]
  15. Ma, Y.; Zhu, T.; Zong, C.; Zhu, R. Simulation Study of Biomass Gasification and Micro Gas Turbine Integrated Power Generation System. Build. Energy Environ. 2018, 37, 6–11. [Google Scholar]
  16. Lan, W.; Chen, G.; Zhu, X.; Wang, X.; Liu, C.; Xu, B. Biomass gasification-gas turbine combustion for power generation system model based on ASPEN PLUS. Sci. Total Environ. 2018, 628–629, 1278–1286. [Google Scholar] [CrossRef] [PubMed]
  17. Ca´ceres, C.X.; Ca´ceres, R.E.; Hein, D.; Molina, M.G.; Pia, J.M. Biogas production from grape pomace: Thermodynamic model of the process and dynamic model of the power generation system. Int. J. Hydrogen Energy 2012, 37, 10111–10117. [Google Scholar] [CrossRef]
  18. Somehsaraei, H.N.; Majoumerd, M.M.; Breuhaus, P.; Assadi, M. Performance analysis of a biogas-fueled micro gas turbine using a validated thermodynamic model Applied. Appl. Therm. Eng. 2014, 66, 181–190. [Google Scholar] [CrossRef]
  19. Kim, T.S.; Hwang, S.H. Part load performance analysis of recuperated gas turbines considering engine configuration and operation strategy. Energy 2006, 31, 260–277. [Google Scholar] [CrossRef]
  20. Caresana, F.; Comodi, G.; Pelagalli, L.; Renzi, M.; Vagni, S. Use of a test-bed to study the performance of micro gas turbines for cogeneration applications. Appl. Therm. Eng. 2011, 31, 3552–3558. [Google Scholar] [CrossRef] [Green Version]
  21. Thu, K.; Saha, B.B.; Chua, K.J.; Bui, T.D. Thermodynamic analysis on the part-load performance of a microturbine system for micro/mini-CHP applications. Appl. Energy 2016, 178, 600–608. [Google Scholar] [CrossRef]
  22. Chiariello, F.; Allouis, C.; Reale, F.; Massoli, P. Gaseous and particulate emissions of a micro gas turbine fuelled by straight vegetable oil–kerosene blends. Exp. Therm. Fluid Sci. 2014, 56, 16–22. [Google Scholar] [CrossRef]
  23. Rabou, L.P.L.M.; Grift, J.M.; Conradie, R.E.; Fransen, S. Micro gas turbine operation with biomass producer gas and mixtures of biomass producer gas and natural gas. Energy Fuel 2008, 22, 1944–1948. [Google Scholar] [CrossRef]
  24. Zhao, L.; Wang, J. Discussion of the influential factors on the performance of combustion chamber in a micro gas turbine. Energy Res. Inf. 2019, 35, 40–47. [Google Scholar]
  25. He, B. Study on Advanced Energy System Based on Micro Gas Turbines; North China Electric Power University: Beijing, China, 2010. [Google Scholar]
  26. Zhang, S.; Li, Y.; Ye, D. Optimal panning of a gas turbine CCHP plant. Proc. CSEE 2004, 10, 185–190. [Google Scholar]
  27. Liu, Z.; Shu, X.; Yang, A. Selection of the standard limit of air pollutant emission standards for fixed gas turbines. China Power 2020, 53, 117–124. [Google Scholar]
  28. Chen, H.; Wang, Q.; Shi, Y.; Liu, R. Effect of Hydrogen volume fraction on combustion characteristics of coal-to-natural gas. Gas Heat 2017, 37, 46–49. [Google Scholar]
  29. Xiao, Y.; Wen, S.; Zhou, X.; Huang, J.; Zhang, Z. Simulation of Thermal Cycle Characteristics of biogas micro-turbine. J. Beijing Inst. Petrochem. Technol. 2017, 25, 36–41. [Google Scholar]
  30. Jin, X. Simulation Study on High Temperature Gasification Process of Biomass and Water Steam; Harbin Institute of Technology: Harbin, China, 2013. [Google Scholar]
  31. Zhang, X.; Huang, X. Simulation analysis of biomass gasification and micro gas turbine combined power generation system. Energy Res. Manag. 2021, 3, 48–52. [Google Scholar]
  32. Chen, J.; Cheng, W.; Dou, Y.; Zhang, T. Theoretical Study on the Mechanism of HO2 + NO Gas Reaction and the Rate Constant of Main Channel. J. Mol. Sci. 2016, 32, 515–522. [Google Scholar]
Figure 1. Flow chart of recuperative cycle micro gas turbine system.
Energies 15 09113 g001
Figure 2. Flow chart of micro gas-steam combined cycle system.
Energies 15 09113 g002
Figure 3. Efficiency diagram of recuperative cycle system.
Energies 15 09113 g003
Figure 4. Efficiency diagram of micro gas-steam combined cycle system.
Energies 15 09113 g004
Figure 5. Partial load operation efficiency chart of recuperative cycle.
Energies 15 09113 g005
Figure 6. Partial load operation efficiency chart of gas-steam cycle.
Energies 15 09113 g006
Figure 7. NOx and SO2 emissions of combined cycle systems at different loads. (a) NO emissions of combined cycle systems at different load cases; (b) NO2 emissions of combined cycle systems at different load cases; (c) SO2 emissions of combined cycle systems at different load cases.
Energies 15 09113 g007aEnergies 15 09113 g007b
Table 1. An introduction to the modules required to simulate the process.
The ModuleInstructionsPurposeFunction
ComprCompressor or turbineCompressor or turbine. The logistics pressure can be changed when the pressure, power demand or performance curve is knownCompressor, gas-steam turbine
RGibbsBalance balancing reactorGibbs minimum free energy is used to calculate chemical equilibrium and phase equilibriumFuel and air combustion reaction generating module
HeaterHeater or coolerDetermine the thermal and phase conditionsHeat exchanger, heating the inlet air of the combustor
MHeatXMulti-flow heat exchangerAny number of logistics of heat exchangerRecycle waste heat from flue gas to heat water supply or produce steam
PumbPump or hydraulic turbineThe logistics pressure can be changed when the pressure, power demand or performance curve is knownFeed water to exhaust heat exchanger
Table 2. (a). Main parameters of recuperative cycle micro gas turbine system. (b). Main parameters of gas-steam combined cycle system.
(a)
ComponentsInput ParametersValues
InletAir temperature (°C)15
Air pressure (atm)0.99
Pressure loss (%)1
CompressorPressure ratio4.5
Mechanical efficiency (%)98
Isentropic efficiency (%)76.8
Recuperator (Air side)Pressure loss (%)2
CombustorPressure loss (%) 3
Heat loss (%)2
Gas TurbineTurbine exhaust pressure (atm)1.06259
Mechanical efficiency (%)98
Isentropic efficiency (%)80.5
Recuperator (Gas side)Pressure loss (%)2
Recuperator effectiveness0.9
EHEPressure loss (%)3
Heat loss (%)10
(b)
ComponentsInput ParametersValues
Gas TurbineTurbine exhaust pressure (atm)1.0412
Mechanical efficiency (%)98
Isentropic efficiency (%)80.5
Steam Turbine Steam pressure (MPa)0.06
Mechanical efficiency (%)98
Isentropic efficiency (%)80.5
Table 3. Fuel gas composition.
Fuel TypeMole Fraction/%Lower Heating Value/(kJ/kg)
N2H2COCO2CH4C2H6C3H8C4H10S
Natural gas1.92--2.7394.700.550.080.02-44,871.69
Biogas---38.0062.00----18,679.59
Pine gas42.0624.8023.888.460.65---1.60 × 10−35794.64
Straw gas42.1022.4626.508.420.48---4.98 × 10−45665.12
Table 4. Comparison between T100 design parameters and simulated values.
Compare the ProjectDesign ValueSimulation ValueRelative Error/%
Compressor pressure ratio4.54.50
Combustor outlet temperature/K1223.151234.670.94
Gas mass flow rate/kg/s0.790.790
Output power/kW1001000
Power generation efficiency/%30.0030.210.7
Table 5. Combined cycle operating parameters of different types of fuel.
SystemFuel TypeFuel Mass Flow RateCombustor Temperature
/(K)
Gas Mass Flow Rate
/(kg/s)
Turbine Outlet Temperature
/(K)
Recuperative
cycle
system
natural gas0.00741233.70.7908949.84
biogas0.01791222.60.8013942.23
straw gas0.06091169.30.8442899.94
pine gas0.05951169.10.8429899.64
Combined
gas-steam
cycle
system
natural gas0.01481183.80.7982906.54
biogas0.03571163.00.8191892.21
straw gas0.11271078.90.8961824.72
pine gas0.11011078.70.8935824.33
Publisher’s Note: MDPI stays neutral with regard to jurisdictional claims in published maps and institutional affiliations.

