1. Introduction
Maglev trains, with the non-contact suspension, guidance, and propulsion technology, have the advantages of low vibration and low noise, stable operation, small turning radius, and strong climbing ability, which have widely attracted the attention and continuous research of many countries. Unlike the wheel–rail system employed in high-speed EMUs, the maglev system boasts lower derailment risk, lower noise, less energy consumption, and superior riding environments and services. As the prototype of maglev transport, the low–medium-speed maglev train is designed for short and medium journeys in cities and is most likely to be a prospective future urban transit [
1,
2].
At present, the Linimo Line in Japan, Incheon Airport Line in South Korea, and Changsha Maglev Airport Line and Beijing Maglev Line S1 in China are in commercial operation [
3,
4]. According to the suspension principle, maglev trains can be divided into high-temperature superconducting suspension, electrodynamic suspension (EDS), electromagnetic permanent magnet hybrid suspension, and electromagnetic suspension (EMS). Electromagnetic suspension is widely used in China, which is propelled by a short stator linear induction motor and generally runs on viaducts [
5,
6,
7]. The traditional wheel–rail contact is replaced by the non-contact magnetic interaction between electromagnet and track.
Over the last two decades, studies on the dynamic performance of train–track systems for maglev trains have contributed significantly to the fulfillment of low–medium-speed maglev transportation. In consideration of rail irregularities, Zhao and Zhai [
8] built a 10-DOF model of a maglev train to study the maglev train responses and dynamic indexes affecting riding comfort underlying the German maglev express train system. Zheng et al. [
9] optimized the maglev train by transforming it into a five-degree-of-freedom model with two-stage suspensions, and simulated the coupled dynamic responses of the system. Hu et al. [
10] applied the multibody dynamics software SIMPACK to establish a three-dimensional maglev train suspension control-bridge coupled dynamic model to simulate a maglev train running at 160 km/h in China. Lee et al. [
11] established a simplified vertical dynamic model of low–medium-speed maglev train bridge coupling, and dissected the influence of bridge structural form, material, and stiffness on coupled vibration. Han et al. [
12] assumed the possible effects that a wide range of design parameters of the guideway might impose on the vehicle dynamic performance, established a dynamic model—an actual vehicle and guideway resemblance—and proposed a limiting value of deflection ratio of the slender guideway to guarantee levitation control.
The research above analyzed the dynamic performance of maglev trains from the mechanical principle or simulation, but ignored the harsh environmental conditions on the actual line. Therefore, some researchers endeavored to analyze the dynamic performance of maglev trains from field tests. Li et al. [
13] set up a low–medium-speed train with a central air spring suspension frame, studied the dynamic properties of the vehicle–rail–bridge coupling system, and conducted field tests on the coupling system at the running speed of 60 km/h to study its natural vibration characteristics. Underlying field measurement and model real-time update method, Zhang and Huang [
14] presumed an interaction model of maglev vehicle/guideway, and dissected what impacts distributed magnetic forces and irregularity might impose on the interaction system. Li et al. [
15] conducted field tests on low–medium-speed maglev trains in Changsha, recorded the bridge vibration on two types of prestressed double track concrete bridge tracks, and analyzed and compared the basic dynamic characteristics of the two bridges in multifarious typical maglev lines. Li et al. [
16] selected seven test sections of an operational maglev train in Shanghai to measure the acceleration response of a pier and nearby ground in three directions, and to dissect the data in the frequency domain and time domain. Pronello [
17] analyzed the interactions between vehicles, infrastructure, and environment for rail traffic, and set variables that closely correlated with sound level, a standard procedure for measuring noise, and a database for establishing and calibrating train noise models. Lim et al. [
18] analyzed and experimentally evaluated the power consumption and effective normal force of maglev trains, and applied a vector control algorithm and various air gaps to improve propulsion efficiency and reduce system energy consumption. The air gap and normal force of a linear induction motor were calculated and compared with those in the traditional finite element method. Luo et al. [
19] simulated the noise distribution when the maglev train passed through a double-sided noise barrier by using the improved delayed separation vortex, analyzed the pressure field in the noise barrier area around the maglev train, and studied the height of the noise barrier, its distance from the track center, and the effects on the noise field distribution.
To explore the properties of noise in the traction motor in an operational maglev train, this study detected the vibration acceleration of the suspension frame. Field tests were conducted to measure the traction motor noise and vibration acceleration of the suspension frame in three directions in three selected test sections on a commercially operational medium- and low-speed maglev train according to the actual operating conditions. Influences of maglev train speed on traction motor noise and suspension frame vibration were assessed according to their peak values in the test data in a test section. Then, the causes of noise in the traction motor were analyzed from the test data of suspension frame vibration acceleration in the frequency domain.
2. Measurement Arrangement
A medium- and low-speed maglev train is generally composed of four carriages. In this test, carriage 2 is the main test object.
Figure 1 is the schematic diagram of a carriage bottom structure. In
Figure 1, five suspension frames are installed in the bottom, and every suspension frame has one linear motor and four suspension electromagnets on each side. In this test, ten test points are selected and marked from No. 1 to No. 10. Test points No. 1 to No. 10 are monitored to study the noise characteristics of the linear motor and suspension frame, and No. 1, No. 2, No. 5, No. 6, No. 9, and No. 10 are monitored to investigate the vibration characteristics of the linear motor and suspension frame.
Figure 2 shows the layout of the data acquisition system and sensor installation. The noise sensors are installed in the middle of each linear traction motor, and the vibration acceleration sensors along three directions are installed at the end of the suspension frame.
Since the data of vibration acceleration and noise in the operational maglev line are very dense and complicated, sensors with high sensitivity and high threshold are required to further measure the precise data. The vibration acceleration sensors installed on the suspension frame are LC0119 piezoelectric acceleration sensors manufactured by Lance with a range of 10 g and a sensitivity of 500 mV/g. The noise sensors installed on the traction motor are PCB sensors with a sensitivity of 50 mV/Pa whose dynamic measurement range is 15.5 dB to 146 dB. The sampling frequency of all sensors used in the actual test is 50,000 Hz, which is sufficient to guarantee the accuracy of vibration acceleration figures and noise transients. To ensure real-time accuracy and large-capacity storage of the collected data, four integrated measurement control (IMC) systems are applied to jointly collect suspension frame vibration acceleration signals, and a PAK data acquisition system is used to collect noise signals, which effectively circumvents the asynchrony between vibration acceleration and noise in this test.
In order to study the influence of suspension vibration on the noise of the traction motor, three test sections are selected for field tests on the main track of a medium- and low-speed maglev demonstration line in China. The test speeds are the most commonly used running speeds of medium- and low-speed maglev trains, namely 20 km/h, 40 km/h, and 60 km/h.
3. Sound Pressure Analysis Theory
The passenger trains in China’s railway transit commonly employ the equivalent A-weighted sound pressure level as the noise index to evaluate the impact of noise. The frequency response of acoustic A-weighted sound pressure level is equivalent to the sensitivity of the human ear to broadband sound, with large attenuation in the low-frequency band and small attenuation in the high-frequency band. If A-weighted sound pressure level data series are obtained by measuring in the same sampling time interval, the equivalent continuous A-weighted sound pressure level in the measurement time period can be expressed as [
20]:
where
LAeq is the equivalent continuous A-weighted sound pressure level (dB),
LAi is the
ith A-weighted sound pressure level, and
N is the number of test data.
When calculating the 1/3 octave of a section of acoustic signal
Y(
x), FFT spectrum decomposition is firstly performed to obtain
x1,
x2, …,
xn spectrum signals, and will obtain 20 groups of spectrum signals according to the frequency band range defined by the 1/3 octave. Inverse IFFT transform is performed on the
jth group spectrum signal, the root mean square of the sound pressure value corresponding to the
jth group signal is calculated, and the effective value of sound pressure
Pej corresponding to the
jth group is obtained.
pj is sound pressure value corresponding to the
jth group. The 1/3 octave band sound pressure level value of the sound signal can be expressed as:
For each frequency band, its sound pressure according to its band range is calculated and the component value is converted. The relationship between the total sound pressure level and frequency band sound pressure level can be expressed as:
where
P0 is reference sound pressure, which is 2 × 10
−5 Pa,
Lpj is sound pressure level of each frequency band, and
Lpt is the total sound pressure level.
4. Measurement Results and Analysis
This section shows the test results of traction motor noise and suspension frame vibration acceleration of a medium- and low-speed maglev train running at a speed ranging from 0 to 20 km/h, 0 to 40 km/h, and 0 to 60 km/h. After the train accelerates to 20 km/h, 40 km/h, and 60 km/h respectively, it would operate at the test speed in a constant speed stage and brake to stop when the test is accomplished. This section discusses the influence of the train’s running speed and suspension frame vibration on the traction motor noise.
4.1. Traction Motor Noise Test
Before the test, the environmental background noise was measured which was proved to be broad-spectrum noise and was filtered out when processing the noise signal. The test was conducted from 1–2 a.m. (Beijing time) with no rain or wind, so the natural environmental noise was low. Therefore, the properties of noise around the linear traction motor were monitored and analyzed ignoring the environmental interference. The acoustic spatial distribution around the traction motor was evaluated by the noise sensors numbered from No. 1 to No. 10.
Figure 3 shows the A-weighting sound pressure levels in one-third octave band center frequency monitored by noise sensors in the middle of ten of the same linear traction motors, respectively, at the speed of 20 km/h, 40 km/h, and 60 km/h.
In
Figure 3, around the same ten traction motors, the recorded graphs of sound pressure level at the three test speeds are different, which indicates that the sound environment at each speed is different, while the noise distribution at each speed is similar in space, which confirms the validity of the test. The frequencies corresponding to the maximum sound pressure levels in the three graphs are all concentrated at the frequency around 1000 Hz. The graphs also show that the sound pressure levels of No. 9 are relatively higher than the others. Therefore, the test selected the No. 9 traction motor as the key object to further analyze.
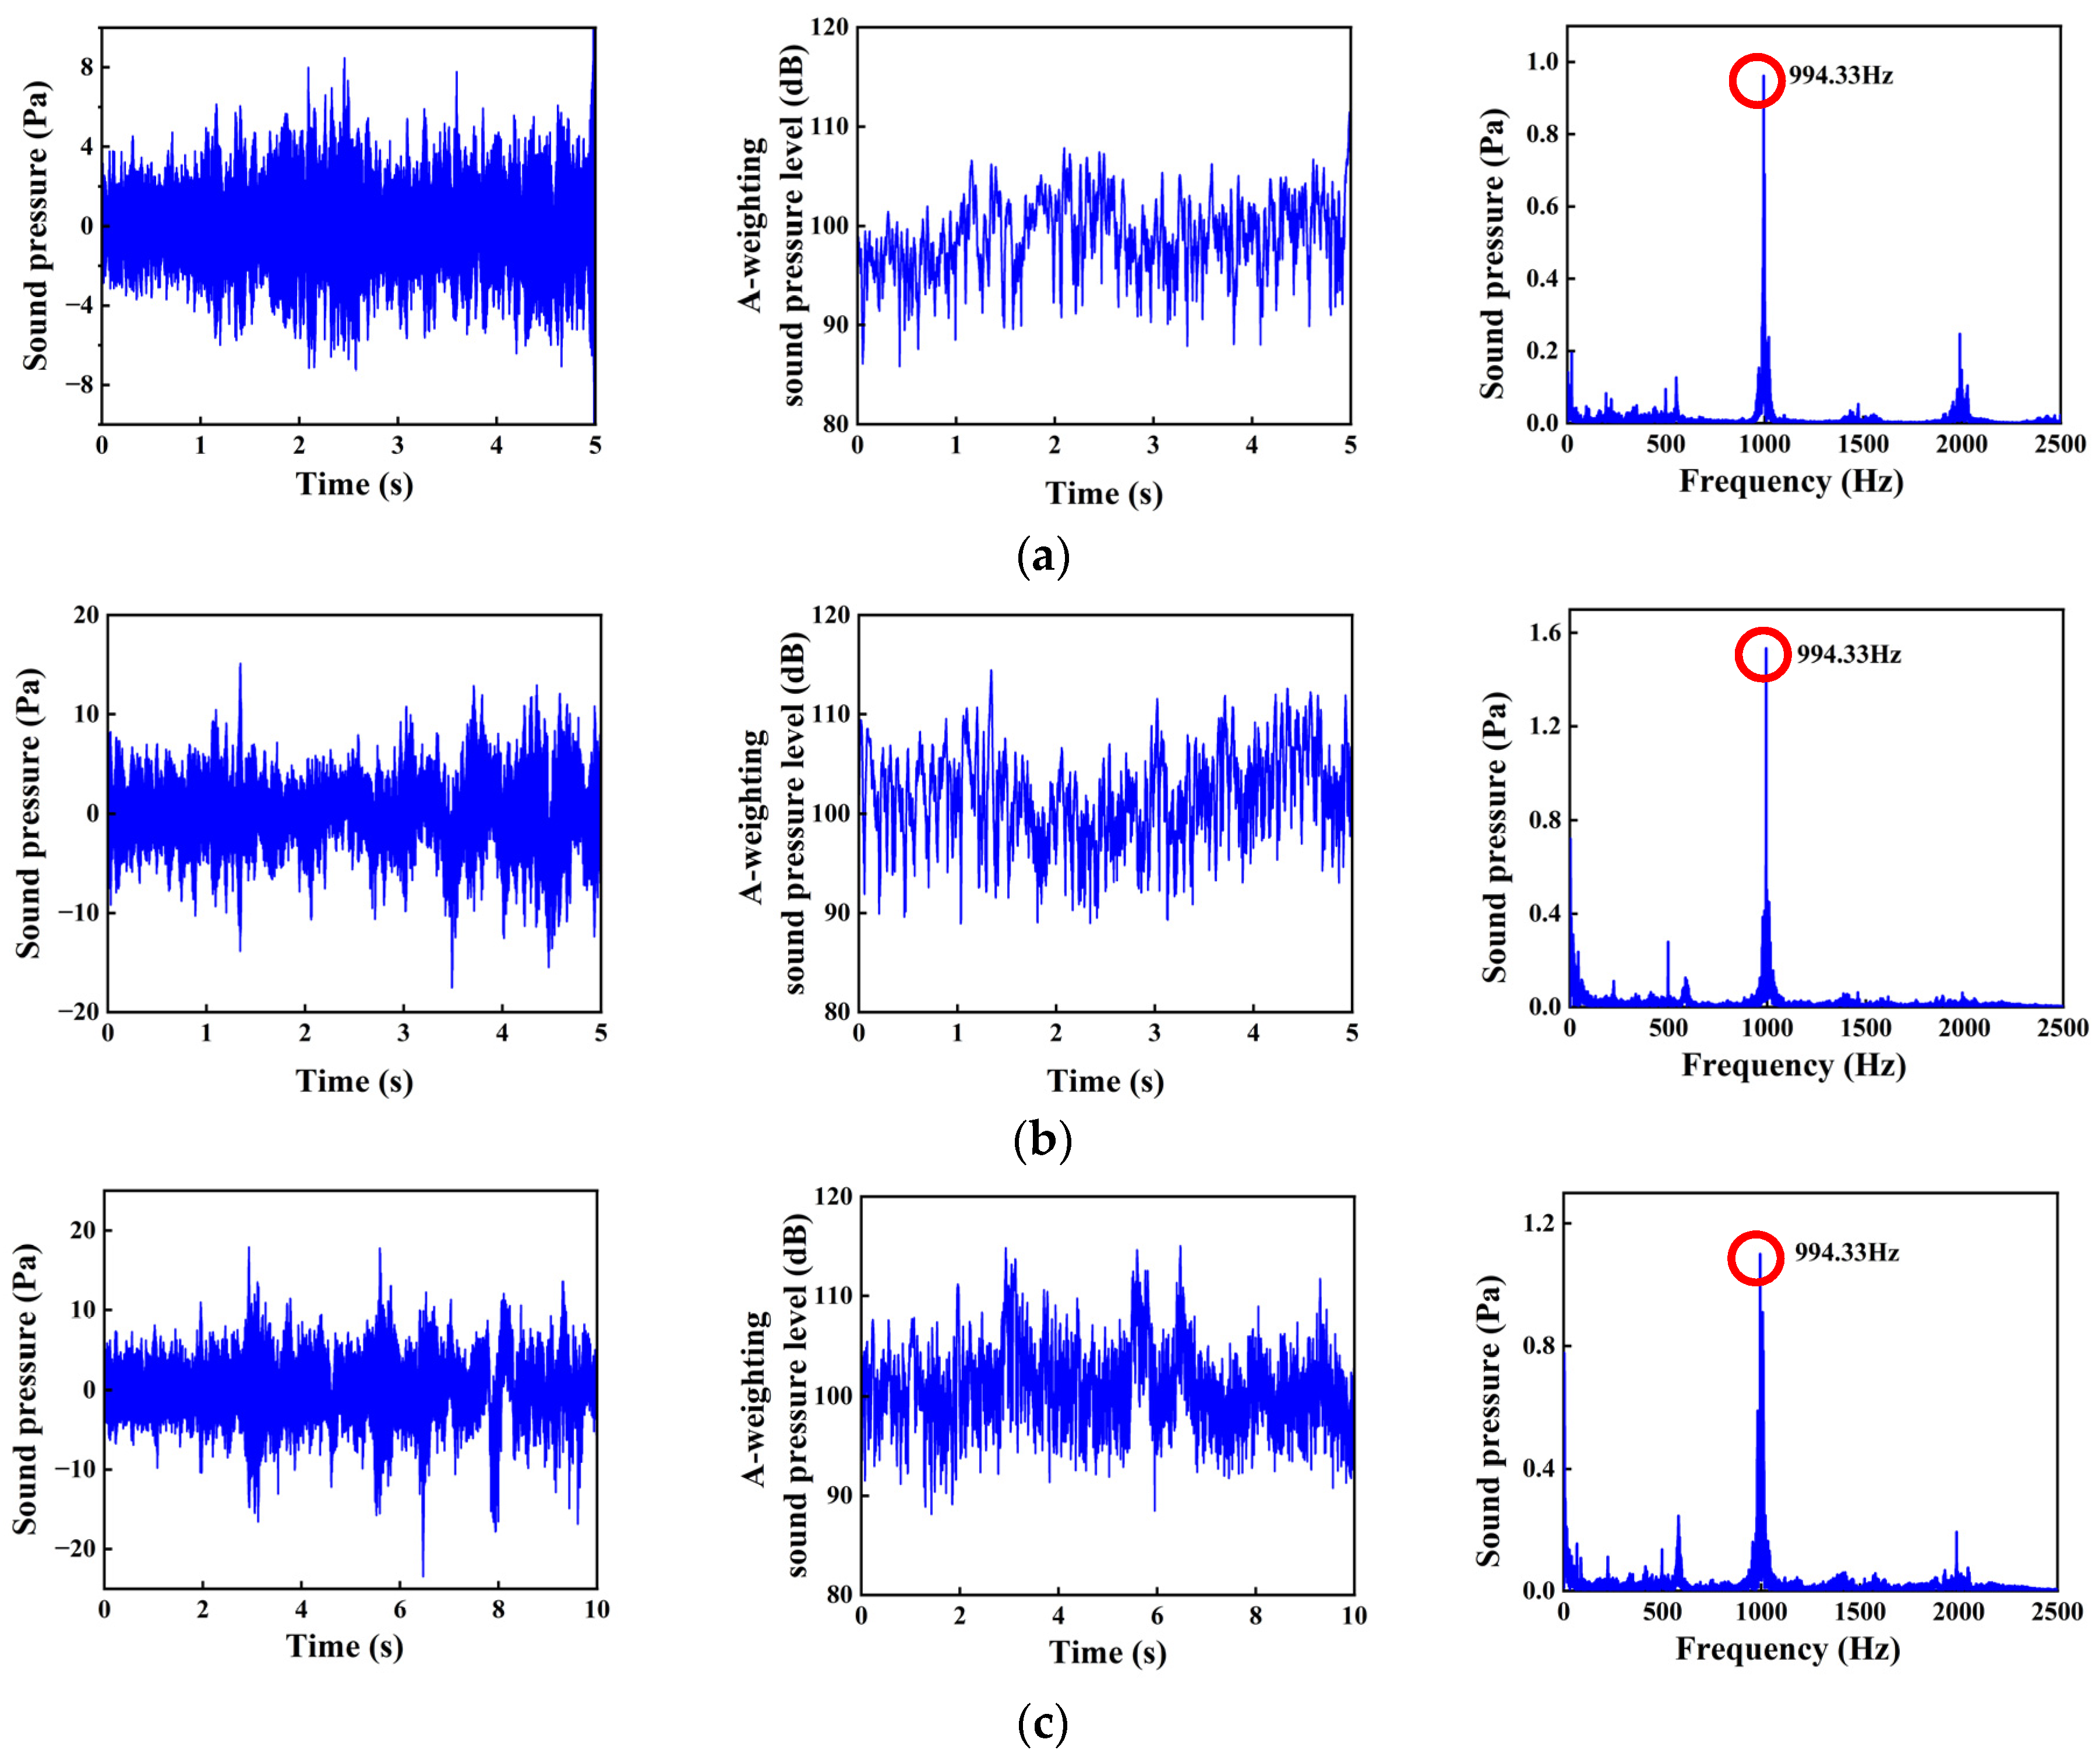
Figure 4 shows the noise pressure and A-weighting sound pressure level around the No. 9 traction motor in the time and frequency domain at the three test speeds. The dominant frequency component of noise is 994.33 Hz. The equivalent continuous A-weighting sound pressure levels of different measuring points at different speeds were calculated as shown in
Table 1. The average of the continuous equivalent A-weighting sound pressure levels of motors 1–10 under the three groups of speed levels in
Table 1 was taken, and the results are shown in
Figure 5.
In
Figure 5, when the maglev train speed grows from 20 km/h to 40 km/h, the equivalent continuous A-weighting sound pressure level is increased by 4.051 dB. As the speed grows from 40 km/h to 60 km/h, the equivalent continuous A-weighting sound pressure level is increased by 0.535 dB. As the train accelerates, the sound pressure grows overall, but the increase becomes smaller at each test speed. The reason for the increased noise of medium- and low-speed maglev trains is mainly related to the frequency components around 994.33 Hz.
4.2. Suspension Frame Vibration Acceleration Test
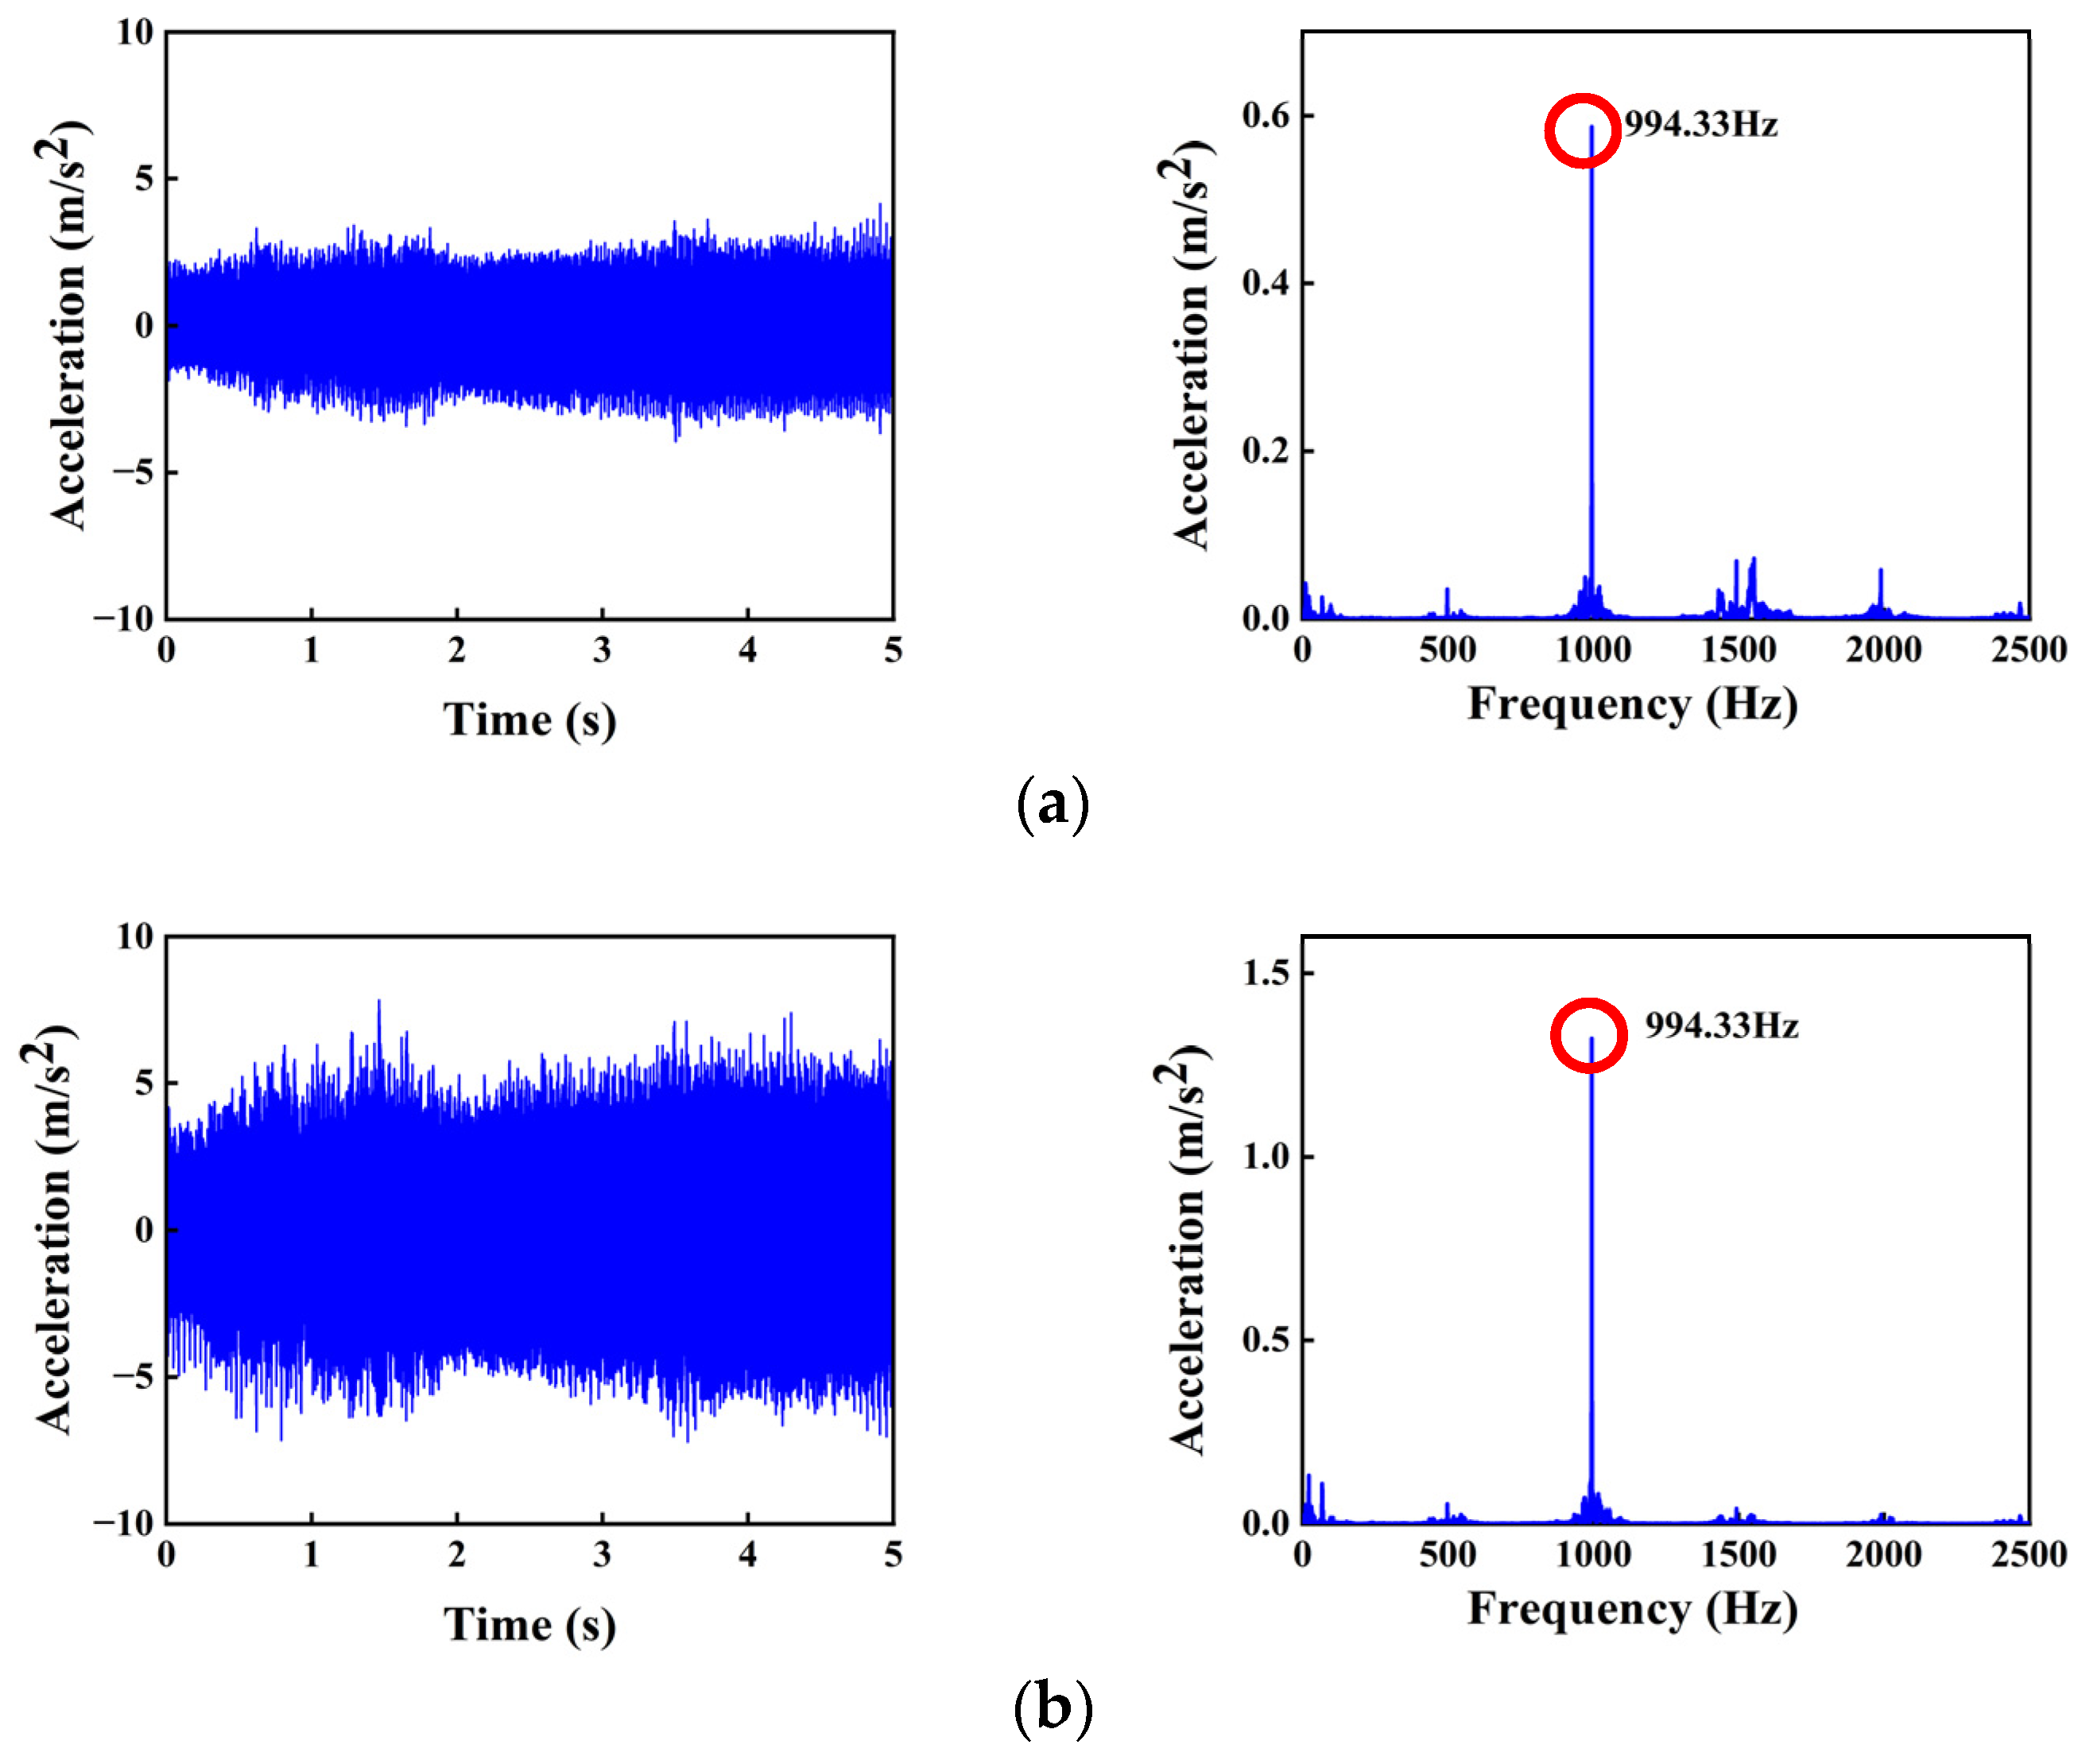
In general, noise comes from the vibration of surrounding structures, and the main structure around the traction motor is the suspension frame of the maglev train. Therefore, this paper focuses on the relationship between lateral/vertical vibration and traction motor noise. The time domain and frequency domain of lateral and vertical vibration acceleration of the No. 9 suspension frame at three speeds are illustrated in
Figure 6,
Figure 7 and
Figure 8.
In the time domain, the vertical vibration accelerations are greater than that in the lateral direction. As the speed rises, the vibration acceleration also increases gradually. When the speed grows from 20 km/h to 40 km/h, the lateral and vertical suspension frame vibration accelerations are increased by 0.06 m/s2 and 0.43 m/s2, respectively. When the speed grows from 40 km/h to 60 km/h, the lateral and vertical suspension frame vibrations are increased by 0.25 m/s2 and 0.18 m/s2, respectively.
In the frequency domain, the vibration accelerations in the two directions all show a high frequency vibration of about 994.33 Hz. The dominant frequency of vibration signal is consistent with that of the noise signal mentioned above. Especially in the vertical direction, the frequency component of 994.33 Hz accounts for the highest proportion, for the electromagnetic excitation force excited by the higher harmonics of the traction current has the greatest influence on the vertical vibration. The high-frequency vibration brings about high-frequency noise, which significantly increases the noise in that stage.
In
Figure 4, it is obvious in the spectrum diagram that the dominant frequency of sound pressure is 994.33 Hz at each test speed. In addition to some low-frequency noise, the frequency of noise sound pressure also has a medium frequency component of 500 Hz and 2000 Hz, which is relatively prominent.
Through the comparison of the suspension frame vibration acceleration frequency spectra illustrated in
Figure 6,
Figure 7 and
Figure 8, it can be observed that the dominant frequency of lateral and vibration acceleration is 994.33 Hz at each test speed. In addition to the low-frequency oscillation excited by structural vibration, the frequency of lateral and vertical vibration acceleration also has a medium frequency component of 500 Hz and 1000 Hz. It is not a coincidence that the dominant frequency of traction motor noise is basically consistent with the dominant frequency of suspension frame vibration acceleration. Therefore, the suspension frame vibration is the main reason for the high-frequency noise in the operation of low–medium-speed maglev trains.


