Article

Sustainable Governance, Energy Security, and Energy Losses of Europe in Turbulent Times

by
Tomasz Wołowiec
1,
Svitlana Kolosok
2,
Tetiana Vasylieva
2,
Artem Artyukhov
2,
Łukasz Skowron
3,
Oleksandr Dluhopolskyi
1,4,* and
Larysa Sergiienko
5
1
Faculty of Public Administration and Business, WSEI University, 20-209 Lublin, Poland
2
Academic and Research Institute of Business, Economics and Management, Sumy State University, 40007 Sumy, Ukraine
3
Faculty of Management, Lublin University of Technology, 20-618 Lublin, Poland
4
Faculty of Economics and Management, West Ukrainian National University, 46027 Ternopil, Ukraine
5
Faculty of National Security, Law and International Relations, Zhytomyr Polytechnic State University, 10005 Zhytomyr, Ukraine
*
Author to whom correspondence should be addressed.
Energies 2022, 15(23), 8857; https://doi.org/10.3390/en15238857
Submission received: 30 September 2022 / Revised: 6 November 2022 / Accepted: 11 November 2022 / Published: 23 November 2022

Abstract

:
The article aims to identify the relationship between energy efficiency and particular indicators of energy losses in Europe. The results of the bibliographic analysis showed a knowledge gap in energy losses in Europe regarding the new challenges of energy security. For the analysis, annual panel data from 32 European countries were collected from 1990 to 2019. The authors used the Jarque–Bera test to assess the normality of the residuals, utilized the Breush–Pagan test for heteroskedasticity check, and applied regression analysis to determine the relationship between energy efficiency and energy loss rates in Europe. To assess the effects of energy losses, the authors performed OLS modeling using the stats model’s package in Python. According to the modeling results, an increase in distribution losses (% of available energy from all sources) by 1% in Europe leads to an increase in energy consumption by 17.16% under other constant conditions. There is significant heterogeneity between European countries concerning energy efficiency and energy loss coefficients. Such a situation requires the development of new strategies and mechanisms to reduce energy losses, considering the challenges of energy security in Europe in turbulent times. Further research can be devoted to clustering European countries according to the main groups of energy losses: in the extraction, distribution, storage, and transformation of energy.

1. Introduction

In these turbulent times, many European countries are using sustainable energy governance practices to reduce energy losses. The proper management of energy losses helps to decrease CO2 emissions, increase energy efficiency, improve environmental quality, and minimize energy infrastructure needs [1,2,3]. Therefore, it is a priority to introduce energy-efficient strategies to reduce energy losses [4,5]. Increasing energy efficiency has a significant contribution to ensuring sustainability [6,7,8], investment attractiveness [9,10,11], and socio-economic development [12,13,14]. In addition, the improvement of energy efficiency is accompanied by the development and application of solutions in the field of environmental taxes [15,16,17], with particular attention to the topical issues of national security [18,19]. Since the problem of energy losses is the main reason for the financial collapse of most utility companies [20], eliminating such losses directly impacts the economic well-being of regions and their energy security. Constant attempts to reduce and optimize energy losses are noticeable [21]. The governments of countries with inefficient energy systems are forced to use smoothing mechanisms to mitigate negative energy shocks for the population, as such shocks threaten democratic processes [22,23].
At the current stage of development, it is necessary to make strategic changes to the energy system development plans [24,25,26]. Such changes should be consistent with the global scenarios of the 2030 Agenda for Sustainable Development [27]. In 2018, the amended Energy Efficiency Directive entered into force in the EU, which sets the main target to increase energy efficiency by at least 32.5% by 2030 [28]. In 2022, in the context of the REPowerEU plan, the European Commission proposed to increase the EU target for energy efficiency by 4% compared to the baseline scenario for 2030. It takes a lot of effort to reach the 2030 targets [29].
Each EU country has its scenario for reducing energy consumption, energy intensity, and energy losses by 2030. However, many problems remain unresolved and unexplored. One of them is significant energy losses in Europe. Energy losses can have negative impacts not only on the environment but also on efficiency [30]. This paper aims to identify the relationship between energy efficiency and selected indicators of energy losses in Europe. The article sets out the hypothesis that there will be no difference in effect on energy efficiency between different indicators of energy losses in Europe. The results make it possible to understand the impact of sustainable governance in these countries on their energy efficiency and security.
This article is logically structured and contains four sections. The second section describes data, variables, and methods of this study. The third section shows the main results and discussion questions of the study. Conclusions are given in the last section of this study.

2. Materials and Methods

2.1. Data

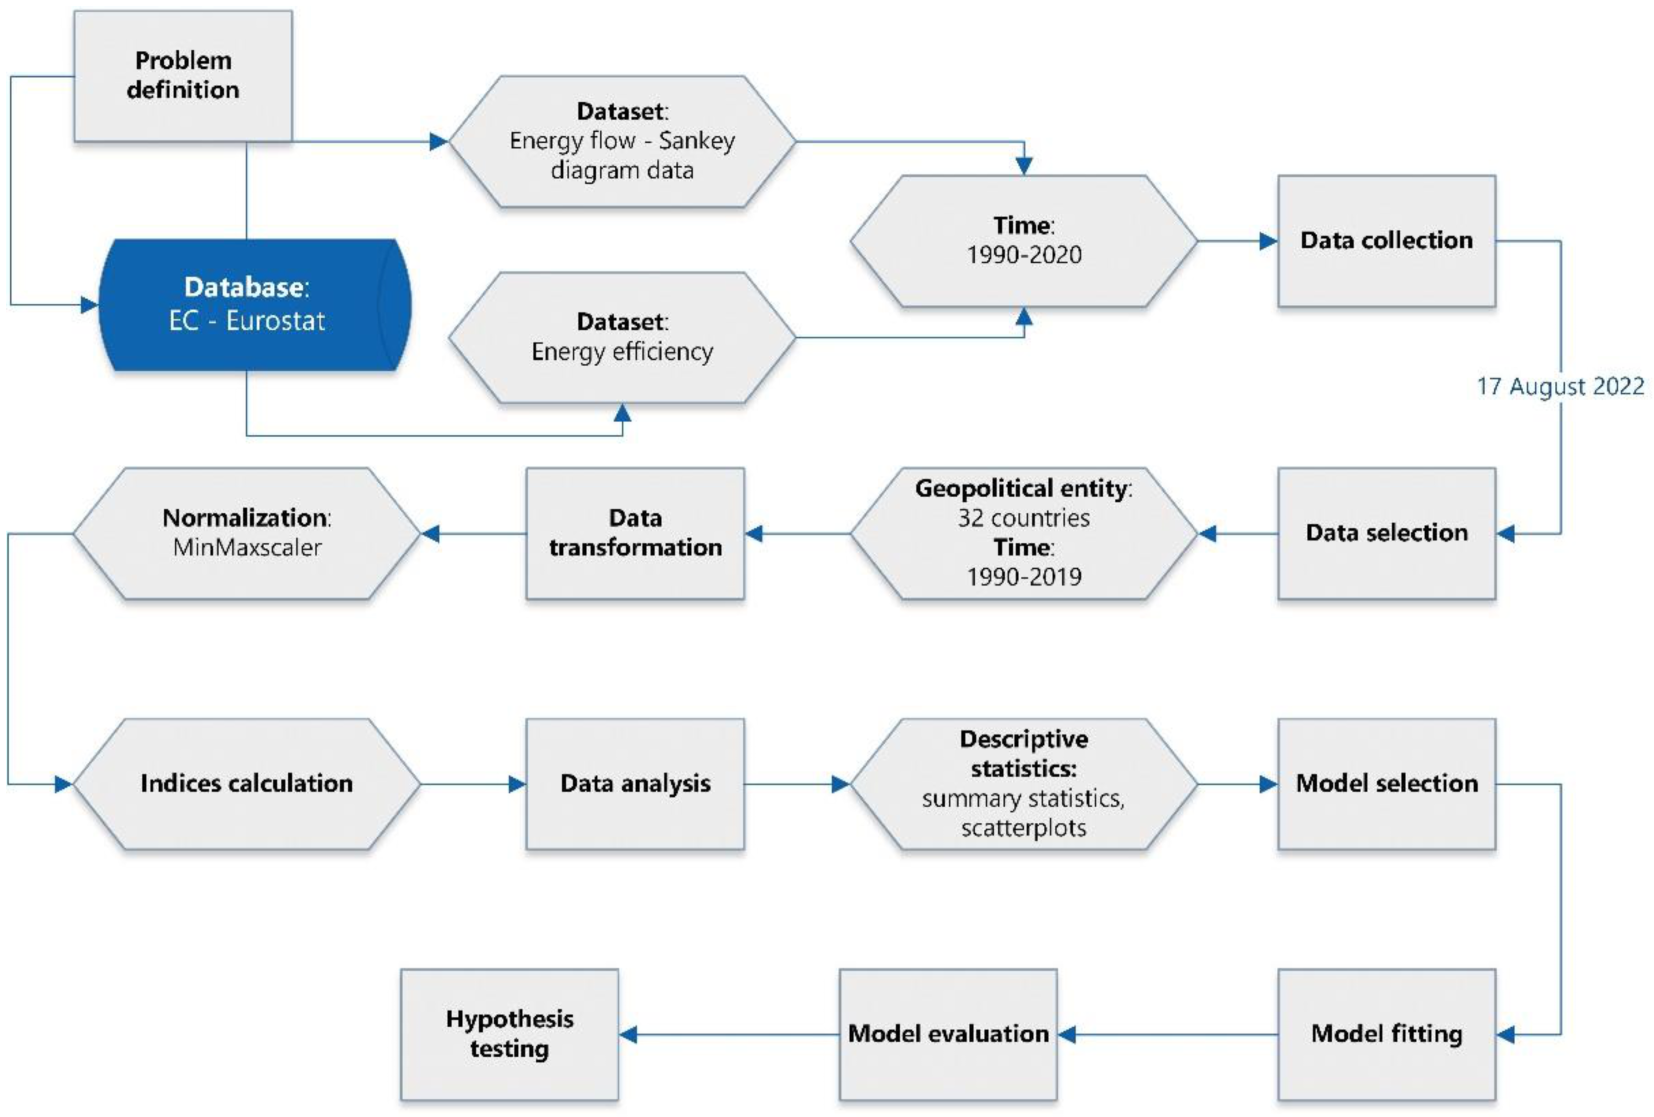
This study analyzed 32 countries belonging to four regions of Europe, considering the availability of data: Eastern, Northern, Southern, and Western Europe. The authors downloaded data on energy losses during the distribution and transformation of energy in Europe on 17 August 2022, from the European Commission—Eurostat database “Energy flow—Sankey diagram data.” In total, this database contains 900,539 values. Annual data from 1990 to 2020 are available in most countries databases. However, the data for 2020 is much more incomplete. Therefore, a 30-year time horizon, from 1990 to 2019, was chosen for this study. The authors could not find data on energy loss during extraction and storage for the specified time horizon.
In general, the database “Energy flow—Sankey diagram data” contains a description of the energy balance components for 42 geopolitical entities. They include all member states of the European Union, EFTA countries, candidate countries, and potential candidate countries, as well as some Energy Community Contracting Parties. However, not all the countries represented in the database were considered in this study due to the partial completeness of the data of these countries according to the selected indicators. Regional groups and non-European countries (Cyprus, Turkey, and Georgia) were also excluded from this study. Figure 1 shows the flowchart diagram of the research process.
In addition, the authors downloaded the energy efficiency indices, the volumes of energy consumption of the energy branch, and its non-energy use in final consumption from the European Commission—Eurostat database.
A description of the model input variables is presented in Table 1. The model variables were normalized using a MinMaxscaler.

2.2. Description of the Variables

To achieve the goals of this study, the authors performed a preliminary statistical description of the variables. The results of the analysis are presented in Table 2. As can be seen from Table 3, the data were smoothed by minimax normalization. The scatterplots of the variables with marginal histograms are presented in Figure 2. Figure 2 shows that the input variables have a characteristic uniform probability distribution.

2.3. Methods

Current energy loss research focuses on determining the impact of various institutional, social, demographic, and economic factors. Multiple models and methods are used in scientific works to confirm this effect (Table 3) empirically.
Based on previous studies [31,37], it is possible to determine energy losses (L) as a function of energy flows (X) for a certain period t (1):
Lt = ∫(Xt),
where Lt is energy loss for a certain period t and Xt is a vector of energy flows {X1, X2, …, Xn} for a certain period t.
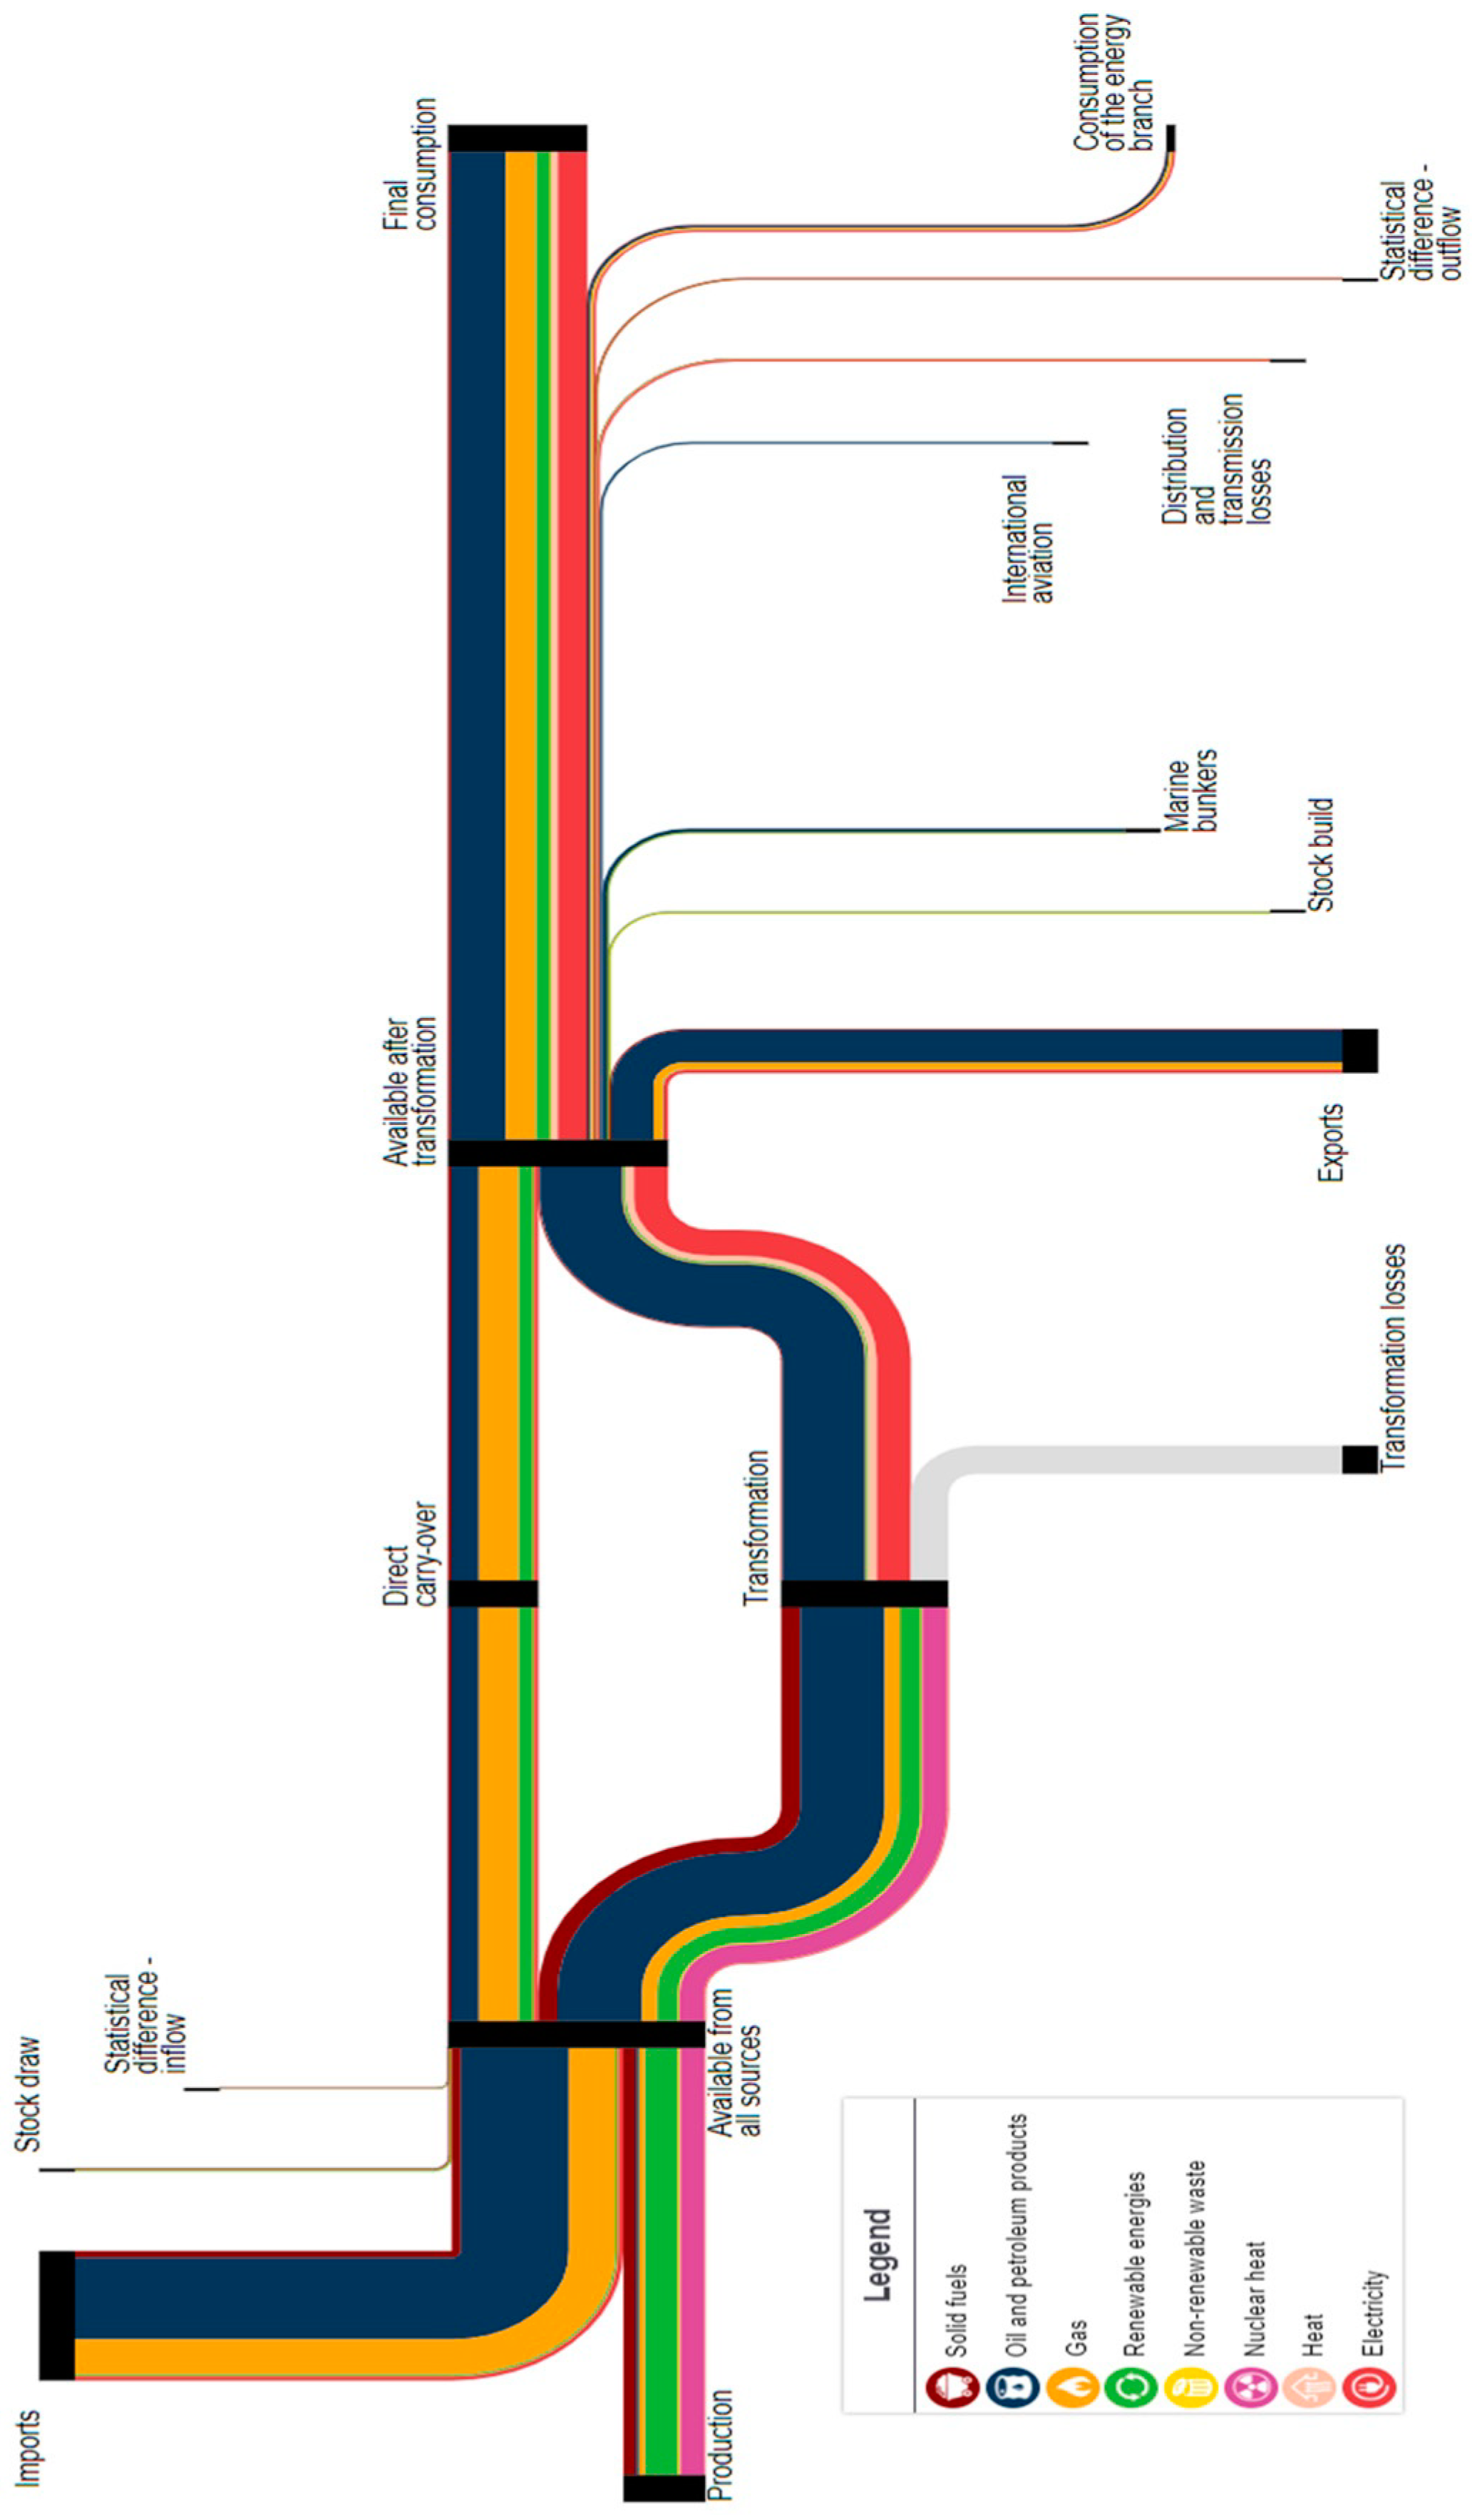
A visual representation of energy flows in the form of a Sankey diagram is available in Appendix A. The authors used the SEEA-Energy methodology in this study to classify energy losses. According to SEEA-Energy [38], all energy losses are divided into four groups (2):
Lt = Let + Ldt + Lst + Ltt,
where Lt is energy loss during extraction for a certain period t; Ldt—energy losses during distribution for a certain period t; Lst—energy losses during storage for a certain period of time t; and Ltt—energy losses during transformation for a certain period of time t.
In addition to energy losses, this study used the shares of energy consumption by the energy sector and its non-energy use in final consumption (in % of available energy from all sources) to indirectly assess energy efficiency.
After reviewing the literature and statistical description of the data, the OLS Model (3) was used for the purposes of the study:
y = Xβ + ε,
where y is the dependent variable; X is a vector of energy flows {X1, X2, …, Xn}; and ε is an error.
The Jarque–Bera test was used to test the normality of the residuals, the Breush–Pagan test was taken for heteroskedasticity tests. Based on the results of using the test, the following hypotheses will be proven:
H0: Homoscedasticity is present.
HA: Heteroscedasticity is present.
The authors performed hypothesis testing, model evaluation, and data visualization using Python programming language libraries.

3. Results and Discussion

In the first stage of the research, the statistical significance of the indicators was analyzed. The descriptive statistics of the values are given in Table 4.
The two variables were excluded from the model considering the p-value in Table 4: CEB and DL. The results of the second stage of optimization are presented in Table 5.
Table 6 shows the main results of model testing. Since the p-value of the Breush–Pagan test is less than α = 0.05, the authors reject the null hypothesis and conclude that the regression model is heteroscedastic.
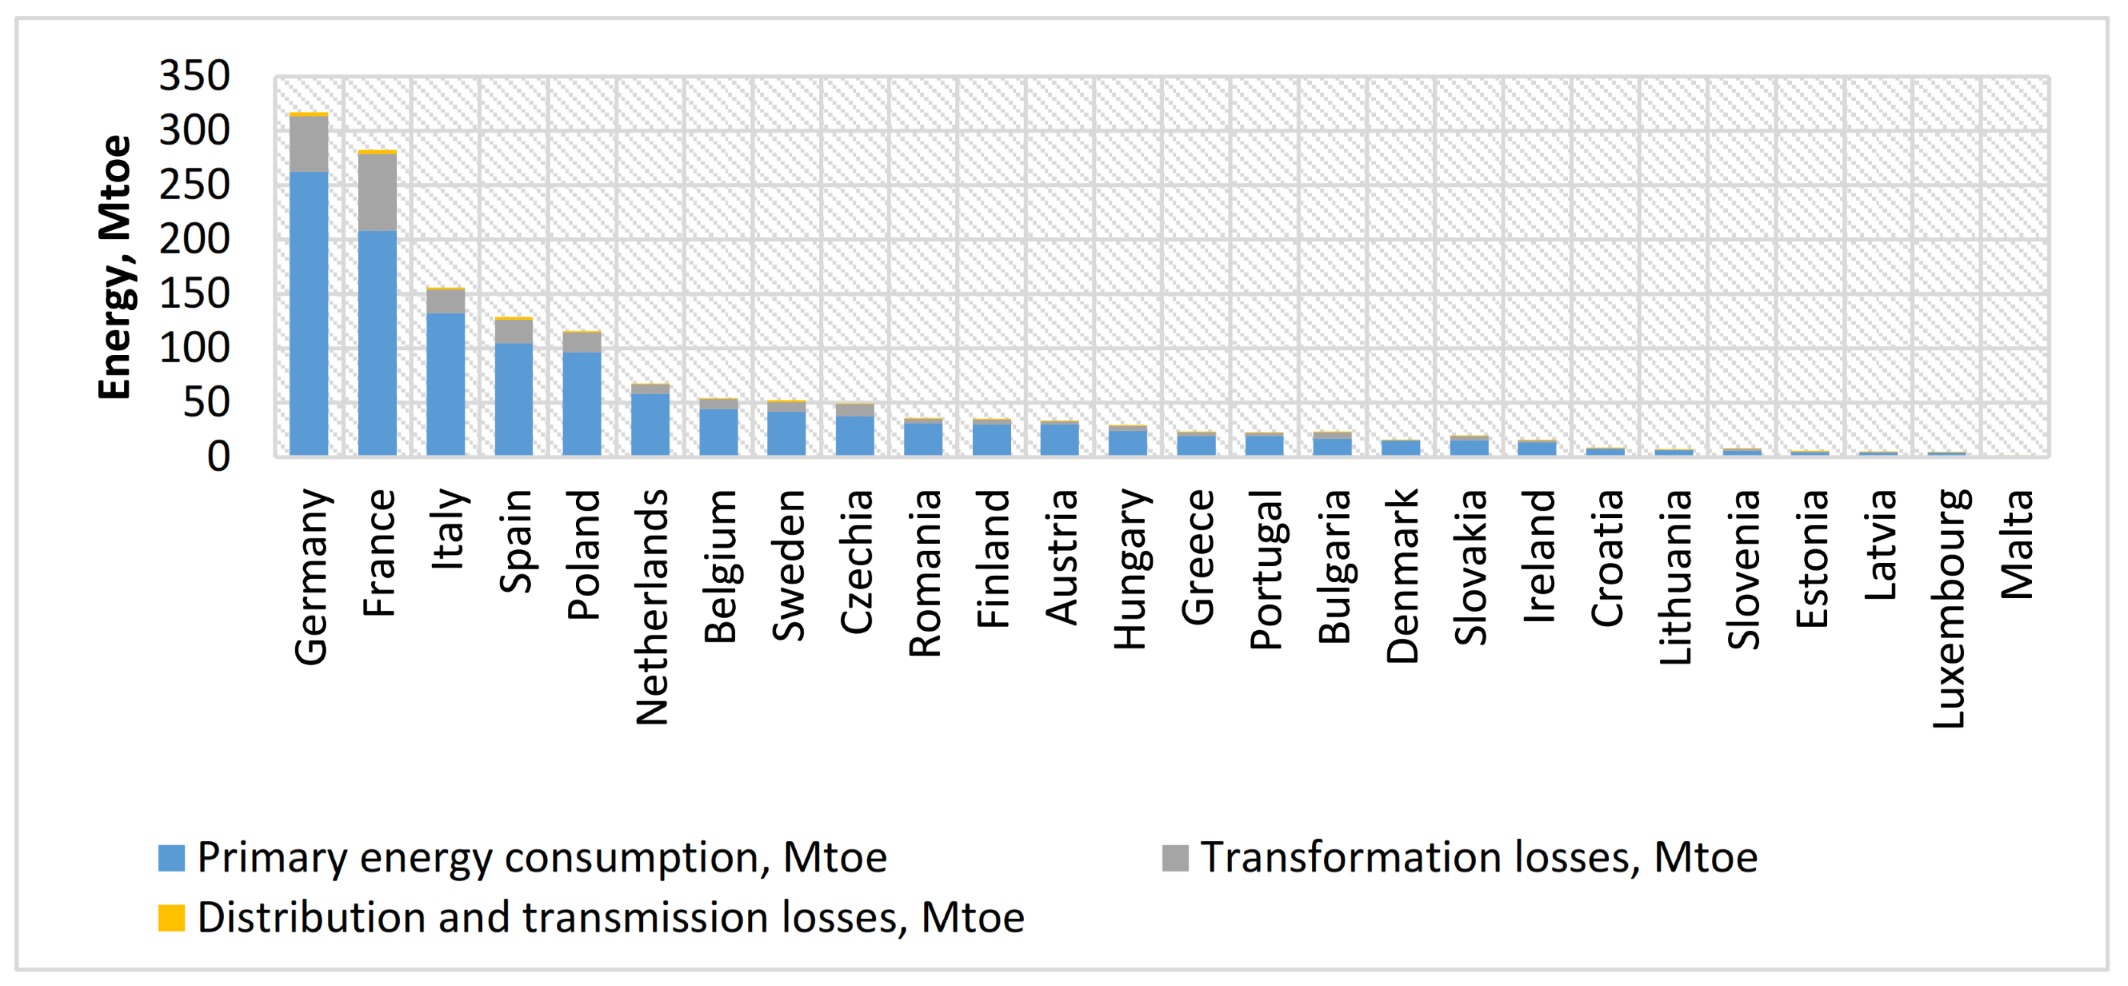
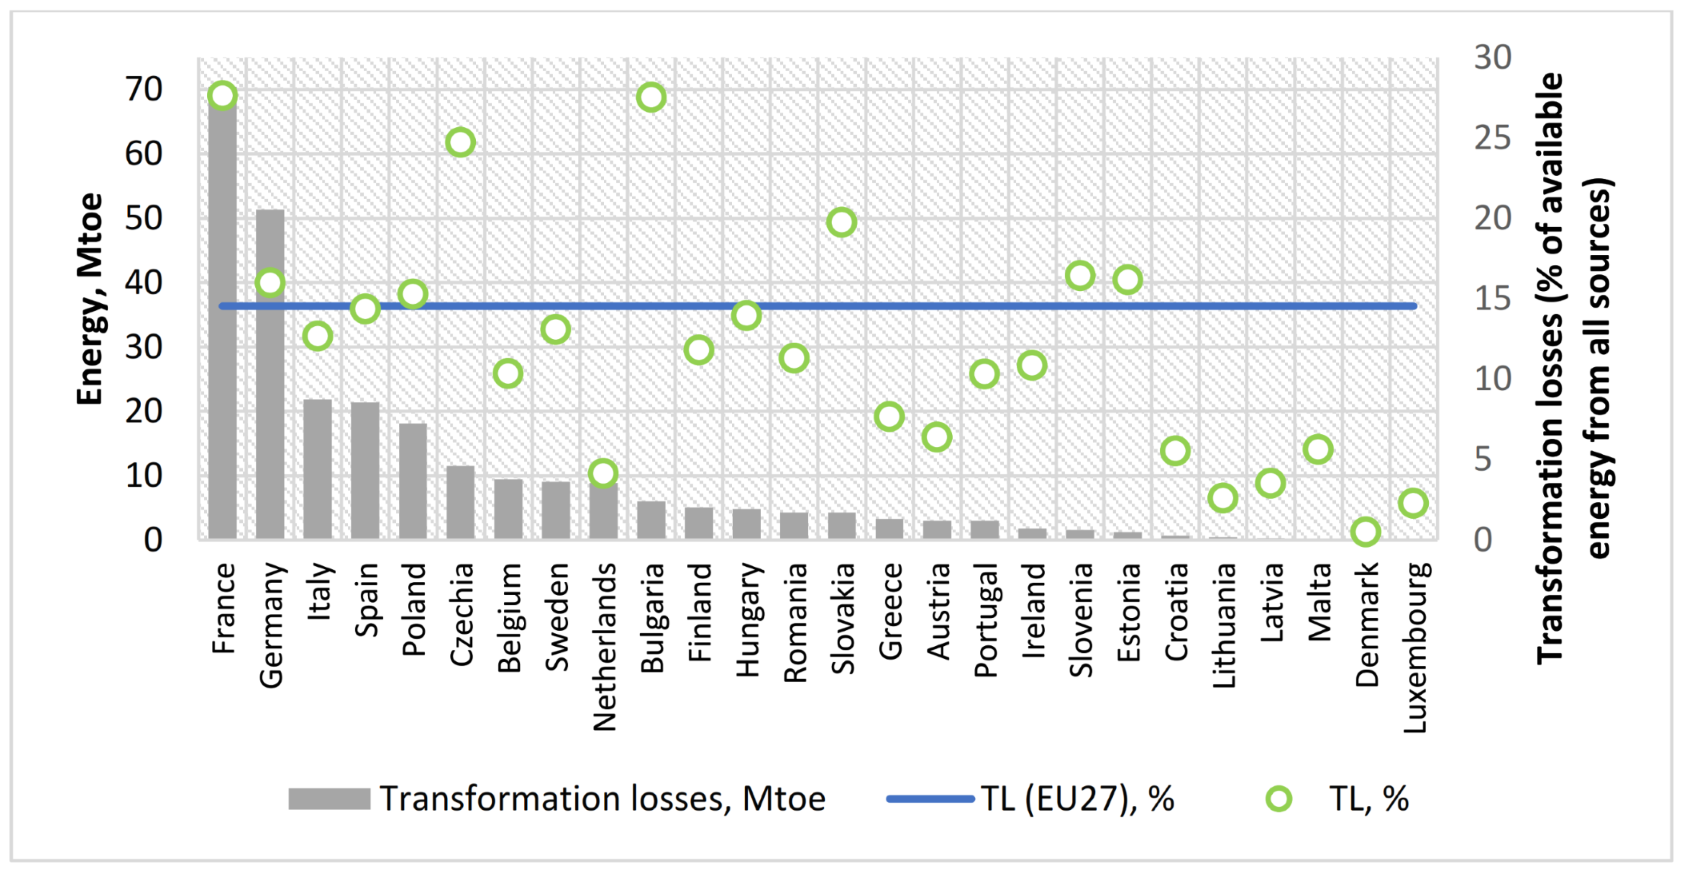
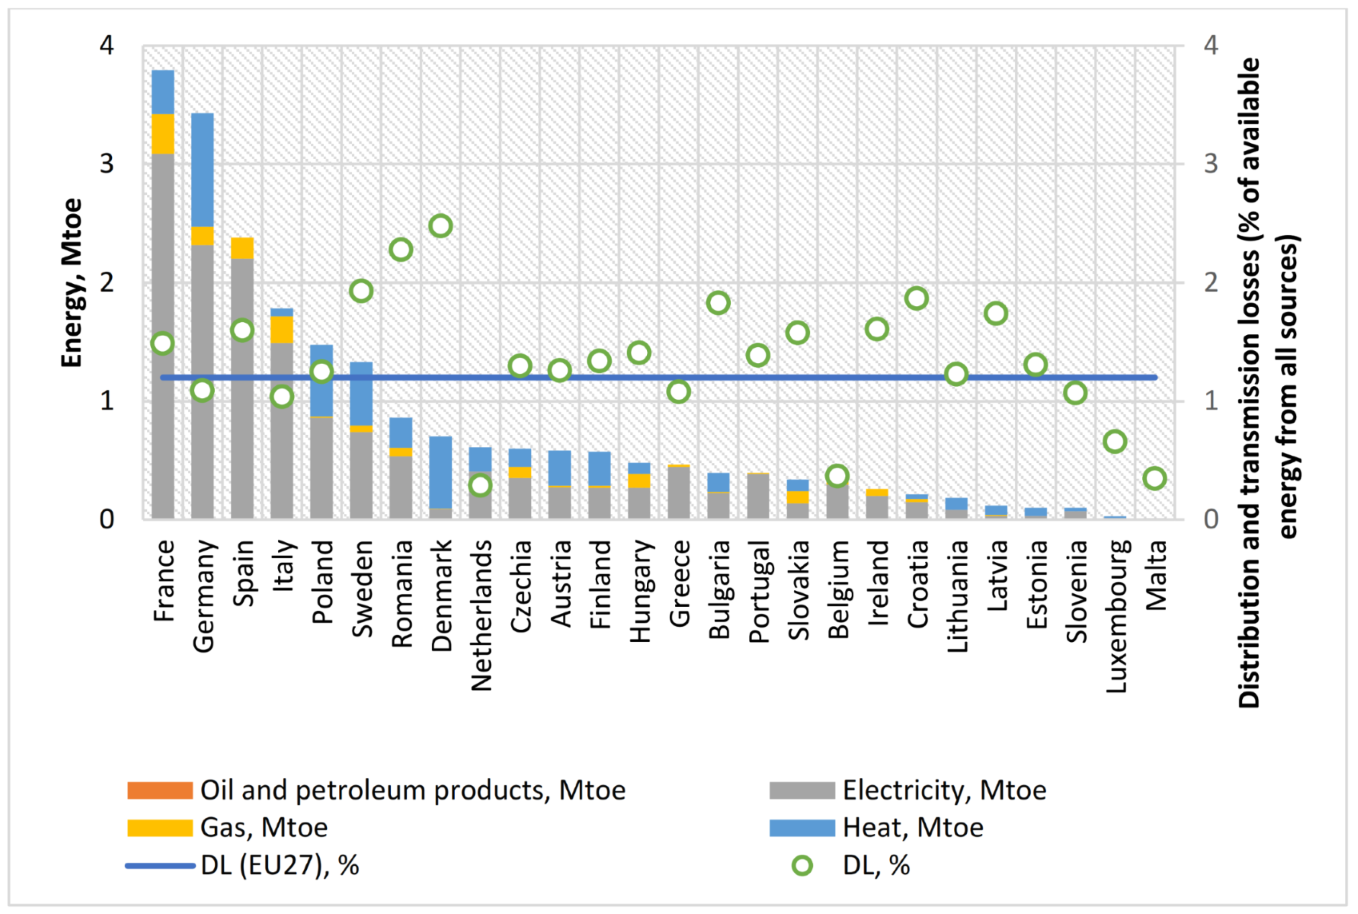
The results clearly show significant heterogeneity between European countries in terms of energy efficiency and energy loss coefficients. Current changes in energy systems aimed at increasing the use of variable renewable energy have far-reaching consequences for all its elements [39,40,41]. Any segments of energy systems face new problems of security, flexibility, and capacity [42,43]. In the future, because of climate change and in the context of the energy transition, the entire electric power infrastructure may become more vulnerable to failures and will require an increase in its long-term security [44]. The energy consumption structure may reveal vulnerabilities and balance issues affecting a country’s energy security [45]. If we consider the case of the EU in 2020, slightly more than 80% of primary energy consumption in the EU-27 was utilized by end users. Although the main electricity losses in the EU have decreased, they are still significant. Thus, losses from the transformation and distribution of electricity amounted to 15.74% in 2020 compared to 20.44% in 1990. Moreover, since 1990, losses from electricity transformation have decreased and those from distribution, on the contrary, have increased in 2020. The share of energy losses during its transformation, distribution, and transmission varies significantly in different countries of Europe (Figure 3) and other countries of the world. According to the research by Shaw-Williams et al., the efficiency of transformation networks is much higher than that of distribution. The authors explain this situation by the fact that when transporting energy over long distances at higher voltages, the efficiency should also be higher [38]. However, empirical data from European countries indicate otherwise. In 2019, in some European countries, more than 42% was lost during energy transformation (Appendix B), while less than 4% was lost during energy distribution. In 2020, the leaders in absolute energy losses from transformation and distribution were five countries: France, Germany, Italy, Spain, and Poland (Figure 4 and Figure 5). It seemed that such data could indicate the inefficiency of the energy sector of these countries. However, not everything is so clear-cut. Given the high share of imports of energy resources in some European countries, these countries will not experience losses from energy generation. Small shares of energy losses during energy transformation can be accompanied by significant energy dependence of European countries due to high shares of energy imports (Figure 6).
Since 1990, there has been a long-term trend of increasing dependence on energy imports in the EU27. The gross available energy in the EU has fallen over the past decades, mainly due to the reduction in the production of solid fossil fuels. The EU imported energy in 2020 by 7.5% more compared to 1990 [46]. Increasing the share of energy imports has allowed many countries to meet established requirements to reduce greenhouse gas emissions. As energy transformation losses are part of the energy-producing country’s transformation sector [47], energy-dependent countries will not suffer significant energy generation losses. Since energy resources are sometimes imported with a high unilateral dependence on individual countries, such as Russia, this leads to the deterioration of energy security in countries [48].
The European Commission has been implementing measures aimed at strengthening the energy security of EU member states and introducing green innovations for a long period [49]. In 2015, the European Commission proposed an energy union project to reduce energy dependence on Russia because of the Russian–Ukrainian gas dispute in 2009. However, the energy networks of the EU member states are still separated. Each country independently determines its energy policy, the structure of the energy system, and the volume of energy imports. Usually, governments are not interested in the idea of an energy union because of the desire to achieve their own national interests. Some countries support strengthening economic and political relations with Russia [50]. However, now, the priorities of European energy policy and security have changed. The world is experiencing an energy crisis due to Russia’s invasion of Ukraine. To mitigate the negative consequences of the crisis, the use of coal and oil in electricity generation is expected to increase in the short term. In 2022, the world production of atomic energy decreased by more than 80 TWh due to a series of shutdown of nuclear power plants [51]. To reduce energy dependence on Russia in the long term, in Europe, there will be additional investments in gas projects. Since natural gas is seen as a source of carbon footprint reduction, such investments should increase energy security and help meet climate goals [52].
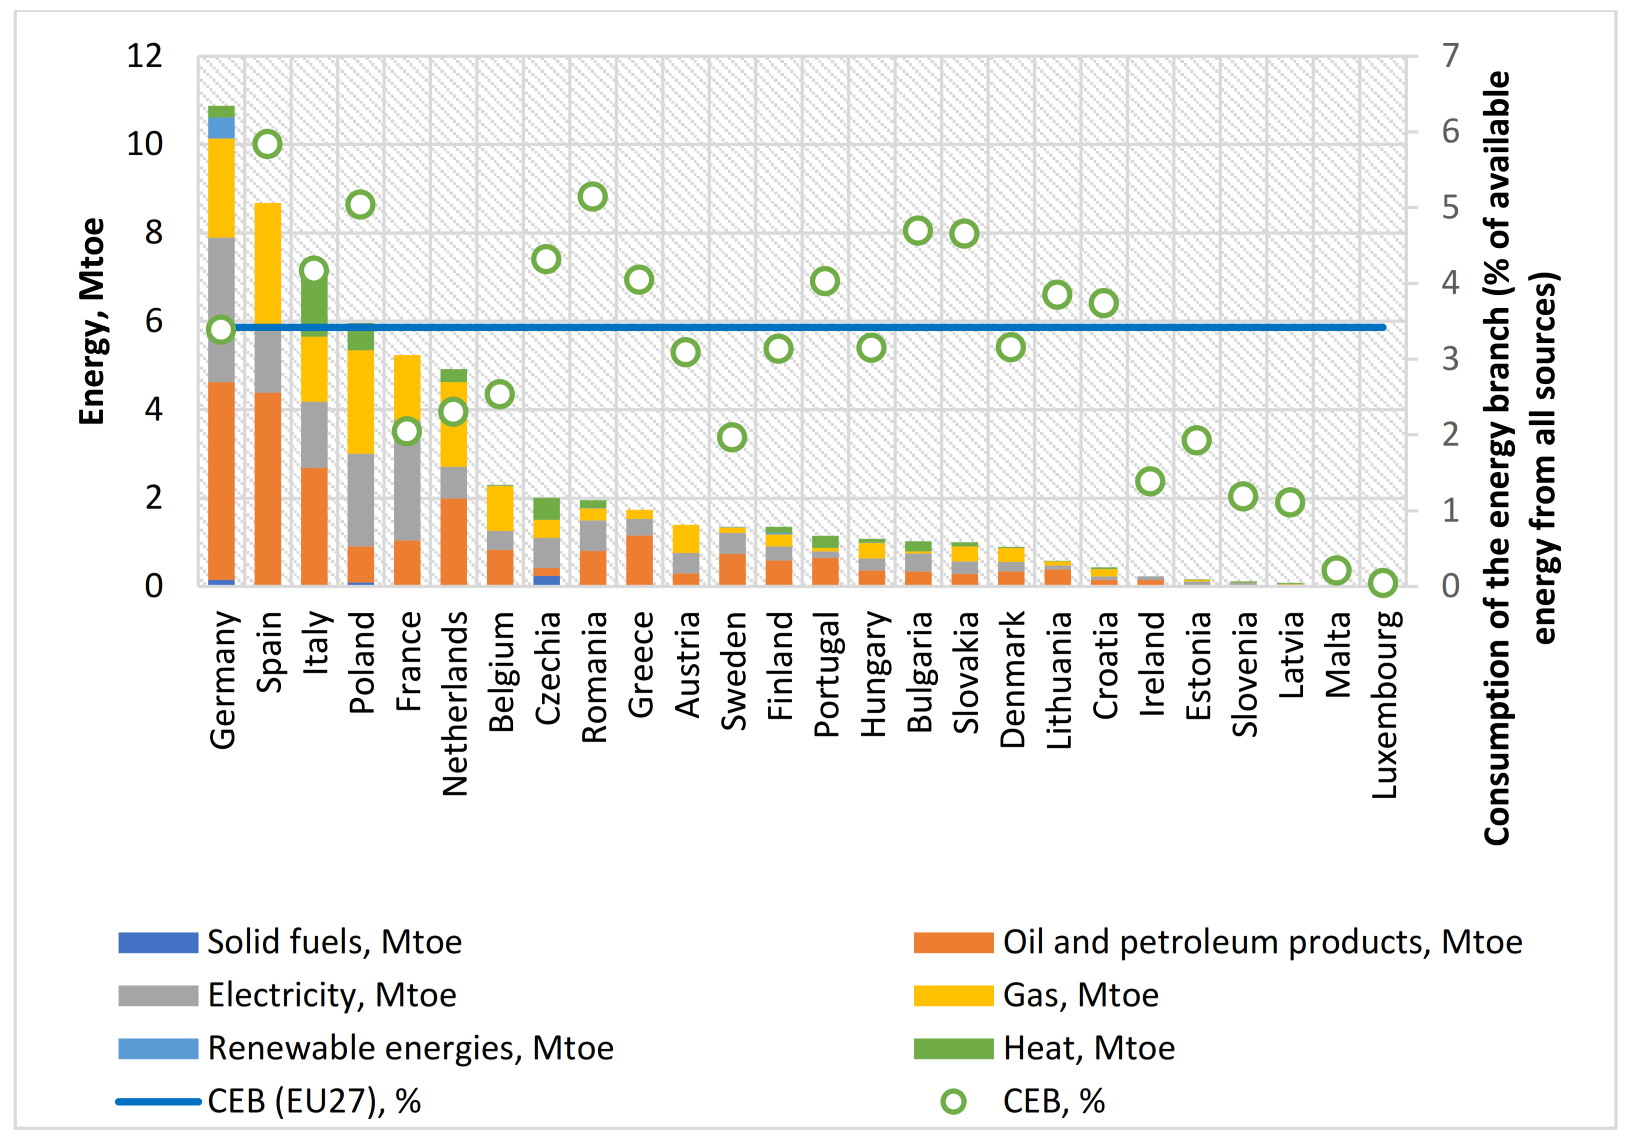
The consumption of electricity by the energy sector has also decreased in the EU-27. In 1990, such electricity consumption was 4.03% compared to 3.42% in 2020. The consumption of the energy branch in 2020 is shown in Figure 7. Energy losses can be technical, that is, due to the technical parameters of energy systems, and non-technical [53,54], that is, energy losses due to theft, fraud, errors in billing, or due to non-payment of energy bills. There is an opinion that non-technical energy losses are more significant for developing countries and less for developed countries [55]. According to Antmann’s work, in developed countries, most of the population can pay the established tariffs for energy resources. Therefore, non-technical energy consumption is minimal [56]. In addition, most high-income countries impose significant fines and prison terms for electricity theft [57]. In developing countries, the situation is not unambiguous [58,59]. Many organizations in the field of electricity (electricity utilities) are efficient and such that they can reduce non-technical energy losses. However, there are also organizations with very high non-technical losses [60]. Savian et al. argue that in countries with an upper-middle income compared to countries with a high-income level, the corruption level among employees of energy distribution companies is also higher. In low-income countries, the possibility of a high level of corruption on the part of inspection agents in the energy field is even more significant [61]. However, there is another point of view on the nature of non-technical costs. According to Car and Thomson, the assumption that the underlying nature of non-technical expenses is due to the accumulation of unpaid bills by the poorest households is a simplification. Their study showed that the largest share of non-technical expenses was caused by the wealthiest customers, large enterprises, and state-owned enterprises [62]. The economic value of energy resources only increases over time. Such value is measured not only and not so much by their price but by enormous indirect consequences. Loss of energy or power outages can lead to health problems [63], loss of environmental safety [64,65,66], and ecological impacts.

4. Conclusions

The analysis of the issues of sustainable management, energy security, and energy losses is essential for understanding the trajectory of the green transition and energy efficiency of European countries. Given the numerous crises in the energy field related to the prices and availability of energy resources, increased attention and publicity will need to be given to the problems of energy losses in the future. It is necessary to develop common standards for regulating energy losses to guarantee European energy security. Building a sustainable pan-European energy system is impossible without all European countries’ effective use of energy resources. Unfortunately, the level of energy efficiency and energy losses varies significantly between countries.
Using the OLS testing of energy efficiency and selected endogenous indicators, the authors investigated variables to explain energy losses in Europe over the last thirty years. The simulation results led to three main conclusions, namely:
1. There is a linear relationship between European energy efficiency and the energy transformation loss index.
2. An increase in distribution losses (% of available energy from all sources) by 1% in Europe leads to an increase in energy consumption by 17.16% under other constant conditions.
3. The test results confirmed the hypothesis of heteroskedasticity of the regression model. The model’s results were checked using the Breush–Pagan and Jarque–Bera tests and showed the adequacy of the model.
Given the significant heterogeneity of the structure of energy losses in European countries, it will be helpful in further research to examine clusters of countries by the level of their energy losses.
Author Contributions

Conceptualization, S.K., T.W., L.S., and T.V.; methodology, Ł.S. and T.W.; software, O.D. and L.S.; validation, S.K., Ł.S., and T.W.; formal analysis, S.K., A.A., and L.S.; resources, S.K., O.D., and T.V.; data curation, S.K., A.A., and T.W.; writing—original draft preparation, S.K., A.A., and T.W.; writing—review and editing, T.V., O.D., L.S., and Ł.S.; visualization, S.K. and L.S.; supervision, T.V. and O.D.; funding acquisition, Ł.S. and T.W. All authors have read and agreed to the published version of the manuscript.

Funding

This research was funded by the Ministry of Education and Science of Ukraine (grant numbers: 0122U000788, 0121U109553, 0120U102001).

Institutional Review Board Statement

Not applicable.

Informed Consent Statement

Not applicable.

Data Availability Statement

The data used in this study are available online on the European Commission website under the Creative Commons Attribution 4.0 International (CC BY 4.0) license. Source: The European Commission website, Eurostat (“Energy flow—Sankey diagram data,” ec.europa.eu/eurostat/, accessed on 17 August 2022); © European Union, 1995–2022.

Acknowledgments

Authors appreciate the copyright holder: © European Union, 1995–2022, as well as the source of the extracted data, the European Commission website, Eurostat @ http://ec.europa.eu/eurostat (accessed on 17 August 2022).

Conflicts of Interest

The authors declare no conflict of interest.

Appendix A

Figure A1. The Eurostat’s Sankey Diagram, 2020 (source: The European Commission website, Eurostat (ec.europa.eu/eurostat/cache/sankey/energy/sankey.html, accessed on 17 August 2022); © European Union, 1995–2022).
Energies 15 08857 g0a1

Appendix B

Table A1. Transformation losses (% of available energy from all sources), 1990–2019 (based on the Eurostat’s data (ec.europa.eu/eurostat/, accessed on 17 August 2022); © European Union, 1995–2022).
TL199019911992199319941995199619971998199920002001200220032004200520062007200820092010201120122013201420152016201720182019
AL8.858.154.087.698.706.284.654.664.943.994.354.293.442.382.893.174.032.821.820.970.500.690.230.060.940.020.350.840.400.75
AT12.6012.6911.1210.7912.0012.4211.7211.8211.0711.029.8110.099.569.849.209.959.349.389.598.579.098.788.048.188.038.197.708.507.577.29
BE18.9118.2817.7317.8717.5417.5116.7617.2516.9917.1115.8814.6014.3514.6613.9014.3314.8314.9013.5913.3513.3013.5012.0612.0010.779.3011.9911.359.0210.89
BG28.3630.0834.4036.2633.3733.6532.2934.8735.5433.4432.5635.2235.1933.9131.2532.1530.7530.0828.3029.3330.0431.9629.2627.3928.4827.2926.7127.0728.0127.11
HR6.095.027.897.495.335.156.506.977.887.796.737.648.618.546.696.376.567.966.825.815.055.535.585.254.634.675.324.834.234.91
CZ18.9121.0021.6422.5123.4923.7223.7522.4123.1723.0823.7524.3425.1926.1926.2625.9925.9426.8026.0625.8025.6225.5425.9925.7425.9424.9424.9424.6325.6924.54
DK10.3412.5510.019.6710.739.2112.689.318.496.955.766.216.137.745.664.927.256.526.216.346.114.803.424.173.652.092.191.681.800.63
EE25.3524.3029.9625.0626.8328.8827.8327.7331.5132.1431.2528.8927.9328.7529.9028.5925.9426.3827.7326.7633.3135.4427.5329.6329.8026.0725.7927.4027.6719.09
FI15.5815.7313.4115.7315.4316.5617.8917.6515.9716.2717.0118.6518.4519.9219.6117.0819.2817.6515.9815.6116.7215.5514.2414.5714.2914.1813.3712.1912.3512.12
FR25.3625.7425.2626.3226.0526.9626.8026.5226.4026.4526.3626.1427.4627.8327.9128.4628.4928.5227.5227.8928.8928.9328.7028.4729.3529.1728.0427.7928.0627.31
DE23.3923.7823.2122.6022.5322.2422.0222.1821.6121.8221.7322.3822.2522.5321.7421.2221.4822.0921.4320.8720.9620.3920.6319.8719.8119.0018.6617.6218.4016.60
EL17.4017.5917.5418.4417.1917.0415.7017.1517.2218.3918.1718.5718.2117.2717.1217.6315.8716.8016.6116.5015.6316.2915.6414.4812.6210.308.149.779.488.63
HU20.1421.0922.6620.7820.5321.1920.5321.0820.7921.2520.5520.2219.1918.2618.7318.2717.5920.0219.1718.4519.3418.7318.4916.2215.6016.2315.5113.9813.5212.13
IS31.6129.3624.6227.4227.2226.9528.9626.8528.0932.2535.5033.4433.0533.2030.3830.7239.4744.2742.7944.9548.4551.7749.0649.2948.6443.3238.0938.8440.7342.68
IE17.2018.4819.2319.7119.4317.9119.2618.7619.0219.0517.3818.8417.7316.6316.1116.0114.1215.3014.1714.7114.3713.5114.4112.8413.3112.3913.5712.4511.1310.79
IT12.9213.7512.9112.5212.7415.8915.0615.1615.2515.7616.5215.7615.9516.4816.8015.5216.1815.8015.1313.8914.1514.6714.1713.2713.6113.4813.5012.8012.2412.20
LV9.608.467.616.815.705.895.435.534.665.124.904.544.273.963.603.283.042.983.402.853.373.162.944.163.613.993.733.444.234.24
LT15.9919.4625.3921.2718.3322.0024.0820.6921.1320.6417.5218.2720.4920.3818.0414.1012.9215.2912.7914.394.393.273.342.832.882.502.281.941.921.41
LU15.9415.1614.4413.8412.489.307.965.272.072.092.202.995.954.955.245.075.355.124.395.295.414.584.883.483.713.032.122.041.951.87
MT51.2939.8936.1449.8144.8537.4344.0835.2941.1837.7522.3828.0727.3926.2323.4326.2525.0523.9122.1118.9916.4817.5519.4513.9313.545.653.934.814.234.33
NL6.166.036.126.186.296.426.106.266.566.225.946.166.126.396.075.745.295.605.265.215.014.714.564.194.604.524.414.393.884.05
MK29.5932.6333.4032.8532.9232.5430.2929.3535.0832.0631.0433.9329.8429.1130.4527.6628.2928.9328.6028.0925.7626.2326.6824.6323.7521.7719.7322.5420.2822.41
PL23.1423.4423.5121.2921.0719.9319.5918.4819.0819.6121.0820.2920.0920.5020.0019.9220.2820.1819.9219.2319.0720.0019.5019.4819.3818.6717.8517.5516.6415.74
PT8.3212.0112.7011.599.0214.0911.5011.5212.7615.4513.8113.2514.7312.0312.4813.6212.0111.7312.0512.9510.5311.8712.7110.6211.2012.0111.6413.2612.5110.41
RO21.4823.1319.3719.0418.5018.8119.0917.3215.2915.9516.8415.4016.8518.3216.2813.6415.5617.3217.2815.1813.5415.3016.5813.9413.2914.0812.7213.3713.1712.33
RS35.0535.8242.8843.0641.0249.5639.2939.1838.8438.6441.2437.4436.4136.4434.6832.5133.2126.2126.7529.4728.4529.9429.6930.1926.8729.7628.9429.2528.2228.46
SK19.1821.3721.0224.9825.6926.1424.1623.4321.5123.9022.2122.0822.1623.4021.8320.9421.1018.8120.6019.7720.8820.4522.3521.4521.0120.8120.7819.8719.9918.40
SI28.1526.6427.8126.9126.2726.1723.6324.7625.2722.0420.9922.5924.9122.6021.9621.5521.2122.0821.0320.0719.2720.9419.2418.8217.7015.6514.8415.4814.6314.29
ES19.0317.9719.3417.4017.6320.5219.4919.5418.5820.4819.8418.9920.3519.0618.9618.3918.4718.1817.4816.1815.7816.9517.6715.8315.9216.9115.6716.6315.2414.34
SE21.6022.6615.5816.2320.2318.8420.0218.5519.1118.4915.2619.7020.7621.2822.8521.4420.7120.7319.3315.7117.1317.2417.3018.6918.1916.2315.4015.1816.7618.16
UA24.8427.4426.8231.5029.9431.4528.7728.8630.9630.9733.2031.1030.3833.8029.8627.8628.6428.1426.7727.6426.3828.0229.6329.8529.9134.7932.6132.6634.0433.46
UK17.6016.7216.9216.0315.7715.3015.1214.8814.7614.4414.3115.0414.8615.6215.2516.1516.6216.2115.7815.2615.2815.8216.2915.8715.3013.9812.6911.7811.0810.96

References

  1. Briseño, H.; Rojas, O. Factors associated with electricity theft in Mexico. Int. J. Energy Econ. Policy 2020, 10, 250–254. [Google Scholar] [CrossRef]
  2. Cenuşǎ, M.; Poienar, M.; Milici, D.L. Study of a system for reducing electricity losses. In Proceedings of the 2018 International Conference on Development and Application Systems (DAS), Suceava, Romania, 24–26 May 2018; pp. 43–46. [Google Scholar] [CrossRef]
  3. Hrytsenko, L.; Petrushenko, M.; Daher, K. The necessity of socio-ecological modification of two-tier economic model of secondary resources management in Ukraine. Socio-Econ. Chall. 2017, 1, 68–76. [Google Scholar] [CrossRef] [Green Version]
  4. Borysiak, O.; Wołowiec, T.; Gliszczyński, G.; Brych, V.; Dluhopolskyi, O. Smart transition to climate management of the green energy transmission chain. Sustainability 2022, 14, 11449. [Google Scholar] [CrossRef]
  5. Taliento, M.; Netti, A. Corporate Social/Environmental Responsibility and Value Creation: Reflections on a Modern Business Management Paradigm. Bus. Ethics Leadersh. 2020, 4, 123–131. [Google Scholar] [CrossRef]
  6. Sotnyk, I.; Shvets, I.; Momotiuk, L.; Chortok, Y. Management of renewable energy innovative development in Ukrainian households: Problems of financial support. Mark. Manag. Innov. 2018, 4, 150–160. [Google Scholar] [CrossRef]
  7. Kasych, A.; Vochozka, M. Theoretical and methodical principles of managing enterprise sustainable development. Mark. Manag. Innov. 2017, 2, 298–305. [Google Scholar] [CrossRef] [Green Version]
  8. Kuzior, A.; Postrzednik-Lotko, K.A.; Postrzednik, S. Limiting of carbon dioxide emissions through rational management of pro-ecological activities in the context of CSR assumptions. Energies 2022, 15, 1825. [Google Scholar] [CrossRef]
  9. Chygryn, O.; Krasniak, V. Theoretical and applied aspects of the development of environmental investment in Ukraine. Mark. Manag. Innov. 2015, 3, 226–234. [Google Scholar] [CrossRef]
  10. Serpeninova, Y.S.; Makarenko, I.; Plastun, A.; Babko, A.; Gasimova, G. Mapping of the responsible investments instruments in sdg 3 ‘good health and well-being’ financing: EU and US experience. Health Econ. Manag. Rev. 2020, 1, 106–115. [Google Scholar] [CrossRef]
  11. El Amri, A.; Boutti, R.; Rodhain, F. Sustainable Finance at the time of Institutions: Performativity through the lens of Responsible Management in Morocco. Financ. Mark. Inst. Risks 2020, 4, 52–64. [Google Scholar] [CrossRef]
  12. Lyeonov, S.; Bilan, S.; Yarovenko, H.; Ostasz, G.; Kolotilina, O. Country’s health profile: Social, economic, behavioral and healthcare determinants. Econ. Sociol. 2021, 14, 322–340. [Google Scholar] [CrossRef]
  13. Bilan, Y.; Srovnalã-KovÃi, P.; Streimikis, J.; Lyeonov, S.; Tiutiunyk, I.; Humenna, Y. From shadow economy to lower carbon intensity: Theory and evidence. Int. J. Glob. Environ. Issues 2020, 19, 196–216. Available online: http://www.inderscience.com/ijgenvi (accessed on 20 June 2022). [CrossRef]
  14. Tiutiunyk, I.V.; Zolkover, A.O.; Lyeonov, S.V.; Ryabushka, L.B. The impact of economic shadowing on social development: Challenges for macroeconomic stability. Nauk. Visnyk Natsionalnoho Hirnychoho Universytetu 2022, 1, 183–191. [Google Scholar] [CrossRef]
  15. Lyulyov, O.; Lyeonov, S.; Tiutiunyk, I.; Podgórska, J. The impact of tax gap on macroeconomic stability: Assessment using panel VEC approach. J. Int. Stud. 2021, 14, 139–152. [Google Scholar] [CrossRef]
  16. Tenytska, I.; Palienko, M. Environmental Taxes Impact on the Population Health Protection: Cross-Country Analysis. Health Econ. Manag. Rev. 2021, 2, 78–86. [Google Scholar] [CrossRef]
  17. Vysochyna, A.; Samusevych, Y.; Starchenko, L. Convergence trends of environmental taxation in European countries. E3S Web Conf. 2020, 202, 03031. [Google Scholar] [CrossRef]
  18. Štreimikienė, D.; Samusevych, Y.; Bilan, Y.; Vysochyna, A.; Sergi, B.S. Multiplexing efficiency of environmental taxes in ensuring environmental, energy, and economic security. Environ. Sci. Pollut. Res. 2022, 29, 7917–7935. [Google Scholar] [CrossRef] [PubMed]
  19. Samusevych, Y.; Maroušek, J.; Kuzmenko, O.; Streimikis, J.; Vysochyna, A. Environmental taxes in ensuring national security: A structural optimization model. J. Int. Stud. 2021, 14, 292–312. [Google Scholar] [CrossRef]
  20. Khonjelwayo, B.; Nthakheni, T. Determining the causes of electricity losses and the role of management in curbing them: A case study of city of Tshwane metropolitan municipality, South Africa. J. Energy S. Afr. 2021, 32, 45–57. [Google Scholar] [CrossRef]
  21. Sidor, K.; Miller, P.; Pijarski, P. Application of network configuration optimization to reduce costs of electricity loss. [Zastosowanie optymalizacji konfiguracji sieci do redukcji kosztów strat energii elektrycznej]. Prz. Elektrotechniczny 2019, 95, 110–113. [Google Scholar] [CrossRef]
  22. López-Cariboni, S. Electricity losses and political regimes in latin america. [Pérdidas de energía eléctrica y regímenes políticos en América Latina]. J. Glob. Compet. Gov. 2018, 12, 109–119. [Google Scholar] [CrossRef]
  23. Lyulyov, O.; Pimonenko, T.; Kwilinski, A.; Us, Y. The heterogeneous effect of democracy, economic and political globalization on renewable energy. E3S Web Conf. 2021, 250, 03006. [Google Scholar] [CrossRef]
  24. Lyulyov, O.; Vakulenko, I.; Pimonenko, T.; Kwilinski, A.; Dzwigol, H.; Dzwigol-Barosz, M. Comprehensive Assessment of Smart Grids: Is There a Universal Approach? Energies 2021, 14, 3497. [Google Scholar] [CrossRef]
  25. Vakulenko, I.; Saher, L.; Lyulyov, O.; Pimonenko, T. A Systematic Literature Review of Smart Grids. In Proceedings of the 1st Conference on Traditional and Renewable Energy Sources: Perspectives and Paradigms for the 21st Century, Prague, Czech Republic, 22–23 January 2021; Volume 250. [Google Scholar] [CrossRef]
  26. Kwilinski, A.; Lyulyov, O.; Dzwigol, H.; Vakulenko, I.; Pimonenko, T. Integrative Smart Grids’ Assessment System. Energies 2022, 15, 545. [Google Scholar] [CrossRef]
  27. UN. Transforming Our World: The 2030 Agenda for Sustainable Development; UN General Assembly. 2015. Available online: https://sdgs.un.org/2030agenda (accessed on 20 June 2022).
  28. Directive (EU) 2018/2002 of the European Parliament and of the Council of 11 December 2018 Amending Directive 2012/27/EU on Energy Efficiency. Document 32018L2002. Available online: http://data.europa.eu/eli/dir/2018/2002/oj (accessed on 20 June 2022).
  29. European Commission Website, Energy Efficiency Targets. 2022. Available online: https://energy.ec.europa.eu/topics/energy-efficiency/energy-efficiency-targets-directive-and-rules/energy-efficiency-targets_en (accessed on 20 June 2022).
  30. Acar, P.; Berk, I. Power infrastructure quality and industrial performance: A panel data analysis on OECD manufacturing sectors. Energy 2022, 239, 122277. [Google Scholar] [CrossRef]
  31. Costa-Campi, M.T.; Daví-Arderius, D.; Trujillo-Baute, E. The economic impact of electricity losses. Energy Econ. 2018, 75, 309–322. [Google Scholar] [CrossRef] [Green Version]
  32. Briseño, H.; Rojas, O. Factors Associated with Electricity Losses: A Panel Data Perspective. Int. J. Energy Econ. Policy 2020, 10, 281–286. [Google Scholar] [CrossRef]
  33. Chen, X.; Song, C.; Wang, T. Analysis of electricity loss and electricity consumption law in low-voltage areas: A case study. J. Phys. Conf. Ser. 2021, 2022, 012016. [Google Scholar] [CrossRef]
  34. Briseño, H.; Rubiano, J.; García, R.; Rojas, O. Factors associated with electricity losses in Colombia. Int. J. Energy Econ. Policy 2021, 11, 465–470. [Google Scholar] [CrossRef]
  35. Yotov, K.; Hadzhikolev, E.; Hadzhikoleva, S. Model for forecasting of electricity losses during transmission and distribution in an electricity system. Int. J. Eng. Trends Technol. 2021, 69, 93–98. [Google Scholar] [CrossRef]
  36. Jawad, Y.A.; Ayyash, I. Analyze the loss of electricity in Palestine case study: Ramallah and Al-Bireh governorate. Int. J. Energy Econ. Policy 2020, 10, 7–15. [Google Scholar] [CrossRef]
  37. Arnaud, D.; Eon, S. The effect of electricity losses on GDP in Benin. MPRA Paper 2018, 89545, 1–48. Available online: https://mpra.ub.uni-muenchen.de/89545 (accessed on 20 June 2022).
  38. United Nations. System of Environmental-Economic Accounting for Energy; SEEA Energy, Statistical Papers 2019, Series F, 116, E17.XVII.12; United Nations: New York, NY, USA, 2019. [Google Scholar]
  39. Us, Y.; Pimonenko, T.; Lyulyov, O. Energy efficiency profiles in developing the free-carbon economy: On the example of Ukraine and the V4 countries. Polityka Energetyczna 2021, 23, 49–66. [Google Scholar] [CrossRef]
  40. Lyeonov, S.; Pimonenko, T.; Chygryn, O.; Reznik, O.; Gaynulina, R. Green brand as a marketing instrument: Principle, features and parameters. Int. J. Glob. Energy Issues 2021, 43, 147–165. [Google Scholar] [CrossRef]
  41. Kuzior, A.; Kwilinski, A.; Hroznyi, I. The factorial-reflexive approach to diagnosing the executors’ and contractors’ attitude to achieving the objectives by energy supplying companies. Energies 2021, 14, 2572. [Google Scholar] [CrossRef]
  42. Chygryn, O.; Lyulyov, O.; Pimonenko, T.; Mlaabdal, S. Efficiency of oil-production: The role of institutional factors. Eng. Manag. Prod. Serv. 2020, 12, 92–104. [Google Scholar] [CrossRef]
  43. Kuzior, A.; Staszek, M. Energy management in the railway industry: A case study of rail freight carrier in Poland. Energies 2021, 14, 6875. [Google Scholar] [CrossRef]
  44. IEA, Analytical Frameworks for Electricity Security 2021, Paris. 2021. Available online: https://www.iea.org/reports/analytical-frameworks-for-electricity-security (accessed on 20 June 2022).
  45. Kolosok, S.; Myroshnychenko, I.; Zakharkina, L. Open data in electrical energy balancing of ukraine: Green deal and security aspects. In Proceedings of the 16th International Conference on ICT in Research, Education and Industrial Applications, Kharkiv, Ukraine, 16–20 October 2020; Volume 2732, pp. 270–281. Available online: http://ceur-ws.org/Vol-2732/20200270.pdf (accessed on 20 June 2022).
  46. Eurostat. Energy Statistics—An Overview, EC Webcite. 2022. Available online: https://ec.europa.eu/eurostat/statistics-explained/index.php?title=Energy_statistics_-_an_overview#Final_energy_consumption (accessed on 20 June 2022).
  47. Eurostat. Energy Efficiency Statistics, EC Webcite. 2022. Available online: https://ec.europa.eu/eurostat/statistics-explained/index.php?title=Energy_efficiency_statistics#Primary_energy_consumption_and_distance_to_2020_and_2030_targets (accessed on 20 June 2022).
  48. Fischedick, M. Energieversorgungsrisiken, Energiepreiskrise und Klimaschutz erfordern gemeinsame Antworten. Wirtschaftsdienst 2022, 102, 262–269. [Google Scholar] [CrossRef]
  49. Kolosok, S.; Vasylieva, T.; Lyeonov, S. Machine analysis of the UK electrical energy initiatives based on the e-petitions tothe UK government and parliament. In Proceedings of the CEUR Workshop Proceedings, Lviv, Ukraine, 22–23 April 2021; Volume 2870, pp. 1562–1573. Available online: http://ceur-ws.org (accessed on 20 June 2022).
  50. Pach-Gurgul, A.; Piwowarski, J. Axiological, Economic and Legal Challenges for the Functioning of the Energy Union. In Security and Defence: Ethical and Legal Challenges in the Face of Current Conflicts. Advanced Sciences and Technologies for Security Applications; Cayón Peña, J., Ed.; Springer: Cham, Switzerland, 2022. [Google Scholar] [CrossRef]
  51. IEA. Defying Expectations, CO2 Emissions from Global Fossil Fuel Combustion Are Set to Grow in 2022 by Only a Fraction of Last Year’s Big Increase 2022. Available online: https://www.iea.org/news/defying-expectations-co2-emissions-from-global-fossil-fuel-combustion-are-set-to-grow-in-2022-by-only-a-fraction-of-last-year-s-big-increase?utm_medium=Email&utm_campaign=IEA+newsletters&utm_source=SendGrid (accessed on 20 June 2022).
  52. Simmons, R.K. Natural Gas—Demand for Security, Energy Transition, and Reliability. J. Struct. Financ. 2022, 28, 25–32. [Google Scholar] [CrossRef]
  53. Shaw-Williams, D.; Susilawati, C.; Walker, G.; Varendorff, J. Valuing the impact of residential photovoltaics and batteries on network electricity losses: An Australian case study. Util. Policy 2019, 60, 100955. [Google Scholar] [CrossRef]
  54. Pleskach, B. Estimation of Hidden Energy Losses. In Electric Power Conversion and Micro-Grids; Nayeripour, M., Mansouri, M., Eds.; IntechOpen: London, UK, 2021. [Google Scholar] [CrossRef]
  55. De Oliveira Ventura, L.; Melo, J.D.; Padilha-Feltrin, A.; Fernández-Gutiérrez, J.P.; Sánchez Zuleta, C.C.; Piedrahita Escobar, C.C. A new way for comparing solutions to non-technical electricity losses in South America. Util. Policy 2020, 67, 101113. [Google Scholar] [CrossRef]
  56. Aydin, Z.; Gungor, V.C. A Novel Feature Design and Stacking Approach for Non-Technical Electricity Loss Detection. In Proceedings of the 2018 IEEE Innovative Smart Grid Technologies—Asia (ISGT Asia), Singapore, 22–25 May 2018. [Google Scholar] [CrossRef]
  57. Antmann, P. Reducing Technical and Non-Technical Losses in the Power Sector; World Bank: Washington, DC, USA, 2009; Available online: https://openknowledge.worldbank.org/handle/10986/20786 (accessed on 20 June 2022).
  58. Dluhopolskyi, O.; Brych, V.; Borysiak, O.; Fedirko, M.; Dziubanovska, N. Modeling the environmental and economic effect of value added created in the energy service market. Polityka Energetyczna 2021, 24, 153–168. [Google Scholar] [CrossRef]
  59. El Amri, A.; Boutti, R.; Oulfarsi, S.; Rodhain, F.; Bouzahir, B. Carbon financial markets underlying climate risk management, pricing and forecasting: Fundamental analysis. Financ. Mark. Inst. Risks 2020, 4, 31–44. [Google Scholar] [CrossRef]
  60. Kaya, H.D. Government Support, Entrepreneurial Activity and Firm Growth. Socio-Econ. Chall. 2019, 3, 5–12. [Google Scholar] [CrossRef] [Green Version]
  61. Savian, F.S.; Siluk, J.C.M.; Garlet, T.B.; Nascimento, F.M.; Pinheiro, J.R.; Vale, Z. Non-technical losses: A systematic contemporary article review. Renew. Sustain. Energy Rev. 2021, 147, 111205. [Google Scholar] [CrossRef]
  62. Carr, D.; Thomson, M. Non-Technical Electricity Losses. Energies 2022, 15, 2218. [Google Scholar] [CrossRef]
  63. Mishenin, Y.V.; Klisinski, J.; Yarova, I.; Rak, A. Ensuring healthy environment: Mechanisms of cluster structures development in the field of waste management. Health Econ. Manag. Rev. 2020, 1, 78–90. [Google Scholar] [CrossRef]
  64. Boutti, R.; El Adil, A.; Rodhain, F. Multivariate Analysis of a Time Series EU ETS: Methods and Applications in Carbon Finance. Financ. Mark. Inst. Risks 2019, 3, 18–29. [Google Scholar] [CrossRef]
  65. Chygryn, O.; Rosokhata, A.; Rybina, O.; Stoyanets, N. Green competitiveness: The evolution of concept formation. In Proceedings of the International Conference on Innovation, Modern Applied Science & Environmental Studies, E3S Web Conferences, Kenitra, Morocco, 25–27 December 2020; Volume 234. [Google Scholar] [CrossRef]
  66. Bhowmik, D. Decoupling CO2 Emissions in Nordic countries: Panel Data Analysis. Socio-Econ. Chall. 2019, 3, 15–30. [Google Scholar] [CrossRef]
Figure 1. The flowchart diagram of the research process.
Energies 15 08857 g001
Figure 2. The scatterplots of the data with marginal histograms (based on the Eurostat’s data (ec.europa.eu/eurostat/, accessed on 17 August 2022); © European Union, 1995–2022).
Energies 15 08857 g002
Figure 3. Primary energy consumption and energy losses, 2020 (based on the Eurostat’s data (ec.europa.eu/eurostat/, accessed on 17 August 2022); © European Union, 1995–2022).
Energies 15 08857 g003
Figure 4. Transformation losses, 2020 (based on the Eurostat’s data (ec.europa.eu/eurostat/, accessed on 17 August 2022); © European Union, 1995–2022).
Energies 15 08857 g004
Figure 5. Distribution and transmission losses, 2020 (based on the Eurostat’s data (ec.europa.eu/eurostat/, accessed on 17 August 2022); © European Union, 1995–2022).
Energies 15 08857 g005
Figure 6. Energy imports dependency, 2020 (based on the Eurostat’s data (ec.europa.eu/eurostat/, accessed on 17 August 2022); © European Union, 1995–2022).
Energies 15 08857 g006
Figure 7. Consumption of the energy branch, 2020 (based on the Eurostat’s data (ec.europa.eu/eurostat/, accessed on 17 August 2022); © European Union, 1995–2022).
Energies 15 08857 g007
Table 1. The input variables of the model.
IndicatorIndicator DescriptionUnit of Measure
EEEnergy efficiencyIndex: 2005 = 100
TLTransformation losses (% of available energy from all sources)Index
DLDistribution losses (% of available energy from all sources)Index
CEBConsumption of the energy branch (% of available energy from all sources)Index
FCNEUFinal consumption non-energy use (% of available energy from all sources)Index
Table 2. Statistical description of the variables.
StatisticsTLCEBFCNEUEEDL
count960.000000960.000000960.000000960.000000960.000000
mean0.3501500.2992680.2564650.2875660.097220
std0.1882770.1685040.1508840.1176320.086961
min0.0000000.0000000.0000000.0000000.000000
25%0.2287440.1812780.1255420.2401040.051177
50%0.3401930.2969160.2550580.2840780.071136
75%0.4815460.3920700.3701230.3175630.119243
max1.0000001.0000001.0000001.0000001.000000
Table 3. Summary of the resent studies on the electricity losses.
StudyCountryVariablesDataMethod
Costa-Campi et al., 2018 [31]Spain (except the Balearic and Canary Islands)Energy losses in transmission and distribution, cost of losses in transmission and distribution, sources of generation (nuclear, combined cycle, coal, hydro, pumping generation, solar, wind, combined heat and power), imports, consumption, pumping consumption, exports2011–2013 Regression analysis
Briseño and Rojas, 2020 [32] 91 countriesAccess to electricity, crime, education, electric consumption, electric losses, literacy rate, unemployment, urban population2005–2014 Random effects model
Chen et al., 2021 [33]Western ChinaElectricity data in the power supply area, line loss rate, user’s electricity data2016–2017Log-log model
Briseño et al., 2021 [34]ColumbiaPercentage of transmission and distribution losses, intentional homicides, kidnappings, the average number of homicides and kidnappings, unemployment rate, urbanization rate, GDP, population2017–2019Regression analysis
Yotov et al., 2021 [35]BulgariaEnergy balance indicators2008–2018Neural network
Jawad and Ayyash, 2020 [36]PalestineLoss, price, customer, fineperviolent, maintenance, prepaid, wage, education, unemployment2010–2018Regression analysis
Table 4. Results of the first stage of modeling.
coefstd errtP > |t|[0.0250.975]
Intercept0.25480.01221.6020.0000.2320.278
TL0.17280.0198.9580.0000.1350.211
CEB0.02920.0241.2200.223−0.0180.076
FCNEU−0.13490.027−5.0160.000−0.188−0.082
DL−0.01970.043−0.4540.650−0.1050.065
Table 5. Results of the second stage of modeling.
Coefficientstd errtP > |t|[0.0250.975]
Intercept0.25830.01025.0370.0000.2380.279
TL0.17160.0198.9300.0000.1340.209
FCNEU−0.12020.024−5.0150.000−0.167−0.073
Table 6. Statistical tests.
StatisticsCoefficient
Durbin–Watson:0.369
Jarque–Bera (JB):4842.739
Breush–Pagan test:3.4963 × 10⁻¹⁵
Publisher’s Note: MDPI stays neutral with regard to jurisdictional claims in published maps and institutional affiliations.