Energy Intake Models for Intermittent Operation of Dead-End Microfiltration Filling Line †
Abstract
1. Introduction
2. Materials and Methods
2.1. Fluid Flow through a Micromembrane Filter
2.2. Energy Intake in Membrane Filtration
2.2.1. Continuous Flow Operation of the Filter
2.2.2. Intermittent Flow Operation of the Filter
2.2.3. Water Hammer Effect in Membrane Filtration
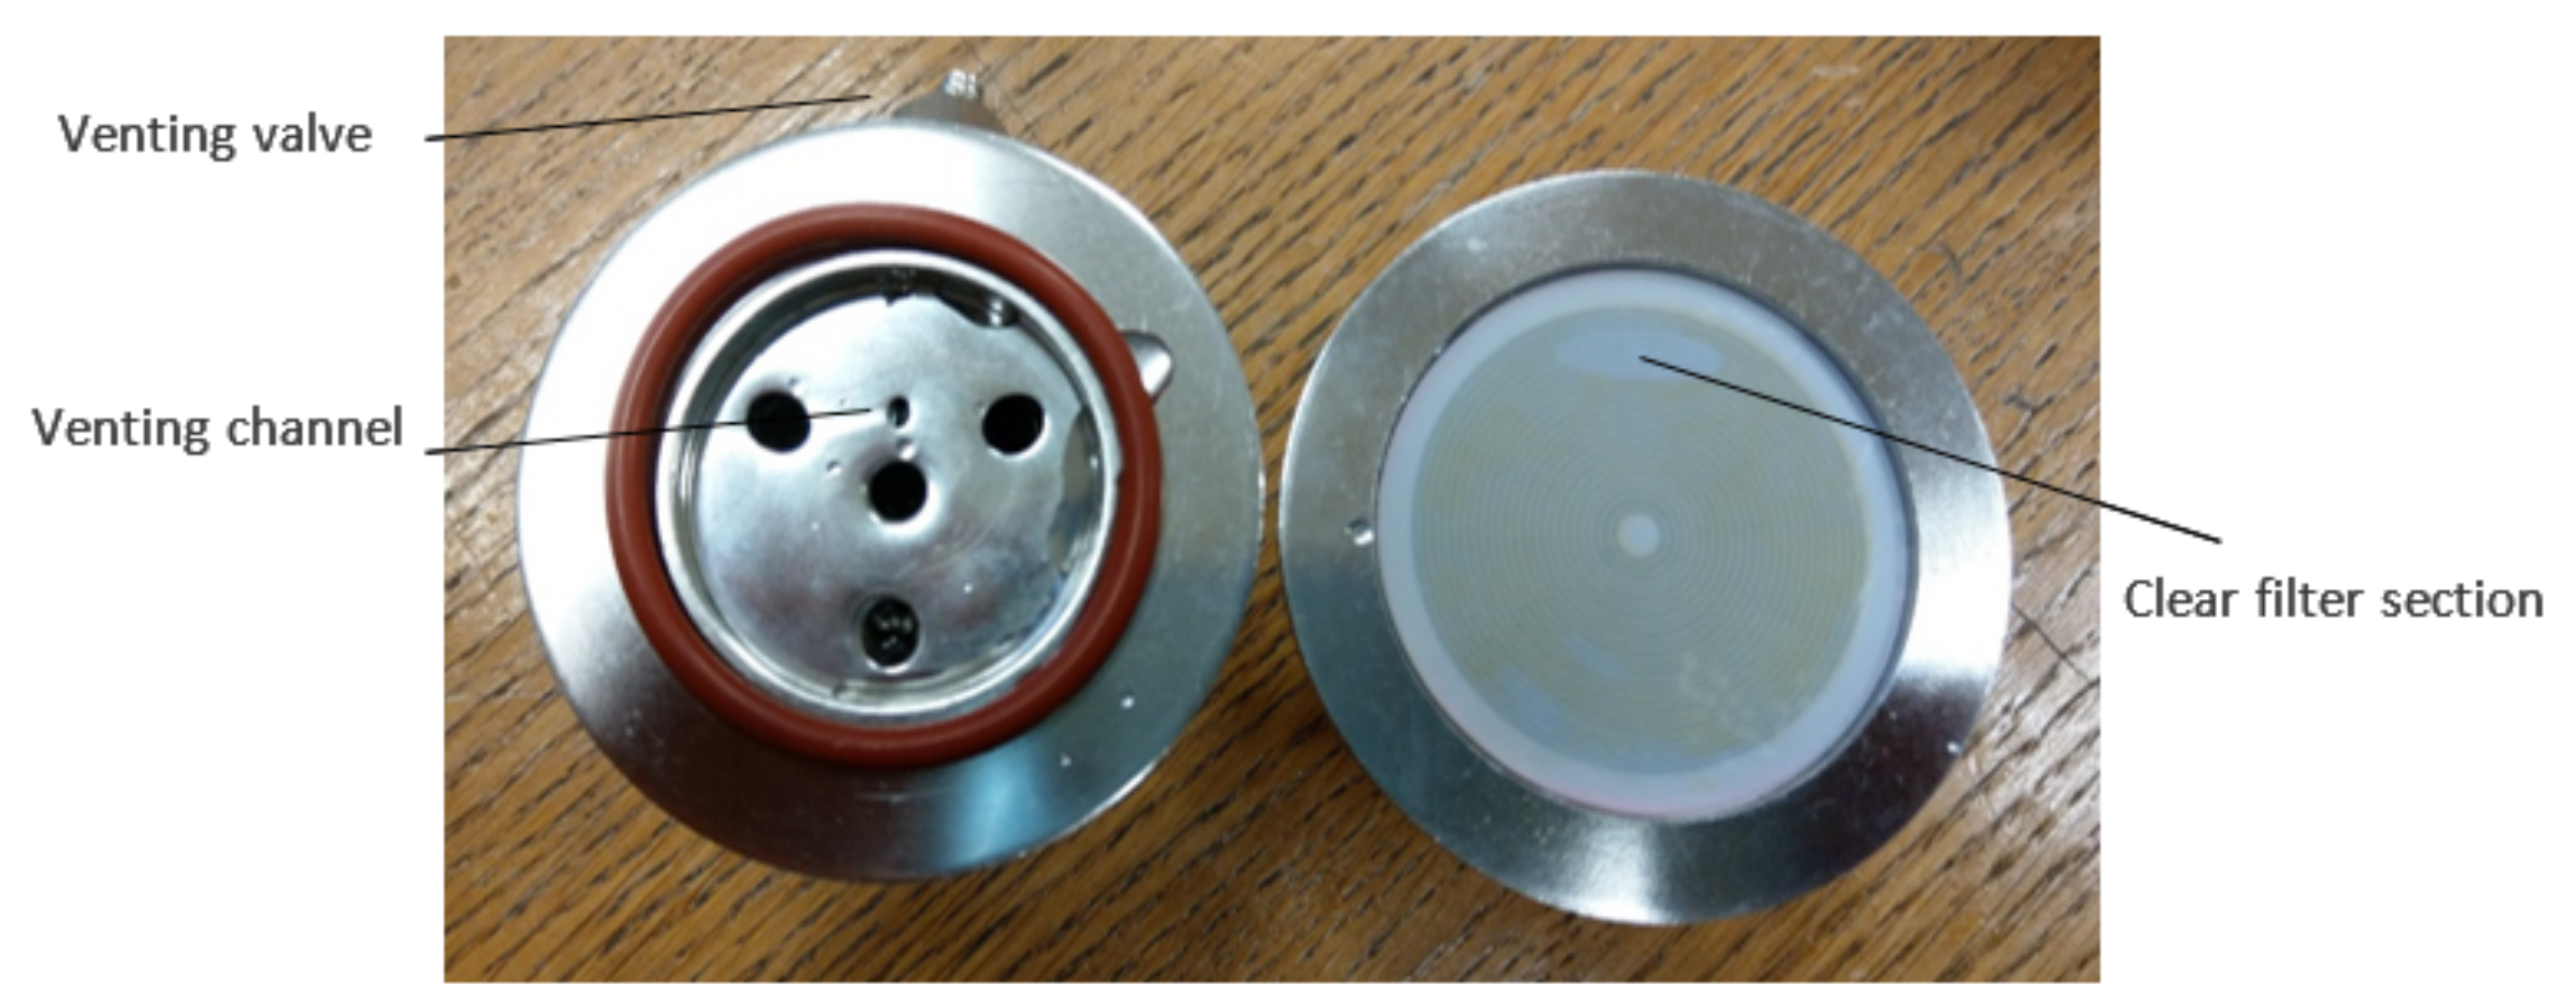
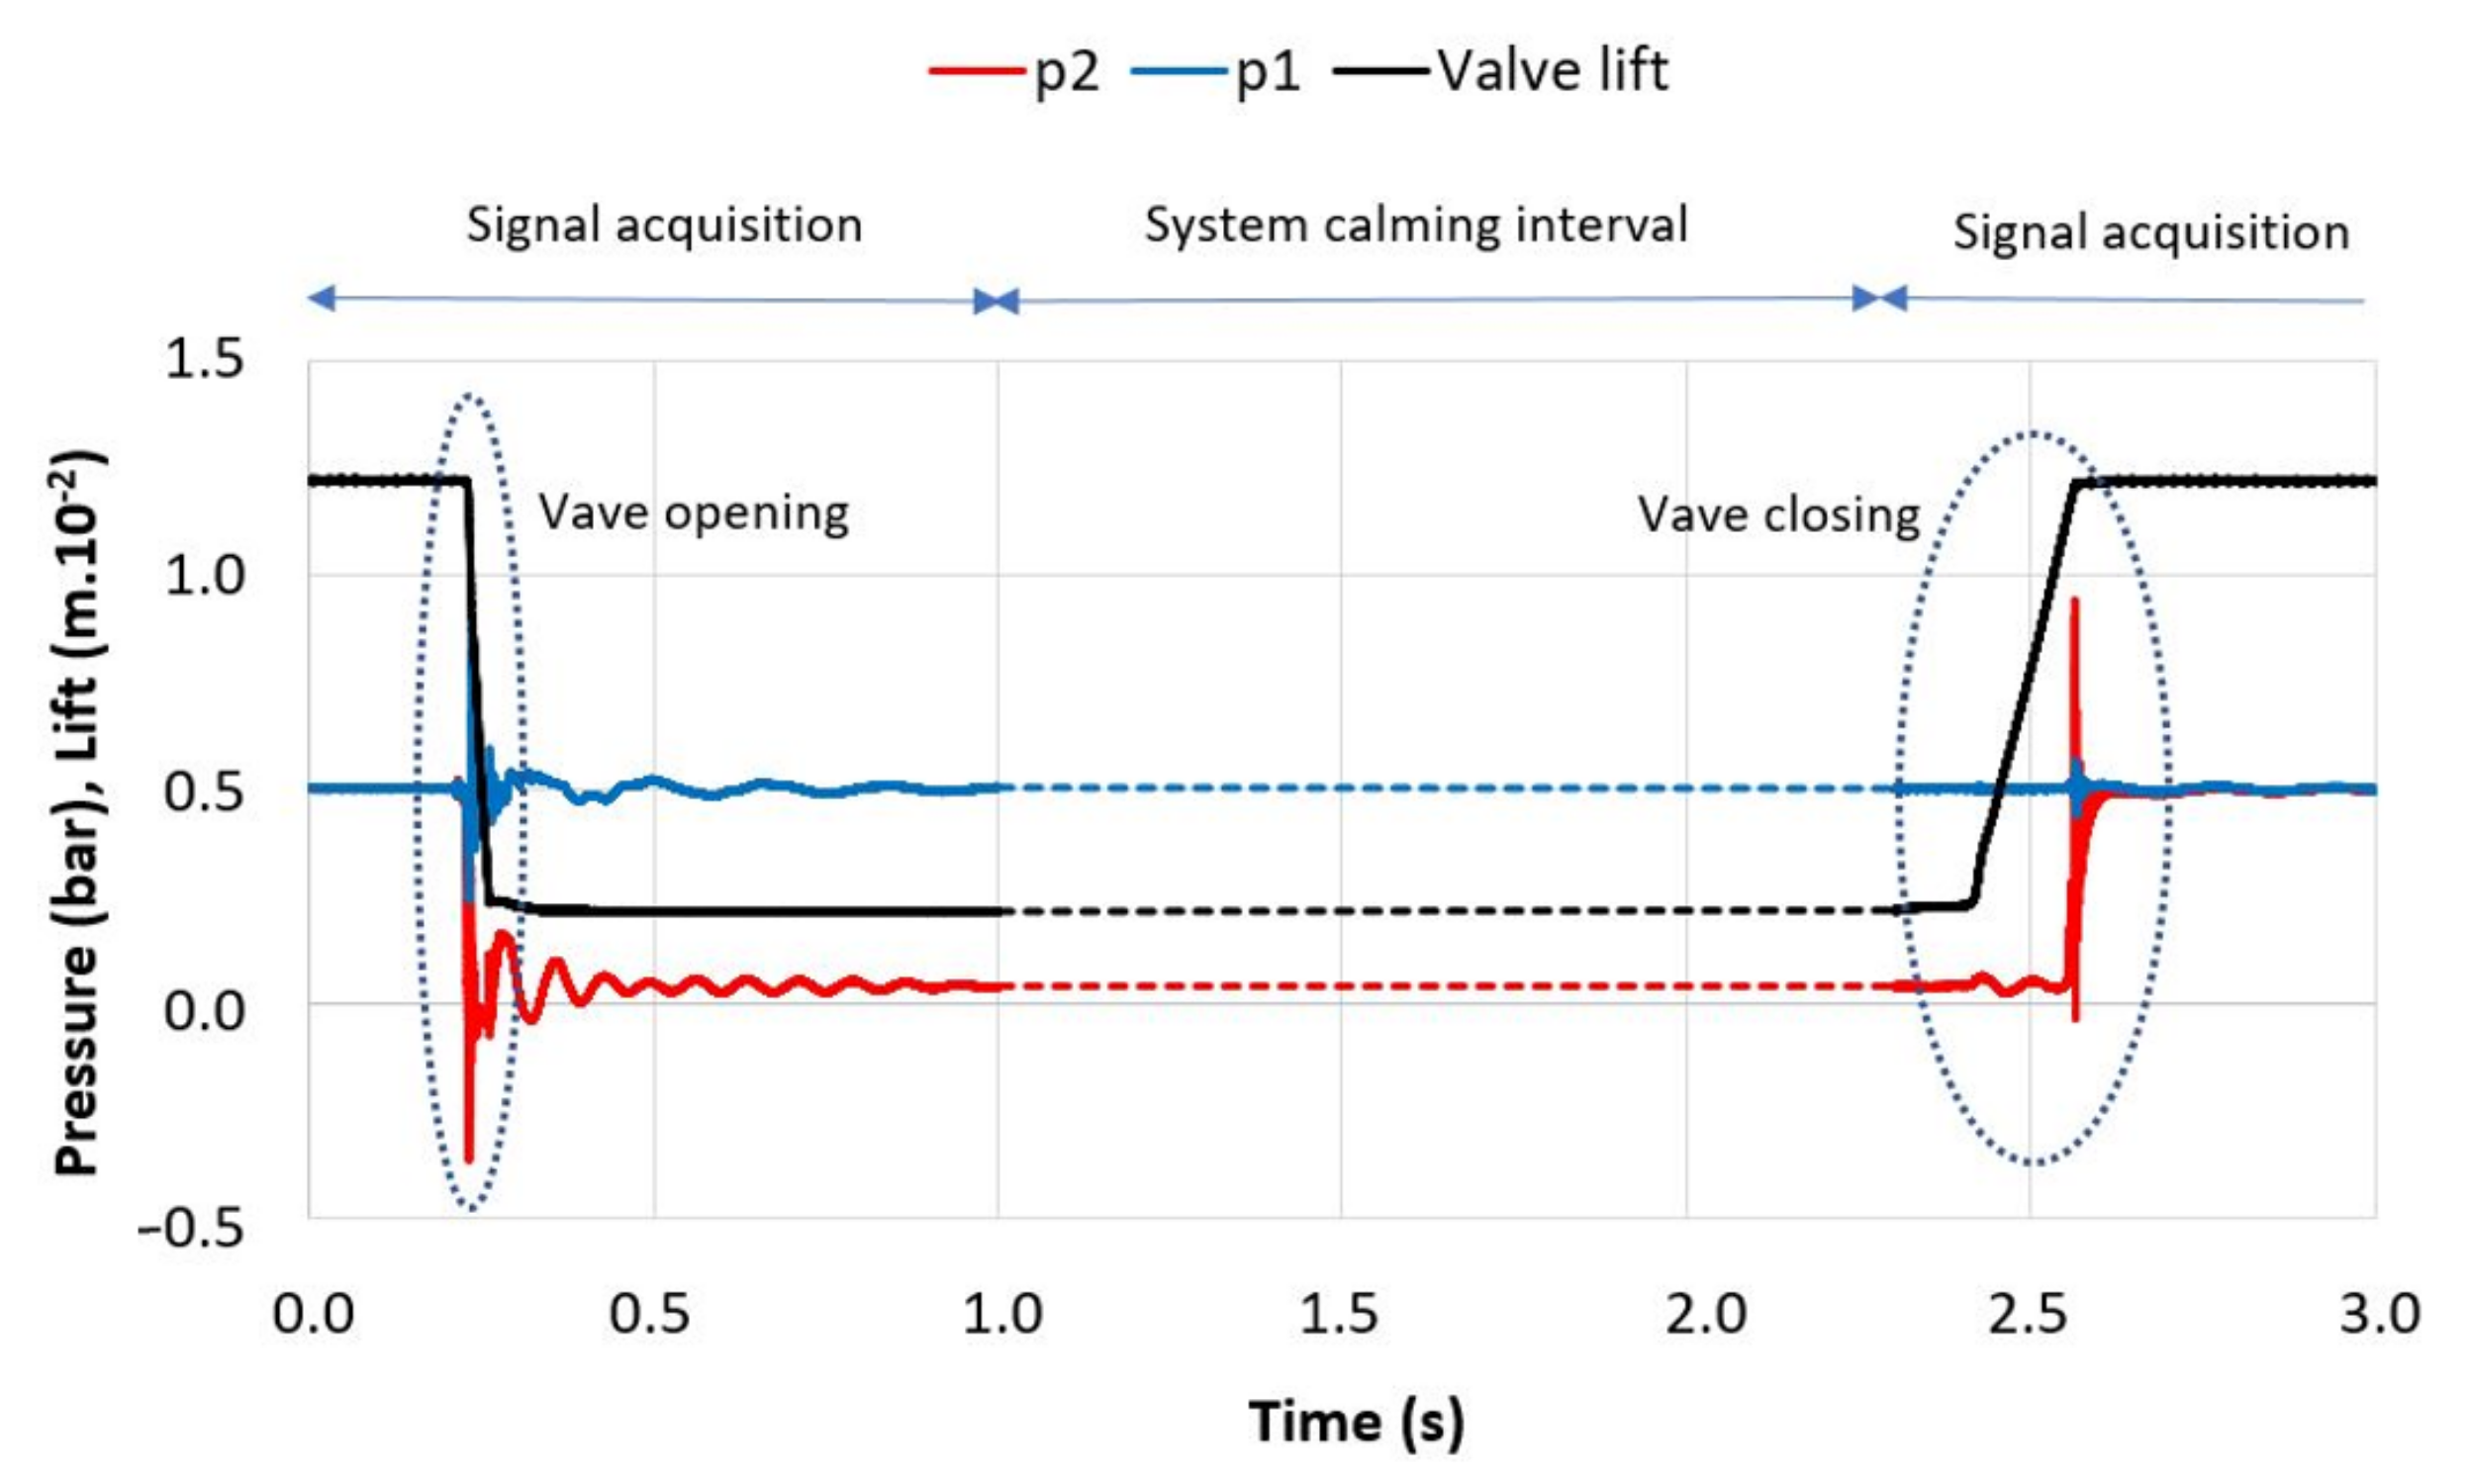
2.3. Experimental Setup
2.4. Energy Intake Calculation
2.4.1. A Single Steady State Wave
2.4.2. Several Steady State Waves
2.4.3. Unsteady Pressure Waves
2.4.4. Nondimensional Measure for Energy Intake
2.4.5. Algorithm
- use a moving window approach to analyse the complete pressure time series before and after the filter. The length of the moving window does not influence the results, so we choose so that it is long enough to capture most of the frequencies in the signals and at the same time short enough to still resolve time variation of the signal.
- loop over the whole signal using the moving window
- −
- use the Fourier transform to decompose the pressure signal before and after the filter membrane into individual waves and calculate the amplitude of each wave
- −
- calculate the intensity for each wave in the spectrum using Equation (23)
- −
- get the total intensity before and after the filter by summing contributions of individual wave Equation (25)
- −
- calculate the specific intake intensity for each time step using Equation (28)
- perform the integral (26) using numerical quadrature to obtain the dimensional filter area specific energy intake .
- perform the integral (28) using numerical quadrature to obtain the nondimensional filter area specific energy intake .
3. Results
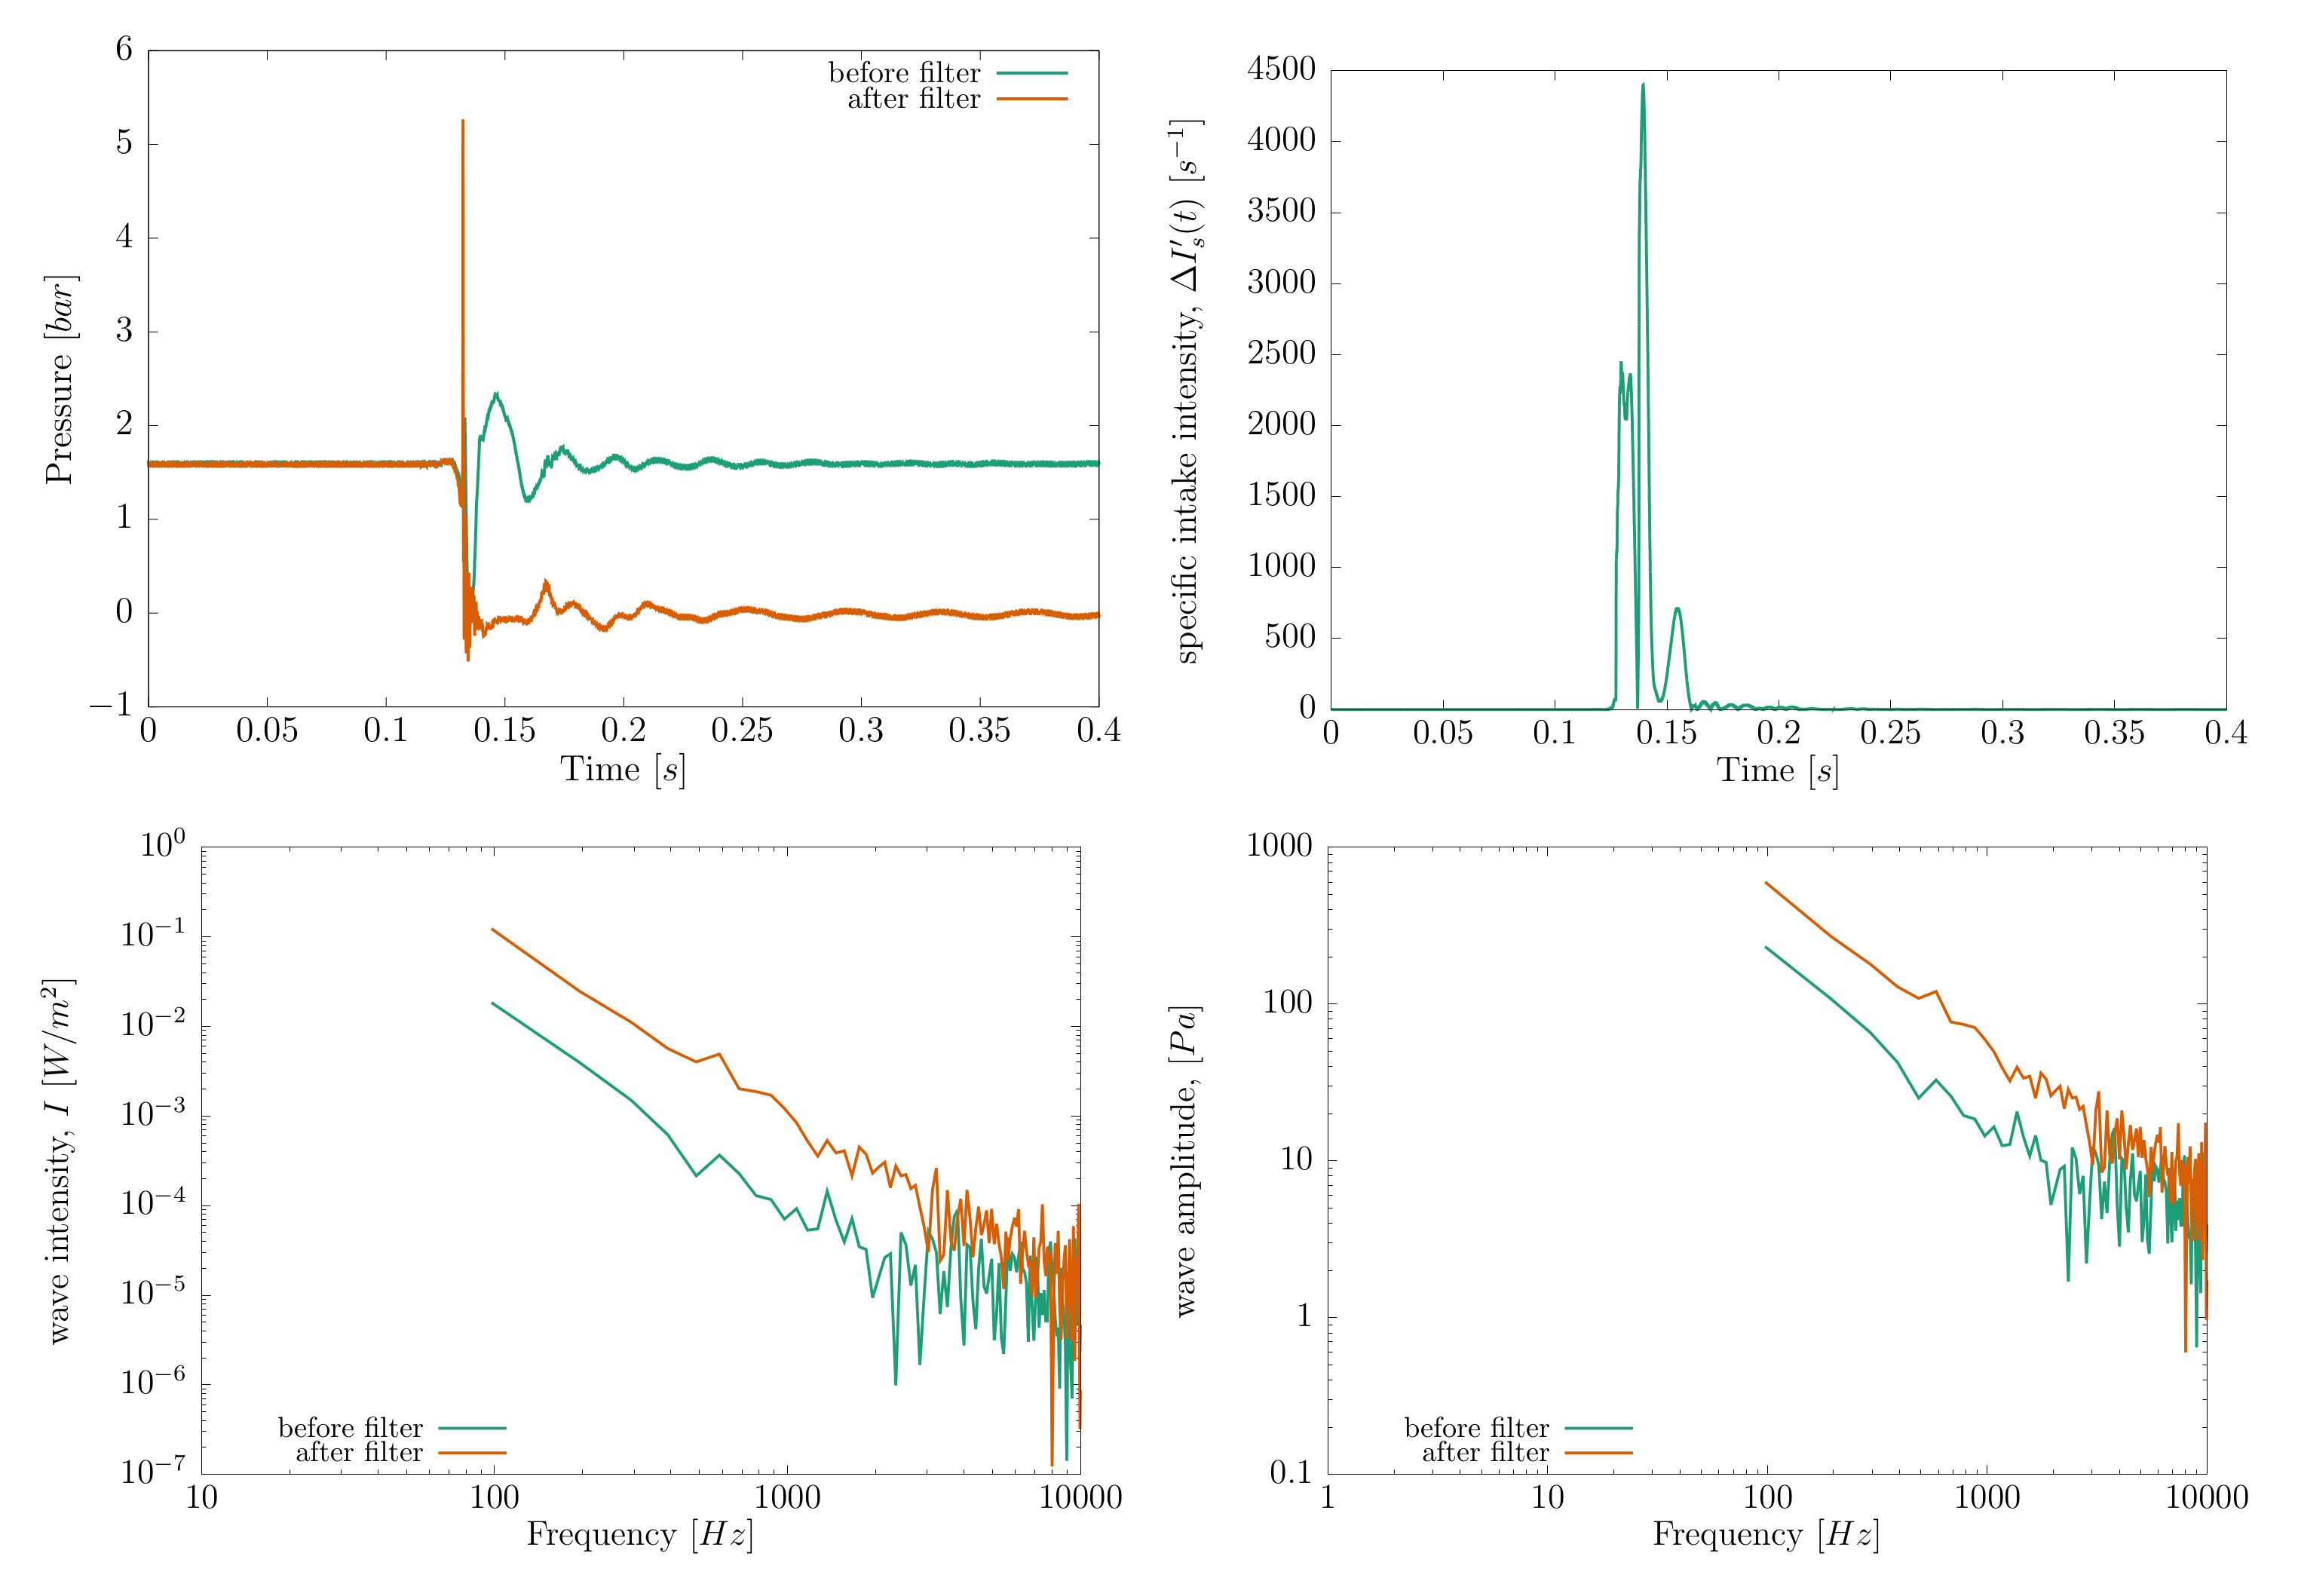
3.1. Dimensional and Non-Dimensional Energy Intake
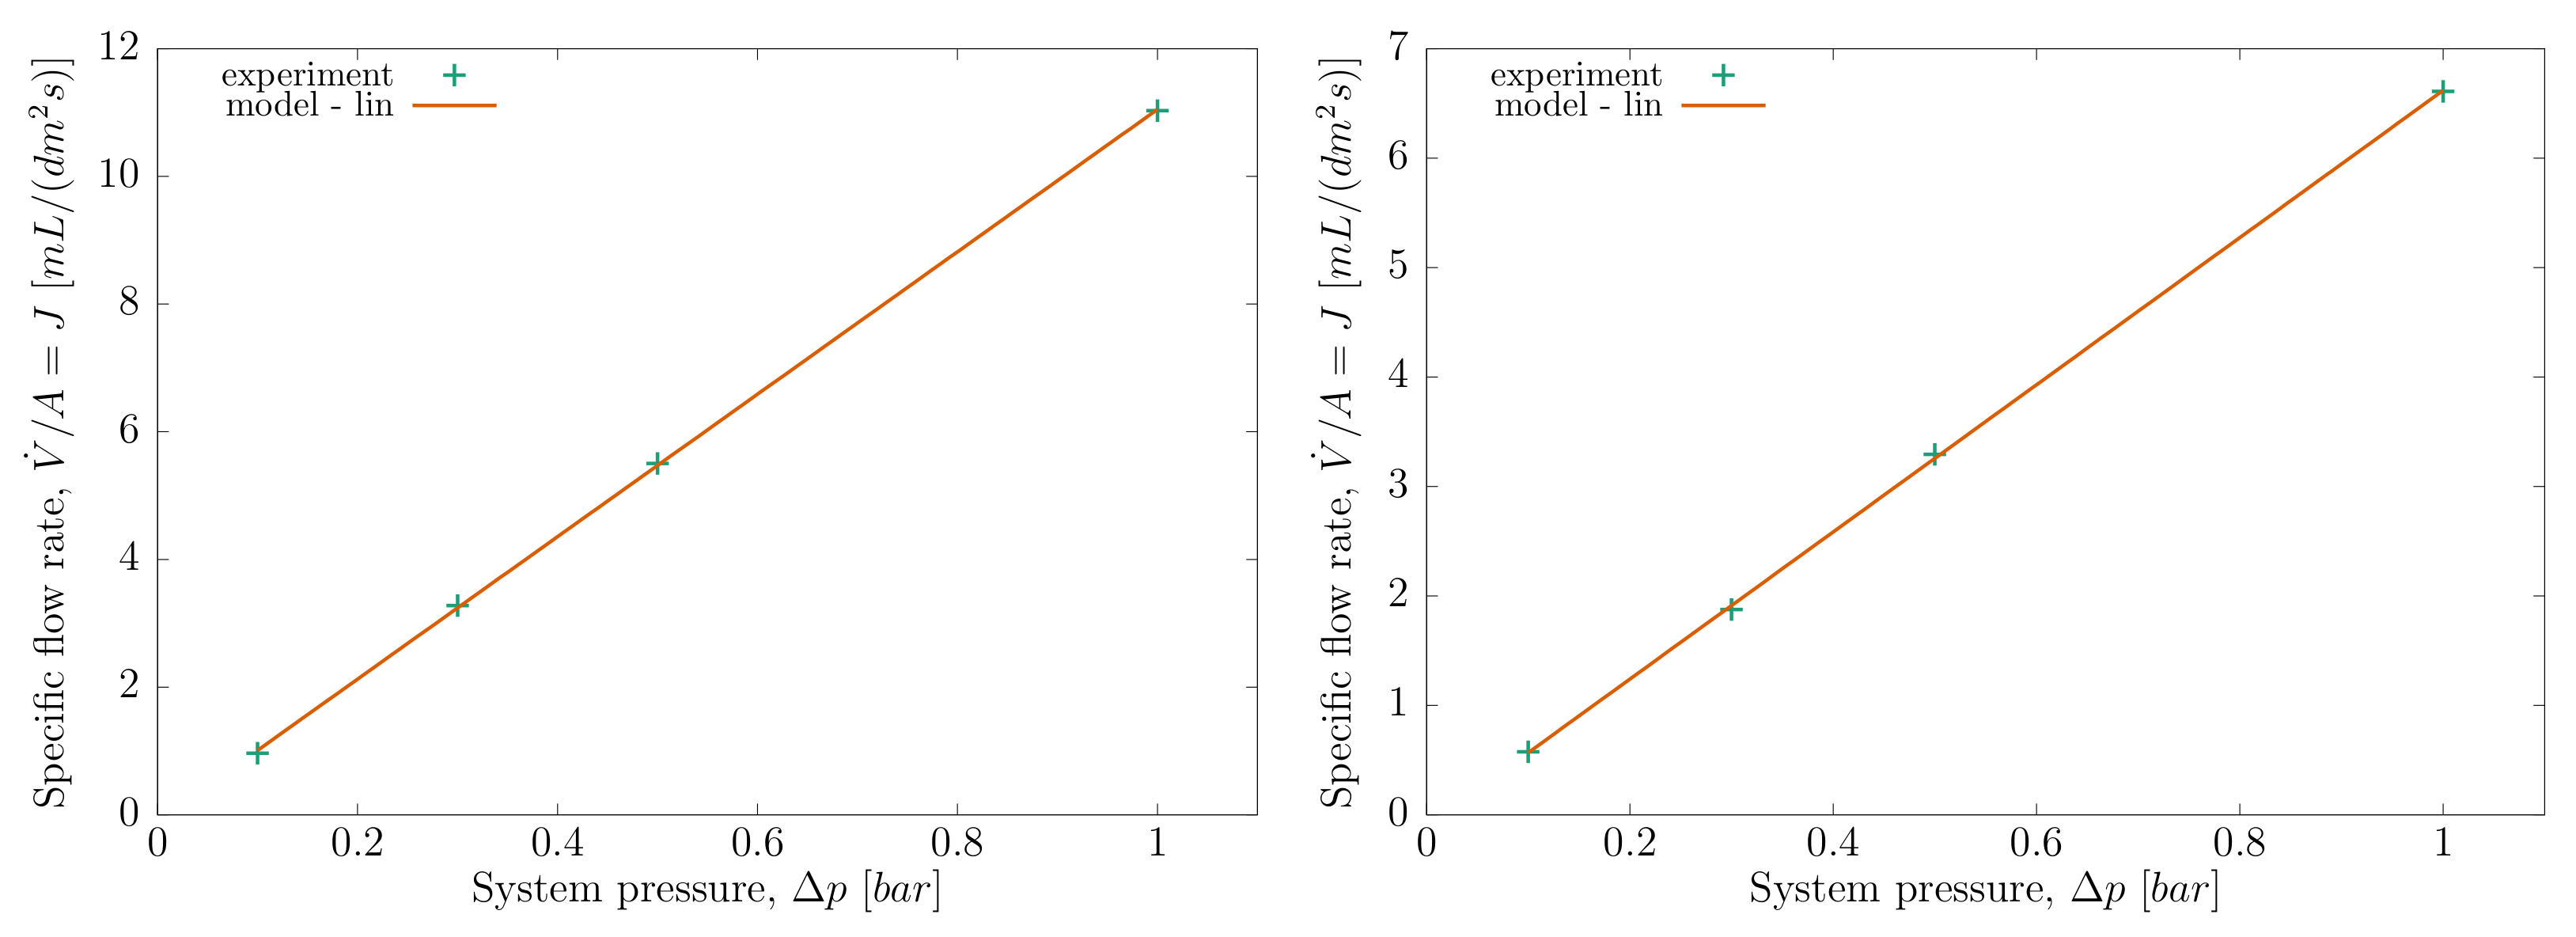
3.2. Specific Flow Rate versus System Pressure
3.3. A Model for Energy Intake due to Valve Closing and Opening
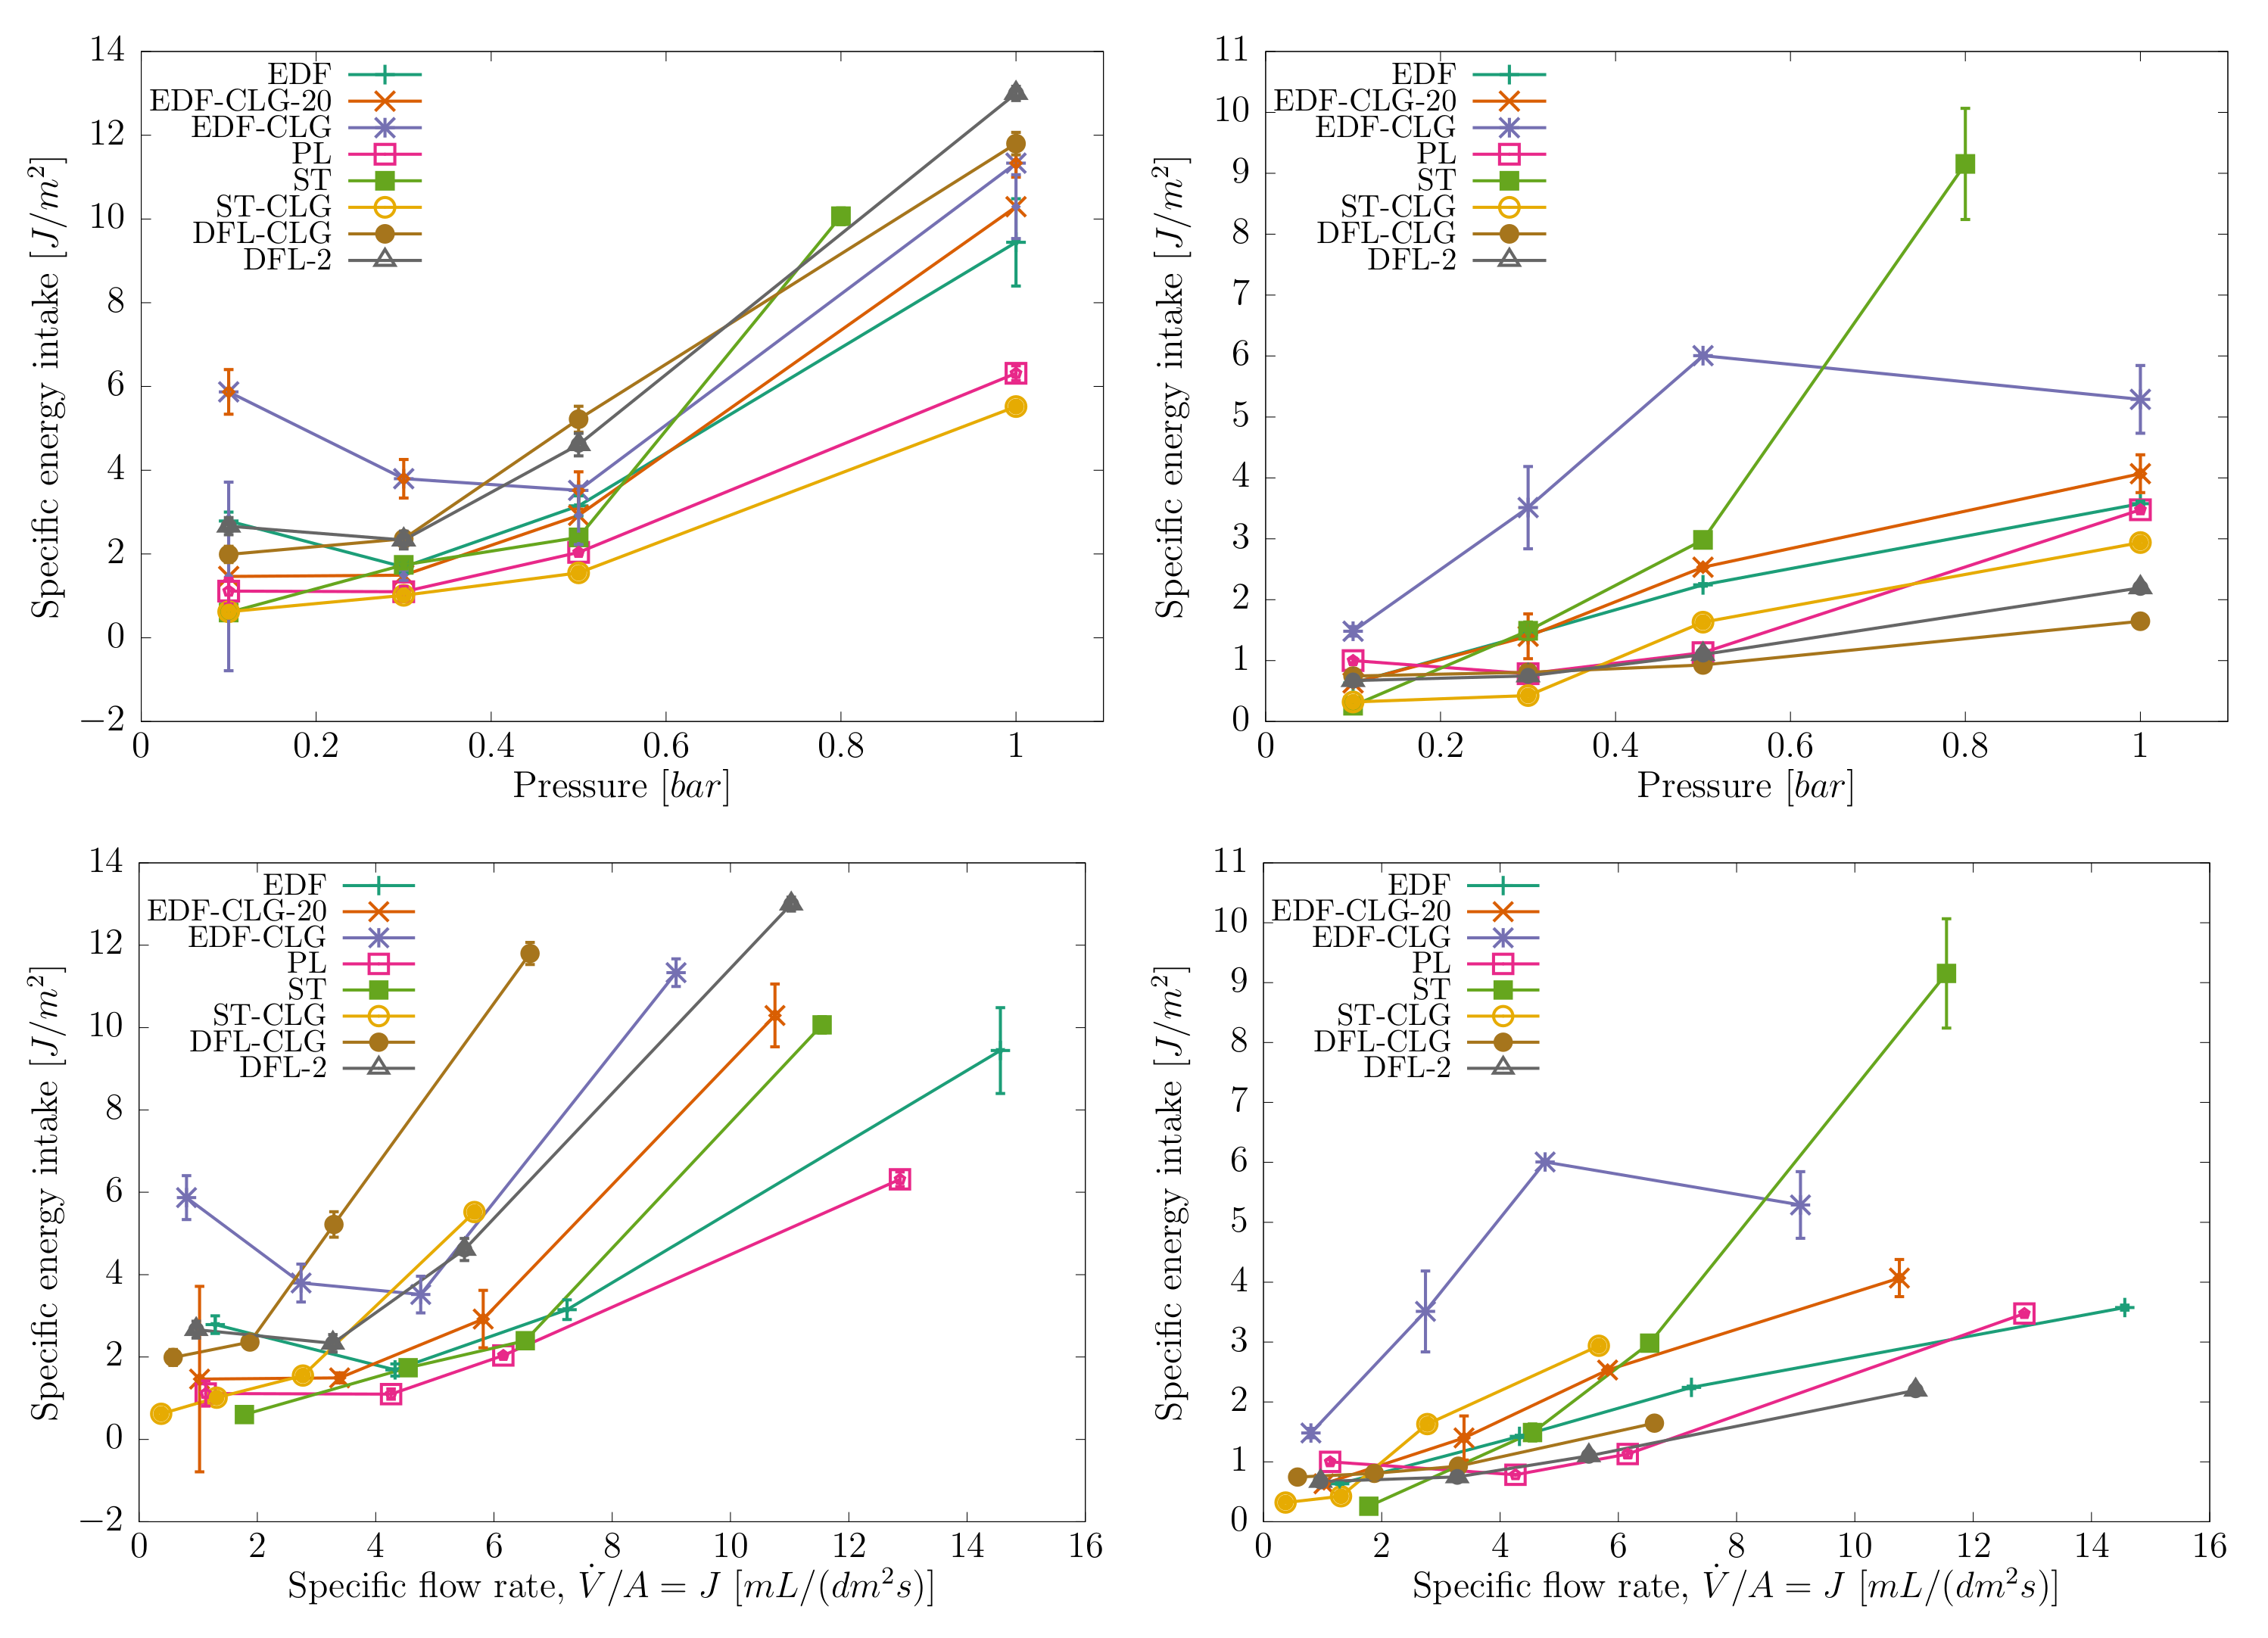
- At the lowest system pressures () the trends are not completely clear or even a decrease in energy intake with flow rate can be observed. It has to be emphasized that the implemented pressure sensors had the working range of and , with at the very lowest part of the useful range. This can lead to inaccuracies in recording the pressure oscillations and hence in calculating the energy intake values.
- The EDF-CLG clogged case shows an uncharacteristic peak of the energy intake at , followed by a decrease at higher flow rates, which should be attributed to some undetermined system disturbance rather than physically relevant cause.
- The derived model functions are of various types, including polynomial and exponential functions. These functions do approximate the covered pressure and specific flow rate range very accurately. However, due to their numerical nature they should be used with care when applied outside the tested range.
- When the derived downscale models would intended to be used above the tested range, i.e., for extrapolation purposes, a conservative approach would be to replace the functions with linear model approximations.
- When the energy intake is compared at the same system pressure conditions a general trend in all clogged cases is a significant decrease of the energy intake, valid for the opening as well as the closing of the valve. This is attributed to a decrease in the flow rate, a direct effect of filter clogging.
- When the energy intake is compared at the same system specific flow rate (J) conditions a general trend in all clogged cases is an increase of energy intake, valid for the opening as well as the closing of the valve. This is attributed to an increase in filter hydraulic resistance, a result of filter clogging, which additionally lowers the filter hydraulic permeability.
- With a known filter fouling model, i.e., one of the models in Equation (9), one can now calculate an overall energy intake for a case of intermittent operation with filter fouling.
- from kinetic energy of the flow, that comes to rest or is accelerated due to the action of the valve,
- from the action of the valve itself, as its movement displaces the fluid and produces pressure forces even in the case of no flow.
3.4. On the Use of Developed Energy Intake Models for Downscale Data Transfer
- at for the initial (clean) state of the filter,
- at for the clogged state after 10 manipulations,
- let us assume that valve manipulations occur at regular intervals, so that the flow rate decreases from to linearly.
- Clean filter case: consider the same flow rate of for all valve manipulation events and use the developed model for the clean filter to estimate the energy intake.
- Clogged filter case: consider a linearly decreasing flow rate from to and evaluate the energy intake at different flow rate using the model developed for the clogged filter.
4. Conclusions
Author Contributions
Funding
Data Availability Statement
Conflicts of Interest
Abbreviations
| DFL | Pall corporation laboratory scale filter Fluorodyne II DFL |
| EDF | Pall corporation laboratory scale filter Fluorodyne EX EDF |
| FFT | fast Fourier transform |
| FPGA | field programmable gate array |
| LVDT | linear variable differential transformer |
| PES | symmetric polyether sulfone |
| PVDF | polyvinylidene fluoride |
| CLG | clogged |
| PL | pleated filter |
| ST | stacked filter |
References
- Nigam, M.O.; Bansal, B.; Chen, X.D. Fouling and cleaning of whey protein concentrate fouled ultrafiltration membranes. Desalination 2008, 218, 313–322. [Google Scholar] [CrossRef]
- Sarker, S.; Sarker, T. Spectral Properties of Water Hammer Wave. Appl. Mech. 2022, 3, 799–814. [Google Scholar] [CrossRef]
- Laska, M.E.; Brooks, R.P.; Gayton, M.; Pujar, N.S. Robust scale-up of dead end filtration: Impact of filter fouling mechanisms and flow distribution. Biotechnol. Bioeng. 2005, 92, 308–320. [Google Scholar] [CrossRef] [PubMed]
- Iritani, E. A Review on Modeling of Pore-Blocking Behaviors of Membranes During Pressurized Membrane Filtration. Dry. Technol. 2013, 31, 146–162. [Google Scholar] [CrossRef]
- Iritani, E.; Katagiri, N. Developments of blocking filtration model in membrane filtration. KONA Powder Part. J. 2016, 2016, 179–202. [Google Scholar] [CrossRef]
- Bolton, G.; LaCasse, D.; Kuriyel, R. Combined models of membrane fouling: Development and application to microfiltration and ultrafiltration of biological fluids. J. Membr. Sci. 2006, 277, 75–84. [Google Scholar] [CrossRef]
- Bolton, G.R.; Boesch, A.W.; Lazzara, M.J. The effects of flow rate on membrane capacity: Development and application of adsorptive membrane fouling models. J. Membr. Sci. 2006, 279, 625–634. [Google Scholar] [CrossRef]
- Bowen, W.; Calvo, J.; Hernandez, A. Steps of membrane blocking in flux decline during protein microfiltration. J. Membr. Sci. 1995, 101, 153–165. [Google Scholar] [CrossRef]
- Fallahianbijan, F.; Giglia, S.; Carbrello, C.; Zydney, A.L. Quantitative analysis of internal flow distribution and pore interconnectivity within asymmetric virus filtration membranes. J. Membr. Sci. 2020, 595, 117578. [Google Scholar] [CrossRef]
- Peles, J.; Fallahianbijan, F.; Cacace, B.; Carbrello, C.; Giglia, S.; Zydney, A.L. Effect of operating pressure on protein fouling during constant-pressure virus removal filtration. J. Membr. Sci. 2022, 648, 120351. [Google Scholar] [CrossRef]
- Choon, T.W.; Aik, L.K.; Aik, L.E.; Hin, T.T. Investigation of Water Hammer Effect Through Pipeline System. Int. J. Adv. Sci. Eng. Inf. Technol. 2012, 2, 246. [Google Scholar] [CrossRef]
- Li, Y.; Hu, X.; Zhou, F.; Qiu, Y.; Li, Z.; Luo, Y. A new comprehensive filtering model for pump shut-in water hammer pressure wave signals during hydraulic fracturing. J. Pet. Sci. Eng. 2022, 208, 109796. [Google Scholar] [CrossRef]
- Xi, B.; Wang, C.; Xi, W.; Liu, Y.; Wang, H.; Yang, Y. Experimental investigation on the water hammer characteristic of stalling fluid in eccentric casing-tubing annulus. Energy 2022, 253, 124113. [Google Scholar] [CrossRef]
- Zhang, X.; Chen, S.; Xu, T.; Zhang, J. Experimental study on pressure characteristics of direct water hammer in the viscoelastic pipeline. J. Water Supply Res. Technol.-Aqua 2022, 71, 563–576. [Google Scholar] [CrossRef]
- Lyu, J.; Zhang, J.; Wang, T. Study on water hammer protection of the siphon breaking structure in the water supply system. J. Water Supply Res. Technol.-Aqua 2022, 71, 478–489. [Google Scholar] [CrossRef]
- Jansson, M.; Andersson, M.; Karlsson, M. High-Speed Imaging of Water Hammer Cavitation in Oil–Hydraulic Pipe Flow. Fluids 2022, 7, 102. [Google Scholar] [CrossRef]
- Aslam, M.; Wicaksana, F.; Farid, M.; Wong, A.; Krantz, W.B. Mitigation of membrane fouling by whey protein via water hammer. J. Membr. Sci. 2022, 642, 119967. [Google Scholar] [CrossRef]
- Broens, F.; Menne, D.; Pothof, I.; Blankert, B.; Roesink, H.D.; Futselaar, H.; Lammertink, R.G.; Wessling, M. Water hammer reduces fouling during natural water ultrafiltration. Water Res. 2012, 46, 1113–1120. [Google Scholar] [CrossRef] [PubMed]
- Blankert, B.; Kattenbelt, C.; Betlem, B.H.; Roffel, B. Dynamic optimization of a dead-end filtration trajectory: Non-ideal cake filtration. J. Membr. Sci. 2007, 290, 114–124. [Google Scholar] [CrossRef][Green Version]
- Siddiqui, M.U.; Arif, A.F.M.; Bashmal, S. Permeability-selectivity analysis of microfiltration and ultrafiltration membranes: Effect of pore size and shape distribution and membrane stretching. Membranes 2016, 6, 40. [Google Scholar] [CrossRef] [PubMed]

| Sample Length | ||||
|---|---|---|---|---|
| analytical | 29 | 7.25 | 21.75 | 4 |
| 16,384 | 29.07 | 7.26 | 21.81 | 4.004 |
| 4096 | 28.71 | 7.18 | 21.53 | 3.999 |
| 2048 | 28.65 | 7.16 | 21.49 | 4.001 |
| 1024 | 28.66 | 7.16 | 21.50 | 4.003 |
| 512 | 22.43 | 5.61 | 16.82 | 3.998 |
| 256 | 22.67 | 5.68 | 16.99 | 3.991 |
| 128 | 16.53 | 4.13 | 12.40 | 4.002 |
| Valve | Comment | ||
|---|---|---|---|
| opening | horizontal, no flow | 0.516 | 23.3 |
| opening | vertical, no flow | 0.570 | 31.7 |
| opening | horizontal | 0.774 | 41.8 |
| opening | vertical | 0.630 | 37.2 |
| opening | horizontal, flipped | 0.753 | 11.3 |
| opening | sucrose | 0.932 | 59.3 |
| closing | horizontal, no flow | 0.582 | 1.4 |
| closing | vertical, no flow | 0.228 | 0.4 |
| closing | horizontal | 0.929 | 5.1 |
| closing | vertical | 0.958 | 3.4 |
| closing | horizontal, flipped | 0.929 | 3.7 |
| closing | sucrose | 0.983 | 10.9 |
| Valve | Comment | ||
|---|---|---|---|
| opening | pleated | 0.857 | 1.99 |
| opening | stacked | 0.884 | 2.47 |
| opening | stacked, clogged | 0.936 | 1.66 |
| closing | pleated | 0.783 | 1.1 |
| closing | stacked | 0.739 | 3.0 |
| closing | stacked, clogged | 0.932 | 1.69 |
| Case Name | Eq. for , |
|---|---|
| lab. filter, DFL | |
| clogged lag. filter, DFL-CLG | |
| lab. filter, EDF | |
| semi-clogged lab. filter, EDF-CLG-20 | |
| clogged lab. filter, EDF-CLG | |
| pleated filter, PL | |
| stacked filter, ST | |
| clogged stacked filter, ST-CLG |
| Case Name | opn/cls | Eq. for , , | Validity |
|---|---|---|---|
| opn | |||
| lab. filter | opn | ||
| DFL | cls | ||
| cls | |||
| clogged | opn | ||
| lab. filter | opn | ||
| DFL | cls | ||
| cls | |||
| opn | |||
| lab. filter | opn | ||
| EDF | cls | ||
| cls | |||
| semi clogged | opn | ||
| lab. filter | opn | ||
| EDF-CLG-20 | cls | ||
| cls | |||
| clogged | opn | ||
| lab. filter | opn | ||
| EDF-CLG | cls | ||
| cls | |||
| opn | |||
| pleated filter | opn | ||
| PL | cls | ||
| cls | |||
| opn | |||
| stacked filter | opn | ||
| ST | cls | ||
| cls | |||
| clogged | opn | ||
| stacked filter | opn | ||
| ST-CLG | cls | ||
| cls |
Publisher’s Note: MDPI stays neutral with regard to jurisdictional claims in published maps and institutional affiliations. |
© 2022 by the authors. Licensee MDPI, Basel, Switzerland. This article is an open access article distributed under the terms and conditions of the Creative Commons Attribution (CC BY) license (https://creativecommons.org/licenses/by/4.0/).
Share and Cite
Ravnik, J.; Bombek, G.; Hribernik, A.; Gomboc, T.; Zadravec, M.; Kapun, A.; Hrovat, G.; Gradišek, J.; Hriberšek, M. Energy Intake Models for Intermittent Operation of Dead-End Microfiltration Filling Line. Energies 2022, 15, 8854. https://doi.org/10.3390/en15238854
Ravnik J, Bombek G, Hribernik A, Gomboc T, Zadravec M, Kapun A, Hrovat G, Gradišek J, Hriberšek M. Energy Intake Models for Intermittent Operation of Dead-End Microfiltration Filling Line. Energies. 2022; 15(23):8854. https://doi.org/10.3390/en15238854
Chicago/Turabian StyleRavnik, Jure, Gorazd Bombek, Aleš Hribernik, Timi Gomboc, Matej Zadravec, Aleks Kapun, Grega Hrovat, Jure Gradišek, and Matjaž Hriberšek. 2022. "Energy Intake Models for Intermittent Operation of Dead-End Microfiltration Filling Line" Energies 15, no. 23: 8854. https://doi.org/10.3390/en15238854
APA StyleRavnik, J., Bombek, G., Hribernik, A., Gomboc, T., Zadravec, M., Kapun, A., Hrovat, G., Gradišek, J., & Hriberšek, M. (2022). Energy Intake Models for Intermittent Operation of Dead-End Microfiltration Filling Line. Energies, 15(23), 8854. https://doi.org/10.3390/en15238854


