Abstract
The pressure at the natural gas wellhead typically ranges from tens to hundreds of atmospheres. Traditionally, the wellhead pressure must be throttled into a low level to satisfy the requirement of gathering pipelines, in which a large amount of pressure energy is wasted. The high-pressure oil–gas turbine is a promising approach to convert the wellhead pressure energy into shaft power or electricity. In this paper, a numerical investigation is conducted on a radial-outflow high-pressure oil–gas turbine utilized in a wellhead pressure power generation system. Using the self-defined real oil–gas physical properties and Computational Fluid Dynamics (CFD), the internal flow and performance of the high-pressure oil–gas turbine under complex operating conditions are investigated. To improve the turbine flow and performance, a Latin Hypercube Sampling-based parametric tuning is performed on the stator and rotor blade geometries. The application of such an approach effectively adjusts the flow matching and eliminates the flow separation, by which the turbine performance is significantly enhanced.
1. Introduction
The pressure at the natural gas wellhead typically ranges from tens to hundreds of atmospheres and is commonly throttled into a low level to satisfy the requirement of gathering pipelines, in which a large amount of pressure energy is wasted.
An ejector is commonly adopted to use the energy from a high-pressure well to boost the production of a low-pressure well [1]. However, the complexity of the gas fields makes it difficult to arrange a favorable configuration of high-pressure and low-pressure wells [2,3,4,5,6,7].
Compared with the ejector, the pressure power generation system is a more flexible way to use the wellhead pressure energy. Figure 1 presents a typical pressure power generation system for the natural gas wellhead. It mainly includes a high-pressure oil–gas turbine/expander, a gear box, and a generator. In the original process, the high pressure of the oil–gas from the wellhead Christmas tree is throttled into a lower level using a throttle valve. The pressure power generation system is installed parallelly with the throttle valve. By using a triple valve, the oil–gas from the wellhead is imported into the high-pressure oil–gas turbine (HPOT) to convert the pressure energy into shaft power.
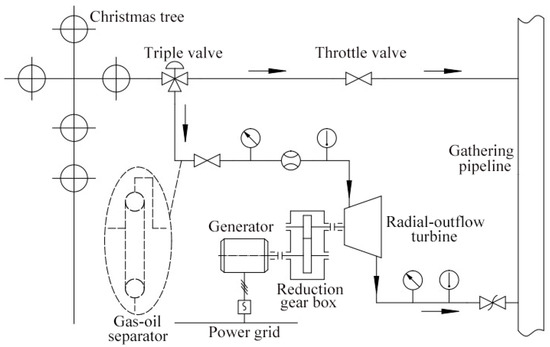
Figure 1.
Wellhead pressure power generation system with high-pressure oil–gas turbine.
As its core component, the high-pressure oil–gas turbine/expander has great influence on the economic efficiency and operational stability of the wellhead pressure power generation system.
Generally, the screw expander and radial-inflow turbine are adopted in small and moderate pressure recovery systems. Screw expanders are widely used in the field of geothermal energy utilization due to their adaptability under the harsh gas–water–solid environment. However, the working pressure of screw expanders does not commonly exceed 3–5 MPa, which is far from the requirement of high-pressure energy utilization at the wellhead [8].
The radial-inflow turbine has the advantages of large expansion ratio and high efficiency in a single stage. However, for the natural gas wellhead, the liquid droplets in liquid-rich gases will experience a centrifugal force to move radially outwards in a detrimental oscillating motion, which may cause wear corrosion and damage to the rotor structure [9]. Thus, a gas–liquid separator is commonly installed ahead of the gas turbine, by which the oil–gas mixture is separated before entering into the turbine. For example, patent 201410311044.6 [10] discloses a natural gas wellhead heating and throttling system based on pressure energy generation and heat pump heating. Patent 201310260259.5 [11] discloses a wellhead natural gas pressure energy generation system. None of the turbines in the above-mentioned systems can accommodate high liquid fraction media. It is clear that considerable pressure energy losses are generated by using the oil–gas separator, especially for wellheads with a low gas–oil ratio. In addition, the use of the oil–gas separator makes the system more complex and increases the regular maintenance costs.
In recent years, radial-outflow turbines have been widely used in the waste heat and pressure recovery of complex multi-phase media and the utilization of low-grade thermal energy because of their unique advantages in gas–liquid–solid multi-phase medium adaptability, material corrosion resistance, and droplet flushing resistance [8]. Thus, these turbines have gained a lot of attention from researchers. For example, Maksiuta [12] studied the characteristics of a radial-outflow turbine in organic Rankine cycle (ORC)-based power generation systems, and the results show that radial-outflow turbines have unique advantages such as high efficiency, low rotational speed, and small size. For corrosive and high liquid fraction medium, the radial-outflow turbine has been practically applied in a power generation system based on the Kalina cycle with ammonia as the medium, and has achieved good economic and demonstration effects [13,14]. In terms of high-pressure energy utilization, radial-outflow turbines have been applied to supercritical CO2 cycle units, and relevant studies have shown that the radial-outflow structure has more advantages than radial-inflow type in terms of geometry, efficiency, rotor stress, and axial force [15,16].
The radial-outflow turbine provides a viable way to utilize the high-pressure energy at the natural gas wellhead. In comparison with other types of expanders/turbines, it is well adapted to the liquid-rich natural gas, since the working medium flows outwards along the radial direction and can be easily expelled from the impeller.
The CFD methodologies have been widely used to analyze the flow performance and stability of turbomachines (both compressors and turbines). Cravero et al. reported a CFD model to simulate the compressor with an additional device to extend the surge limit in [17]. In [18], the impeller-vaned diffuser interaction in a centrifugal compressor was numerically investigated. As for turbines, the aerodynamic design and 3D flow simulations of a centrifugal turbine cascade were performed by Persico et al. [19]. Pini et al. conducted steady and transient CFD simulations for a radial-outflow turbine [20]. Al Joubori et al. predicted the 3D viscous flow and turbine performance based on CFD techniques [21]. Edna et al. used CFD methods to optimize a radial turbine rotor for an ORC system [22]. The optimization based on CFD and neural network models was applied for a turbine blade by Zhang et al. [23].
The internal flow of HPOT has great influence on the efficiency and operational stability of the turbine. At present, the reported studies of the oil–gas flow mainly focus on the ejector and oil–gas pump. However, most of the numerical studies use the simplified working medium. For example, Amin et al. [1] parametrically studied nine sensitive geometric parameters of the ejector using air as the medium, while Chen et al. [5,7] investigated the effect of different geometry dimensions of the ejector on the performance using pure methane as the working medium. However, the natural gas wellhead medium is a complex mixture containing several condensate oil and natural gas components, and the turbine flow investigation using real gas–oil properties is essentially required.
In this paper, the internal flow investigation of a radial-outflow HPOT utilized in a wellhead pressure energy power generation system is conducted. Using the self-defined real oil–gas property interface, the internal flow and performance of the high-pressure oil–gas turbine is well predicted. In addition, the internal flow characteristics and performance of the turbine are investigated numerically under different inlet pressures and different gas–oil ratios to evaluate the turbine’s operability in the complex operating conditions of a natural gas wellhead. To improve the turbine flow and performance, an LHS-based parametric tuning is performed on the stator and rotor blade geometries. The application of the proposed method effectively adjusts the flow matching and eliminates the separation flow in the radial-outflow turbine, by which the turbine performance is significantly enhanced.
2. Flow Analysis on the Initial Designed HPOT
2.1. Oil–Gas Mixture Physical Properties Definition
The oil and gas from natural gas wellheads contain complex gas and condensate components. As for the oil–gas turbine, the working medium is expanded from an inlet pressure of 20 MPa to an outlet pressure of 10 MPa, during which the thermal properties of the oil–gas mixture significantly vary from the turbine inlet to the outlet. Thus, the accurate prediction and calculation of thermodynamic properties are fundamental and important for flow simulations. To improve the simulation accuracy, a self-defined real oil–gas thermal properties interface is established in the present study, which is detailed as follows.
The thermodynamic properties of oil–gas mixtures covering a wide range of temperatures from 303.15 K to 338.15 K and pressures from 0.1 MPa to 55 MPa are calculated using the Aspen Plus database, which provides a reliable calculation of the thermal properties of multi-component oil–gas mixtures [24]. The calculated density, enthalpy, entropy, speed of sound, specific heat capacity, dynamic viscosity, thermal conductivity, etc., are fitted as the binary functions of both the temperature and pressure and are inputted into a real gas property (RGP) table as the thermal properties interface of the CFD solver. By using such an interface, the thermal properties of oil–gas can be updated in real time with different temperatures and pressures during the CFD iterative process. Figure 2 shows the values of the thermodynamic and transport properties at different temperatures and pressures, which are also highlighted in different colors.
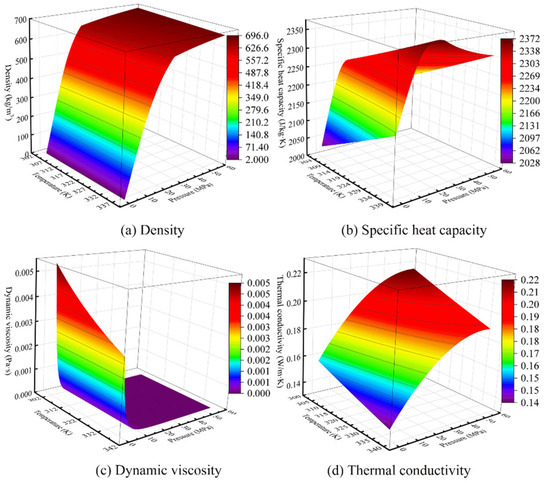
Figure 2.
Physical properties of oil–gas mixture.
2.2. Physical Model and Grid Generation
In this paper, a single-stage radial-outflow oil–gas turbine is designed using the real parameters of a natural gas wellhead. The turbine design parameters are presented in Table 1.

Table 1.
Design parameters of the radial-outflow turbine.
2.2.1. Physical Model
The CFD simulations are conducted in the turbine stage environment using the commercial software ANSYS-CFX. As shown in Figure 3, the physical model consists of an inlet fairing cone, a nozzle ring (with 27 stator blades), an impeller (with 25 rotor blades), a vaneless diffuser, and a volute. The oil–gas flows into the turbine through the inlet fairing, where its flow direction changes from axial to radial. Then it flows across the nozzle and impeller blade passages, in which the pressure energy is transformed into shaft power. Finally, it flows out of the turbine through the volute, where the reduced pressure satisfies the requirement of the downstream pipelines.

Figure 3.
Physical model of the radial-outflow turbine.
2.2.2. Grid Generation
Each flow passage component of the turbine was discretized separately in the fluid domain and then connected to form the whole computational grid, as shown in Figure 4a. The ANSYS-TurboGrid software was adopted to generate multi-block structured meshes for the nozzle and impeller of the single-passage model, and then the single was rotated and duplicated to obtain the entire circumference mesh for the nozzle and impeller. Using ICEM, the unstructured mesh for the fairing cone and volute and the multi-block hexahedral mesh for the vaneless diffuser is generated, as shown in Figure 4c. To capture the local complex flow physics, local meshing refinements were performed in all of the near-wall regions, including the blade surfaces, hub, and shroud wall regions, as shown in Figure 4b,d.

Figure 4.
Computational grid.
2.3. Numerical Methods
The commercial computational fluid dynamics (CFD) software ANSYS-CFX is applied to solve the three-dimensional steady Reynolds-averaged Navier–Stokes equations. The finite volume method is used with a combination of the second-order central scheme with artificial viscosity for the convective terms and the second-order central scheme for the diffusive terms. The turbulence model is adopted in collaboration with a scalable wall function to close the turbulence terms, where the first-order scheme is used for the turbulence numeric to obtain a robust convergence. The k-epsilon model provides good predictions for a variety of flows and has been proven to be stable and numerically robust, which provides a good compromise in terms of accuracy and robustness. As shown in Figure 5, the values of Y+ are monitored and they are less than 130 almost all the way around the solid boundaries, which satisfies the requirement of the turbulence model being used in the present study [25].
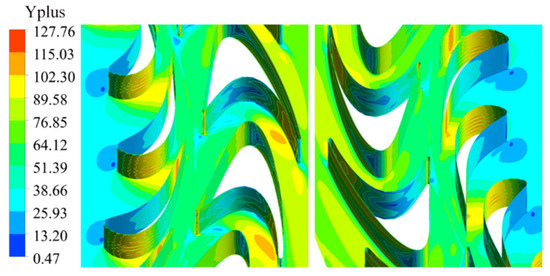
Figure 5.
Y+ distribution on blade surfaces.
As for the boundary conditions, the total temperature, total pressure, and velocity direction are specified at the inlet of the fairing cone, while the static pressure is specified at the outlet of the volute, and all solid surfaces are applied to be adiabatic and non-slip.
2.4. Grid Independence Test
A grid independence study was conducted to eliminate the influence of grid size on the simulations. Five different resolution grids were respectively delineated, namely, A, B, C, D, and E, in which the grid sizes of the fairing cone, vaneless diffuser and volute remain unchanged, and the size of each set of grids and the time required for calculation are shown in Table 2.
Table 2.
Mesh sizes for grid independence study.
Figure 6 compares the isentropic efficiency and mass flow rate predicted by the five sets of grid simulations mentioned above. As shown in the figure, the flow rates obtained from the five sets of grid calculations do not vary much. In the prediction of the efficiency values, there is a significant difference between the results of grid A, B, and C. When the mesh number is more than grid C, the variation of isentropic efficiency is quite small.

Figure 6.
Predicted results with different grid sizes.
However, with the increase in the grid number, the computation time increases sharply, as shown in Table 2. For example, when the grid number increased from C to E, the required computation time increased from 318 to 694 min. Thus, grid C is considered moderate in terms of both numerical accuracy and computational cost, and is used throughout the present study.
2.5. Validations of Numerical Methods
At present, experimental studies on oil–gas turbines have not been reported. In the present study, the numerical models of oil–gas turbines have been validated using two aspects of experimental data.
The thermal properties of the oil–gas mixture are defined as the binary functions of both the temperature and pressure and are inputted into the RGP table as the thermal properties interface of the CFD solver. The same definition method was validated in our previously reported work [25], where the natural gas mixture including seven components is defined using a similar thermal properties definition method.
The simulation results of the natural gas turbine are validated by the experimental data, as presented below. Figure 7 compares the predicted isentropic efficiency curve with the measured one. The predicted peak efficiency is 84.3%, which is close to that of the measured data. The predicted efficiency is above the measured efficiency, but its variation tendency is similar to the measured result.

Figure 7.
Comparison of predicted values with measured values.
The above test was conducted on a natural gas radial-inflow turbine. In order to verify the numerical methods used in this paper for the radial-outflow turbine, the measured turbine data from a Kalina cycle power generation system were used for numerical methods validation, where the flow simulations were conducted for radial-outflow turbine at five tested points using the real operating parameters, and the results are shown below.
As shown in Figure 8, at the five operating points, the predicted shaft power values are slightly larger than the measured values, but the relative differences have some similarities under different operating conditions. In consideration of the instrumental errors, the predicted values agree well with the measured ones.

Figure 8.
Comparison of predicted shaft power values with measured values.
It is concluded that the numerical models of HPOT are validated in terms of both the physical property definition and physical model.
2.6. Flow Analysis of Original Designed Turbine under Design Condition
Using the above-described numerical methods, the CFD simulation is conducted in the turbine stage environment under the design condition. When the simulation converges, the turbine performance is predicted, where 208.43 kW of shaft work is generated with the isentropic efficiency of 70.87%.
Figure 9a,b presents the predicted streamline patterns of the turbine stage and volute, respectively. It is shown that the main flow in the turbine is smooth and there is no significant flow separation. As shown in Figure 9a, the oil–gas flows into the turbine through an inlet fairing passage, where the flow direction turns from axial to radial. It accelerates in the nozzle blade passages and then flows into the bowed impeller blade passage with a large turning. Finally, the oil–gas flows out of the turbine through the volute, as shown in Figure 9b. The turbine pressure distribution is presented in Figure 9c, where a large pressure decrease is achieved from 20 MPa to 10 MPa in the turbine stage. As shown in Figure 9d, a large part of the pressure energy has clearly been transformed into velocity in the nozzle flow passages, where a maximum Mach number of 0.98 is presented near the nozzle throat. In the nozzle blade passages, a large part (from 19.851 MPa to 10.8827 MPa) of the pressure decreases across the nozzle and the flow velocity is accelerated significantly from 26.17 m/s to 186.87 m/s. Then, the accelerated flow transforms its velocity into the shaft power in the rotating impeller. The calculated reaction ratio is about 0.07, which means that the turbine is typically a pulse stage. The reaction ratio is an important parameter of a turbine. It represents the ratio of the enthalpy drop in the impeller to the total enthalpy drop of the stage, which strongly influences the flow matching between the nozzle and the impeller.

Figure 9.
Flow under design conditions.
The detailed flow behaviors in the blade passages are presented below. As presented in Figure 10a, the mismatched flow originating from the impeller blade’s leading edge results in significant separated flow in region A. Flow separation also occurs in region B, which may largely be due to the large turning angle of the bowed rotor blade. The separated flow brings about significant mechanical head dissipation losses. A quantitative demonstration of the flow losses could be presented by the entropy production contour in Figure 10b. Consistent with the flow separations exhibited in Figure 10a, the main flow losses occur in the same position of region A and B.

Figure 10.
Three-dimensional flow behavior in blade passages. (A and B are the flow separation regions of the impeller blade pressure surface and suction surface respectively).
The above analysis presents the two-dimensional flow behavior. In the present study, the turbine blades height is only 5.0 mm, which indicates a significant end wall flow effect. Figure 10c gives the limiting streamline near the impeller blade surface. As shown in the figure, the flow exhibits not only two-dimensional, but significant three-dimensional flow characteristics. At the pressure surface, there are two vortex flows observed near the shroud and hub sides of blade leading, which take a large part of the about one third of flow passage. Such vortex flows originate from the mismatched flow near the leading blade and are further affected by the end wall boundary layer. As presented in Figure 10c, the complex flow interactions lead to significant separation flow at region A, which covers from the separation line to the reattaching line. At the suction surface, a significant separation region can be observed behind the blade bow region, as marked by region B. Such a flow separation is mainly caused by the large turning angle of the flow.
As discussed above, the significant end wall effect makes the complex 3D flow characteristics of the turbine flow, which strongly interacts with the flow separations at the blade passages and results in considerable flow losses. In fact, the predicted isentropic efficiency is only 70.87%. To reduce the flow losses and improve turbine performance, a careful tuning of the nozzle and impeller blade geometry is required to restrain the separation flow and reduce the flow losses.
2.7. Flow Analysis of Originally Designed Turbine under Off-Design Conditions
As the exploitation of natural gas wells, the pressure level and gas–oil ratio of the wellhead varies significantly. To evaluate the turbine operability under the complex operating conditions of a natural gas wellhead, numerical flow simulations are conducted with different inlet pressures and gas–oil ratios. The obtained results are discussed below.
2.7.1. Flow and Performance with Different Inlet Pressure
Based on the above numerical model, the turbine flow under different inlet pressure conditions ranging from 15 MPa to 25 MPa are simulated. Figure 11 gives the predicted mass flow rate, isentropic efficiency, and shaft power versus different inlet pressures.

Figure 11.
Predicted overall performance versus different inlet pressures.
As shown in Figure 11a, the mass flow rate of the stage increases nearly linearly with increasing inlet pressure in the range of 15–25 MPa. This indicates that as the inlet pressure rises, the throughflow capacity of the turbine gradually increases. Figure 11b presents the predicted overall efficiency and output shaft power curves. As shown in the figure, the overall shaft power increases nearly linearly with the increase of inlet pressure. The shaft power is 208.43 kW at the design inlet pressure (20 MPa) and up to 364.51 kW at the maximum inlet pressure (25 MPa). At the design inlet pressure (20 MPa), the maximum isentropic efficiency is achieved. When the inlet pressure is lower than 20 MPa, the isentropic efficiency goes down significantly as the inlet pressure decreases. When the inlet pressure is greater than 20 MPa, the isentropic efficiency is slightly lower than that of the design point.
To identify the reason why the efficiency decreases significantly with the decrease of inlet pressure, the flow behaviors at different inlet pressures are compared as follows. As shown in Figure 12a, at the minimum inlet pressure of 15 MPa, the mismatched flow between the nozzle and impeller are presented, which leads to significant flow separations at blade pressure surfaces. As the inlet pressure rises to 17.5 MPa, the flow separation regions are slightly reduced, but still occupy a large part of the impeller flow passages. When the inlet pressure rises to the design condition and higher, the intensity of the flow separation and the separation area are less obvious, as is shown in Figure 12c,d.

Figure 12.
Streamline patterns at 50% span for different inlet pressures conditions.
2.7.2. Flow and Performance with Different Gas–Oil Ratio
The gas–oil ratio is an important parameter for the natural gas wellhead, which is defined as the ratio of gas production to oil production. It is obvious that the variation of the gas–oil ratio will greatly change the physical properties of the oil–gas mixture and influence the turbine’s performance. To quantify the influences of the variation of the gas–oil ratio, the physical properties of the flow are defined with three different gas–oil ratios (160 m3/t, 280 m3/t, and 400 m3/t), and the flow simulations are carried out with different gas–oil ratios, respectively. The obtained results are discussed below.
As shown in Figure 13a, the turbine mass flow rate decreases with the increase in the gas–oil ratio. This indicates the reduced throughflow capability with the increase of the gas components. Figure 13b presents the curves of efficiency and shaft power versus the gas–oil ratio at the design inlet pressure. As shown in the figure, the turbine shaft power slightly increases with a larger gas–oil ratio, but the variation is quite small, where the predicted shaft power is 194.37 kW for a gas–oil ratio of 160 m3/t and 226.11 kW for a gas–oil ratio of 400 m3/t.

Figure 13.
Predicted overall performance versus different gas–oil ratios.
It can be explained that the enthalpy of the oil–gas and the turbine efficiency increase with the increase in the gas–oil ratio. Thus, although the turbine mass flow rate decreases with the increased gas component, the shaft power is less influenced by the variation of the gas–oil ratio.
As for the turbine efficiency, it is greatly influenced by the gas–oil ratio, where the turbine efficiency with a gas–oil ratio of 400 m3/t is 8.4% greater than that of 160 m3/t. To analyze such a large variation of efficiency with different gas–oil ratios, the flow characteristics under different gas–oil ratio conditions at the same inlet pressure (20 MPa) are presented in Figure 14.

Figure 14.
Streamline patterns at 50% span for different gas–oil ratios.
As shown in the figures, the flow separation in the impeller blade passages gradually decreases with the increase in the gas–oil ratio. When the gas–oil ratio is greater than 280 m3/t, the flow separation is diminished, which corresponds to a higher turbine performance.
3. Geometry Parametric Tuning of HPOT
To improve the turbine flow and performance, the geometric tuning of the nozzle and impeller blades is conducted and is described below.
3.1. Geometric Parameter Tuning of Nozzle Vane
3.1.1. Geometric Parameterization
The geometry of the nozzle vane strongly influences the turbine stage configuration and the flow interactions between the nozzle and the impeller. With the systemic geometric sensitivity study, some of the key geometry parameters of the nozzle are identified. As shown in Figure 15, the original blades are defined in the X-Y plane and transformed into annular surfaces using the conformal mapping method, by which the nozzle blade could be easily tuned by varying its inlet and outlet diameter. The gap between the nozzle and the impeller is also used as an adjustment parameter, as it significantly affects the stage matching. In addition, the correction value of the of blade exit angle is applied to adjust the flow out of the nozzle. In total, there are four parameters, including the nozzle inlet radius , the outlet radius , the gap between the nozzle and the impeller , and the correction of the exit angle , are used to adjust the nozzle blade profile.
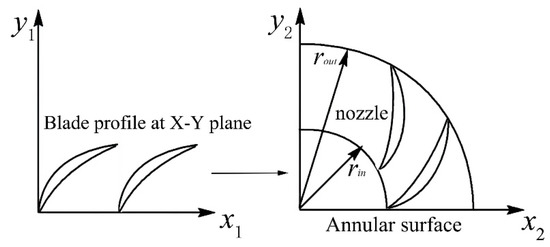
Figure 15.
Schematic of conformal mapping.
3.1.2. Geometric Sensitive Study
The turbine’s mass flow rate and stage configuration are very sensitive to the nozzle throat and the blade curve. To satisfy the design requirement, only four geometry variables of the nozzle are used in the geometry sensitive studies, which have a slight influence on the turbine’s mass flow rate.
The sensitivity study is carried out on four key geometry variables of the nozzle blade including the blade inlet () and outlet () radius, the correction of the nozzle exit angle (), and the radial gap between the nozzle and the impeller ().
Different combinations of the four parameters are used to generate the nozzle blade and they are analyzed using the CFD approach, by which datasets containing the turbine efficiency of all of the geometry combinations are obtained. The regression analysis is performed on the datasets to generate a response model between the geometric parameters and the efficiency. Then, the relative effects of the geometry parameters are obtained based on the gradients of the variables with respect to the response model. In the above approach, all of the geometry parameters are scaled to range from −1 to 1, and the response model coefficients are normalized so that the contributions of the geometry parameters can be compared fairly.
The relative effects of the geometry parameters to the turbine efficiency are visualized by the pareto plot. As shown in Figure 16, the effects of the four geometry parameters of the nozzle are listed in order of largest to smallest. Blue bars indicate positive effects on efficiency, while red bars indicate negative effects.

Figure 16.
Pareto contribution graph of nozzle geometry parameters.
As indicated by the pareto plot, the top three geometry parameters (red dashed box) of the nozzle have a significant influence on the turbine efficiency, which are , , and .
3.1.3. Geometry Tuning of Nozzle Blade
Through the geometric sensitive study, three geometry parameters of the nozzle are identified in the successive geometry tuning. In the meantime, the variation range of the above three parameters are detected, which are presented with the initial values in the Table 3.
Table 3.
Initial values and variation range of the nozzle parameters.
It is clear that the turbine flow is quite sensitive to the variations of blade geometry parameters; thus, all of the parameters have been divided into 15 levels for a comprehensive analysis. However, the CFD-based flow evaluation of the turbine is computationally expensive and is not practical for considering all of the combinations of the three parameters. Instead, Latin Hypercube Sampling (LHS) is used to select limited parametric designs for evaluation. LHS sampling is a stratified sampling method proposed by McKay et al. [26], and has been widely used in several fields. The essence of the method is to control the location of the sampling points to avoid the aggregation of sample points in a small area. The sample points generated by LHS can better homogenize the design space, especially for high-dimensional design space sampling with excellent performance. In addition, the LHS has a significant advantage in terms of the number of control trials, and the simulation scheme generated by this method ensures the quality of the imitation prediction points while minimizing the number of numerical predictions. In the present study, three parametric parameters of the nozzle are studied, and each parameter is divided into 15 levels of values, i.e., in this scenario, a three-factor 15-level LHS has been established.
Table 4 shows 15 groups of nozzle blade designs determined by LHS, which represent different geometric parameter combinations. The graphical display of these parameter combinations is presented in Figure 17, where the selected designs are marked by black solid points and distributed in the 3D space formed by the inlet diameter, outlet diameter, and the correction of the exit angle.
Table 4.
Designs determined by LHS and performance parameters obtained.

Figure 17.
Selected nozzle designs in 3D space.
The selected designs were evaluated using the CFD simulations. The obtained overall turbine efficiency using different nozzle designs is presented in Table 4. The best and the worst designs are also marked with the initial design in Figure 17. In comparison with the initial design, the nozzle design of group 11 reduces the total pressure loss coefficient from 0.384 to 0.3591, which is regarded as the optimal nozzle. In the meantime, the turbine efficiency is improved from 70.87% to 72.40%.
Figure 18 compares the original and the optimal selected nozzle blade profiles, where both the pressure and suction side of the blade profiles have been significantly changed. In comparison with the initial blade profile, the optimal selected design has an increased inlet diameter, a reduced outlet diameter, and a slightly increased blade exit angle.

Figure 18.
Original and optimal selected blade profiles of the nozzle.
Such a flexible variation of the nozzle blade geometry may strongly affect the turbine flow interaction. Figure 19 compares the flow behavior of the turbine with the original and optimal selected design. As shown in Figure 19a, a high-velocity region exists near the nozzle throat, i.e., region C, where the maximum Mach number reaches 0.98. The excessive Mach number brings about unfavorable flow losses. Benefitting from the optimal selected nozzle, the excessive velocity in region C is significantly reduced, as shown in Figure 19b. This indicates reduced nozzle flow losses, which is supported by the decreased total pressure loss coefficient in Table 4.

Figure 19.
Comparison of the turbine flow with original and optimal selected nozzle. (C is the region with higher Mach number distribution).
Although the optimal selected nozzle significantly reduces the nozzle flow losses and improves the turbine’s overall efficiency, the adjusted nozzle flow breaks the original flow matching between the nozzle and the impeller. As shown in the right of Figure 19a, instead, the flow separation in the impeller blade passages are significantly enhanced.
3.2. Geometric Parameter Tuning of Impeller Blade
For HPOT, the impeller is a key component for converting the kinetic energy of the oil–gas mixture into shaft work, and its flow matching with the nozzle strongly influences the turbine’s performance. As discussed above, although the modified nozzle significantly reduces the nozzle flow losses, conversely, the flow separations in the impeller are significantly enhanced. To rematch the flow interaction and suppress the separation flow losses, the impeller blade is parametrically adjusted with the aforementioned obtained nozzle profile.
3.2.1. Geometric Parameterization
In the present study, the eleven-parameter method (EPM) is adopted to define the impeller blade profile [27]. As shown in Figure 20, several geometric parameters with definite physical meanings are used to describe the impeller blade profile.

Figure 20.
Geometry parameterization of the impeller blade profile.
3.2.2. Geometric Sensitivity Study
Similar geometric sensitivity studies were performed on the impeller geometry parameters. The five most influential parameters are presented in Figure 21 with their effect on the turbine performance.

Figure 21.
Pareto contribution graph of impeller geometry parameters.
As shown in Figure 21, compared to and , , , and have a greater influence on the turbine efficiency. As for the impeller, through the geometric sensitivity study, three geometry parameters (red dashed box) are finally identified as the variables: the inlet blade angle , the exit blade angle , and the normalized tangential chord , where the normalized tangential chord is defined as
Normalized tangential chord = Tangential chord/Axial chord
3.2.3. Geometry Tuning of Impeller Blade
The initial values and variation range of the three impeller geometry parameters are given in Table 5. To find the best combination of parameters for the impeller blade within the limited computational resources, a three-factor, 15-level LHS scheme is adopted and 15 sets of blades with different parameter combinations are obtained, which are listed in Table 6.
Table 5.
Initial values and variation range of the geometry parameters.
Table 6.
Geometric parameter combinations of the blade designs.
The selected impeller designs were evaluated using the CFD simulations. The obtained turbine overall performance is listed in Table 6, where the efficiency with the impeller design of group 3 achieves 75.42%, which is regarded as the optimal impeller.
Table 7 compares the turbine performance using the original blades with the optimal selected nozzle, and with both the optimal selected nozzle and impeller blades. When using both the optimal selected nozzle and impeller, the turbine overall efficiency is improved from 70.87% to 75.42%, and the shaft power is improved by 6.23%.
Table 7.
Comparison of turbine’s overall performance after modifying the impeller.
Figure 22 compares the original and optimal selected impeller blade. It is shown that the impeller blade shape is significantly adjusted. Such a combination of parameters may be favorable for improving the flow and performance of the turbine, which are discussed below.

Figure 22.
Original and optimal selected blade profiles of impeller.
Figure 23 compares the flow behavior of the turbine with the optimal selected nozzle alone and the optimal selected nozzle and impeller. As shown in Figure 23a, with the optimal selected nozzle, significant flow separation occurs near the pressure surface, which is due to the mismatched flow between the nozzle and the impeller. The parametric adjustment of the impeller blade results in a significant reduction of the flow separation region, as shown in Figure 23b.
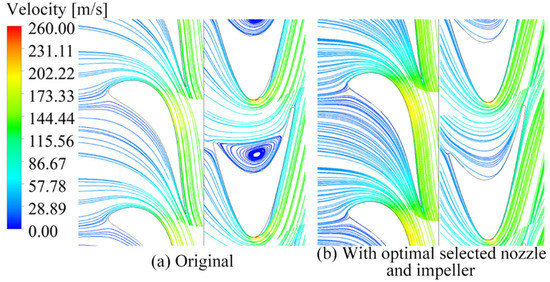
Figure 23.
Comparison of streamlines of the turbine with original and optimal selected impeller.
As shown by the entropy production contour in Figure 24, the intensive entropy generation in the impeller pressure surface is diminished by the optimal selected blade. The well-structured flow behavior supports the significantly improved performance shown in Table 7.
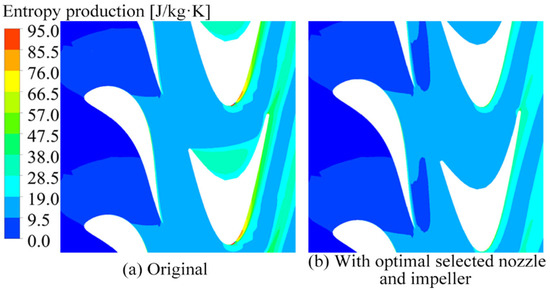
Figure 24.
Comparison of the entropy production of the turbine with original and optimal selected impeller.
It is concluded that the LHS-based parametric tuning enables an elaborated variation of each parameter and considers different combinations of all of the geometry variables. In the meantime, the number of design candidates is limited to 30 (15 geometry variations for the nozzle and others for the impeller) in such a way that the nozzle and impeller blades are fine-tuned using quite limited computation costs. As indicated by the improved results, the application of the geometric tuning method effectively adjusts the flow matching and eliminates the separation flow in the radial-outflow turbine.
To examine the off-design performance of the optimal selected turbine, flow simulations were performed at different inlet pressures and gas-to-oil ratios. Figure 25 compares the predicted performance curves for the original and optimal selected turbines. As shown in the figure, with different inlet pressures and gas–oil conditions, the isentropic efficiency of the optimal selected turbine lies fairly above the original.

Figure 25.
Isentropic efficiency curves for the original and optimal selected blade geometry.
The simulation results indicate that the optimal selected blades under the design conditions not only improve the design performance, but also improve the off-design performance of the radial-outflow HPOT.
4. Concluding Remarks
In this paper, a numerical investigation has been conducted on a radial-outflow high-pressure oil–gas turbine utilized in a wellhead pressure energy utilization system. The flow and performance of the turbine under the design and off-design conditions were well predicted. To improve the turbine’s performance, geometric tuning was performed to adjust the flow matching and eliminate the separation flow. The conclusions are summarized below.
Using the self-defined real oil–gas physical properties, the internal flow and performance of the high-pressure oil–gas turbine was well predicted. The mismatched flow originating from the impeller blade’s leading edge results in the separated flow near the pressure surface. In addition, the significant end wall effect results in the turbine flow’s complex 3D flow characteristics, which strongly interact with the flow separations at the blade passages and result in considerable flow losses.
To evaluate the turbine’s operability under the complex operating conditions of a natural gas wellhead, numerical investigations were conducted with different inlet pressures and gas–oil ratios. As the inlet pressure rises, the throughflow capacity and the shaft power of the turbine increase. As for the isentropic efficiency, it achieves the maximum value at the design inlet pressure, reduces significantly when the inlet pressure decreases, and is slightly lower than that of the design point with an increased inlet pressure. The turbine flow and overall efficiency are greatly influenced by the gas–oil ratio: the turbine efficiency with a larger gas–oil ratio is significantly greater than that with a smaller ratio, since the impeller flow separation is weakened with an increased gas–oil ratio.
The proposed geometric tuning method enables a comprehensive and flexible adjustment of turbine blades with limited computation costs. The application of the proposed method effectively adjusts the flow matching and eliminates the separation flow in the radial-outflow turbine, by which the turbine performance is significantly improved.
Author Contributions
Conceptualization, P.S. and J.S.; CFD analysis and validation: S.W.; writing—original draft preparation, P.S. and S.W.; writing—review and editing, P.S. and J.S.; project administration, P.S. All authors have read and agreed to the published version of the manuscript.
Funding
This research received no external funding.
Data Availability Statement
The study did not report any data.
Conflicts of Interest
The authors declare no conflict of interest.
Nomenclature
| CFD | Computational fluid dynamics |
| HPOT | High-pressure oil–gas turbine |
| ORC | Organic Rankine cycle |
| LHS | Latin Hypercube Sampling |
| EPM | Eleven-parameter method |
| Nozzle inlet radius | |
| Nozzle outlet radius | |
| Correction of the nozzle exit angle | |
| Gap between nozzle and impeller | |
| Inlet blade angle of impeller | |
| Exit blade angle of impeller | |
| Normalized tangential chord | |
| Impeller inlet radius | |
| Impeller outlet radius |
References
- Hassan Amin, A.; Elbadawy, I.; Elgendy, E.; Fatouh, M. Effect of Geometrical Factors Interactions on Design Optimization Process of a Natural Gas Ejector. Adv. Mech. Eng. 2019, 11, 1687814019880368. [Google Scholar] [CrossRef]
- Riffat, S.B.; Jiang, L.; Gan, G. Recent Development in Ejector Technology—A Review. Int. J. Ambient. Energy 2005, 26, 13–26. [Google Scholar] [CrossRef]
- Fan, J.; Eves, J.; Thompson, H.M.; Toropov, V.V.; Kapur, N.; Copley, D.; Mincher, A. Computational Fluid Dynamic Analysis and Design Optimization of Jet Pumps. Comput. Fluids 2011, 46, 212–217. [Google Scholar] [CrossRef]
- Yadav, R.L.; Patwardhan, A.W. Design Aspects of Ejectors: Effects of Suction Chamber Geometry. Chem. Eng. Sci. 2008, 63, 3886–3897. [Google Scholar] [CrossRef]
- Chen, W.X.; Chong, D.T.; Yan, J.J.; Liu, J.P. Numerical Optimization on the Geometrical Factors of Natural Gas Ejectors. Int. J. Therm. Sci. 2011, 50, 1554–1561. [Google Scholar] [CrossRef]
- Chong, D.T.; Yan, J.J.; Wu, G.S.; Liu, J.P. Structural Optimization and Experimental Investigation of Supersonic Ejectors for Boosting Low Pressure Natural Gas. Appl. Therm. Eng. 2009, 29, 2799–2807. [Google Scholar] [CrossRef]
- Chen, W.X.; Chong, D.T.; Yan, J.J.; Liu, J.P. The Numerical Analysis of the Effect of Geometrical Factors on Natural Gas Ejector Performance. Appl. Therm. Eng. 2013, 59, 21–29. [Google Scholar] [CrossRef]
- Diao, A.N.; Wang, Y.L.; Guo, Y.; Feng, M.Z. Development and Application of Screw Expander in Natural Gas Pressure Energy Recovery at Ccity Gas Station. Appl. Therm. Eng. 2018, 142, 665–673. [Google Scholar] [CrossRef]
- Hesketh, J.A.; Walker, P.J. Effects of Wetness in Steam Turbines. Proc. Inst. Mech. Eng. Part C J. Mech. Eng. Sci. 2005, 219, 1301–1314. [Google Scholar] [CrossRef]
- Liu, Z.L.; Li, Y.X.; Liu, N. A Natural Gas Wellhead Heating Throttling System Based on Pressure Energy Generation and Heat Pump Heating. China Patent CN104088605A, 8 October 2014. [Google Scholar]
- Zhong, G.X.; Liu, J.W.; Lv, Z.Z.; Peng, C.Z. A Natural Gas Wellhead Pressure Energy Power System. China Patent CN103306761A, 18 September 2013. [Google Scholar]
- Maksiuta, D.; Moroz, L.; Burlaka, M.; Govoruschenko, Y. Study on Applicability of Radial-outflow Turbine Type for 3 MW WHR Organic Rankine Cycle. Energy Procedia 2017, 129, 293–300. [Google Scholar] [CrossRef]
- Welch, P.; Boyle, P. New turbines to Enable Efficient Geothermal Power Plants. Geotherm. Resour. Counc. Trans. 2009, 33, 765–772. [Google Scholar]
- Welch, P.; Boyle, P.; Giron, M.; Sells, M. Construction and Startup of Low Temperature Geothermal Power Plants. Geotherm. Resour. Counc. Trans. 2011, 35, 1351–1356. [Google Scholar]
- Luo, D.; Liu, Y.; Sun, X.J.; Huang, D.G. The Design and Analysis of Supercritical Carbon Dioxide Centrifugal Turbine. Appl. Therm. Eng. 2017, 127, 527–535. [Google Scholar] [CrossRef]
- Grönman, A.; Uusitalo, A. Analysis of radial-outflow turbine design for supercritical CO2 and comparison to radial-inflow turbines. Energy Convers. Manag. 2022, 252, 115089. [Google Scholar] [CrossRef]
- Cravero, C.; Leutcha, P.J.; Marsano, D. Simulation and Modeling of Ported Shroud Effects on Radial Compressor Stage Stability Limits. Energies 2022, 15, 2571. [Google Scholar] [CrossRef]
- Bardelli, M.; Cravero, C.; Marini, M.; Marsano, D.; Milingi, O. Numerical Investigation of Impeller-Vaned Diffuser Interaction in a Centrifugal Compressor. Appl. Sci. 2019, 9, 1619. [Google Scholar] [CrossRef]
- Persico, G.; Pini, M.; Dossena, V.; Gaetani, P. Aerodynamic Design and Analysis of Centrifugal Turbine Cascade. In Proceedings of the ASME Turbo Expo 2013: Turbine Technical Conference and Exposition, San Antonio, TX, USA, 3–7 June 2013. ASME Paper GT2013-95770. [Google Scholar]
- Druzdzel, P. Fluid-dynamic Characterization of Small-scale Organic Rankine Cycle Radial-outflow Turbine for Renewable Energy Application. Master’s Thesis, Delft University of Technology, Delft, The Netherlands, 2017. [Google Scholar]
- Al Jubori, A.M.; Al Dadah, R.K.; Mahmoud, S.; Daabo, A. Modelling and Parametric Analysis of Small-scale Axial and Radial-outflow Turbines for Organic Rankine Cycle Application. Appl. Energy 2017, 190, 981–996. [Google Scholar] [CrossRef]
- Da Silva, E.R.; Kyprianidis, K.G.; Camacho, R.G.R.; Säterskog, M.; Angulo, T.M.A. Preliminary Design, Optimization and CFD Analysis of an Organic Rankine Cycle Radial Turbine Rotor. Appl. Therm. Eng. 2021, 195, 117103. [Google Scholar] [CrossRef]
- Zhang, C.; Janeway, M. Optimization of Turbine Blade Aerodynamic Designs Using CFD and Neural Network Models. Int. J. Turbomach. Propuls. Power 2022, 7, 20. [Google Scholar] [CrossRef]
- Aspen Technology, Inc. Aspen Plus 11.1 User Guide; Aspen Technology, Inc.: Bedford, MA, USA, 2001. [Google Scholar]
- Ansys, Inc. CFX 2021R2 Help Manual; Ansys Inc.: Canonsburg, PA, USA, 2021. [Google Scholar]
- McKay, M.D.; Beckman, R.J.; Conover, W.J. A Comparison of Three Methods for Selecting Values of Input Variables in the Analysis of Output from a Computer Code. Technimetrics 1979, 21, 239–245. [Google Scholar]
- Pritchard, L.J. An Eleven Parameter Axial Turbine Airfoil Geometry Model. In Proceedings of the ASME Turbo Expo 1985: Gas Turbine Conference and Exhibit, Houston, TX, USA, 17–21 March 1985. ASME Paper 85-GT-219. [Google Scholar]
Publisher’s Note: MDPI stays neutral with regard to jurisdictional claims in published maps and institutional affiliations. |
© 2022 by the authors. Licensee MDPI, Basel, Switzerland. This article is an open access article distributed under the terms and conditions of the Creative Commons Attribution (CC BY) license (https://creativecommons.org/licenses/by/4.0/).