Abstract
A global modeling method is developed to describe the relationship between multi-type parameters and fuel cell performance, which significantly contributes to the efficient performance prediction of fuel cell systems. The multi-type parameters include operating parameters, geometric parameters of the graphite end plates, and the membrane electrolyte assembly physical parameters. An adaptive sampling method integrated with the Kriging method is newly developed for global modeling. Experiments are designed and implemented for model construction and evaluation. The results show the local development and global development in the whole design space can be balanced during the adaptive sampling process. Meanwhile, the prediction capability of accuracy and sensitivity for the global model is reliable in the whole design space. The prediction accuracy is improved by nearly 26% compared to the fuel cell model built for optimization with the same sample size. The prediction sensitivity also proved that the global model could follow the experimental variations under small input deviations.
1. Introduction
The fuel cell is a device that uses an electrochemical reaction to convert chemical energy from fuel into electrical energy. A direct methanol fuel cell (DMFC) is a proton exchange membrane fuel cell that uses methanol as fuel. It has the advantages of a simple system structure, high reliability, small noise pollution, high volume energy density, low fuel price, and so on. It has a wide application prospect in many fields.
As a complex energy conversion system, the performance of DMFC is affected by different kinds of parameters, including operating parameters such as methanol flow rate, methanol concentration, air flow rate and temperature, geometric parameters of the plate such as channel number, channel depth, and channel width, MEA physical parameters such as proton exchange membrane thickness, catalyst loading and so on. The effects of different parameters on fuel cell performance have been widely investigated. Kanin et al. [1] used the experimental design integrated with the response surface method to find the optimal operating conditions for DMFC. García-Salaberri et al. [2] built a multi-physical field model for liquid feed direct methanol fuel cells and studied the effect of operating conditions on the fuel cell performance. The results show that the fuel cell performance is primarily affected by the oxygen flow rate and temperature for the determined methanol input. Sun et al. [3] developed a three-dimensional multi-phase numerical model to study the influence of methanol concentration and temperature on the performance of the DMFC. It was found that with the increase in temperature, the methanol crossover increased, but the performance of the DMFC increased with the increase in reaction rate. Yang et al. [4] built a semi-empirical model which effectively described the relationship between operating parameters and the performance of DMFC. The model can be used to develop the optimal design and control of operating parameters in the DMFC system. Tafaoli-Masoule et al. [5] established a quasi-two-dimensional, isothermal model to obtain the optimal values for DMFC’s cell temperature, anode and cathode pressure, and channel height using the genetic algorithm. Karaoglan et al. [6] coupled the transport equations of methanol, water, and oxygen with the electrochemical relations in a mathematical model. In this way, they analyzed the influence of operating parameters on DMFC performance. The results show that the models are more accurate under low methanol concentration (under 1.2 M) and temperature (60 °C).
Ozden et al. [7] studied the influence of different flow field shapes on the performance of DMFC through experiments and developed an analysis model. The results showed that the optimal configurations were serpentine (anode) and leaf flow field (cathode). Fang et al. [8] established a two-dimensional model including a graphite plate, anode collector plate, membrane electrode assembly, and cathode collector plate to determine the appropriate thickness of the graphite electrode plate and the optimal concentration of methanol. The modeling and experimental results show that DMFC has the longest working time and energy release when the methanol concentration is 15 M, and the graphite plate thickness is 400 μm. Yu et al. [9] developed a three-dimensional computational fluid dynamics (CFD) model to predict the fuel cell performance under different flow field designs. The model can accurately reflect the performance and internal flow characteristics of DMFC. Turkmen [10] investigated the relationship between the pressure drop and the geometry of flow channels on the anode of DMFC by statistical method. It was found that the channel width mainly affected the pressure drop, but the distance between channels had little influence on the pressure drop.
Matar et al. [11] established a two-dimensional, single-phase, multi-component model to study the influence of the thickness of the cathode catalyst layer on the performance of DMFC. The results show that the performance of the medium thickness of the cathode catalytic layer (19 μm) is better than that of the thinner one (8.4 μm) and the thicker one (44 μm). Zainoodin et al. [12] developed a second model based on RSM to study the influence of Nafion content and carbon loading on the performance of DMFC. The results show that when Nafion content is 3.04 mg/cm2, and carbon load is 2.91 mg/cm2, DMFC reaches the maximum power. Abdullah et al. [13] applied the response surface methodology (RSM) to study the influence of electrocatalyst content parameters on the half-cell DMFC. They then used the obtained optimum parameters for single-cell performance testing. Jiang et al. [14] developed a two-dimensional and two-phase steady-state model of DMFC, which considered the effects of catalyst electrochemical surface area and oxygen radial and axial transfer in the cathode catalyst layer. Based on this model, it was found that in the low current density region, the increase in carbon load and Pt load in the cathode catalyst layer is conducive to improving the DMFC’s performance.
Based on the current research work, it can be found that the relationship between one or two types of parameters (operating parameters, geometric parameters, and physical parameters) and fuel cell performance has been widely investigated. However, the previous research seldom concentrated on the global modeling of multi-type parameters and fuel cell performance. Furthermore, the geometric and MEA physical parameters are determined at the design stage, which is ahead of the operating stage for operating parameters definition. The coupling effects of these three parameters have seldom been considered at the design stage to avoid design failure and improve the fuel cell performance in the whole service life. The operating parameters can only passively match with the geometric and MEA physical parameters. For this complicated energy conversion system, experimental research is expensive and time-consuming, while the efficiency of numerical simulation cannot be well guaranteed. Therefore, developing a global modeling method is still greatly needed to understand the effects of multi-type parameters on fuel cell performance to obtain efficient performance prediction.
In the present research, an adaptive sampling method is proposed to construct the global model of DMFC, considering the combined effects of multi-type parameters, and the performance of the global model will be evaluated from many aspects. In Section 2, the experimental platform and initial experimental design of DMFC are introduced in detail. In Section 3, the adaptive sampling method is developed considering both the valid prediction error and prediction variance. The construction and experimental verification of the DMFC global model are provided in Section 4. The results, analyses, and comprehensive evaluations of the global model are given in Section 5.
2. Experimental Platform and Initial Experimental Design
The experimental platform of the DMFC system is designed to flexibly control the main operating parameters such as temperature, methanol concentration, methanol flow rate, air flow rate, etc. Corresponding to the design space of operating parameters in this experiment, we need to select the appropriate auxiliary equipment to ensure the accuracy and reliability of the test values. As shown in Figure 1, the intelligent peristaltic pump (BT100LC) used in this study can set the flow rate ranging from 0.0015 to 380 mL/min. The maximum gas pressure provided by the air compressor (OTS-550-8L) is 0.7 Mpa, and the exhaust volume is 40 mL/min. The air flow meter (FMA-A2305) can control the flow rate in the range of 0–5000 ccm. The temperature controller (CSC32T) used can accurately control the temperature of DMFC from 0 °C to 250 °C. The electronic load (IT8211) used has three working modes: constant voltage, constant current, and constant resistance. The CO2 concentration detector (JA500-CO2-IR1) can detect the gas concentration in the range of 0–50,000 ppm. The output voltage of DMFC is measured by a multimeter and recorded by a PC monitoring system over time. The generated CO2 is detected at the cathode to calculate the energy conversion efficiency [15].
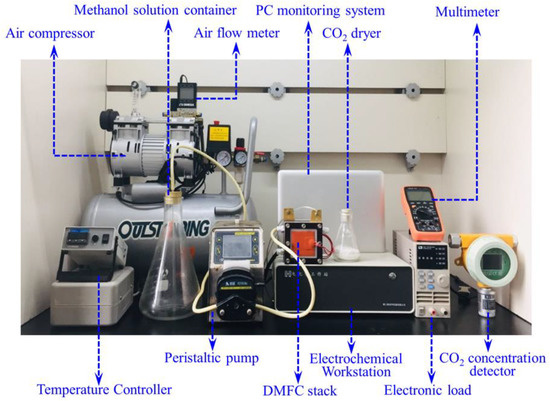
Figure 1.
The experimental platform of DMFC systems.
The preliminary experimental design comprehensively considered the experimental operating parameters, graphite end plate geometric parameters, and MEA physical parameters. As seen in Table 1, the experimental design considers five levels of four parameters, and the boundaries of the parameters are selected based on our experience and previous studies [16]. The fuel cell with the customized MEA physical parameters could operate stably in this design space. For this study, ten test protocols were developed using the uniform design method [17] (Table 2), and ten were selected considering the efficiency of fuel cell testing and the quality of data fitting.

Table 1.
Operating parameters and five levels of these operating parameters.
Table 2.
Operating parameters.
Considering the physical parameters of MEA and the load of electrode catalyst, 10 kinds of MEA were designed and customized from Fuel Cell ETC, as shown in Table 3. Generally, the anode reaction rate is relatively low, and thus its catalyst loading is designed at a constant and relatively high value 4 mg/cm2 PtRu. The diffusion layer used in the experiment is GDL-CT, a kind of woven carbon cloth with microporous layer (MPL). The total thickness is 410 microns. Meanwhile, we designed and produced two kinds of flow channels, the number of flow channels corresponding to square MEA is 30, and the number of flow channels corresponding to circular MEA is 34. Three kinds of proton exchange membrane and three kinds of cathodic catalyst support were integrated to produce nine square MEA and one round MEA. Ten sets of experiments (shown in Table 2) are implemented with each of the ten MEAs, for overall 100 initial experiments.
Table 3.
Physical parameters of MEA.
3. Adaptive Sampling Method Based on Maximizing Expected Prediction Error
Since multiple types of parameters are coupled to each other to influence the performance of DMFC, describing the effect of the parameters with a specific electrochemical expression may lead to the failure of the generic model. The computational fluid dynamics (CFD) model can be utilized to calculate fuel cell performance under different values of multi-type parameters. Numerical simulations are usually time-consuming. Meanwhile, the variations of geometric parameters and MEA physical parameters will lead to the reconstruction of CFD models. A mathematical model such as Kriging metamodel is a promising option for global model construction of multi-type parameters [18]. Figure 2 illustrates the main idea of the present research. As the experiments for model construction are usually time-consuming and expensive, developing a new sampling method for efficient model construction is in great demand.
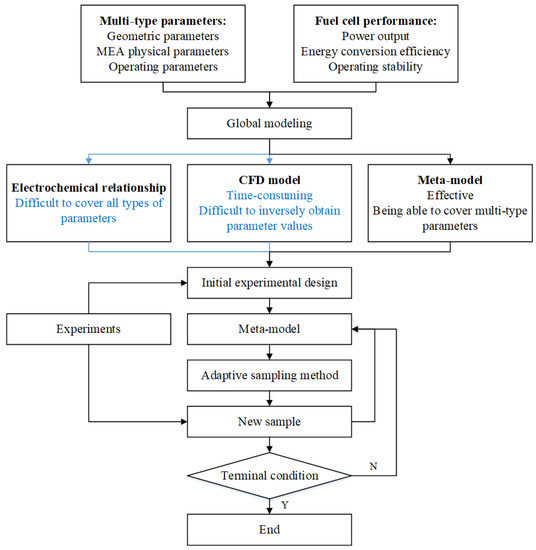
Figure 2.
Schematic of global modeling process.
3.1. Basis of Kriging Metamodel
Metamodeling techniques have been developed from various disciplines, including engineering disciplines. These metamodels were initially developed as “surrogates” of the expensive simulation process to improve overall computation efficiency and quality [19]. As a popular metamodel type, the Kriging model has high fitting accuracy in high-dimensional nonlinear functions, which is appropriate for the global model construction. Therefore, the Kriging model is selected in the present research, which can be expressed as:
where is the input vector with n variables; is the vector which represents the regression function; is the vector indicating the corresponding regression coefficients; is usually considered as Gaussian random processes.
3.2. Adaptive Sampling Method
The experimental data from 100 initial experiments are insufficient to build an accurate Kriging model and can only be used to build an initial model. Increasing samples evenly on a large scale for the design space would not be feasible due to high time and economic costs. The adaptive sampling method is thus needed for the construction process of the global model. In the adaptive sampling process, the new sample is identified by optimizing the objective function for the sampling process. It is significant to design the appropriate objective function considering the local and global features of the relationship between the multi-type parameters and the fuel cell performance. For this objective function, both the prediction variance and the deviation should be considered and balanced in the objective function [20]. The prediction variance represents the requirement of global exploration in the design space, as the locations with fewer samples have high prediction variance. Meanwhile, the prediction deviation information (between the observed and the predicted one) indicates the demand for local exploitation in the touched areas in the design space.
In the adaptive sampling process, the interpretations of prediction variance and prediction deviation are close related to the built Kriging model. Without the consideration of the inherent data noise, the expected prediction error (EPE) of the Kriging model at point x can be interpreted as:
where is the true response at point x, is the prediction response at point x of Kriging model, is the square of true prediction deviation at point x, which can be expressed by , is the prediction variance at point x of Kriging model. It could be believed that the adaptive sampling process for the new points ought to balance the prediction and the prediction variance. For x ∈ U (U = D/XD), the prediction deviation in Equation (2) cannot be determined because the true response f(x) is unknown. Therefore, a reasonable approximation for the prediction deviation is needed in the subsequent process.
The k-fold cross-validation (CV) method [19] can be utilized to estimate the prediction deviation, for which the commonly used one is the one-leave-out method (k = 1). It selects a certain point as the validation point, and uses the remaining m − 1 points to rebuild the model to obtain the cross-validation error, which is expressed as follows:
where is the cross-validation error at point xi, f(xi) is the true response at point xi, and is the response value of the new model at point xi. In the present research, three adjacent points are newly selected for the calculation to estimate the cross-validation error at any unknown point x ∈ U. The cross-validation errors of three points x1, x2, x3 which belong to the existing initial points set and have the shortest distances to the new point, are calculated to generate the average value of errors, as shown in Equation (4). The reason why we selected three adjacent points lies in the fact that the single closest point may not be sufficient for the estimation of cross-validation error in the highly nonlinear relationship. This average value is utilized to substitute the cross-validation error at point x.
Then, the prediction deviation in Equation (2) can be replaced with the cross-validation error, which is expressed as follows:
It should be noted that the local exploitation item and the global exploration item cannot be completely satisfied at the same time and should be balanced. Therefore, we introduce a balance factor as the weighting factor of local exploitation item when q > 1. Meanwhile, 1 − is the weighting factor for the global exploration item, Equation (5) can be modified as:
where criterion needs to tradeoff between local exploitation and global exploration, which greatly impacts the performance of the adaptive sampling method. When α has a larger value, the sampling method is more inclined to local exploitation. Contrarily, when α has a smaller value, the sampling method is more inclined to global exploration. The α is calculated as [20]:
where m represents the number of samples for initial model construction, q denotes the iteration number of adaptive sampling. In the (q − 1)-th iteration, the true response to the new point xm + q − 1 can be obtained by experiments. The α value in the current qth iteration is determined by the data from the last iteration, which are the prediction error and cross validation error for the point xm + q − 1 in the (q − 1)-th iteration. If , it is indicated that the cross-validation error overestimated the true prediction error, and more attention should be paid to global exploration. Therefore, in the q-th iteration, the α value decreases from 0.5 to . If the cross-validation error is equaling to the true prediction error at point , the weighting factor is set to 0.5 and criterion equally treats the local exploitation and the global exploration. If , it is indicated that the cross-validation error underestimates the true prediction error and the α value will be changed to or 1. The criterion will guide the search to local exploitation. The constant 0.99 is used to prevent the value of α from being 1, as criterion will make the sampling process only focus on the local exploitation item under that condition. Finally, the selection of a new sample point in the adaptive sampling method can be expressed as follows:
4. DMFC Multi-Type Parameters Global Model
4.1. Initial Model
For each of the 100 initial experiments, the corresponding data point for the I–V curve has been collected, and the energy conversion efficiencies are obtained. As to the data collected from the initial experiments, methanol concentration, methanol flow rate, air flow rate, operating temperature, proton exchange membrane thickness, cathode catalyst load, and channel number are considered as the inputs. Meanwhile, the average value of the energy conversion efficiencies at the currents of 0.3 A, 0.4 A, and 0.5 A for each I–V curve is considered as the output. These 100 groups of data are utilized for initial modeling with the Kriging method, which has been shown in Equation (1).
4.2. Model Evolution Based on Adaptive Sampling
With the initial model, more samples will be generated with the experiments guided by the adaptive sampling process to build the global model. As described in Section 3, the new sampling point will be successively obtained based on the developed adaptive sampling algorithm, as shown in Equations (6)–(8). While the algorithm obtains each new input, the corresponding experiments will be carried out to achieve the output. The new sample point will be used to rebuild the Kriging model and the previous samples. Meanwhile, the new weighting factor is calculated according to Equation (7). This process continues until the defined terminal condition is met. The terminal condition is defined as the new sample points reaching 35 to keep the same sample size compared to our previous study [21]. It should be noted that approximate treatments are needed for geometric parameters and physical parameters as their values are discrete in the design space.
The new points generated during the model evolution process, of which the inputs are from the adaptive sampling method and the outputs are from the corresponding experiments, are listed in Table 4. As shown in Table 4, 35 groups of experiments cover nine MEAs, and the operating parameters are relatively scattered. Thus, the adaptive sampling method could fully consider the universality of samples in the sampling process in the case of the local gathering of the sample points. Meanwhile, the new sample points have not simply followed the uniform distribution. Some MEAs have engaged in more experiments, such as MEA08, MEA05, and more. Some MEAs, such as MEA02 and MEA06, have engaged in fewer experiments. It is indicated that the adaptive sampling method will take more sample points in the area of interest. Therefore, it could be considered that the adaptive sampling method has balanced the local and global exploitation in the sampling process.
Table 4.
Adaptive sampling data.
4.3. Model Validation
In order to test the model built from the initial 100 samples and the 35 adaptive samples, validation experiments are designed with the Uniform Design method. The uniform design of U9(34) is utilized for the four operating parameters, and then nine sets of operating parameters are obtained, which are applied for the nine kinds of square MEAs, respectively. The parameters of the validation experiments are shown in Table 5.
Table 5.
Validation experiment parameters.
According to the experimental design above, the validation experiments are performed to obtain nine I–V curves, as shown in Figure 3. The energy conversion efficiency corresponding to each curve point is calculated. The energy conversion efficiencies at the currents of 0.3 A, 0.4 A, and 0.5 A are averaged as the output, as shown in Figure 4. These nine sets of inputs are also imported into the built DMFC global model for output prediction. The experimental values and model prediction values are compared in Table 6.
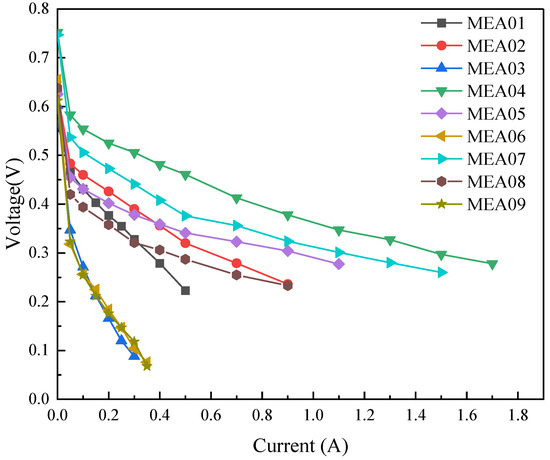
Figure 3.
Polarization curves.
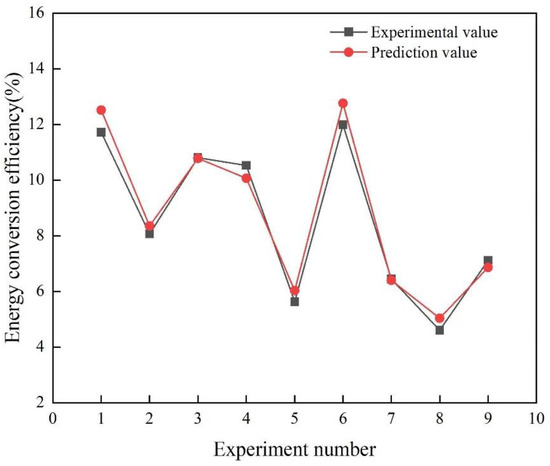
Figure 4.
Comparison of energy conversion efficiency between experimental and predicted values.
Table 6.
Global model validation.
In Table 6, the absolute error is the difference between the model-predicted and the experimental values. The relative error is calculated by dividing the absolute value of the absolute error by the experimental value. The accuracy is 1 minus the relative error, as shown in Equation (9).
In the equation, ηp is the model prediction value, and ηe is the experimental value. It can be seen from Table 6 that the accuracy values for most validation experiments are above 90%, and the average accuracy for the nine sets of validation experiments reaches up to 95.2972%. The prediction accuracy for the built DMFC global model is validated. For constructing the global model, data from 135 experiments are utilized, consisting of 100 initial experiments and 35 experiments guided by the adaptive sampling method. In order to evaluate the effectiveness of the adaptive sampling method, the prediction accuracy of the model built from the 100 initial experiments is also evaluated for comparison. The 9 sets of parameters in Table 5 are also utilized, with the results shown in Table 7. As shown in this table, the average relative prediction error is 9.1429%, and the prediction accuracy is 90.8571%. Referring to the relative prediction error of 4.7000% from the global model (built from 135 experiments), it can be seen that the prediction error has been decreased by 46% with the increment of 35 experiments (35% samples increase compared to the 100 initial experiments). The effectiveness of the developed adaptive sampling method can thus be validated. The efficient increase in the prediction accuracy indicates that the developed adaptive sampling method can well balance the local and global development of the global model.
Table 7.
Initial model validation.
Moreover, the prediction capability of the developed optimization model [21], which has the same initial 100 samples and sample size (135 samples) as the global model, has also been evaluated in the whole design space (using the parameters in Table 5). The average value of the model accuracy of the DMFC optimization model is only 64.9382%, which is almost 26% lower than the average value of the model accuracy of the DMFC global model. It can also be found that the prediction accuracy of the optimization model in the whole design space is lower than the initial model, which is built from the 100 initial samples. The reason is that the subsequent 35 samples in the optimization model construction gathered around the optimal area and affected the prediction accuracy in the whole design space. Meanwhile, the necessity of developing a global mathematical model for understanding the effects of multi-type parameters on DMFC performance and efficient prediction of fuel cell performance is also validated.
4.4. Prediction Sensitivity Analysis
In addition to prediction accuracy, prediction sensitivity has also been investigated in the present research. The prediction sensitivity here is defined as the prediction accuracy under the operational environment with uncertainty. In the present research, fine parameter adjustments have been utilized to simulate environmental uncertainty. In order to analyze the prediction sensitivity of the DMFC global model, we selected three of the nine groups of experimental parameters in Section 4 (No. 1, No. 5, and No. 9) and introduced artificial deviations into these three experimental parameters. Precisely, the methanol flow rate in the No. 1 experiment, the air flow rate in the No. 5 experiment, and the temperature in the No. 9 experiment are adjusted by 5%, respectively, as shown in Table 8.
Table 8.
Data of model robustness analyses.
According to the three sets of parameters in Table 8 above, experiments and simulations were conducted, respectively, to obtain output values for comparisons. As shown in Figure 5, corresponding to the 5% deviation for one of the operating parameters, the relative output variations from the experiments and mathematical calculations are close. The immediate response could also be reflected with the global model when the fine parameter adjustments happen. It is also indicated that the global model could also follow the experimental trend under disturbances. Therefore, both the prediction accuracy and sensitivity can thus be validated.
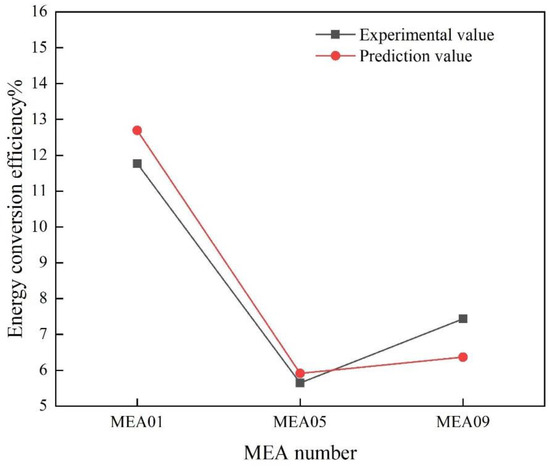
Figure 5.
Energy conversion efficiency comparison with operational uncertainty.
5. Conclusions
An adaptive sampling method integrated with the Kriging method has been developed for the global model construction to describe the relationship between multi-type parameters and the fuel cell performance. The effects of the multi-type parameters on the fuel cell performance can be reasonably quantified. With this global model, the fuel cell performance can also be efficiently predicted under the variations of multi-type parameters, including operating parameters, geometric parameters of the graphite end plates, and the membrane electrolyte assembly physical parameters. The results show that the developed adaptive sampling method can well balance the local and global development of the global model. The prediction error has been decreased by 46% with the increase of 35% samples compared to the initial model. The prediction accuracy has been improved by nearly 26% compared to the fuel cell model for optimization with the same sample size. Furthermore, the prediction sensitivity has also proved that the output relative variations from the global model could follow the variations from experiments under slight input deviations.
Author Contributions
Conceptualization, Q.Y.; methodology, Q.Y.; software, Q.Y., G.X.; validation, T.L.; formal analysis, Q.Y.; investigation, T.L.; data curation, G.X.; writing—original draft preparation, Q.Y., G.X.; writing—review and editing, T.L.; visualization, B.G.; supervision, S.C.; project administration, Q.Y., G.X. All authors have read and agreed to the published version of the manuscript.
Funding
This research was funded by the [National Natural Science Foundation of China] grant number [Nos. 51975196 and 52075159], the [Natural Science Foundation of Hunan Province] grant number [2022JJ30019], [Virtual Reality Key Application Technology Research (Revealed and Commanded) Project of Jiangxi Province] grant number [No. 20220173], the [State Key Laboratory of Clean Energy Utilization] grant number [No. ZJUCEU2020010] and the [open foundation of Guangxi Key Laboratory of Processing for Non-ferrous Metals and Featured Materials, Guangxi University] grant number [No. 2022GXYSOF24]. And The APC was funded by [Virtual Reality Key Application Technology Research (Revealed and Commanded) Project of Jiangxi Province] grant number [No. 20220173].
Conflicts of Interest
The authors declare that they have no known competing financial interest or personal relationships that could have appeared to influence the work reported in this paper.
References
- Charoen, K.; Prapainainar, C.; Sureeyatanapas, P.; Suwannaphisit, T.; Wongamornpitak, K.; Kongkachuichay, P.; Holmes, S.M.; Prapainainar, P. Application of response surface methodology to optimize direct alcohol fuel cell power density for greener energy production. J. Clean. Prod. 2017, 142, 1309–1320. [Google Scholar] [CrossRef]
- García-Salaberri, P.A.; Vera, M. On the effect of operating conditions in liquid-feed direct methanol fuel cells: A multiphysics modeling approach. Energy 2016, 113, 1265–1287. [Google Scholar] [CrossRef]
- Sun, J.; Zhang, G.; Guo, T.; Jiao, K.; Huang, X. A three-dimensional multi-phase numerical model of DMFC utilizing Eulerian-Eulerian model. Appl. Therm. Eng. 2018, 132, 140–153. [Google Scholar] [CrossRef]
- Yang, Q.; Kianimanesh, A.; Freiheit, T.; Park, S.S.; Xue, D. A semi-empirical model considering the influence of operating parameters on performance for a direct methanol fuel cell. J. Power Sources 2011, 196, 10640–10651. [Google Scholar] [CrossRef]
- Tafaoli-Masoule, M.; Bahrami, A.; Elsayed, E. Optimum design parameters and operating condition for maximum power of a direct methanol fuel cell using analytical model and genetic algorithm. Energy 2014, 70, 643–652. [Google Scholar] [CrossRef]
- Karaoglan, M.U.; Ince, A.C.; Glüsen, A.; Colpan, C.O.; Müller, M.; Stolten, D.; Kuralay, N.S. Comparison of single-cell testing, short-stack testing and mathematical modeling methods for a direct methanol fuel cell. Int. J. Hydrogen Energy 2020, 46, 4844–4856. [Google Scholar] [CrossRef]
- Ozden, A.; Ercelik, M.; Ouellette, D.; Colpan, C.O.; Ganjehsarabi, H.; Hamdullahpur, F. Designing, modeling and performance investigation of bio-inspired flow field based DMFCs. Int. J. Hydrogen Energy 2017, 42, 21546–21558. [Google Scholar] [CrossRef]
- Fang, S.; Zhang, Y.; Zou, Y.; Sang, S.; Liu, X. Structural design and analysis of a passive DMFC supplied with concentrated methanol solution. Energy 2017, 128, 50–61. [Google Scholar] [CrossRef]
- Yu, B.; Yang, Q.; Kianimanesh, A.; Freiheit, T.; Park, S.; Zhao, H.; Xue, D. A CFD model with semi-empirical electrochemical relationships to study the influence of geometric and operating parameters on DMFC performance. Int. J. Hydrogen Energy 2013, 38, 9873–9885. [Google Scholar] [CrossRef]
- Turkmen, A.C.; Celik, C.; Esen, H. The statistical relationship between flow channel geometry and pressure drop in a direct methanol fuel cell with parallel channels. Int. J. Hydrogen Energy 2019, 44, 18939–18950. [Google Scholar] [CrossRef]
- Matar, S.; Ge, J.; Liu, H. Modeling the cathode catalyst layer of a Direct Methanol Fuel Cell. J. Power Sources 2013, 243, 195–202. [Google Scholar] [CrossRef]
- Zainoodin, A.; Kamarudin, S.; Masdar, M.; Daud, W.; Mohamad, A.; Sahari, J. Optimization of a porous carbon nanofiber layer for the membrane electrode assembly in DMFC. Energy Convers Manag. 2015, 101, 525–531. [Google Scholar] [CrossRef]
- Abdullah, N.; Kamarudin, S.; Shyuan, L.; Karim, N. Synthesis and optimization of PtRu/TiO2-CNF anodic catalyst for direct methanol fuel cell. Int. J. Hydrogen Energy 2019, 44, 30543–30552. [Google Scholar] [CrossRef]
- Jiang, J.; Li, Y.; Liang, J.; Yang, W.; Li, X. Modeling of high-efficient direct methanol fuel cells with order-structured catalyst layer. Appl. Energy 2019, 252, 113431. [Google Scholar] [CrossRef]
- Yang, Q.-W.; Hu, X.-Q.; Zhu, Y.; Lei, X.-C.; Yu, B.; Ji, S.-C. Extended criterion for robustness evaluations of energy conversion efficiency in DMFCs. Energy Convers. Manag. 2018, 172, 285–295. [Google Scholar] [CrossRef]
- Yang, Q.; Xiao, G.; Li, L.; Che, M.; Hu, X.-Q.; Meng, M. Collaborative design of multi-type parameters for design and operational stage matching in fuel cells. Renew. Energy 2021, 175, 1101–1110. [Google Scholar] [CrossRef]
- Fang, K.T.; Lin, D.K.; Winker, P.; Zhang, Y. Uniform design: Theory and application. Technometrics 2000, 42, 237–248. [Google Scholar] [CrossRef]
- Lophaven, S.N.; Nielsen, H.B.; Søndergaard, J. DACE A Matlab Kriging Toolbox-Version 2.0; Technical Report, IMMREP-2002-12; Technical University of Denmark: Kongens Lyngby, Denmark, 2002. [Google Scholar]
- Wang, G.G.; Shan, S. Review of Metamodeling Techniques in Support of Engineering Design Optimization. J. Mech. Des. 2006, 129, 370–380. [Google Scholar] [CrossRef]
- Liu, H.; Cai, J.; Ong, Y.-S. An adaptive sampling approach for Kriging metamodeling by maximizing expected prediction error. Comput. Chem. Eng. 2017, 106, 171–182. [Google Scholar] [CrossRef]
- Yang, Q.; Chen, S.; Xiao, G.; Li, L.; Liu, T.; Feng, J. Joint operation of adaptive numerical simulation and adaptive optimization for direct methanol fuel cell performance improvement. J. Clean. Prod. 2020, 289, 125630. [Google Scholar] [CrossRef]
Publisher’s Note: MDPI stays neutral with regard to jurisdictional claims in published maps and institutional affiliations. |
© 2022 by the authors. Licensee MDPI, Basel, Switzerland. This article is an open access article distributed under the terms and conditions of the Creative Commons Attribution (CC BY) license (https://creativecommons.org/licenses/by/4.0/).