Abstract
The deployment of renewable energy (RE) needs to be policy-driven and supported by public funds. Hence, the aim of this study was to find out whether urban and rural areas benefit from public funds for RE deployment equally and whether factors determining other types of investments also determine investments in RES. To do so, we carried out: (i) comparative analyses of qualitative and quantitative data describing 2642 investments in solar RE supported by the European Union funds and carried out in Poland under operational programmes in 2014–2020; (ii) multiple linear regressions, evaluating the predictions. Findings showed that principles of supporting solar RE investments were the same for all kinds of beneficiaries in both urban and rural areas. However, in rural areas, most RE investments cumulated in eastern, north-eastern and south-eastern parts of Poland, and depended only on few socio-economic characteristics. RE investments in urban areas were dispersed all over the country rather evenly and did not depend on any of the socio-economic characteristics. Individual households appeared to be important silent partners to RE investments carried out by local governments. Thus, future policies should focus on them more to increase the deployment and use of solar RE.
1. Introduction
In many social and economic contexts, including the European Union [1,2,3,4,5,6,7,8], it has been proved and broadly acknowledged that the deployment of renewable energy needs to be policy driven and supported by public funds in order to eliminate barriers and accelerate the use of renewable energy sources [9,10,11,12].
Although in the European Union there was continuous progress and an upward trend in renewables, there has been a significant slowdown in renewable energy investments since 2015 [13], and so the process of renewable energy deployment has been assessed to be too slow [14]. The yet-unsatisfying pace of renewable energy deployment in the EU as a whole, and in its individual member states, results from various barriers, which are recognised as technical, administrative, legal, financial and—last but least—social [15,16,17].
These facts raise serious concerns about achieving the 2030 renewable and sustainable energy targets [18,19], the goals of the resilient Energy Union [20] and consequently, effective climate-change prevention [13]. They also explain why the support for the deployment of renewable energy sources has become one of the main aims of the EU during the transition to a low-carbon economy [21,22,23] and provides a rationale for maintaining this aim as a development priority.
The EU offers financial support to its member states for the development of renewables [24,25,26] under regional and cohesion policy [27,28], aimed at public intervention at the territory level. The instruments used for this purpose are mainly structural and investment funds, which are also one of the main elements of the intervention policy. They are increasingly becoming the driving forces of state and regional governance, supporting the implementation of operational programmes aimed at achieving stable economic development and reducing divergence. As described by Swiader et al. [29], Poland has been obliged to take actions to increase the renewable energy in the energy mix, and the operational programmes were indicated as the main financial instruments to achieve it. EU funds are non-commercial and non-refundable public funds [30] addressed in Poland to different groups of potential beneficiaries all over the country, under either nationwide or regional operational programmes.
However, urban and rural areas, having different development needs and potential [31], may benefit from this support differently. Thus, in order to create a more efficient and effective renewable energy deployment policy design, affecting positively and strongly both urban and rural areas, it is crucial to acquire a more comprehensive understanding of the effects so far of EU public funds on solar renewable energy investments in urban and rural areas, as well as factors conditioning these effects. Despite the importance of such understanding, the facts about the effects of EU funds on the renewable energy investments have not been investigated holistically yet. This study was performed to fill in this gap through an exploratory and explanatory contribution, based on answers to the following research questions:
Q1. Did the operational programmes of 2014–2020 define the same or different principles of the EU funding for investments in solar renewable energy for different groups of potential beneficiaries?
Q2. What are the main outcomes of the analysed investments in solar renewable energy in urban and rural areas?
Q3. Were there any differences in the value of EU funding or the number of solar renewable energy investments among urban areas and among rural areas (intra-case analyses)?
Q4. Did the value of EU funding depend on selected social and economic characteristics of the urban and rural municipalities where the solar renewable energy investments were located?
To answer these questions, we chose to analyse solar renewable energy (SRE) investments because: (i) solar energy is most available in Poland, and photovoltaics have been the most important sector for investments in RES in Poland [32]; (ii) deployment of solar renewable energy is conditioned by quite similar conditions in urban and rural areas all over the country; (iii) the deployment of solar renewable energy is pointed to as a very important factor for the development of urban and rural areas in Poland, since it is the main renewable energy source for the country.
Answers to the research questions may contribute both to science and to practice by: (i) finding out what outcomes public funds cause in urban and in rural areas when they are addressed to certain potential beneficiaries under operational programmes rules, (ii) investigating the rural and urban differences in these outcomes, and (iii) verifying whether the selected socio-economic characteristics of rural and urban communities, defining their levels of development, influence the absorption of EU funds supporting solar RE investments.
2. Literature Review
2.1. Significance of Renewable Energy Deployment for Urban and Rural Development
The diffusion of renewable energy sources will transform economies on a macro and micro scale, both urban and rural areas. The International Renewable Energy Agency (IRENA) forecasted that the share of renewable energy in the primary energy supply will grow from one-sixth in 2020 to nearly two-thirds in 2050 [33]. Several changes will take place regionally and locally; however, as highlighted by Young and Brans [34], such changes will occur on the local level especially. Several publications assumed and reported positive and negative impacts on both supply and demand sides, including many trade-offs. The changes are reported to affect socio-economic, environmental and institutional factors.
From the socio-economic point of view, the slow revolution towards renewable energy production and consumption causes diversification of economic activities and new sources of income [35]. Renewable energy deployment creates opportunities for the development of public and private businesses, both in developed localities, such as metropolitan areas [36], and in developing peripheral territories [37]. The development of businesses will additionally cause an increase in the demand for labour [38,39].
On the regional scale, renewable energy production will impact decentralization of energy production and supplies [40] and enable a step-down to community-owned energy sources [41]. As reported by several scholars, renewable energy production also causes positive externalities for the environment. As claimed by Oudes and Stremke [42], renewable energy production transforms the existing landscapes by changing their structures and composition, along with their functions. Picchi et al. [43] highlighted that it also impacts ecosystem services. Additionally, Mathiesen et al. claim that such activities positively impact the health of local inhabitants [44]. Nonetheless, as argued by Santangeli et al. [45], the increasing renewable energy deployment may spur conflicts over the use of limited land for energy production as opposed to biodiversity conservation.
2.2. The Need of Public Financial Support for Faster and More Widespread Renewable Energy Deployment
Many studies proved that financial barriers are among the greatest bottlenecks hindering the deployment of renewable energy in many regions [15,46] and countries of the world [47,48], in urban and rural areas and in different social and economic conditions [49,50,51,52]. A lack or shortage of funding is also an obstacle in the deployment of renewable energy in EU member states. It may hinder renewable energy investments by, e.g., enterprises, or by local and regional authorities [53].
Investments in renewable energy sources, in particular, in photovoltaic technologies, are financed from various sources [54]. Financing investment projects related to renewable energy requires the involvement of many entities, not only in technical and organizational terms but in financial terms. The literature sources indicate the use of an extensive spectrum of financial mechanisms, from private, through community, to public ones [55,56,57]. The most frequently used financial mechanisms in solar energy investments are various types of combinations of the investor’s equity capital with external capital [58,59]. Among these solutions, the grants and the subsidies are dominating [60,61,62]. These public funds, apart from their investment role, also play the role of promoting solutions that are consistent with state policy and are a source of innovation diffusion [63,64]. The various types of financial mechanisms based on bonds play an important role in financing renewable energy investments, including solar equipment. Often, these are in the form of social or community bonds [65,66] or specific bonds called green bonds [67], pointing to the important role of social involvement in renewable energy issues. Public–private partnerships also play an important role in this respect [59]. Crowd funding mechanisms are a particular innovation in terms of financing investments in green energy sources [68]. This option gives an opportunity to small investors to offer financial support, often a loan with low interest rate and a long debt tenor. The increase in popularity of such solutions results not only from factors related to the growing awareness and proactivity of the society, but also from government incentives related to tax cuts [69]. Apart from innovative financial instruments, classic bank support is evidenced, but this instrument has a less important role in relation to cheaper sources of capital [70]. Literature sources also indicate the existence of other financial instruments used in investing renewable energy, such as venture capitalists [71] and foreign direct investment [72]. It is important to keep in mind that financing for renewable energy involving multi-actor activities and practices, often along with implementation of innovative financial instruments, is associated with several risks which investors should take into account [73,74].
At the same time, it should be remembered that regardless of the adopted level of risk and the investment model used, the implemented investments bring specific benefits, both private and public. In particular, many authors point to the benefits of using public funds in investments of this type—primarily subsidies. Several studies indicate the role of public funds in supporting solar energy investments and achieving spillover effects. The results of the involvement of public funds are not only the development of renewable energy sources, but also economic growth [64,75] and job creation [76]. Some authors point to issues of energy efficiency [77] and ecological sustainability [63,78], and other authors emphasize the roles of economy deregulation and educational transformations [79].
All these provide a rationale for supporting renewable energy investments from public funds, if they are available.
3. Materials and Methods
3.1. Data Sources
To investigate and discuss the differences in urban and rural solar renewable energy investments supported by public funds, this study was based on a complete set of data describing the outcomes of solar renewable energy investments carried out in Poland and co-financed by the EU’s regional policy funds under operational programmes in 2014–2020, as of 31 May 2021.
The theoretical background was elaborated based on a review of the literature, legal acts, and qualitative data retrieved from operational programs in 2014–2020. The quantitative data were obtained from sources listed and described in Table 1.

Table 1.
Data categories and sources.
3.2. Methods—Rationale for Selection of Variables
In the first stage, the datasets from different sources (Table 1) were verified, completed, cross checked and merged into one database, using TERYT code and categories of administrative units by DEGURBA classification.
To answer Q1 (Table 2), we concluded an analysis based on the qualitative data listed in Table 1, using standard qualitative analysis tools [86,87,88,89].
Table 2.
Methodological framework.
To answer Q2–Q5, we applied descriptive statistics. To answer Q3, we elaborated maps (Figure 1 and Figure 2) showing differences in the value of EU funding supporting solar renewable energy investments within individual urban and rural municipalities (intra-case analysis).
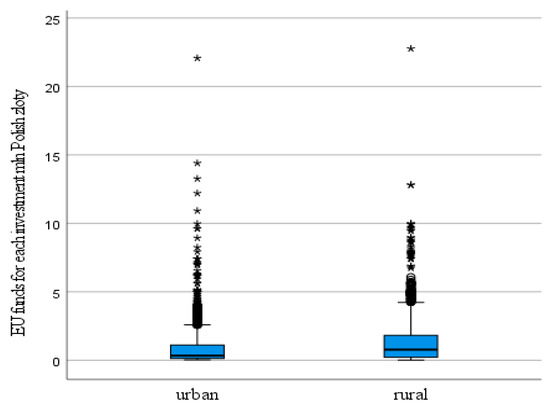
Figure 1.
Boxplots of EU funds per solar renewable energy investment under operational programmes in 2014–2020 in urban and rural areas. Explanation: * shows the value of EU funding in mln Polish zloty for each solar RE investment in urban and in rural areas.
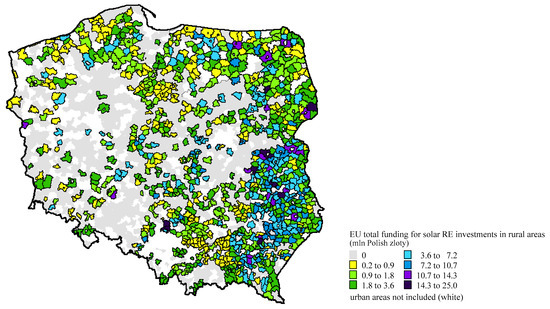
Figure 2.
Total value of EU funds for solar RE investments in rural areas under operational programmes in 2014–2020, mln Polish zloty, as of 31 May 2021.
Next, to explore the relationships between the selected dependent variable and independent variables (predictors), we applied multiple linear regression.
To answer if the value of the absorbed EU funding depended on selected social and economic characteristics of the urban and rural municipalities where the solar renewable energy investments were located (Q4), we carried out two multiple linear regressions. In the case of linear regression for urban areas, the value of EU funding obtained for each analysed investment in urban municipalities was a dependent variable (DV1); and data categories describing socio-demographics, living conditions and economic conditions were predictors, listed in Table 3 as x6–x19. The same design was used for rural areas, where the values of EU funding obtained for the analysed investments in rural municipalities was a dependent variable (DV2) and x6–x19 (Table 3) were predictors. The predictors are the key characteristics defining the level of development of communities. They were selected based on the literature review and authors’ research experience.
Table 3.
Definitions of predictors used in multiple linear regressions.
4. Results
4.1. The Main Socio-Economic Characteristics of Rural and Urban Areas in Poland
Taking into consideration administrative division at the local level and applying DEGURBA classification, urban areas comprise 601 municipalities, and rural areas, 1878. Consequently, there were 601 local governments in urban areas and 1878 in rural areas that could be potential beneficiaries of EU funds supporting the deployment of renewable energy.
Urban areas in Poland are inhabited by 64% of total population, which gives the average density of 691 persons per 1 km2. Rural areas are inhabited by 34% of total population. The average density is 67 persons per 1 km2. The share of old population in urban areas is by 2 percentage points (pp) higher than in rural areas, and the share of the population of working age is 1.7 pp lower. The members of urban local authorities are on average 1 year older than those in rural municipalities (Table 4).
Table 4.
Main characteristics of urban and rural areas in Poland.
The population in rural areas is poorer and more dependent on social assistance—in rural areas there were on average 372 beneficiaries of state social assistance per 10,000 inhabitants more than in urban areas. Rural areas also have higher registered unemployment rates.
Taking into consideration technical infrastructure, the standard of living in urban areas is higher, as 93% of dwellings are connected to the sewerage system, 78% to water supply systems and 57.5% to gas supply lines. These indices are lower in rural areas by 6.4, 37.6 and 40.7 percentage points, correspondingly.
More businesses are located in urban than in rural areas, so both the average PIT and CIT municipality budget revenues per capita were higher in urban than in rural areas. However, the average total municipality budget revenues per capita were slightly (by 11.5 Polish zloties) higher in rural than in urban areas.
4.2. The Main Assumptions of Operational Programmes in 2014–2020 about the EU Funding for Solar Renewable Energy Investments
The first part of the study on the assumptions of the operational programs of 2014–2020 about co-funding the solar renewable energy investments in Poland was based on the analysis of all operational programs. The cross check with the SL 2014 database, showing all investments, confirmed that the Operational Program Infrastructure and Environment 2014–2020 and 16 regional operational programs were sources of EU funds supporting this objective.
Operational Programme Infrastructure and Environment 2014–2020 was a national programme to support low carbon economy, environmental protection, adaptation to climate change, transport and energy security. EU funds from this programme were used also for investment in the health and cultural heritage [85]. The programme assumed the reduction of carbon emission through utilisation of existing and development of potential solutions with the highest energy efficiency, with an emphasis of complex and networking solutions. Due to the fact that the intervention was of a horizontal nature and affected the entire country, supported target groups were individual users and businesses using the electricity, natural gas (biogas) and heat networks. Within priority axis 1, “Decreasing the emission intensity of the economy,” there was a dedicated action aimed at supporting investments in the production of energy from renewable sources. The main aim of this action was to support the implementation of investment projects concerning: construction or reconstruction of generating units resulting in an increase in energy production from renewable sources, including connection of these sources to the distribution and transmission network.
Voivodship self-governments received almost 40% of the total of EUR 72.9 billion allocated to Poland from the EU Cohesion Policy budget for 2014–2020. Regional authorities could allocate these funds under regional operational programmes to meet the most vital development needs, including the deployment of RE. This way, regional operational programmes became another core mechanism in Poland, providing public funds supporting investments in the production of RE. Additionally, the role of regions in the management of EU funds has been increased.
Dedicated support activities focused mainly on projects related to the construction of new generation sources—thermal and electricity generation. The group of generation sources included primarily geothermal, wind, water, solar, biomass and biogas energy. The implementation of investments in this area aimed to increase the number of new renewable energy source installations and the level of energy production from renewable sources, which significantly strengthened local energy security and increased new generation capacities.
The analysis of the strategic approach of particular measures dedicated to renewable energy installations under actions of the Operational Programme Infrastructure and Environment 2014–2020 as a country-wide programme and sixteen regional operational programmes (Table 5) indicated significant similarities, with only a few differences. All of the analysed programmes focused on projects aimed at increasing the production of electricity and heat from renewable sources by implementing investments in the construction or reconstruction of electricity and heat generation units. First of all, the use of small energy sources, located close to the recipient, reducing transmission losses and ensuring the ecological effect by increasing the share of renewable energy in consumption (distributed energy), was promoted. In all analysed regions, the measures were dedicated to both public and private entities. Only in two cases (Świętokrzyskie and Małopolskie), there was an additional indication to support rural areas. In six of the analysed regional operational programmes (for voivodships: Dolnośląskie, Lubelskie, Małopolskie, Podlaskie, Podkarpackie and Świętokrzyskie) special attention was paid to less developed areas.
Table 5.
Strategic approach of particular measures dedicated to renewable energy installations in Poland in the years 2014–2020.
Summing up, the requirements for obtaining EU funds from different groups of rural and urban beneficiaries were the same in all operational programmes (answer to research question 1—Q1). Private and public entities, self-government entities, churches, educational institutions, cultural institutions and farmers were all eligible for support.
4.3. The Main Rural-Urban Differences in Solar RE Investments Carried Out under Operational Programmes 2014–2020 (Inter-Case Analysis)
The EU funds co-financed 3362 investments in solar renewable energy carried out under operational programmes 2014–2020. The EU funding equalled 4047.1 million Polish zloty and constituted 60% of the total value of these investments.
Results referring to research question 2 (Q2) show that a majority (64%) of the analysed investments were located in rural areas, and also a majority (71%) of EU funds supporting solar renewable energy were invested in rural areas (Table 6). Urban areas accommodated the remaining 36% of investments and had a share of 29% of the total of EU funding obtained for this aim. However, the average value of EU funds per investment in urban areas was higher than in rural areas.
Table 6.
The main rural–urban differences in absorption of 2014–2020 EU funding for solar RE investments.
The boxplots shown in Figure 2 display the distribution of EU funds per solar renewable energy investment carried out under operational programmes of 2014–2020 in urban and in rural areas.
4.4. The Main Differences in Solar RE Investments in Rural and in Urban Areas under Operational Programmes in 2014–2020
This subsection presents results on the differences in the value of EU funding and the number of solar renewable energy investments within urban and within rural areas based on intra-case analyses. Thus, the results provide answers to research question 3 (Q3).
4.4.1. Intra-Case Analysis 1—The Main Differences in Solar RE Investments Carried Out in Rural Areas under Operational Programmes in 2014–2020
The 2161 SRE investments were located in 1010 municipalities, i.e., 53% of all rural municipalities. The SRE investments’ total value ranged from 0.05 to 40.5 mln PLN, and the value of EU funding ranged from 0.03 to 24.9 mln PLN, giving the share of EU funding in total of 23% to 85%.
In 7% of rural municipalities, the SRE investments were co-financed by less than 1 mln PLN of EU funding, in 60% by 1 to 5 mln PLN of EU funding, in 32% by from 5 to 20 mln PLN, and lastly in 2% of rural municipalities by 20 to 24.9 mln PLN.
In 2014–2020, in 53% of rural municipalities only one SRE investment was given, in 38% from 2 to 4 investments and in 7% of them from 5 to 7 investments.
Most analysed SRE investment cumulated in eastern, north-eastern and south-eastern rural areas of Poland. Investments in solar renewable energy co-financed by EU funds were not located in many rural municipalities of western, south-western and central Poland. Most of the highest values of EU funding were in the south-eastern rural areas of the country (Figure 2).
4.4.2. Intra-Case Analysis 2—The Main Differences in Solar RE Investments Carried Out in Urban Areas under Operational Programmes 2014–2020
The 1201 SRE investments were located in 350, i.e., 58%, of urban municipalities. Their total value ranged from 0.06 to 41.6 mln PLN, and the value of EU funding for SRE investments ranged from 0.04 to 24.3 mln PLN, giving the shares of EU funding in total of 23% to 85%.
In 28% of urban municipalities, the SRE investments were co-financed by less than 1 mln PLN of EU funding, in 51% by 1 to 5 mln PLN of EU funding, in 20% by 5 to 20 mln PLN funding and in 1% of these municipalities by 20 to 24.9 mln PLN funding.
In 2014–2020, in 45% of urban municipalities only one SRE investment was given, in 35% from 2 to 4 investments and in 23% of them from 5 to 7 investments. Urban areas accommodated also leaders—the municipalities where 23 to 60 SRE investments were located.
The analysed SRE investments were dispersed in urban areas all around the country rather evenly, compared to the locations of all urban municipalities (Figure 3).
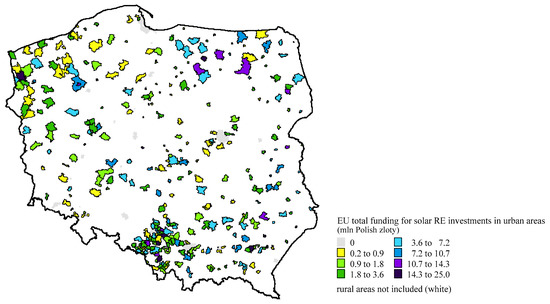
Figure 3.
Total value of EU funds for solar RE investments in urban areas under operational programmes 2014–2020, mln Polish zloty, as of 31 May 2021.
4.5. Relations between the Value of EU Funding for Solar Renewable Energy Investments in Urban and Rural Areas and Their Main Socio-Economic Characteristics—Multiple Linear Regression Models for Rural and Urban Areas
To predict the value of EU funding for investments in solar renewable energy from selected socio-economic characteristics of urban municipalities (dependent variable in model 1 = DV1) and of rural municipalities (dependent variable in model 2 = DV2), we calculated two multiple linear regressions based on predictors x6–x19 (Table 3), using the enter method. The enter method (or: forced entry) is a method in which all predictors are forced into the model simultaneously. Descriptive statistics for urban (N = 350) and rural (N = 1010) municipalities where solar renewable investments were located are shown in Table 7. This part of the study provides the answer to question 6: “Did the value of EU funding depend on selected social and economic characteristics of the urban and rural municipalities where the solar renewable energy investments were located?”
Table 7.
Descriptive statistics for urban (N = 350) and rural (N = 1010) municipalities where solar renewable investments were located.
For urban municipalities, we found that the model is not significant (F(14, 335) = 1.696, p > 0.005).
In case of rural municipalities, we found that the model is significant but explains only 6.1% of the variance in the value of EU funding for investments in solar renewable energy (F(14, 995) = 2708.760 *, p <.001), with an R2 of 0.061 (Table 8).
Table 8.
Model 1 and model 2 summary a,b.
The significance associated with b-values of the independent variables (Table 9) show that only four predictors, i.e., x12 and x14–x16, made a contribution to the model. Other predictors do not make such contributions, as their p-values are greater than 0.005.
Table 9.
Model 1 and model 2 coefficients a,b.
The magnitudes of t-statistics for x12 and x14–x16 showed that for x14 the average number of beneficiaries of social assistance per 10,000 inhabitants in 2014–2020 (t(995) = −3.058, p = 0.002) had the strongest negative impact on the value of EU funding for investments in solar renewable energy in rural municipalities (explaining 0.9% of the change in DV2). Next—in decreasing order of impact—was x16, the average number of the unemployed (t(995) = 2.840, p = 0.005), explaining 0.8% of the change in DV2; then came x12, the share of population using water from waterworks in 2019 (t(995) = −2.774, p = 0.006), explaining 0.7% of the change in DV2 and x15, the average number of enterprises per 10,000 inhabitants in 2014–2020 (t(995) = 2.774, p = 0.006), explaining 0.7% of the change in DV2.
Based on the results, we can define the model as follows:
DV1 = 2632941.526 − 11669.364x12 − 715.697x14 − 976.889x15 + 2072.922x16
5. Conclusions and Discussion
Public funds supporting the deployment of solar renewable energy under the EU’s regional policy were available in Poland to a wide range of urban and rural beneficiaries on the same terms. The total value of investments in solar renewable energy was most strongly predicted by the value of EU funding obtained by small and medium-sized enterprises and by local and regional authorities both in urban and in rural areas. These two groups of beneficiaries contributed most to the deployment of renewable energy supported by EU funding, in both urban and rural areas. However, it needs to be stressed that local authorities often represent local households when applying for financial support under operational programmes. Consequently, in practice, there is one more group of beneficiaries—households—who are not listed as partners of the projects, but who participate in the deployment of solar renewable energy as well. This proves that Polish consumers are willing to pay for green electricity [90], like households in other central European countries [91].
There were significant differences in the spatial layout of EU solar renewable energy investments in rural areas, whereas in urban areas the investments were dispersed all around the country rather evenly. This pattern reflects quite well the pattern of absorption of EU funds in general.
The value of EU funding invested in solar renewable energy projects in urban areas did not depend on their socio-economic characteristics, and in rural areas it depended only on four out of 14 socio-economic characteristics. Additionally, these characteristics, namely, the share of population using water from waterworks, the average number of beneficiaries of social assistance per 10,000 inhabitants in 2014–2020 and the average number of enterprises per 10,000 inhabitants in 2014–2020, explained only a small part of the change in the value of EU funds. This shows that the absorption of EU funding supporting solar RE investments does not depend on the selected socio-economic characteristics, which are the key factors determining the level of local development at the same time. In the situation where local governments are one of the two main groups of beneficiaries, this lack of relation can be explained by the financial contribution of households participating in the solar RE investments under operational programmes 2014–2020. This source of domestic funding makes solar RE investments under operational programmes 2014–2020 totally independent from communities’ budgets and thus allows local governments to carry out solar RE investments independently of communities’ priority tasks, e.g., the development of infrastructure [92].
The deployment of solar renewable energy proved to be based on and depend on endogenous factors, mostly the will and financial resources of potential beneficiaries, in both urban and in rural areas.
In programmes supporting the production of energy from renewable sources in Poland within 2014–2020, the importance of using micro-innovations and technologies with a small scale of impact was noticed, as in previous work [93]. The investment in solar installations especially significantly impacted the landscape of different territories in Poland and resulted in a change in land use patterns of large areas [94]. It is also important that investments in the production of energy from renewable sources on local levels in Poland [95,96], similarly to other countries [97], resulted not only from the policy intervention, but also from local knowledge and networking level, which significantly accelerated the uptake of funds and diffusion of new technologies. That was also the policy intervention objective of the European Union [26].
Summing up, we would like to stress that solving the problem of replacing fossil energy with green energy supplies by solar installations causes serious concerns about the amount of PV panel waste. As the International Renewable Energy Agency and the International Energy Agency Photovoltaic Power Systems Program predict, solar PV panels could generate as much as 78 million tones of waste by 2050 [98]. If not tackled effectively, it will pose serious challenges to circular economy development and the environment [99,100]. Thus, it is evident that supporting the deployment of solar renewable energy through different types of installation requires forward thinking and planning about the recycling of the used devices and their components, and thus designing an effective management scheme for solar or photovoltaic waste [101].
6. Recommendations
Based on the findings and conclusions of this study, we recommend: (i) investigation into the causes of rural–urban differences concerning the cumulation of SRE investments in some parts of rural areas and the lack of such investments in other parts of the country; (ii) looking into the reasons for the much lesser contributions of such groups of beneficiaries such as big enterprises, NGOs and others, to SRE investments under operational programmes.
Renewable energy deployment needs to be continuously supported by public funds. Their allocation must be evidence-based, and the continued top-down approach should enable flexible reacting to changing energy market conditions and laws and regulations. Programmes supporting solar renewable energy deployment should build up on already existing collaboration among local authorities and between local authorities and individual households, strengthening endogenous rural and urban potentials for renewable energy deployment.
The advantages of solar renewable energy investments for public facilities and for individual households should be promoted more, highlighting their positive practical aspects, to encourage other new urban and rural beneficiaries to take up such projects.
7. Limitations
A limitation to this study may be the fact that EU funds are a special kind of public funding. Their most unique and important characteristic is being non-refundable, which may result in different outcomes for solar renewable energy investments than those supported by other types of public funding. Thus, the findings and conclusions of this research should be attributed to EU funds only, until a comparative study with other public funding outcomes confirms or rejects this limitation.
Author Contributions
Conceptualization, J.R. and M.M.; methodology J.R., M.M. and I.M.B.; software, J.R., I.M.B., M.M. and E.F.; validation, J.R.; formal analysis, J.R., I.M.B., M.M. and E.F.; investigation, J.R., I.M.B., M.M. and E.F.; data curation, J.R.; writing—original draft preparation, J.R. and M.M.; writing—review and editing J.R., I.M.B., E.F. and M.M.; visualization, J.R.; supervision, J.R.; funding acquisition, M.M. All authors have read and agreed to the published version of the manuscript.
Funding
This research received no external funding.
Data Availability Statement
The database of Implemented EU Projects was available online at https://www.funduszeeuropejskie.gov.pl/strony/o-funduszach/projekty/lista-projektow/lista-projektow-realizowanychz-funduszy-europejskich-w-polsce-w-latach-2014-2020/ and accessed on 22 September 2020. The set of data on socio-economic characteristics of Polish municipalities was generated from the Local Data Bank, Statistics Poland, at https://bdl.stat.gov.pl/BDL/dane/podgrup/temat on 1 June 2021.
Conflicts of Interest
The authors declare no conflict of interest.
References
- Negro, S.O.; Alkemade, F.; Hekkert, M.P. Why does renewable energy diffuse so slowly? A review of innovation system problems. Renew. Sustain. Energy Rev. 2012, 16, 3836–3846. [Google Scholar] [CrossRef]
- Rennkamp, B.; Haunss, S.; Wongsa, K.; Ortega, A.; Casamadrid, E. Competing coalitions: The politics of renewable energy and fossil fuels in Mexico, South Africa and Thailand. Energy Res. Soc. Sci. 2017, 34, 214–223. [Google Scholar] [CrossRef]
- Stokes, L.C.; Breetz, H.L. Politics in the U.S. energy transition: Case studies of solar, wind, biofuels and electric vehicles policy. Energy Policy 2018, 113, 76–86. [Google Scholar] [CrossRef]
- Stokes, L.C. The politics of renewable energy policies: The case of feed-in-tariffs in Ontario, Canada. Energy Policy 2013, 56, 490–500. [Google Scholar] [CrossRef]
- Zhang, P.; Yang, Y.; Shi, J.; Zheng, Y.; Wang, L.; Li, X. Opportunities and challenges for renewable energy policy in China. Renew. Sustain. Energy Rev. 2009, 13, 439–449. [Google Scholar] [CrossRef]
- Climate Action Network Europe. Funding Climate and Energy Transition in the EU: The Untapped Potential of Regional Funds: Assessment of the European Regional Development; Climate Action Network Europe: Brussels, Belgium, 2020. [Google Scholar]
- Boie, I.; Held, A.; Ragwitz, M.; Genoese, F. Renewables in the EU: Policy Performance, Drivers and Bariers. 2014. Available online: https://www.ceps.eu/ceps-publications/renewables-eu-policy-performance-drivers-and-barriers/ (accessed on 30 September 2021).
- Interreg Europe. Financing Energy Efficiency: Models and Lessons. A Policy Brief from the Policy Learning Platform on Low-Carbon Economy. 2017. Available online: https://www.interregeurope.eu/fileadmin/user_upload/plp_uploads/policy_briefs/2017-04-20_TO4_Front_Energy_policy_brief__S3_revised_IK__3_files_merged_pdf (accessed on 30 September 2021).
- Boon, F.P.; Dieperink, C. Local civil society based renewable energy organisations in the Netherlands: Exploring the factors that stimulate their emergence and development. Energy Policy 2014, 69, 297–307. [Google Scholar] [CrossRef]
- Cansino, J.M.; Pablo-Romero, M.P.; Román, R.; Yñiguez, R. Promoting renewable energy sources for heating and cooling in EU-27 countries. Energy Policy 2011, 39, 3803–3812. [Google Scholar] [CrossRef]
- White, W.; Lunnan, A.; Nybakk, E.; Kulisic, B. The role of governments in renewable energy: The importance of policy consistency. Biomass Bioenergy 2013, 57, 97–105. [Google Scholar] [CrossRef]
- Blok, K. Renewable energy policies in the European Union. Energy Policy 2006, 34, 251–255. [Google Scholar] [CrossRef]
- European Union; IRENA. Renewable Energy Prospects for the European Union. International Renewable Energy Agency. 2018. Available online: https://www.irena.org/-/media/Files/IRENA/Agency/Publication/2018/Feb/IRENA_REmap-EU_2018_summary.pdf?la=en&hash=818E3BDBFC16B90E1D0317C5AA5B07C8ED27F9EF (accessed on 1 December 2021).
- European Court of Auditors. Cohesion Policy Funds Support to Renewable Energy Generation—Has It Achieved Good Results? Publications Office of the European Union, European Union: Luxembourg, 2014. [CrossRef]
- Seetharaman; Moorthy, K.; Patwa, N.; Saravanan; Gupta, Y. Breaking barriers in deployment of renewable energy. Heliyon 2019, 5, e01166. [Google Scholar] [CrossRef]
- Karakaya, E.; Sriwannawit, P. Barriers to the adoption of photovoltaic systems: The state of the art. Renew. Sustain. Energy Rev. 2015, 49, 60–66. [Google Scholar] [CrossRef]
- European Environment Agency (EEA). Trends and Projections in Europe 2019: Tracking Progress towards Europe’s Climate and Energy Targets; EEA Report, No. 15/2019; Publications Office of the European Union: Luxembourg, 2019. [CrossRef]
- Eurostat. News Release 17/2020—23 January 2020. Renewable Energy in the EU in 2018. Available online: https://ec.europa.eu/eurostat/documents/2995521/10335438/8-23012020-AP-EN.pdf/292cf2e5-8870-4525-7ad7-188864ba0c29 (accessed on 10 December 2021).
- National Energy and Climate Plans. Available online: https://ec.europa.eu/energy/topics/energy-strategy/national-energy-climate-plans_en (accessed on 15 September 2021).
- European Commission. Communication from the Commission to the European Parliament, the Council, the European Economic and Social Committee, the Committee of the Regions and the European Investment Bank a Framework Strategy for a Resilient Energy Union with a Forward-Looking Climate Change Policy. Brussels, Belgium, 2015. Available online: https://eur-lex.europa.eu/resource.html?uri=cellar:1bd46c90-bdd4-11e4-bbe1-01aa75ed71a1.0001.03/DOC_1&format=PDF (accessed on 2 January 2022).
- Veum, K.; Bauknecht, D. How to reach the EU renewables target by 2030? An analysis of the governance framework. Energy Policy 2019, 127, 299–307. [Google Scholar] [CrossRef]
- Kisiała, W.; Bajerski, A.; Stępiński, B. Equalising or polarising: The centre–periphery model and the absorption of EU funds under regional operational programmes in Poland. Acta Oeconomica Period. Hung. Acad. Sci. 2017, 67, 413–434. [Google Scholar] [CrossRef]
- Tagliapietra, S.; Zachmann, G.; Edenhofer, O.; Glachant, J.-M.; Linares, P.; Loeschel, A. The European Union energy transition: Key priorities for the next five years. Energy Policy 2019, 132, 950–954. [Google Scholar] [CrossRef]
- Klessmann, C.; Held, A.; Rathmann, M.; Ragwitz, M. Status and perspectives of renewable energy policy and deployment in the European Union—What is needed to reach the 2020 targets? Energy Policy 2011, 39, 7637–7657. [Google Scholar] [CrossRef]
- Helm, D. The European framework for energy and climate policies. Energy Policy 2014, 64, 29–35. [Google Scholar] [CrossRef]
- D’Adamo, R.P. Current state of renewable energies performances in the European Union: A new reference framework. Energy Conv. Manag. 2016, 121, 84–92. [Google Scholar] [CrossRef]
- Regulation (EU) 2018/1999 of the European Parliament and of the Council of 11 December 2018 on the Governance of the Energy Union and Climate Action, Amending Regulations (EC) No 663/2009 and (EC) No 715/2009 of the European Parliament and of the Council, Directives 94/22/EC, 98/70/EC, 2009/31/EC, 2009/73/EC, 2010/31/EU, 2012/27/EU and 2013/30/EU of the European Parliament and of the Council, Council Directives 2009/119/EC and (EU) 2015/652 and Repealing Regulation (EU) No 525/2013 of the European Parliament and of the Council. Official Journal of the European Union, L328, Volume 61, 21 December 2018. Available online: https://eur-lex.europa.eu/legal-content/EN/TXT/PDF/?uri=OJ:L:2018:328:FULL&from=EN (accessed on 2 January 2022).
- European Commission. A Policy Framework for Climate and Energy in the Period from 2020 to 2030; COM(2014) 15 Final; European Commission: Brussels, Belgium, 2014. [Google Scholar]
- Swiader, M.; Tokarczyk-Dorociak, K.; Szewrański, S.; Kazak, J. Analysis of regional operational programmes for the 2014-2020 period in the context of financing the renewable energy investments. Rynek Energii 2016, 124, 72–80. [Google Scholar]
- Kossowski, T. Regional operational programmes as a leverage the use of renewable energy sources. Roczniki Naukowe SERIA 2011, XVIII, 99–104. [Google Scholar]
- Pomianek, I.; Chrzanowska, M. A spatial comparison of semi-urban and rural gminas in Poland in terms of their level of socio-economic development using Hellwig’s method. Bull. Geography. Socio-Econ. Ser. 2016, 33, 103–117. [Google Scholar] [CrossRef]
- European Commission; European Investment Bank. Stocktaking Study on Financial Instruments by Sector. Progress to Date, Market Needs and Implications for Financial Instruments. The Use of Financial Instruments in the ‘Renewable Energy’ Sector. 2020. Available online: https://www.fi-compass.eu/sites/default/files/publications/The%20use%20of%20financial%20instruments%20in%20the%20%E2%80%98Renewable%20Energy%E2%80%99%20sector.pdf (accessed on 30 September 2021).
- IRENA. Global Energy Transformation: A Roadmap to 2050; International Renewable Energy Agency: Abu Dhabi, United Arab Emirates, 2019. [Google Scholar]
- Jasminka, Y.; Brans, M. Analysis of factors affecting a shift in a local energy system towards 100% renewable energy community. J. Clean. Prod. 2017, 169, 117–124. [Google Scholar] [CrossRef]
- Shirley, R.; Kammen, D. Renewable energy sector development in the Caribbean: Current trends and lessons from history. Energy Policy 2013, 57, 244–252. [Google Scholar] [CrossRef]
- García-Gusano, D.; Iribarren, D.; Dufour, J. Towards Energy Self-sufficiency in Large Metropolitan Areas: Business Oppor-tunities on Renewable Electricity in Madrid. In Renewable Energies; García Márquez, F., Karyotakis, A., Papaelias, M., Eds.; Springer International Publishing: Cham, Switzerland, 2018. [Google Scholar] [CrossRef]
- Gonda, G. Utilization of renewable energies and changing energy structure at local goverment, as drivers of economic recovery: Hungarian case study. Int. J. Soc. Sci. Humanit. Stud. 2011, 3, 267–276. [Google Scholar]
- Río, P.; Burguillo, M. An empirical analysis of the impact of renewable energy employment on local sustainability. Renew. Sustain. Energy Rev. 2009, 13, 1314–1325. [Google Scholar]
- Poggi, F.; Firmino, A.; Amado, M. Planning renewable energy in rural areas: Impacts on occupation and land use. Energy 2018, 155, 630–640. [Google Scholar] [CrossRef]
- Lilliestam, J.; Hanger, S. Shades of green: Centralisation, decentralisation and controversy among European renewable electricity visions. Energy Res. Soc. Sci. 2016, 17, 20–29. [Google Scholar] [CrossRef]
- Lowitzsch, J.; Hoicka, C.E.; van Tulder, F.J. Renewable energy communities under the 2019 European Clean Energy Package—Governance model for the energy clusters of the future? Renew. Sustain. Energy Rev. 2020, 122, 109489. [Google Scholar] [CrossRef]
- Oudes, D.; Stremke, S. Next generation solar power plants? A comparative analysis of frontrunner solar landscapes in Europe. Renew. Sustain. Energy Rev. 2021, 145, 111101. [Google Scholar] [CrossRef]
- Picchi, P.; van Lierop, M.; Geneletti, D.; Stremke, S. Advancing the relationship between renewable energy and ecosystem services for landscape planning and design: A literature review. Ecosyst. Serv. 2019, 35, 241–259. [Google Scholar] [CrossRef]
- Mathiesen, B.V.; Lund, H.; Karlsson, K. 100% Renewable energy systems, climate mitigation and economic growth. Appl. Energy 2011, 88, 488–501. [Google Scholar] [CrossRef]
- Santangeli, A.; Toivonen, T.; Pouzols, F.M.; Pogson, M.; Hastings, A.; Smith, P.; Moilanen, A. Global change synergies and trade-offs between renewable energy and biodiversity. GCB Bioenergy 2016, 8, 941–951. [Google Scholar] [CrossRef]
- Yaqoot, M.; Diwan, P.; Kandpal, T.C. Review of barriers to the dissemination of decentralized renewable energy systems. Renew. Sustain. Energy Rev. 2016, 58, 477–490. [Google Scholar] [CrossRef]
- Nasirov, S.; Silva, C.; Agostini, C.A. Investors’ Perspectives on Barriers to the Deployment of Renewable Energy Sources in Chile. Energies 2015, 8, 3794–3814. [Google Scholar] [CrossRef]
- Spiess, T.; De Sousa, T. Barriers to Renewable Energy Development on Brownfields. J. Environ. Policy. 2016, 18, 507–534. [Google Scholar] [CrossRef]
- Karatayev, M.; Hall, S.; Kalyuzhnova, Y.; Clarke, M.L. Renewable energy technology uptake in Kazakhstan: Policy drivers and barriers in a transitional economy. Renew. Sustain. Energy Rev. 2016, 66, 120–136. [Google Scholar] [CrossRef]
- Scarpellini, S.; Gimeno, J.Á.; Portillo-Tarragona, P.; Llera-Sastresa, E. Financial Resources for the Investments in Renewable Self-Consumption in a Circular Economy Framework. Sustainability 2021, 13, 6838. [Google Scholar] [CrossRef]
- McCabe, A.; Pojani, D.; and van Groenou, A.B. The application of renewable energy to social housing: A systematic review. Energy Policy 2018, 114, 549–557. [Google Scholar] [CrossRef]
- Ghisetti, C.; Mancinelli, S.; Mazzanti, M.; and Zoli, M. Financial barriers and environmental innovations: Evidence from EU manufacturing firms. Clim. Policy 2017, 17, 131–147. [Google Scholar] [CrossRef]
- Rakowska, J.; Ozimek, I. Renewable Energy Attitudes and Behaviour of Local Governments in Poland. Energies 2021, 14, 2765. [Google Scholar] [CrossRef]
- International Energy Agency, Financing Clean Energy Transitions in Emerging and Developing Economies. In World Energy Investment 2021 Special Report; International Energy Agency: Paris, France, 2021.
- Iskandarova, M.; Dembek, A.; Fraaije, M.; Matthews, W.; Stasik, A.; Wittmayer, J.; Sovacool, B. Who finances renewable energy in Europe? Examining temporality, authority and contestation in solar and wind subsidies in Poland, the Netherlands and the United Kingdom. Energy Strategy Rev. 2021, 38, 100730. [Google Scholar] [CrossRef]
- Elie, L.; Granier, C.; Rigot, S. The different types of renewable energy finance: A Bibliometric analysis. Energy Econ. 2021, 93, 104997. [Google Scholar] [CrossRef]
- Cohen, J.; Azarova, V.; Kollmann, A.; Reichl, J. Preferences for community renewable energy investments in Europe. Energy Econ. 2021, 100, 105386. [Google Scholar] [CrossRef]
- Polzin, F.; Migendt, M.; Täube, F.A.; von Flotow, P. Public policy influence on renewable energy investments—A panel data study across OECD countries. Energy Policy 2015, 80, 98–111. [Google Scholar] [CrossRef]
- Mazzucato, M.; Semieniuk, G. Financing renewable energy: Who is financing what and why it matters. Technol. Forecast. Soc. Chang. 2018, 127, 8–22. [Google Scholar] [CrossRef]
- Sendstad, L.H.; Hagspiel, V.; Mikkelsen, W.J.; Ravndal, R.; Tveitstøl, M. The impact of subsidy retraction on European renewable energy investments. Energy Policy 2022, 160, 112675. [Google Scholar] [CrossRef]
- Liu, F.; Feng, J.; Zhai, G.; Razzaq, A. Influence of fiscal decentralization and renewable energy investment on ecological sustainability in EU: What is the moderating role of institutional governance? Renew. Energy 2022, 200, 1265–1274. [Google Scholar] [CrossRef]
- Adedoyin, F.F.; Bekun, F.V.; Alola, A.A. Growth impact of transition from non-renewable to renewable energy in the EU: The role of research and development expenditure. Renew. Energy 2020, 159, 1139–1145. [Google Scholar] [CrossRef]
- Bointner, R.; Pezzutto, S.; Grilli, G.; Sparber, W. Financing Innovations for the Renewable Energy Transition in Europe. Energies 2016, 9, 990. [Google Scholar] [CrossRef]
- Zhang, L.; Saydaliev, H.B.; Ma, X. Does green finance investment and technological innovation improve renewable energy efficiency and sustainable development goals. Renew. Energy 2022, 193, 991–1000. [Google Scholar] [CrossRef]
- Wu, H.; Carroll, J.; Denny, E. Harnessing citizen investment in community-based energy initiatives: A discrete choice experiment across ten European countries. Energy Res. Soc. Sci. 2022, 89, 102552. [Google Scholar] [CrossRef]
- Pons-Seres de Brauwer, C.; Cohen, J.J. Analysing the potential of citizen-financed community renewable energy to drive Europe’s low-carbon energy transition. Renew. Sustain. Energy Rev. 2020, 133, 110300. [Google Scholar] [CrossRef]
- Ning, Y.; Cherian, J.; Sial, M.S.; Álvarez-Otero, S.; Comite, U.; Zia-Ud-Din, M. Green bond as a new determinant of sustainable green financing, energy efficiency investment, and economic growth: A global perspective. Environ. Sci. Pollut. Res. 2022. [Google Scholar] [CrossRef] [PubMed]
- Bourcet, C.; Bovari, E. Exploring citizens’ decision to crowdfund renewable energy projects: Quantitative evidence from France. Energy Econ. 2020, 88, 104754. [Google Scholar] [CrossRef]
- Halden, U.; Cali, U.; Dynge, M.; Stekli, J.; Bai, L. DLT-based equity crowdfunding on the techno-economic feasibility of solar energy investments. Sol. Energy 2021, 227, 137–150. [Google Scholar] [CrossRef]
- D’Orazio, P.; Löwenstein, P. Mobilising investments in renewable energy in Germany: Which role for public investment banks? J. Sustain. Financ. Investig. 2022, 12, 451–474. [Google Scholar] [CrossRef]
- Qadir, S.A.; Al-Motairi, H.; Tahir, F.; Al-Fagih, F. Incentives and strategies for financing the renewable energy transition: A review. Energy Rep. 2021, 7, 3590–3606. [Google Scholar] [CrossRef]
- Singh, D. Renewable energy, urban primacy, foreign direct investment, and value-added in European regions. Renew. Energy 2022, 186, 547–561. [Google Scholar] [CrossRef]
- Egli, F. Renewable energy investment risk: An investigation of changes over time and the underlying drivers. Energy Policy 2020, 140, 111428. [Google Scholar] [CrossRef]
- Semieniuk, G.; Campiglio, E.; Mercure, J.-F.; Volz, U.; Edwards, N.R. Low-carbon transition risks for finance. WIREs Clim Chang. 2021, 12, e678. [Google Scholar] [CrossRef]
- Ntanos, S.; Skordoulis, M.; Kyriakopoulos, G.; Arabatzis, G.; Chalikias, M.; Galatsidas, S.; Batzios, A.; Katsarou, A. Renewable Energy and Economic Growth: Evidence from European Countries. Sustainability 2018, 10, 2626. [Google Scholar] [CrossRef]
- Dvořák, P.; Martinát, S.; van der Horst, B.; Frantál, B.; Turečková, K. Renewable energy investment and job creation; a cross-sectoral assessment for the Czech Republic with reference to EU benchmarks. Renew. Sustain. Energy Rev. 2017, 69, 360–368. [Google Scholar] [CrossRef]
- Wu, H.; Mentel, U.; Lew, G.; Wang, S. What drives renewable energy in the group of seven economies? Evidence from non-parametric panel methods. Econ. Res.-Ekon. Istraživanja 2022, 1–27. [Google Scholar] [CrossRef]
- Jia, W.; Jia, X.; Wu, L.; Guo, Y.; Yang, T.; Wang, E.; Xiao, P. Research on regional differences of the impact of clean energy development on carbon dioxide emission and economic growth. Humanit. Soc. Sci. Commun. 2022, 9, 25. [Google Scholar] [CrossRef]
- Tu, Y.-X.; Kubatko, O.; Piven, V.; Sotnyk, I.; Kurbatova, T. Determinants of Renewable Energy Development: Evidence from the EU Countries. Energies 2022, 15, 7093. [Google Scholar] [CrossRef]
- Database of Operational Programmes 2014–2020. Available online: https://www.funduszeeuropejskie.gov.pl/strony/o-funduszach/dokumenty/#/domyslne=1 (accessed on 1 June 2020).
- Ministry of Development Funds and Regional Policy. Database of Implemented EU Projects; Ministry of Development Funds and Regional Policy: Warsaw, Poland. Available online: https://www.funduszeeuropejskie.gov.pl/strony/o-funduszach/projekty/lista-projektow/lista-projektow-realizowanychz-funduszy-europejskich-w-polsce-w-latach-2014-2020/ (accessed on 22 September 2020).
- DEGURBA Classification. Available online: https://ec.europa.eu/eurostat/ramon/miscellaneous/index.cfm?TargetUrl=DSP_DEGURBA (accessed on 21 January 2021).
- National Court Register. Available online: https://www.gov.pl/web/sprawiedliwosc/krajowy-rejestr-sadowy (accessed on 21 January 2021).
- National Official Register of the Territorial Division of the Country (TERYT). Available online: https://eteryt.stat.gov.pl/eTeryt/rejestr_teryt/udostepnianie_danych/baza_teryt/uzytkownicy_indywidualni/wyszukiwanie/wyszukiwanie.aspx?contrast=default (accessed on 10 January 2021).
- Local Data Bank. Statistics Poland. Available online: https://bdl.stat.gov.pl/BDL/dane/podgrup/temat (accessed on 1 June 2021).
- Silverman, D. Doing Qualitative Research, 2nd ed.; Sage Publications: London, UK, 2005. [Google Scholar]
- Charmaz, K. Teoria Ugruntowana. Praktyczny Przewodnik po Analizie Jakościowej; Wydawnictwo PWN: Warsaw, Poland, 2009. [Google Scholar]
- Glaser, B.G.; Strauss, A.L. Odkrywanie Teorii Ugruntowanej. Strategie Badania Jakościowego; Nomos: Cracov, Poland, 2009. [Google Scholar]
- Berkowitz, S. Using Qualitative and Mixed Method Approaches. In Needs Assessment: A Creative and Practical Guide for Social Scientists; Reviere, R., Berkowitz, S., Carter, C.C., Graves-Ferguson, C., Eds.; Taylor & Francis Publishing House: Washington, DC, USA, 1996. [Google Scholar]
- Kowalska-Pyzalska, A. Do Consumers Want to Pay for Green Electricity? A Case Study from Poland. Sustainability 2019, 11, 1310. [Google Scholar] [CrossRef]
- Kumar, B.; Szepesi, G.; Čonka, Z.; Kolcun, M.; Péter, Z.; Berényi, L.; Szamosi, Z. Trendline Assessment of Solar Energy Potential in Hungary and Current Scenario of Renewable Energy in the Visegrád Countries for Future Sustainability. Sustainability 2021, 13, 5462. [Google Scholar] [CrossRef]
- Rakowska, J. Fundusze unijne jako czynnik rozwoju obszarόw wiejskich w Polsce w świetle teorii rozwoju lokalnego; Wydawnictwo SGGW: Warsaw, Poland, 2019. [Google Scholar]
- Gradziuk, P.; Gradziuk, B. Renewable energy sources as a development opportunity for peripheral areas/Odnawialne źródła energii szansą rozwojową obszarów peryferyjnych. Econ. Reg. Stud. 2020, 13, 184–198. [Google Scholar] [CrossRef]
- Hektus, P.; Kalbarczyk, E. Spatial Diversity of the Development of Investments in Renewable Energy in the Context of Potential Effect on Landscape. Archit. Kraj. 2015, 3, 62–71. [Google Scholar]
- Marks-Bielska, R.; Bielski, S.; Pik, K.; Kurowska, K. The Importance of Renewable Energy Sources in Poland’s Energy Mix. Energies 2020, 13, 4624. [Google Scholar] [CrossRef]
- Standar, A.; Kozera, A.; Satoła, Ł. The Importance of Local Investments Co-Financed by the European Union in the Field of Renewable Energy Sources in Rural Areas of Poland. Energies 2021, 14, 450. [Google Scholar] [CrossRef]
- Karanasios, K.; Parker, P. Explaining the Diffusion of Renewable Electricity Technologies in Canadian Remote Indigenous Communities through the Technological Innovation System Approach. Sustainability 2018, 10, 3871. [Google Scholar] [CrossRef]
- IRENA; IEA-PVPS. End-of-Life Management: Solar Photovoltaic Panels. 2016. Available online: https://www.irena.org/-/media/Files/IRENA/Agency/Publication/2016/IRENA_IEAPVPS_End-of-Life_Solar_PV_Panels_2016.pdf (accessed on 30 September 2021).
- Radavičius, T.; van der Heide, A.; Palitzsch, W.; Rommens, T.; Denafas, J.; Tvaronavičienė, M. Circular solar industry supply chain through product technological design changes. Insights Into Reg. Dev. 2021, 3, 10–30. [Google Scholar] [CrossRef]
- Duran, S.; Atasu, A.; Van Wassenhove, L.N. Cleaning after Solar Panels: A Circular Outlook. Available online: https://papers.ssrn.com/sol3/papers.cfm?abstract_id=3860571 (accessed on 31 August 2021). [CrossRef]
- The European Union Solar Waste Website. Available online: http://www.solarwaste.eu/pv-waste-legislation/ (accessed on 31 July 2021).
Publisher’s Note: MDPI stays neutral with regard to jurisdictional claims in published maps and institutional affiliations. |
© 2022 by the authors. Licensee MDPI, Basel, Switzerland. This article is an open access article distributed under the terms and conditions of the Creative Commons Attribution (CC BY) license (https://creativecommons.org/licenses/by/4.0/).