Abstract
Multiple faults in new energy vehicle batteries can be diagnosed using voltage. To find voltage fault information in advance and reduce battery safety risk, a state-partitioned voltage fault prognosis method based on the self-attention network is proposed. The voltage data are divided into three parts with typical characteristics according to the charging voltage curve trends under different charge states. Subsequently, a voltage prediction model based on the self-attention network is trained separately with each part of the data. The voltage fault prognosis is realized using the threshold method. The effectiveness of the method is verified using real operating data of electric vehicles (EVs). The effects of different batch sizes and window sizes on model training are analyzed, and the optimized hyperparameters are used to train the voltage prediction model. The average error of predicted voltage is less than 2 mV. Finally, the superiority and robustness of the method are verified.
1. Introduction
Climate warming and the energy crisis are significant issues for the international community [1]. Instead of using fuel vehicles, the use of EVs can help reduce carbon emissions and fuel dependence, alleviating those ecological and energy issues [2,3]. Power batteries are the core components of EVs, most of which consist of lithium-ion batteries with high energy density [4]. However, the safety of lithium-ion batteries is the main problem limiting the promotion of EVs [5,6]. To improve the safety of power batteries, most EVs use a battery management system to diagnose battery faults. Many studies have revealed that voltage anomalies are an important cause of battery failure, for example, over-voltage, under-voltage, over-voltage change rate, and poor consistency of cell voltages [7,8]. Therefore, voltage is an essential aspect of battery fault diagnosis. Judging abnormal voltage and interrupting battery usage in a timely fashion is an important method to improve the safety of EVs.
1.1. Literature Review
The internal reactions of power batteries are extremely complex and variable, and are sensitive to temperature changes and battery aging [9,10]. As a result, the battery voltage may exhibit some abnormalities, such as overvoltage [11], under-voltage [12], or poor voltage consistency [13]. Thus, if the voltage of the battery is abnormal, there is a high probability that the battery has some internal failures or will have some failures [14,15]. Therefore, an abnormal battery voltage diagnosis is necessary to ensure the safety of power batteries. Researchers have explored voltage abnormality diagnosis methods [16,17]. Gan [18] et al. presented a machine learning-based two-layer over-discharge fault diagnosis strategy for Li-ion batteries in electric vehicles. Sun [19] et al. proposed a scheme for a three-layer fault detection method for lithium-ion batteries based on statistical analysis. The abnormal detection of battery voltage is realized. However, because these methods are based on a specific experimental environment, the universality of these methods is poor. On this basis, this paper will use the threshold method to realize the diagnosis of abnormal battery voltage.
Threshold method fault prognosis requires voltage prediction. Hsu [20] et al. developed novel-architecture deep neural networks with a special convolutional training strategy. The prediction of battery characteristics and voltage was realized. Han [21] et al. presented a state of energy estimation for lithium-ion battery packs in electric vehicle applications via prediction. The Markov chain model was used to accurately predict the future voltage in the battery pack. In addition, some scholars have used a random forest regression algorithm to predict the variation characteristics of battery voltage based on big data analysis. However, due to the limitations of the data used and the experimental environment, these methods have poor generality.
To solve the problem of poor generality, scholars have also proposed a lot of model-based voltage prediction methods. Wang [22] et al. presented a novel feedback correction-adaptive Kalman filtering method for the whole-life-cycle state of charge [23] (SOC) and closed-circuit voltage prediction of lithium-ion batteries based on the second-order electrical equivalent circuit model. Wu [24] et al. proposed a low-complexity SOC and anode potential prediction for lithium-ion batteries using a simplified electrochemical model-based observer under variable load conditions. The anode potential and SOC of the cell can be predicted with high accuracy. However, these model-based voltage prediction methods have limitations due to the experimental environment and the conditions of applicability of the models [25]. This is difficult to apply to the complex operating conditions of actual operating environments.
The generality of model-based voltage prediction methods is hardly able to satisfy the needs of the complex operating environment of batteries. Data-driven methods overcome this problem [26]. Hong [7] et al. used a hyperparametric optimized long short-term memory [27] (LSTM) model to predict voltage for fault warning. The feasibility and robustness of the model were also verified on actual vehicle data. Tian [28] et al. estimated the entire charging voltage curve by using a segment of the charging curve as input through a deep neural network. Yang [29] used convolutional neural networks to develop voltage prediction models for three kinds of modes of four-point consecutive voltage and time index. In addition, compared with experimental validation. Tobar [30] et al. used the kernel adaptive filter to develop a voltage prediction model that could analyze the relationship between voltage and altitude variations. However, the predictive effectiveness of data-driven methods is heavily influenced by the training data [31,32]. Data-driven methods place high demands on data quality [33,34].
There are three ways to address data quality issues. The first is to collect a large amount of data, which can make the prediction results more accurate and reliable. However, a major drawback of this approach is the high cost. On the one hand, collecting a large amount of data requires a significant investment. On the other hand, the large amount of data makes the cost of data storage and transmission much higher. Secondly, data augmentation is used to expand the sample [35,36]. Data augmentation can increase the amount of data for training and improve the generalization ability of the model. This can also increase the noise data and improve the robustness of the model. Compared with collecting a huge amount of data, data augmentation has a low cost. However, performing data augmentation reasonably without making the dataset defective is a major difficulty. Most data augmentation methods nowadays have low effectiveness in practical tasks and can only provide minimal and marginal gains. The third is to divide the data into parts according to the key states and train the voltage prognosis model, respectively. Partial training can reduce the range of features the model has to learn, thus avoiding the increased difficulty of model learning resulting from the differences in data in different states. Moreover, this facilitates a deeper exploration of features by the model. This method is beneficial for improving the accuracy of voltage fault prognosis.
1.2. Contributions of the Work
This paper makes notable contributions and improvements to current techniques, as follows:
- SOC-based data state-partitioning method: Depending on SOC, the data are divided into three parts with different trends, which is convenient for the model to learn features and improve the accuracy of voltage prediction;
- Voltage prediction model based on self-attention network: The self-attention network is used to predict voltage and improve the capacity for long-range data analysis;
- Voltage prognosis method applied to real vehicles: The voltage prognosis model was constructed using real vehicle data to verify the application ability of the model under complex operating conditions.
1.3. Organization of the Paper
The rest of this paper is organized as follows: Section 2 introduces the methodology used in this article. Section 3 describes the model set and hyperparameter optimization process. Section 4 presents the verification of the feasibility and superiority of the proposed method on the basis of experiments. Section 5 presents the conclusion.
2. Methodology
2.1. Overview
The early prognosis method for voltage fault presented in this paper is shown in Figure 1. First, depending on the SOC, the real voltage data are divided into three parts according to their trend. After that, a voltage prediction model based on the self-attention network is trained separately using the three parts of the data. Finally, voltage fault prognosis is realized based on the voltage predicted by the model and the threshold method.
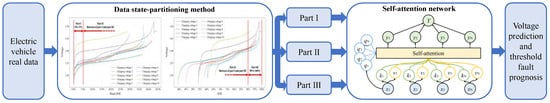
Figure 1.
The proposed model structure.
2.2. Data Description
The data used in this study were obtained from a new government-level energy vehicle big data platform. The data were collected from an electric cab with a high-energy 18,650 lithium-ion battery pack. Several data items were collected, as shown in Table 1.

Table 1.
The data items collected from the EV.
2.3. State-Partial by SOC
The proposed state-partial voltage fault prognosis model only applies to the charging phase of a lithium-ion battery, for the following reasons. First, safety accidents caused by lithium-ion batteries are more likely to occur during the charging phase [15]. Therefore, voltage fault prognosis in the charging phase can better avoid security risks. Second, the voltage change in the discharge phase is irregular and is more affected by the driver’s driving behavior. The drastic changes in voltage the difficulty of fault feature extraction using the prognosis model. When charging, the voltage change is mainly affected by the charging strategy, which is more regular. Predicting the voltage in the charging phase is more suitable for voltage fault prognosis using the proposed model.
The battery charging process is often split into multiple stages due to the battery charging strategy. For example, the trickle charging phase [37], the constant current phase [38], and the constant voltage phase [39]. Figure 2 shows the ten charging voltage curves in the dataset. The charging voltage curves in Figure 2b show this interphase difference. The charging voltage curves have a significant increase in voltage during the first 5% SOC. The increase then gradually diminishes, and the voltage slowly increases after the first 5% SOC. After 90% SOC, the voltage increases dramatically once again. This charging voltage change process corresponds to the constant current phase. The voltage or series resistance is controlled in the constant current phase to ensure a stable current. This control causes a variety of voltage variation trends.
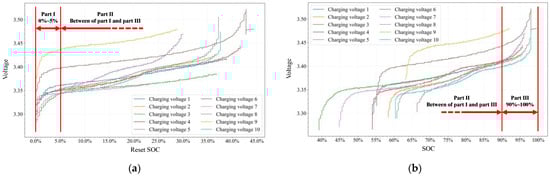
Figure 2.
Charging voltage curves: (a) charging voltage curves after resetting the SOC; (b) original charging voltage curves.
Figure 2b shows that there are various trends in the charging voltage curves. After the SOC reaches 90%, the charging voltage curves largely converge. The trends are similar for the first 5% of each charging voltage curve. Resetting the SOC to start at 0 makes it easier to visualize and analyze the charging voltage trends for the first 5% of the SOC. The charging voltage curve after resetting the SOC is shown in Figure 2a. It can be seen that the charging voltage trends for the first 5% are roughly similar. In addition, the charging voltage in the middle rises smoothly. By observation, the charging voltage curve can be divided into three parts according to SOC: the first 5% SOC, the middle SOC, and the SOC after 90%.
2.4. Self-Attention Mechanism Network
Recurrent neural networks have achieved good results in regression problems such as temporal data prediction. However, due to the structure of the recurrent neural network, as shown in Figure 3a, the information of the first input segment will be covered by the subsequent input segment during the recurrent process. This causes insufficient long-range data processing capability and limits the model prediction accuracy. Subsequently, methods for improving recurrent neural networks have been proposed (e.g., LSTM [40]), and there have been improvements to their long-range data processing capability. However, the problems caused by the recurrent structure still exist. To better process temporal data, a neural network based on the self-attention mechanism has been proposed that uses different structures [41].
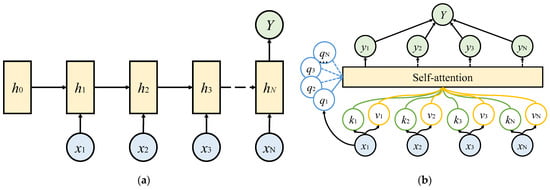
Figure 3.
Neural network structures: (a) recurrent neural network structure; (b) self-attention network structure.
In 2017, on the basis of the seq2seq model, the Google Machine Translation team replaced the RNN layer and CNN layer with the self-attention layer and proposed a sequence converter network (i.e., Transformer [41]) model based on the attention mechanism. In the WMT2014 English-German translation task, the Transformer model increases the BLEU value to 28.4, 2 points higher than the optimal model at that time. Kitaev et al. [42] proposed the Reformer model, using the locality-sensitive hashing attention and reversible residual network to decrease the computational load of the model and accelerate the training.
The structure of the self-attention network is shown in Figure 3. First, input segments (x in Figure 3) are mapped into three segments (q, k, and v) by the embedding operation of the linear layer. The segments of q, k, and v are composed into three matrices Q, K, and V, respectively. Then, each q and k vector is multiplied to obtain the attention value of two data segments. During execution, Q and K matrices are dot multiplied. Relative to the fragmented segments, matrix multiplication is computationally fast on a computer. Then, the attention value is input into the softmax function. To avoid the input value being too great, which may cause the partial derivative to approach zero during backpropagation, first, is divided by the attention value, where dk represents the dimensionality of segments of k. Then, the softmax output matrix is dot multiplied with V to obtain Y. This is similar to the weighting of the vectors v to obtain the output y. Finally, the output Y is obtained by the self-attention mechanism using the equation:
where T represents the transpose operation. The softmax operation is performed according to the following equation:
where zi represents the i-th data point within a data segment.
M = max(z)
In computing the segment of y1, the corresponding q1 is subjected to a dot product operation with all k segments, respectively. The softmax operation is performed, and the result is used as weights to sum v segments to obtain the y1 segment. The above process is repeated to obtain all y segments. Subsequently, all y segments are combined into the final output Y by a linear layer. This processing ignores the position relationship between data segments, thus avoiding the long-range memory problem caused by the recurrent structure. However, positional information is an essential feature of temporal data. A position encoding operation is performed before the data segments are input for the location information can be captured by the self-attention network. Position encoding is carried out using the following equation:
where xnorigin represents the n-th original data segment. pn represents the n-th position encoding. d represents the dimension of the data segment. The input data segment with the added position encoding is obtained by summing pn and xnorigin.
xn = xnorigin + pn
3. Preparation for Validation Experiment
3.1. Input Data Items Selection
If all data items in Table 1 are used as the input data of the neural network, not only will the computation load significantly increase, but the learning efficiency of the neural network will also be affected. Therefore, selecting a few items from all the data items that can better characterize the charging voltage change is key to solving the problem.
First, no data items that are constant when charging will be selected, because they do not provide valid information related to charging voltage. Then, among charging-related data items, for the temperature of probes 1 to 16, it is challenging to determine the correspondence with the cell, and applying all probe temperature data would increase the computation load. Therefore, the temperature of probes 1 to 16 was not selected. Finally, among the environment-related data items, the effect of precipitation on the battery system is less direct than that of humidity, and the effect of visibility is so low as to be negligible. Therefore, precipitation and humidity were not selected. The input data items were selected by calculating the correlation coefficients of the remaining data items. The correlation coefficients of the data items are shown in Figure 4.
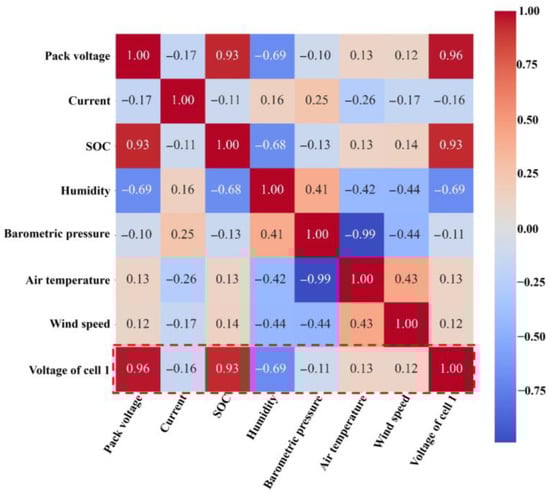
Figure 4.
The correlation coefficient of data items.
In the row of the voltage of cell 1, the data items for pack voltage, SOC, and humidity achieve a high correlation with the voltage of cell 1. Therefore, these three data items are selected as input data items. Additionally, in this case, the current curve of the constant current phase (as analyzed in Section 2.3) is jagged and horizontal, resulting in the current having low correlation coefficients with other curves that have an increasing or decreasing tendency. However, on the basis of electrical principles, battery current has a direct relation to voltage. Therefore, the current is still selected as an input data item. Finally, including the voltage of cell 1 itself, pack voltage, current, SOC, and humidity are selected as five input data items.
3.2. The Setting of Neural Network Training
Before the validation experiment, the structural hyperparameters of the model and the training set should be confirmed first. Moreover, when setting the structural hyperparameters of the model it is necessary to consider the input and output data sizes to ensure proper data transmission. At the same time, other structural hyperparameters should be set in conjunction with the volume of data to ensure that the model can be well fitted while avoiding overfitting due to excessive model settings. The structural hyperparameters of the model are shown in Table 2.
Table 2.
The structural and training hyperparameters of the model.
The training settings can greatly affect the model training effect, in turn affecting the prediction effect of the model. A loss function is a necessary tool for the back-propagation of the model in order to adjust the parameters. This study chose mean square error (MSE) as the loss function. This is because MSE increases the feedback adjustment when the error is large and reduces the adjustment for fine-tuning when the error is small. The equation of MSE is as follows:
where y is the true value, ŷ is the predicted value, and n is the sample number. The other hyperparameters for model training are shown in Table 2. The hyperparameter optimization and validation experiments of the model are based on the above settings.
3.3. Batch Size Optimization
To efficiently train the neural network model, the samples are integrated into a batch to train the model, and back-propagation is performed to adjust the parameters. The batch size is the number of samples in one batch. If the batch size is too large, the number of times back-propagation is performed in one epoch will be low, which could lead to insufficient model training. If the batch size is too small, back-propagation will be performed too many times in an epoch, thus increasing the training time. This can easily lead to serious overfitting of the model in one epoch. That is, batch size affects model training in many respects. Therefore, optimizing the batch size is crucial. The effect on training when increasing the batch size exponentially from 8 to 512 was tested, and the MSEs and time costs were recorded, as shown in Figure 5.
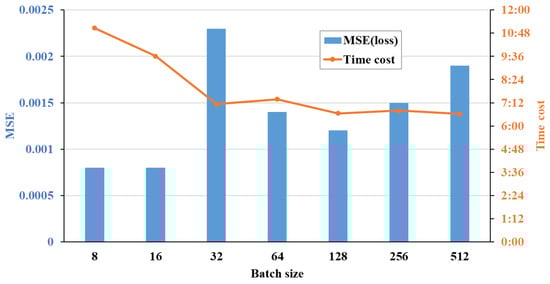
Figure 5.
MSEs and time costs of different batch sizes.
In Figure 5, the MSEs can be observed to reach a local optimum at 128 when batch size is changed from 32 to 512. However, the optimum in all tests was achieved with batch sizes of 8 and 16. In terms of time costs, the overall trend indicates that the larger the batch size, the smaller the time costs. Considering the MSEs and time costs, the batch size is set to 16.
3.4. Window Size Optimization
A variety of sample division methods have been proposed, and sliding windows are commonly used to perform temporal sample division. The use of a sliding window to divide the samples is shown in Figure 6. The key to the sliding window is the selection of the window size and the sliding size. The sliding size should not be set too high, so as to ensure the continuity of the predicted voltage data. The voltage data of each moment should be obtained by averaging at least two predicted values. Additionally, the sliding size should not be set too low, so as to avoid the averaging of too many predicted values, which would make the prediction curve too smooth and cause detailed information to be lost. Therefore, the sliding size is set to half of the predicated window size (PWS).
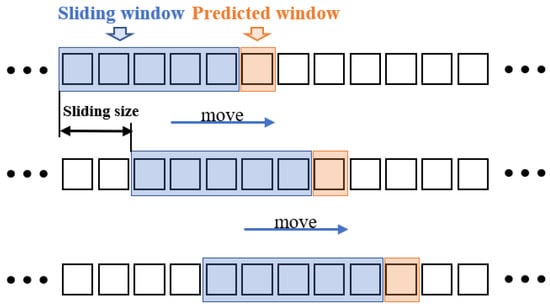
Figure 6.
Dividing samples using the sliding window.
After determining the sliding size, the sliding window size (SWS) and PWS are determined by grid search. The selection of the SWS and PWS should be constrained. If the SWS is too small, it will not be able to provide enough information for the neural network model. In addition, if the SWS is too large, the model computation load will be increased, making it more difficult to extract processing information. If the PWS is too small, it will not be able to provide enough warning time. If the PWS is too large, the predictive ability of the neural network model will be reduced. Considering the prediction time and sampling frequency, the candidate window size is set as {6, 30, 60, 90, 120}. These values correspond to one minute, five minutes, ten minutes, fifteen minutes, and twenty minutes, respectively. Additionally, considering that sufficient input information for the neural network is necessary, the SWS should be larger than the PWS. The MREs with different window sizes are shown in Figure 7.
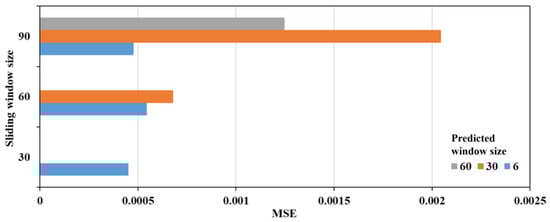
Figure 7.
MREs with different window sizes.
In Figure 7, the MSEs are smaller when the PWS is set to 6. However, the trend of SWS is not obvious. The lowest MSE is obtained when the SWS is 30, and the MSE increases when SWS increases to 60 and decreases when it reaches 90. This may be because the increase in SWS increases the difficulty of model learning, and the increase in input information can improve the prediction accuracy to some extent. Under the influence of these two factors, the trend of MREs with different SWS is not obvious. The PWS is set to 6 and the SWS is set to 30.
4. Results and Discussion
4.1. Prediction Results and Discussion
All data samples are divided into a training set, a validation set, and a test set, in proportions of 8:1:1, respectively. The model is trained according to the above settings and parameter optimization results, and the training set loss curve and validation set loss curve during the training process are shown in Figure 8.
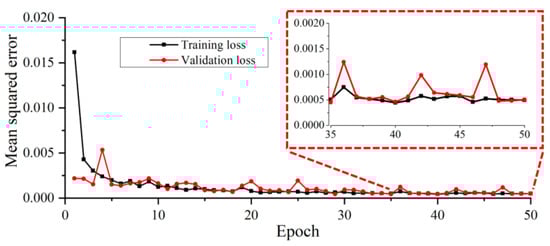
Figure 8.
The training set loss curve and validation set loss curve.
It can be observed that the model converges rapidly in the first five epochs. After that, the MSE gradually decreases within a small range. Even in the latter epochs, the error difference between the training and validation sets is not significant, indicating that the model does not suffer from significant overfitting problems. The model training effect is good. The voltage prediction results before and after hyperparameter optimization are shown in Figure 9.
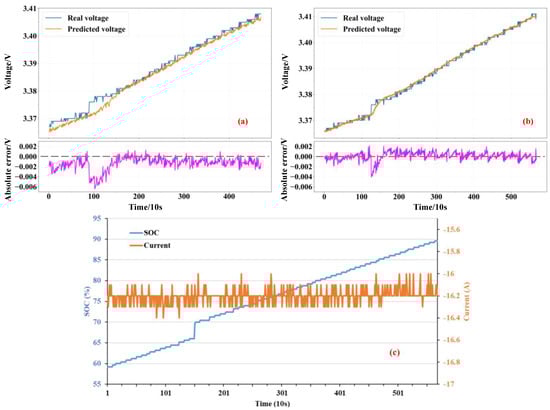
Figure 9.
The voltage prediction results before and after hyperparameter optimization: (a) prediction results before optimization; (b) prediction results after optimization; (c) SOC and current.
As can be seen from Figure 9, the optimized prediction results were much closer to the real voltage. The average error of the prediction results after optimization was less than 2 mV. The large voltage changes at around 100 points were also well predicted, avoiding the large absolute errors shown in Figure 9a. At the same time, the real voltage has a step-like curve due to the low accuracy of the data. The predicted voltage changes more gently, and the absolute error is around 0, which makes up for the low accuracy of the data, to some extent.
4.2. Verification of Superiority and Stability
To verify the superiority of the state partitioning method, the models were trained separately using three data partitions, and each partitioned model was used to predict the data of the different partitions. The prediction results are shown in Figure 10.
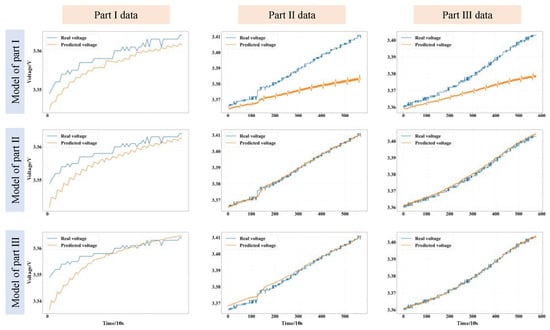
Figure 10.
The prediction results of each partitioned model were used to predict the data of different partitions.
It can be seen that the model trained with the same partition data achieved a better prediction effect on the partition. To some extent, this verifies that the partitioning model is better able to learn the characteristics of the partitioning data, thus avoiding different partition data features reducing the fitting ability of the model. The accuracy of model analysis is improved.
5. Conclusions
Multiple faults of electric vehicle batteries can be diagnosed on the basis of voltage. To find voltage fault information in advance and reduce battery safety risk, a state-partitioned voltage fault prognosis method based on a self-attention network was proposed in this paper. First, the charging voltage curve trends under different states of charge are analyzed. The voltage data are divided into three parts with characteristics typical of each given state of charge. After that, a voltage prediction model based on a self-attentive network is trained with each part of the data separately. Finally, voltage fault prognosis is implemented using the threshold method.
The voltage prediction model trained using the state partition data is able to learn the typical features of each part of the data, improving prediction accuracy. Voltage prediction using a self-attention network improves the long-range data analysis capability and facilitates the learning of more data features.
The method was validated using real operating data of electric vehicles. The effects of different batch sizes and window sizes on model training were analyzed, and the optimized hyperparameters were used to train the voltage prediction model. Finally, the superiority and robustness of the voltage prediction method were verified. The average error of the predicted voltage is less than 2 mV. Moreover, the predicted voltage presents improved data accuracy to some extent. The voltage of each partition is predicted by the partition model. Each model achieves the best prediction results for the partitioning voltages to which it belongs. This verifies that the partitioning model is better able to learn the characteristics of the partitioning data.
The voltage fault prognosis method proposed in this paper is able to achieve better voltage prediction accuracy on real vehicle data under complex operating conditions. The model is able to be effectively trained using a small amount of data. It provides a new research concept for voltage fault prognosis.
Author Contributions
Conceptualization, J.H.; Data curation, J.H.; Formal analysis, H.Z.; Funding acquisition, J.H. and G.W.; Investigation, H.Z. and Z.W.; Methodology, H.Z.; Project administration, J.H. and G.W.; Software, H.Z.; Supervision, J.H.; Validation, H.Z.; Writing—original draft, H.Z. and Z.W.; Writing—review and editing, J.H. All authors have read and agreed to the published version of the manuscript.
Funding
This project is supported in part by the National Natural Science Foundation of China (No. 52107220), Postdoctoral Research Fund Project of China (No. 2021M690353), the Scientific and Technological Innovation Foundation of Foshan (No. BK21BE012), the Postdoctoral Research Foundation of Shunde Innovation School of University of Science and Technology Beijing (No. 2021BH007), the Open Project of Key Laboratory of Conveyance Equipment (East China Jiaotong University), Ministry of Education (No. KLCE2021-02), The Science and Technology Research Project of Jiangxi Provincial Department of Education (No. GJJ210636), and the Interdisciplinary Research Project for Young Teachers of USTB (Fundamental Research Funds for the Central Universities) (NO. FRF-IDRY-21-013).
Institutional Review Board Statement
Not applicable.
Informed Consent Statement
Not applicable.
Data Availability Statement
The data presented in this study are available on request from the corresponding author. The data are not publicly available due to privacy.
Conflicts of Interest
The authors declare no conflict of interest.
References
- Samieian, M.A.; Hales, A.; Patel, Y. A Novel Experimental Technique for Use in Fast Parameterisation of Equivalent Circuit Models for Lithium-Ion Batteries. Batteries 2022, 8, 125. [Google Scholar] [CrossRef]
- Pourrahmani, H.; Xu, C.; Van herle, J. Organic Rankine Cycle as the Waste Heat Recovery Unit of Solid Oxide Fuel Cell: A Novel System Design for the Electric Vehicle Charging Stations Using Batteries as a Backup/Storage Unit. Batteries 2022, 8, 138. [Google Scholar] [CrossRef]
- Gandoman, F.H.; El-Shahat, A.; Alaas, Z.M.; Ali, Z.M.; Berecibar, M.; Abdel Aleem, S.H.E. Understanding Voltage Behavior of Lithium-Ion Batteries in Electric Vehicles Applications. Batteries 2022, 8, 130. [Google Scholar] [CrossRef]
- Hong, J.; Wang, Z.; Qu, C.; Zhou, Y.; Shan, T.; Zhang, J.; Hou, Y. Investigation on Overcharge-caused Thermal Runaway of Lithium-Ion Batteries in Real-world Electric Vehicles. Appl. Energy 2022, 321, 119229. [Google Scholar] [CrossRef]
- Qiu, Y.; Jiang, F. A review on passive and active strategies of enhancing the safety of lithium-ion batteries. Int. J. Heat Mass Transf. 2022, 184, 122288. [Google Scholar] [CrossRef]
- Christensen, P.A.; Anderson, P.A.; Harper, G.D.J.; Lambert, S.M.; Mrozik, W.; Rajaeifar, M.A.; Wise, M.S.; Heidrich, O. Risk management over the life cycle of lithium-ion batteries in electric vehicles. Renew. Sustain. Energy Rev. 2021, 148, 111240. [Google Scholar] [CrossRef]
- Hong, J.; Wang, Z.; Yao, Y. Fault prognosis of battery system based on accurate voltage abnormity prognosis using long short-term memory neural networks. Appl. Energy 2019, 251, 113381. [Google Scholar] [CrossRef]
- Qian, C.; Wang, Z.; Xin, G.; Shi, X. Datasheet Driven Switching Loss, Turn-ON/OFF Overvoltage, di/dt, and dv/dt Prediction Method for SiC MOSFET. IEEE Trans. Power Electron. 2022, 37, 9551–9570. [Google Scholar] [CrossRef]
- Hong, J.; Wang, Z.; Ma, F.; Yang, J.; Xu, X.; Qu, C.; Zhang, J.; Shan, T.; Hou, Y.; Zhou, Y. Thermal Runaway Prognosis of Battery Systems Using the Modified Multi-Scale Entropy in Real-World Electric Vehicles. IEEE Trans. Transp. Electrif. 2021, 7, 2269–2278. [Google Scholar] [CrossRef]
- Hong, J.; Wang, Z.; Chen, W.; Leyi, W.; Lin, P.; Qu, C. Online Accurate State of Health Estimation for Battery Systems on Real-World Electric Vehicles with Variable Driving Conditions Considered. J. Clean. Prod. 2021, 294, 125814. [Google Scholar] [CrossRef]
- Ahmad, N.I.; Ali, Z.; Ab Kadir, M.Z.A.; Osman, M.; Zaini, N.H.; Roslan, M.H. Impacts of lightning-induced overvoltage on a hybrid solar PV–battery energy storage system. Appl. Sci. 2021, 11, 3633. [Google Scholar] [CrossRef]
- Liu, C.; Hu, M.; Jin, G.; Xu, Y.; Zhai, J. State of power estimation of lithium-ion battery based on fractional-order equivalent circuit model. J. Energy Storage 2021, 41, 102954. [Google Scholar] [CrossRef]
- Wang, Q.; Wang, Z.; Zhang, L.; Liu, P.; Zhang, Z. A novel consistency evaluation method for series-connected battery systems based on real-world operation data. IEEE Trans. Transp. Electrif. 2020, 7, 437–451. [Google Scholar] [CrossRef]
- Hong, J.; Ma, F.; Xu, X.; Yang, J.; Zhang, H. A novel mechanical-electric-hydraulic power coupling electric vehicle considering different electrohydraulic distribution ratios. Energy Convers. Manag. 2021, 249, 114870. [Google Scholar] [CrossRef]
- Chen, Y.; Kang, Y.; Zhao, Y.; Wang, L.; Liu, J.; Li, Y.; Liang, Z.; He, X.; Li, X.; Tavajohi, N.; et al. A review of lithium-ion battery safety concerns: The issues, strategies, and testing standards. J. Energy Chem. 2021, 59, 83–99. [Google Scholar] [CrossRef]
- Li, D.; Zhang, Z.; Liu, P.; Wang, Z.; Zhang, L. Battery fault diagnosis for electric vehicles based on voltage abnormality by combining the long short-term memory neural network and the equivalent circuit model. IEEE Trans. Power Electron. 2020, 36, 1303–1315. [Google Scholar] [CrossRef]
- Buttà, C.; Zappia, L.; Laterra, G.; Roberto, M. Diagnostic and prognostic role of electrocardiogram in acute myocarditis: A comprehensive review. Annals of Noninvasive Electrocardiology 2020, 25, e12726. [Google Scholar] [CrossRef] [PubMed]
- Gan, N.; Sun, Z.; Zhang, Z.; Xu, S.; Liu, P.; Qin, Z. Data-driven fault diagnosis of lithium-ion battery overdischarge in electric vehicles. IEEE Trans. Power Electron. 2021, 37, 4575–4588. [Google Scholar] [CrossRef]
- Sun, Z.; Han, Y.; Wang, Z.; Chen, Y.; Liu, P.; Qin, Z.; Zhang, Z.; Wu, Z.; Song, C. Detection of voltage fault in the battery system of electric vehicles using statistical analysis. Appl. Energy 2022, 307, 118172. [Google Scholar] [CrossRef]
- Hsu, C.W.; Xiong, R.; Chen, N.Y.; Li, J.; Tsou, N.T. Deep neural network battery life and voltage prediction by using data of one cycle only. Appl. Energy 2022, 306, 118134. [Google Scholar] [CrossRef]
- Han, W.; Altaf, F.; Zou, C.; Wik, T. State of power prediction for battery systems with parallel-connected units. IEEE Trans. Transp. Electrif. 2021, 8, 925–935. [Google Scholar] [CrossRef]
- Wang, S.; Takyi-Aninakwa, P.; Fan, Y.; Fan, Y.; Yu, C.; Jin, S.; Fernandez, C.; Stroe, D.I. A novel feedback correction-adaptive Kalman filtering method for the whole-life-cycle state of charge and closed-circuit voltage prediction of lithium-ion batteries based on the second-order electrical equivalent circuit model. Int. J. Electr. Power Energy Syst. 2022, 139, 108020. [Google Scholar] [CrossRef]
- Fleischer, C.; Waag, W.; Heyn, H.M.; Sauer, D.U. On-line adaptive battery impedance parameter and state estimation considering physical principles in reduced order equivalent circuit battery models: Part 1. Requirements, critical review of methods and modeling. J. Power Sources 2014, 260, 276–291. [Google Scholar] [CrossRef]
- Wu, L.; Pang, H.; Geng, Y.; Liu, X.; Liu, J.; Liu, K. Low-complexity state of charge and anode potential prediction for lithium-ion batteries using a simplified electrochemical model-based observer under variable load condition. Int. J. Energy Res. 2022, 46, 11834–11848. [Google Scholar] [CrossRef]
- Shi, H.; Wang, S.; Fernandez, C.; Yu, C.; Xu, W.; Dablu, B.E.; Wang, L. Improved multi-time scale lumped thermoelectric coupling modeling and parameter dispersion evaluation of lithium-ion batteries. Appl. Energy 2022, 324, 119789. [Google Scholar] [CrossRef]
- Dubarry, M.; Beck, D. Big data training data for artificial intelligence-based Li-ion diagnosis and prognosis. J. Power Sources 2020, 479, 228806. [Google Scholar] [CrossRef]
- Hochreiter, S.; Schmidhuber, J. Long short-term memory. Neural Comput. 1997, 9, 1735–1780. [Google Scholar] [CrossRef]
- Tian, J.; Xiong, R.; Shen, W.; Lu, J.; Yang, X.G. Deep neural network battery charging curve prediction using 30 points collected in 10 min. Joule 2021, 5, 1521–1534. [Google Scholar] [CrossRef]
- Yang, Y. A machine-learning prediction method of lithium-ion battery life based on charge process for different applications. Appl. Energy 2021, 292, 116897. [Google Scholar] [CrossRef]
- Tobar, F.; Castro, I.; Silva, J.; Orchard, M. Improving battery voltage prediction in an electric bicycle using altitude measurements and kernel adaptive filters. Pattern Recognit. Lett. 2018, 105, 200–206. [Google Scholar] [CrossRef]
- Riaz, M.T.; Basharat, M.; Hameed, N.; Shafique, M.; Luo, J. A data-driven approach to landslide-susceptibility mapping in mountainous terrain: Case study from the Northwest Himalayas, Pakistan. Nat. Hazards Rev. 2018, 19, 05018007. [Google Scholar] [CrossRef]
- Chakraborty, T.; Ghosh, I. Real-time forecasts and risk assessment of novel coronavirus (COVID-19) cases: A data-driven analysis. Chaos Solitons Fractals 2020, 135, 109850. [Google Scholar] [CrossRef] [PubMed]
- Tantalaki, N.; Souravlas, S.; Roumeliotis, M. Data-driven decision making in precision agriculture: The rise of big data in agricultural systems. J. Agric. Food Inf. 2019, 20, 344–380. [Google Scholar] [CrossRef]
- Ma, R.; Yang, T.; Breaz, E.; Li, Z.; Briois, P.; Gao, F. Data-driven proton exchange membrane fuel cell degradation predication through deep learning method. Appl. Energy 2018, 231, 102–115. [Google Scholar] [CrossRef]
- Wang, L.; Xu, X.; Liu, C.; Chen, Z. M-DA: A Multifeature Text Data-Augmentation Model for Improving Accuracy of Chinese Sentiment Analysis. Sci. Program. 2022, 2022, 3264378. [Google Scholar] [CrossRef]
- Bandara, K.; Hewamalage, H.; Liu, Y.H.; Kang, Y.; Bergmeir, C. Improving the accuracy of global forecasting models using time series data augmentation. Pattern Recognit. 2021, 120, 108148. [Google Scholar] [CrossRef]
- Bose, B.; Garg, A.; Panigrahi, B.K.; Kim, J. Study on Li-ion battery fast charging strategies: Review, challenges and proposed charging framework. J. Energy Storage 2022, 55, 105507. [Google Scholar] [CrossRef]
- Yang, J.; Cai, Y.; Mi, C. Lithium-ion battery capacity estimation based on battery surface temperature change under constant-current charge scenario. Energy 2022, 241, 122879. [Google Scholar] [CrossRef]
- Yang, J.; Cai, Y.; Mi, C.C. State-of-Health Estimation for Lithium-Ion Batteries Based on Decoupled Dynamic Characteristic of Constant-Voltage Charging Current. IEEE Trans. Transp. Electrif. 2021, 8, 2070–2079. [Google Scholar] [CrossRef]
- Yu, Y.; Si, X.; Hu, C.; Zhang, J. A review of recurrent neural networks: LSTM cells and network architectures. Neural Comput. 2019, 31, 1235–1270. [Google Scholar] [CrossRef]
- Vaswani, A.; Shazeer, N.; Parmar, N.; Uszkoreit, J.; Jones, L.; Gomez, A.N.; Kaiser, Ł.; Polosukhin, I. Attention is all you need. Adv. Neural Inf. Process. Syst. 2017, 30. [Google Scholar] [CrossRef]
- Kitaev, N.; Kaiser, Ł.; Levskaya, A. Reformer: The Efficient Transformer. arXiv 2020, arXiv:2001.04451. [Google Scholar]
Publisher’s Note: MDPI stays neutral with regard to jurisdictional claims in published maps and institutional affiliations. |
© 2022 by the authors. Licensee MDPI, Basel, Switzerland. This article is an open access article distributed under the terms and conditions of the Creative Commons Attribution (CC BY) license (https://creativecommons.org/licenses/by/4.0/).