Abstract
The European Parliament’s climate and energy policy, which aims to cut greenhouse gas emissions by 2030 considerably, imposes on Member States the duty to develop National Action Plans (NAPs), which determine the percentage of renewable energy sources (RES) in gross energy consumption. Poland assumed a percentage of renewable energy sources in gross energy consumption of 21–23% in the NREAP. In 2020, Poland’s utilisation of renewable energy sources was 16.2% (22nd among EU nations), which was lower than the European average. The municipal sector, particularly sewage treatment facilities, can undoubtedly contribute to an increase in renewable energy generation and utilisation. Wastewater and sewage sludge are excellent sources of heat and energy in the methane fermentation process, and the sewage treatment plant area is perfect for solar panel installation. The article is a case study that presents the possibility of decreasing CO2 emissions from wastewater treatment facilities by 45,000 PE due to using renewable energy sources such as photovoltaics and cogeneration. The average monthly CO2 emission reduced from 68,905 kg CO2/ month to 37,385 kg CO2/month with the adoption of renewable energy sources.
1. Introduction
The release of greenhouse gases, particularly carbon dioxide, is one of the causes of global climate change, with the primary source being the use of fossil fuels for energy and transportation. The electrical industry accounts for 40% of worldwide CO2 emissions. Electricity is generated primarily in the European Union through renewable energy sources, nuclear energy, gaseous fuels, and solid fuels. In 2018, the total amount of greenhouse gases emitted by the EU reduced by 12% compared to 2010. Poland is the only EU country producing energy from solid fossil fuels (hard coal and lignite) and is responsible for 10% of total CO2 emissions in the EU. In 2018, CO2 emissions per capita in Poland were 11 tonnes per M year, whereas in the EU, they were 8.6 tonnes per capita per year [1].
The European Parliament’s 2018 policy establishes the share and development of renewable energy sources (RES) in energy production, with the climate and energy objective of considerably reducing greenhouse gas emissions by 2030 [2]. The EU Member States established amounts of renewable energy sources in gross energy consumption in so-called National Action Plans. Poland projects that renewable energy sources will account for 21–23% of energy output in 2030, and that by 2040, more than half of installed capacity will be zero-emission sources [3]. In Europe in 2020, renewable energy sources, including hydro, wind, and solar, covered roughly 30% of world energy consumption in 2019 (Figure 1) (a 3% rise from the previous year) [4].
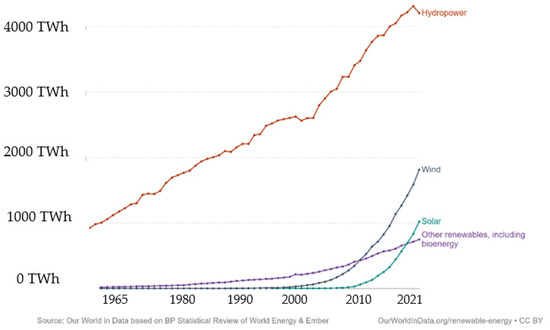
Figure 1.
Global renewable energy output, Reprinted with permission from Ref. [4] 2022, OurWorldinData.org.
Austria is the European leader, with RES accounting for 78.2% of domestic power consumption. At the time, Poland’s total energy value of primary energy obtained from renewable sources was 524,113 TJ or 21.6%. The primary energy sources were solid and liquid biofuels as well as wind energy (Figure 2) [5,6]. Renewable energy accounted for 16.13% of total final energy consumption, which was an increase of 0.76% year over year.
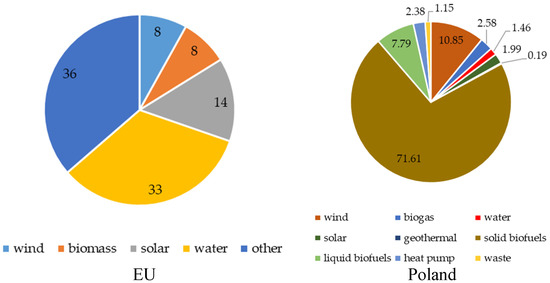
Figure 2.
Balance of renewable energy usage in the EU and Poland in 2020. Own study based on Refs. [5,6].
Water and wastewater management is a sector that generates around 1–5% of national power demand [7,8,9,10]. In contrast, local (commune, poviat) demand might range from a dozen to several dozen percent of public sector electricity consumption. Because of the sector’s importance for public health and safety, the objective is to achieve a suitable technological result in water and wastewater treatment, regardless of energy efficiency. The National Program of Municipal Wastewater Treatment, which has been in place in Poland since the 1990s, aimed at improving the efficiency of removing pollutants from sewage, including biogenic compounds, as well as the reliability of equipment operation, as well as creating a reserve in terms of throughput and meeting the quality of wastewater discharged into the environment. Table 1 shows a list of wastewater treatment plants in Poland in 2020 based on the size and efficacy of the treatment.

Table 1.
Municipal wastewater treatment plants in Poland 2020 [11].
According to the size structure of wastewater treatment plants in Poland, more than 750 of the 1664 facilities provide high-efficiency wastewater treatment with higher biogen removal, and 81 facilities are big treatment plants with more than 100,000 PE. In Poland, about 1.8 bil m3 of wastewater from 2.5 bil m3 of wastewater were processed in high-efficiency systems with high energy consumption [12,13]. Because of the present climate crisis and rising electricity costs, the operators’ actions are equally focused on the accomplished environmental effect and the element of energy efficiency, which will minimise the facility’s running costs. One of the operations conducted is the establishment of own energy production in sewage treatment facilities. Extensive facilities have a wider area of land amenable to, for example, the installation of solar collectors, a greater potential for biogas generation due to huge volumes of surplus sludge, and they often run with a reasonably consistent hydraulic load and pollution load [14]. Given the overall improvement in the energy balance of the wastewater sector, acquiring own energy exclusively at big facilities >100,000 PE will not result in a significant improvement in decreasing the consumption of imported power and thereby cutting CO2 emissions. As indicated in Table 1, most of Poland’s wastewater is processed in wastewater treatment facilities with capacities ranging from 2000 to 100,000 PE. The option of incorporating renewable energy sources into these plants should be examined to minimise CO2 emissions. The efficiency gained in big facilities are often described in the literature and publications in this field [15,16]. At the same time, small and medium-sized wastewater treatment plants are thought to have limited energy-generating potential. However, effective condition analysis and energy optimisation in facility management are critical.
A wastewater treatment facility’s energy consumption is determined by the pollutant loads in raw wastewater, the output’s necessary quality, the treatment plant’s size, and the technology utilised [17]. The energy requirement for traditional activated sludge treatment facilities typically ranges from 0.30 to 1.2 kWh/m3, with the nitrification process using the most energy owing to the necessity to operate the aeration system [18]. When wastewater treatment is carried out using chemical or chemical-physical processes, electricity consumption rises to 1.3 and even 2.8 kWh/m3, respectively [19]. According to the Polish Waterworks Chamber of Commerce study, the energy-intensity index for Polish WWTPs is set at 0.71–1.04 kWh/m3 (data for 2017) [20]. The energy index in the chosen Polish WWTPs is: Rzeszów WWTP 0.865 kWh/m3 [21], Krosno WWTP 0.61–1.11 kWh/m3 [22], Opole WWTP 0.723 kWh/m3 [23], and Iława 0.812–1.37 kWh/m3 [24].
Energy consumption and greenhouse gas emissions are important elements in determining the efficiency and cost of wastewater treatment in relation to the environmental effect. The biodegradation of contaminants and energy usage are two potential sources of CO2 emissions in wastewater treatment facilities. According to Campos et al. [25], CO2 emissions from wastewater treatment plants due to energy consumption are 0.391 kgCO2/kWh, and 0.08 kg CO2/kg COD from aerobic wastewater treatment processes. According to Lin [26], energy consumption CO2 emissions from wastewater treatment plants account for 40% of total emissions. This demonstrates that the pursuit of a method to minimise energy consumption in a wastewater treatment plant through the technical and economic optimisation of wastewater treatment operations and sewage sludge treatment is correct. When the alternatives for energy optimisation are gone, it is vital to seek other energy sources.
Literature data indicate that the potential value of energy stored in wastewater often exceeds the demand for its treatment. For example, the energy value of COD ranges from 4.92 to 7.97 kWh/kg COD and is far from energy demand [27]. Biogas with a methane content of about 65% has an energy potential of 6.5 kWh/m3. Depending on the efficiency of biogas production from sludge, about 15–40% of the energy demand of wastewater treatment plants can be met by producing biogas and using it in cogeneration systems [28]. Harnessing the energy potential of wastewater and sludge allows for a reduction in the amount of energy purchased from outside as well as a reduction in greenhouse gas emissions, including CO2.
This article analyses estimated CO2 emissions from wastewater treatment plants during the period when the only source of electricity was externally purchased energy, and after the introduction of renewable energy sources (RES). The analysis of energy consumption was carried out for a mechanical–biological wastewater treatment plant with a PE of 45,000 located in western Poland (Lubuskie province). The WWTP produced the renewable energy from photovoltaics (PV) and cogeneration (BHKW). A solar system that generates electricity has an energy capacity of 200 kW. In a cogeneration unit, both electricity and heat are generated simultaneously. In the process of biogas combustion, mechanical energy is converted into electricity and heat. The generated electricity is received with parallel cooperation with the power grid. The generated heat (heating water) is used for the heating and technological needs of the facility (heating of sludge in the digester), or it can be fully or partially lost in the emergency cooling tower if priority is given to electricity generation without currently possible use of the generated heat. The balance of CO2 emission load from the wastewater treatment plant was estimated for the period from 2014 to 2021.
2. Case Study
The wastewater treatment facility, which was completed in 2008, was built for 45,000 PE and a maximum daily capacity of 3600 m3/d using low-loaded activated sludge in a flow system with distinct zones for biological nitrification, denitrification, and dephosphatation. The gravity and pressure sewage system transports municipal sewage and production sewage from the meat processing sector to the treatment facility. Slurry tankers transfer sewage from areas where the sewage infrastructure does not reach the catchment point. The facility’s present load is 23,000 PE (2020 m3/d), including 15,000 PE from industry (1250 m3/d).
Until 2014, the facility’s energy requirement, which amounted to around 1 million kWh per year, was entirely met by energy obtained from outside sources. In 2013, the treatment plant’s owner changed, and the Department of Water and Sewerage was formed. Following a detailed analysis of the company’s operating costs at the time, activities were initiated aimed at reducing the purchase of electricity and the operating costs of the treatment plant by constructing: (1) a photovoltaic installation and (2) a complete energy system based on the installation of a cogeneration unit with an AD system.
Stages of Incorporating Renewable Energy Sources into a Sewage Treatment Facility
In December 2014, a solar system with an energy capacity of 200 kW was put into service, consisting of 833 modules connected in chains of 5 to 26 modules in one chain. Assuming that one inverter can support a maximum of five strings and taking into account field capabilities, a system of 10 inverters with four strings of 19 modules each and one inverter with four strings of 17 modules each was used, so that the total power of the modules connected to the inverter was between 1.05 and 1.15 of the inverter’s nominal power and was not less than 0.9 or greater than 1.2 of the inverter’s power.
Because about 70% of the wastewater stream going to the facility is pre-treated sewage from meat processing industries with COD 1609–1744 g/m3 and BOD5 683–814 g/m3, measures were taken to integrate cogeneration installations with an AD system. The project was completed in 2021, and the substrate for biogas generation is excessive sludge from wastewater treatment facilities and high-calorific sludge from meat manufacturers’ industrial effluent. The cogeneration project assumed the following parameters: sludge load 1439 kg d.m./d, load of anaerobic digestion 1.38 kg d.o.m./d, fermentation time: 31 days, gas production 537 dm3/kg d.o.m., and daily biogas 1104 m3/d. The following characteristics were attained after the technological start-up: sludge load 848 kg d.o.m.//d, load of anaerobic digestion 1.15 kg d.o.m./d, fermentation time: 40 days on average, gas production 561 dm3/kg d.o.m./, and daily biogas 960 m3/d.
3. Methodology
The quantity of CO2 emissions (Equation (1)) from the plant in 2014–2021 was calculated based on the amount of consumed electricity purchased by the wastewater treatment plant and using the load factors for 1 MWh of electricity generated and consumed by the end user, as reported by the National Center for Balancing and Emissions Management.
where
CO2emission = (ENTotDem − ENTotOwn)/EF [kgCO2/1 MWh]
- CO2emission—carbon dioxide emission volume, kgCO2/1 MWh;
- ENTotDem—the total electricity demand of the wastewater treatment plant, MWh;
- ENTotOwn—the total amount of self-generated electricity from photovoltaics and cogeneration consumed at the wastewater treatment plant, MWh;
- EF—the load factor for 1 MWh of electricity generated and consumed by the end user, kgCO2/1 MWh.
Data on the volume of purchased electricity were obtained from the operator of the wastewater treatment plant. Values of the load factors for 1 MWh of electricity generated and consumed by the end user, between 2014 and 2020, varied from 823 kg CO2/MWh in 2014 to 698 kg CO2/MWh in 2020 [29,30,31,32,33,34,35]. Indicators for a specific year are published one year later; therefore, for 2021, the indicator’s value was used in the calculations for the year 2020. The magnitude of the load factors used in the calculations in the following years is shown in Table 2.

Table 2.
The load factors for 1 MWh of electricity generated and consumed by the end user in 2014–2020 [29,30,31,32,33,34,35].
For self-generated energy such as wind energy, solar radiation energy, geothermal energy, hydrothermal energy, and biofuels, the CO2 emission factor is zero kg/MWh. For this reason, from 2015 to 2021, the volume of CO2 emissions has been calculated on the basis of electricity consumption without the amount of own electricity produced and consumed [29,30,31,32,33,34,35].
4. Results
According to data research, the sewage treatment facility serviced from 26,500 to about 23,000 people between 2014 and 2021. Until 2017, the volume of processed wastewater grew (from 707,000 to 763,000 m3/year), but starting in 2018, the facility’s capacity was reduced to 735,000 m3/year. During the time period under consideration, the quality of treated wastewater released from the plant met the standards. The effectiveness of organic pollutant removal was 99.4% for BOD5 and 98.1% for COD. Total suspended solids removal was successful at 98.9%, whereas biogenic pollutants were effective at 92% for total nitrogen and 100% for total phosphorus. Compared to data from Polish [20,21,22,23,24] treatment facilities (0.71–1.37 kWh/m3), the indication of energy consumption for the treatment of 1 m3 of wastewater ranged from 1.46 to 1.34 kWh/m3. However, the energy requirement for removing specific pollutant loads, such as BOD5 or total nitrogen, is regarded as a credible predictor of wastewater treatment energy inputs [36]. The energy evaluation of a wastewater treatment plant based on the usage of power per 1 m3 of processed wastewater may be erroneous, especially for plants that receive a substantial amount of rainfall. The unit energy consumption for eliminating contaminants from wastewater is shown in Figure 3.
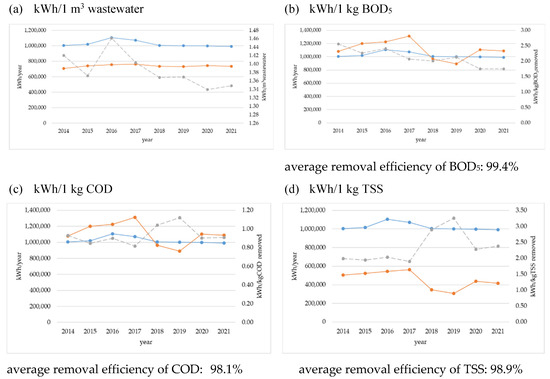
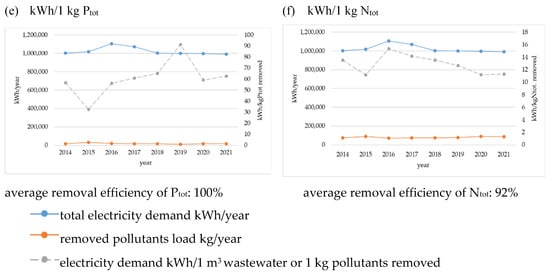
Figure 3.
Unit energy demand for removing pollutants from wastewater.
Analysis of the data presented in Figure 3 showed that the energy demand per 1 m3 of treated wastewater, as well as per 1 kg of pollutants removed, decreased over the considered time period. However in 2018–2019, despite lower COD and TSS loads, a higher energy input was required for its removal. This could have been the result of an increase in the share of organic pollutants not susceptible to biochemical decomposition contained in the suspended solids, fed with pre-treated wastewater from the meat industry.
The examination of the facility’s power use throughout the relevant period revealed a rise in energy demand in 2015–2017 (101.3–110.1%) compared to 2014, which was followed by a decline to 89.6%. The percentage of power purchased by the wastewater treatment plant was determined by the quantity of energy generated on its own, ranging from 64.3% to 82.7% between 2014 and 2021. Since 2015, photovoltaic energy output has met around 18% of total yearly consumption. The quantity of power created by cogeneration in 2021 lowered the amount of purchased energy by another 18.7%, increasing the percentage of own electricity to 35.7% (Figure 4).
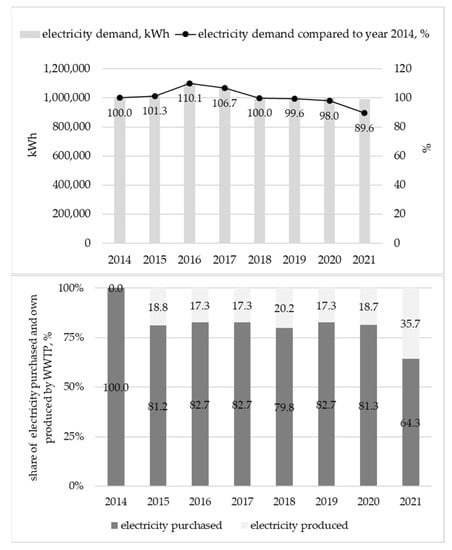
Figure 4.
Power usage at the treatment plant from 2014 to 2021 in comparison to 2014 as well as the fraction of owned and purchased electricity from 2014 to 2021.
The data analysis revealed that the yearly CO2 emissions from electricity consumption in the wastewater treatment plant were calculated in 2014 at 827,000 kg CO2 and dropped in subsequent years due to the generation of own energy (Figure 5). Electricity generated by photovoltaics cut CO2 emissions by 13–30%. When cogeneration energy was included in the balance sheet, CO2 emissions were 45% lower in 2021 than in 2014. The investigation of the quantity of CO2 emitted per unit of pollutants eliminated, on the other hand, revealed in 2014 emissions of: 1.2 kg CO2/m3 of wastewater; 0.8 kg CO2/kgCOD; 2.1 kg CO2/kg BOD5; 1.6 kg CO2/kg TSS; 11.1 kg CO2/kg Ntot and 46.8 kg CO2/kg Ptot. With the addition of photovoltaics, the emission value was reduced to 0.8–0.9 kg CO2/m3 of wastewater; 0.5–0.7 kg CO2/kg COD; 1.0–1.5 kg CO2 /kg BOD5; 1.2–1.9 kg CO2/kg TSS; 6–10 kg CO2/kg Ntot, and 21–54 kg CO2/kg Ptot. Cogeneration resulted in emissions of 0.6 kgCO2/m3 of wastewater; 0.4 kgCO2/kgCOD; 0.8 kgCO2/kg BOD5; 1 kg CO2/kg TSS; 5 kg CO2/kg Ntot, and 28 kg CO2/kg Ptot in 2021 (Figure 6).
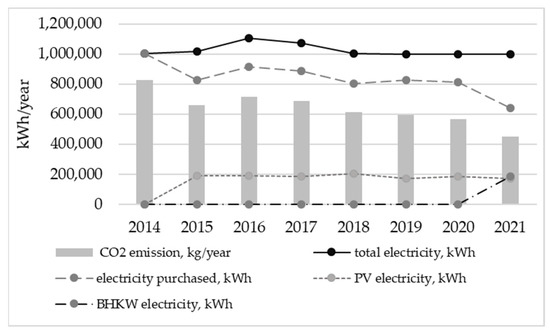
Figure 5.
Estimated CO2 emissions from the treatment plant based on power use from 2014 to 2021.

Figure 6.
Emissions of CO2 per unit of pollutants eliminated.
The data presented in Figure 6 show an increase in the volume of CO2 emissions associated with the removal of pollutants from wastewater in 2018–2019. The reason for the increase was a reduction of about 15% in the amount of energy obtained from photovoltaics, with a similar total demand for electricity as in 2015–2017. As a result, the share of purchased electricity, on the basis of which CO2 emissions are estimated, increased. The CO2 emissions decreased between 2020 and 2021, despite an increase in the pollutant load of the treatment plant (Figure 3). The reduction in the volume of emissions was related to an overall reduction in energy demand, the replacement of pumps with new more energy-efficient ones, and in 2021, a reduction in the share of purchased electricity as a result of obtaining energy from photovoltaics and cogeneration.
Domestic wastewater accounted for roughly 60% of the PE in the treatment facility in 2014-2015. Since 2016, industry wastewater PE has increased significantly, accounting for nearly 70% of total PE at the treatment facility. In 2016 and 2017, CO2 emissions increased due to an increase in the pollutant load of treatment facilities caused by discharged industrial wastewater. CO2 emissions have been steadily decreasing since 2018. However, data analysis revealed that industrial wastewater treatment resulted in twice as many CO2 emissions as eliminating pollutants from homes between 2016 and 2021 (Figure 7). The total CO2 emission per PE in 2014 was at the level of 33 kg CO2/PE and decreased to 19 kg CO2/PE in 2021.
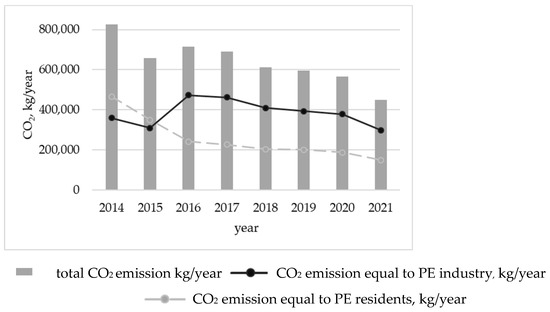
Figure 7.
CO2 emissions resulting from PE residential and industrial wastewater.
The graph depicts the average monthly CO2 emissions from 2014 to 2021, decreasing from 68,905 kg CO2/month to 37,385 kg CO2/month after introducing renewable energy sources (Figure 8).
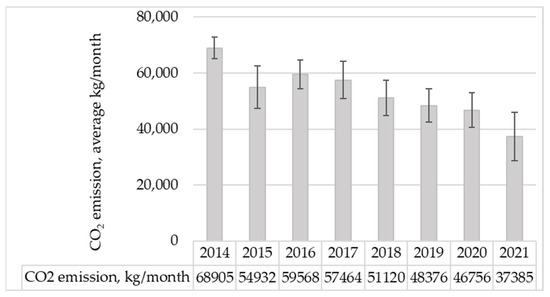
Figure 8.
Estimated average monthly CO2 emissions in 2014–2021.
However, it should be noted that the quantity of CO2 emissions predicted was based on changes in wastewater treatment plant power usage during the year. The most considerable decrease in CO2 emissions happens during the summer, when the panels are most exposed to solar radiation and photovoltaic energy generation is at its peak (Figure 9).
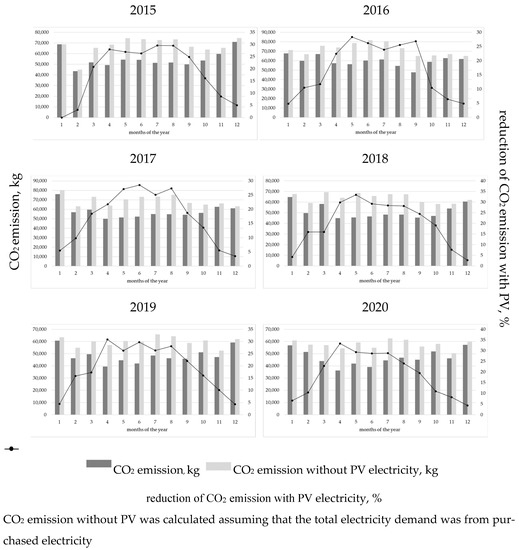
Figure 9.
CO2 emissions in individual months between 2015 and 2020.
Figure 10 shows the calculated CO2 emissions in the following months of 2021 and the share of electricity generation sources in 2021. Nearly 19% of electricity demand was covered by electricity from cogeneration, and 17% was from photovoltaic. Cogeneration, such as photovoltaics, provided varying amounts of electricity throughout the year. From June through October, the highest amount of power generation was recorded (Figure 10).
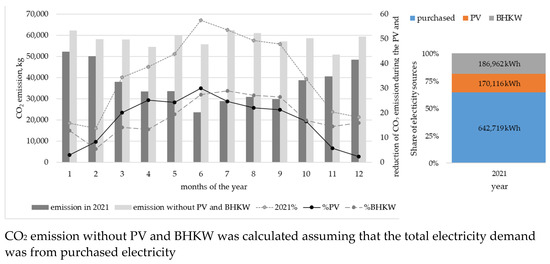
Figure 10.
Estimated CO2 emissions in 2021.
5. Conclusions
A case study research on the feasibility of using renewable energy sources at smaller wastewater treatment plants indicated that the potential for energy recovery and savings is significant and can be exploited as in the case of large wastewater treatment plants. Combining photovoltaics and biogas to generate electricity instead of using the power grid reduced estimated CO2 emissions. Due to photovoltaic energy, between 2015 and 2020, the amount of electricity purchased was on average 18% less than in 2014. In 2021, when cogeneration is switched on, the demand for external electricity was reduced by another 18.7%. Currently, the treatment plant covers more than 35% of its electricity needs from its own RES sources. Calculated CO2 emissions from 2014 to 2021 based on the sources of electricity used for the wastewater treatment plant showed that the introduction of RES resulted in a 45% reduction in CO2 over 7 years.
The case study presents estimates based on total electricity consumption. In order to make an accurate assessment of the energy efficiency of a wastewater treatment plant, and thus to assess the level of GHG emissions, detailed data are needed on the energy consumption of individual facilities, equipment and processes, the measurement of which is not currently standard. As shown in the work presented here, CO2 emissions from wastewater treatment plants can be reduced by changing the use of RES, but it is not insignificant to optimize and reduce energy waste, for example, by replacing equipment such as pumps.
Among the factors affecting the energy efficiency of a facility, good facility management involving data analysis to identify trends in energy consumption and take measures oriented toward reducing energy consumption is important.
The research topic under discussion is relevant in the context of emerging issues of the circular economy, with a particular focus on the ongoing energy transition. The use of renewable energy sources from on-site installations brings the operation of wastewater treatment plants closer to low-carbon, circular and environmentally beneficial solutions. Given that wastewater treatment plants are strategic facilities for water conservation, it is advisable to strive to make them independent of external energy sources.
Author Contributions
Conceptualization, E.P.-K., S.M. and M.M.; methodology E.P.-K. and S.M.; validation, E.P.-K., S.M. and M.M.; formal analysis, E.P.-K. and S.M.; resources, E.P.-K.; writing—original draft preparation E.P.-K., S.M. and M.M.; writing—review and editing, E.P.-K. and S.M.; visualization, E.P.-K. and S.M.; supervision, E.P.-K. and S.M.; project administration, S.M. All authors have read and agreed to the published version of the manuscript.
Funding
This research received no external funding; The APC was funded by the Marshal’s Office of Lubuskie Province in the framework of the competition Small Grants for Public Universities from Lubuskie Province. The funders had no role in the design of the study; in the collection, analyses, or interpretation of data; in the writing of the manuscript, or in the decision to publish the results.
Conflicts of Interest
The authors declare no conflict of interest.
Nomenclature
| AD | anaerobic digestion |
| BHKW | heating and power unit |
| BOD5 | biochemical oxygen demand |
| COD | chemical oxygen demand |
| CO2 | carbon dioxide |
| d.m. | dry matter |
| d.o.m. | dry organic matter |
| GHG | greenhouse gases |
| Ntot | total nitrogen |
| PE | population equivalent |
| Ptot | total phosphorus |
| PV | photovoltaic |
| RES | renewable energy sources |
| TSS | total suspended solids |
| WWTP | wastewater treatment plant |
References
- Poland on the Way to SDGs Report 2020, GUS. Available online: https://raportsdg.stat.gov.pl/2020/en/index.html (accessed on 5 October 2022).
- Directive 2009/28/EC of the European Parliament and of the Council of 23 April 2009 on the promotion of the use of energy from renewable sources and amending and subsequently repealing Directives 2001/77/EC and 2003/30/EC. Available online: https://eur-lex.europa.eu/LexUriServ/LexUriServ.do?uri=OJ:L:2009:140:0016:0062:en:PDF (accessed on 5 October 2022).
- Monitor Polski 2021, Item 264 Announcement of the Minister of Climate and Environment of 2 March 2021 on the state energy policy until 2040. Available online: https://www.gov.pl/web/climate/energy-policy-of-poland-until-2040-epp2040 (accessed on 5 October 2022).
- Our World in Data. Available online: https://ourworldindata.org/renewable-energy (accessed on 5 October 2022).
- Eurostat 2022: Share of Renewable Energy in the EU. Available online: https://ec.europa.eu/ (accessed on 5 October 2022).
- Statistics Poland 2020: Renewable Energy in 2020. Available online: https://stat.gov.pl/obszary-tematyczne/srodowisko-energia/energia/energia-ze-zrodel-odnawialnych-w-2020-roku,10,4.html (accessed on 5 October 2022).
- Gude, V.G. Energy and water autarky of wastewater treatment and power generation systems. Renew. Sustain. Energy Rev. 2015, 45, 52–68. [Google Scholar] [CrossRef]
- Smith, K.; Liu, S. Energy for Conventional Water Supply and Wastewater Treatment in Urban China: A Review. Glob. Chall. 2017, 1, 1600016. [Google Scholar] [CrossRef] [PubMed]
- McCarty, P.L.; Bae, J.; Kim, J. Domestic wastewater treatment as a net energy producer–can this be achieved? Environ. Sci. Technol. 2011, 45, 7100–7106. [Google Scholar] [CrossRef] [PubMed]
- Lu, L.; Guest, J.S.; Peters, C.A.; Zhu, X.; Rau, G.H.; Ren, Z.J. Wastewater treatment for carbon capture and utilization. Nat. Sustain. 2018, 1, 750–758. [Google Scholar] [CrossRef]
- Report on the Implementation of the National Wastewater Treatment Program for 2020. Pańswtowe Gospodarstwo Wodne. Wody Polskie. Warsaw, December 2021. Available online: https://www.wody.gov.pl/nasze-dzialania/krajowy-program-oczyszczania-sciekow-komunalnych (accessed on 5 October 2022).
- Belloir, C.; Stanford, C.; Soares, A. Energy benchmarking in wastewater treatment plants: The importance of site operation and layout. Environ. Technol. 2015, 36, 260–269. [Google Scholar] [CrossRef] [PubMed]
- Panepinto, D.; Fiore, S.; Zappone, M.; Genon, G.; Meucci, L. Evaluation of the energy efficiency of a large wastewater treatment plant in Italy. Appl. Energy 2016, 161, 404–411. [Google Scholar] [CrossRef]
- Soares, R.B.; Memelli, M.S.; Roque, R.P.; Gonçalves, R.F. Comparative Analysis of the Energy Consumption of Different Wastewater Treatment Plants. Int. J. Archit. Arts Appl. 2017, 3, 79–86. [Google Scholar] [CrossRef]
- Ivan, S.; Barros, R.; Geraldo, F. Electricity generation from biogas of anaerobic wastewater treatment Plants in Brazil: An assessment of feasibility and potential. J. Clean. Prod. 2016, 126, 504–514. [Google Scholar] [CrossRef]
- Myszograj, S.; Bocheński, D.; Mąkowski, M.; Płuciennik-Koropczuk, E. Biogas, Solar and Geothermal Energy—The Way to a Net-Zero Energy Wastewater Treatment Plant—A Case Study. Energies 2021, 14, 6898. [Google Scholar] [CrossRef]
- Longo, S.; Mirko d’Antoni, B.; Bongards, M.; Chaparro, A.; Cronrath, A.; Fatone, F.; Lema, J.M.; Mauricio-Iglesias, M.; Soares, A.; Hospido, A. Monitoring and diagnosis of energy consumption in wastewater treatment plants. A state of the art and proposals for improvement. Appl. Energy 2016, 179, 1251–1268. [Google Scholar] [CrossRef]
- Siatou, A.; Manali, A.; Gikas, P. Energy Consumption and Internal Distribution in Activated Sludge Wastewater Treatment Plants of Greece. Water 2020, 12, 1204. [Google Scholar] [CrossRef]
- Yang, J.; Chen, B. Energy efficiency evaluation of wastewater treatment plants (WWTPs) based on data envelopment analysis. Appl. Energy 2021, 289, 116680. [Google Scholar] [CrossRef]
- Chamber of Commerce “Polish Waterworks” (IGWP). Information Materials. 2020. Available online: https://www.igwp.org.pl (accessed on 5 October 2022).
- Masłoń, A. Analysis of energy consumption at the Rzeszów Wastewater Treatment Plant. In Proceedings of the International Conference on Advances in Energy Systems and Environmental Engineering (ASEE17), E3SWeb Conf, Wrocław, Poland, 2–5 July 2017; Volume 22, p. 00115. [Google Scholar]
- Trojanowicz, K.; Karamus, Ł. Energy utilization of biogas as an element of sewage sludge management in the wastewater treatment plant in Krosno. Forum Eksploatatora 2016, 4, 46–53. (In Polish) [Google Scholar]
- Szczyrba, P.; Masłoń, A.; Czarnota, J.; Olszewski, K. Analysis of sewage sludge and biogas-energy management at the Opole wastewater treatment plant. Ecol. Eng. 2020, 21, 26–34. [Google Scholar] [CrossRef]
- Masłoń, A.; Czarnota, J.; Szaja, A.; Szulczyk-Cieplak, J.; Łagód, G. The Enhancement of Energy Efficiency in a Wastewater Treatment Plant through Sustainable Biogas Use: Case Study from Poland. Energies 2020, 13, 6056. [Google Scholar] [CrossRef]
- Campos, J.L.; Valenzuela-Heredia, D.; Pedrouso, A.; Val del Río, A.; Belmonte, M.; Mosquera-Corral, A. Greenhouse Gases Emissions from Wastewater Treatment Plants: Minimization, Treatment, and Prevention. J. Chem. Vol. 2016, 2016, 3796352. [Google Scholar] [CrossRef]
- Lin, L. Carbon emission assessment of wastewater treatment plant based on accounting perspective. E3S Web Conf. 2020, 194, 04049. [Google Scholar] [CrossRef]
- Heidrich, E.S.; Curtis, T.P.; Dolfing, J. Determination of the internal chemical energy of wastewater. Environ. Sci. Technol. 2011, 45, 827–832. [Google Scholar] [CrossRef] [PubMed]
- Brandt, M.J.; Middleton, R.A.; Wang, S. Energy Efficiency in the Water Industry: A Compendium of Best Practices and Case Studies, Global Report; Iwa Publishing: London, UK, 2012. [Google Scholar]
- CO2 Emission Factors for Electricity at End-Users Based on Information Contained in the National Database of Greenhouse Gas and other Substance Emissions for 2014. National Center for Emissions Management (KOBiZE) April 2016. Available online: https://www.kobize.pl/uploads/materialy/materialy_do_pobrania/wskazniki_emisyjnosci/160616_WSKAZNIKI_CO2.pdf (accessed on 5 October 2022).
- CO2, SO2, NOx, CO, and TPS Emission Factors for Electricity at End-Users Based on Information Contained in the National Database of Greenhouse Gas and Other Substance Emissions for 2015. National Center for Emissions Management (KOBiZE) February 2017. Available online: https://www.kobize.pl/uploads/materialy/materialy_do_pobrania/wskazniki_emisyjnosci/170221_wskazniki_emisyjnosci.pdf (accessed on 5 October 2022).
- CO2, SO2, NOx, CO, and TPS Emission Factors for Electricity at End-Users Based on Information Contained in the National Database of Greenhouse Gas and Other Substance Emissions for 2016. National Center for Emissions Management (KOBiZE) December 2017. Available online: https://www.kobize.pl/uploads/materialy/materialy_do_pobrania/wskazniki_emisyjnosci/180108_wskazniki_spalanie_na_mwh.pdf (accessed on 5 October 2022).
- CO2, SO2, NOx, CO, and TPS Emission Factors for Electricity at End-Users Based on Information Contained in the National Database of Greenhouse Gas and Other Substance Emissions for 2017. National Center for Emissions Management (KOBiZE) December 2018. Available online: http://www.uwm.edu.pl/kopits/materialytechnologieniskoemisyjne/Wskazniki_emisji_energia%20elektryczna_2018.pdf (accessed on 5 October 2022).
- CO2, SO2, NOx, CO, and TPS Emission Factors for Electricity at End-Users Based on Information Contained in the National Database of Greenhouse Gas and Other Substance Emissions for 2018. National Center for Emissions Management (KOBiZE) December 2019. Available online: https://www.kobize.pl/uploads/materialy/materialy_do_pobrania/wskazniki_emisyjnosci/Wskazniki_emisyjnosci_grudzien_2019.pdf (accessed on 5 October 2022).
- CO2, SO2, NOx, CO, and TPS Emission Factors for Electricity at End-Users Based on Information Contained in the National Database of Greenhouse Gas and Other Substance Emissions for 2019. National Center for Emissions Management (KOBiZE) December 2020. Available online: https://www.kobize.pl/uploads/materialy/materialy_do_pobrania/wskazniki_emisyjnosci/Wskazniki_emisyjnosci_grudzien_2020.pdf (accessed on 5 October 2022).
- CO2, SO2, NOx, CO, and TPS Emission Factors for Electricity at End-Users Based on Information Contained in the National Database of Greenhouse Gas and Other Substance Emissions for 2020. National Center for Emissions Management (KOBiZE) December 2021. Available online: https://www.kobize.pl/uploads/materialy/materialy_do_pobrania/wskazniki_emisyjnosci/Wskazniki_emisyjnosci_grudzien_2021.pdf (accessed on 5 October 2022).
- Li, Z.H.; Zou, Z.H.; Wang, L.P. Analysis and Forecasting of the Energy Consumption in Wastewater Treatment Plant. Hindawi Math. Probl. Eng. 2019, 2019, 8690898. [Google Scholar] [CrossRef]
Publisher’s Note: MDPI stays neutral with regard to jurisdictional claims in published maps and institutional affiliations. |
© 2022 by the authors. Licensee MDPI, Basel, Switzerland. This article is an open access article distributed under the terms and conditions of the Creative Commons Attribution (CC BY) license (https://creativecommons.org/licenses/by/4.0/).