Abstract
Many new HVAC power cable installations on wind farms, both on- and offshore, have long lengths. In contrast to traditional power cable connections of a few kilometers, the failures of those systems usually result in much higher repair and unsupplied energy costs. To support the quality assurance of newly installed cable systems as well as to create a sound basis for condition-based maintenance, this paper discusses the technical challenges of the field testing of long-length power cable systems using a damped AC testing method and also discusses the best practical applications for the testing and diagnosis of these wind farm HVAC cable systems.
1. Introduction
In the field of renewable energy generation, developments of large on- and offshore wind farms with more generation capacity demand that energy is transported over longer distances. Furthermore, this must be executed with ever-smaller losses and larger amounts of power transmitted. According to [1], a long length of insulated cable is considered to be above 40 km for network voltages below 220 kV and above 20 km for a voltage level of 220 kV or higher.
The increasing lengths of cable lines mean a greater number of joints and cable sections are installed along the route. When building such cable lines, and especially when using multiple cable accessories, installation errors are more likely to occur.
The Refs. [1,2,3] point out that, considering long length on- and offshore power cables, special attention needs to be paid to post-installation and quality assurance requirements, but these publications do not provide any specific proposals, e.g.:
- (a)
- How to generate the requested powers onsite to over-stress long-length cable circuits with, for example, a capacitive load of more than 15 µF [4].
- (b)
- How to localize the partial discharges (PD) in long-length cable systems and how to detect partial discharges in a sensitive way [4].
- (c)
- The criteria for providing sufficient quality assurance of newly installed cable circuits or cable circuits in service operation [4].
Ref. [1] proposes the application of a soak test for 24 h at the grid’s working frequency of 50 or 60 Hz, at the normal operating voltage, Uo, as an alternative to the over-voltage test. Due to the lack of over-voltage stress, this solution has no value for controlling the weak spots present in a newly installed cable system.
Taking into consideration the repair costs of long cable installations, in particular, those located offshore [5,6,7], the best procedures have to be agreed upon, considering the following typical characteristics of long-offshore power cable circuits:
- (a)
- The need to test for partial discharges of the complete cable drum/carousel in the factory before shipping and onsite after installation.
- (b)
- The presence of a large number of installed (factory) joints.
- (c)
- The presence of the offshore installed joints (export cables).
- (d)
- The accessibility and space constraints affecting access to the offshore cable.
- (e)
- No possibility for distributed partial discharge measurements on the individual joints of a subsea cable.
Since long cable lines are characterized by extremely high capacities, testing and diagnosis performed with conventional AC test systems require large equipment and large input power. Consequently, this could run the risk of developers or contractors testing long-length cable systems using the above-mentioned soak test only.
As a result, and with respect to other authors’ publications [6,7,8,9], the novelty of this paper is to present a technical solution for testing long-length on- and offshore wind farm high-voltage cables (up to 230 kV), with the emphasis on the application of the damped AC testing and diagnosis method.
2. General Aspects of Quality Assurance
Referring to Ref. [4] and considering the regular lengths of XLPE insulated cable systems, cable accessories have the highest contribution in failure statistics. Most cable breakdowns manifest within the first 3 years of service operation. For service-aged cable circuits that have been 30 years in service, the majority of failures occur within the cable insulation.
The failure statistics in Ref. [3] show, that there is a chance of a failure every 42 km of circuit length during the cables’ service life. This requires dedicated condition-based maintenance for service-aged cables; however, there are no acknowledged methods and criteria for performing this [5,6,7].
Considering offshore wind farms, where long cable circuits are frequently used, the severity and the frequency of the failures of export and inter-array cables, compared to other components, are highest [10,11]. See Figure 1.
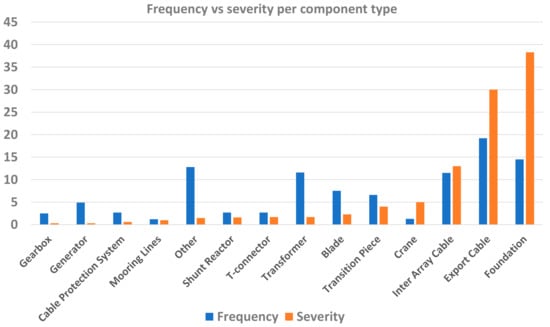
Figure 1.
In offshore wind farms, the total claims account for over 50% of subsea cable issues [10].
The causes of offshore cable failures are related to manufacturing, transportation, installation, operation, and environmental aspects [5]. Ref. [5] discussed the impact of failures on reliability, availability, and costs of offshore cable installations, and underlines the urgency of eliminating the underlying causes of failures. Since, in the future, longer offshore cables with a higher capacity and larger stresses will be needed, an increase in the probability of failure can be expected.
The authors of Ref. [5] stated that the present international regulations for quality control after the installation of power cables are deficient. To reduce the costs resulting from outages, reliability needs to be increased. This can be achieved by applying dedicated field-testing methods to ensure newly installed offshore power cable circuits are of a reliable enough quality to be taken into service operation. Furthermore, cable quality must be monitored over the on- and offshore wind farm’s operation lifetime. Nowadays, testing methods are available that have been developed over the past two decades and which provide advanced technologies by being less destructive and more sensitive to detect upcoming insulation failures when testing newly installed cables and when used for the diagnosis of service-aged cables [6,8,12,13,14,15,16,17,18].
Referring to Ref. [19], the long-standing necessity to modernize onsite testing methods, e.g., by being less destructive and more sensitive by using diagnostic parameters [5] for high-voltage cables, is not taking place with the required speed. This is because of a noticeable reluctance of manufacturers and the users of the conventional AC resonance test method to accept any of the alternative testing developments made in this area [6,8,12,13,14,15,16,17,18] over the last 15 years.
The goal is to discuss the reasons for a lack of progress in applying innovative solutions [1,2,3,20,21] for long-length on- and offshore power cables by highlighting the experiences and possibilities with a view to improving the process of the onsite testing and condition assessment towards the predictive maintenance of such systems. Therefore, in comparison to [5,6,8], the original contribution of this paper is the evaluation of the damped AC (DAC) and continuous AC (ACRT) testing methods, especially in relation to the field testing of long wind farm cable lengths, as this brings additional challenges. The novelty and value of this discussion are illustrated by the results of the field-testing and condition assessment of long HVAC cable routes that are typical for on- and offshore wind farms. This testing and assessment were undertaken with existing diagnostic techniques. The ultimate goal is to provide a basis for alternative testing technologies for such long cable systems.
3. Basic Characteristics of Long-Length Power Cable Systems
Wind farm cables can be several tens of kilometers long and have, in general, multiple joints and, in the case of offshore farms, possibly several factory- and/or offshore subsea joints. Furthermore, in offshore installations, the connection is made onshore at the landfall to the onshore cable circuit by means of a transition joint.
For onshore cable circuits, the number of joints that need to be installed depends mostly on the maximum size and weight of the cable drum used for the transport of one cable section. The required cross-section of the cable conductor defines the maximum possible length of each section, also taking into account the restrictions of the onsite conditions.
The larger the conductor cross-section, the shorter the cable sections and hence the more cable joints needed to be installed to obtain the required cable length. An example of a 50 km long 220 kV cable circuit is given in Table 1, with an indication of the total number of joints that need to be installed. The range given for the number of installed accessories is based on a maximum cable drum weight of approximately 20 tons to 40 tons for a cable with a copper conductor.

Table 1.
Example of cable characteristics of a typical 50 km long 220 kV cable circuit for different copper conductor cross-sections showing the number of installed cable accessories and cable capacitances.
The cross-section of the cable conductor also has an influence on the overall capacitance per cable phase, as the typical cable capacitance per kilometer increases with an increasing cross-section.
Table 1 also shows the overall cable capacitance of a 50 km long 220 kV circuit for three different conductor cross-sections. This value is of importance for calculating the input power needed to test the entire cable length after the installation.
Table 2 shows a comparison of the input power demand needed to energize a 50 km long 220 kV cable, based on different cable capacitances.
Table 2.
Estimation of input power needed for testing a typical 50 km long 220 kV cable (per single phase).
It can be seen that, although testing with AC resonance needs considerably less input compared to the 50 Hz transmitted power, it still is a challenge to generate this amount of power for onsite testing. To obtain the required power, a number of mobile power generators are needed.
In contrast with the AC resonance system, the damped AC tests do not compensate for the reactive losses in the tested object. Since the DAC systems apply a constant energizing current [13], the input power for such systems is significantly lower compared to the ACTR technologies, as shown in Table 2.
4. Essential Testing and Non-Destructive Diagnostic Parameters
Developers, contractors, power companies, and investors are in continuous dialogue on how to secure reliable cable service operation. The important aspects in this respect are [5]:
- The quality control of newly installed cable circuits. How can the cable be tested in a sensitive way to find any possible defects without being destructive?
- The condition assessment of cable circuits that are in service. How can diagnostics be performed during service life?
The examples in Table 3 and Table 4 summarize several aspects and parameters influencing the operational reliability of cable circuits, taking into account manufacturing, transportation, and installation conditions.
Table 3.
Examples of needs of dedicated quality control of newly installed long-length power cables for offshore application.
Table 4.
Examples of operational hazards of long-length power cables for offshore application.
Table 3 indicates that during the entire process, starting from the manufacturing phase until the start of operation, a number of risk elements might occur.
As the occurrence probability is difficult to determine exactly, only verification by means of dedicated and non-destructive quality control can reduce those risks and provide insightful information about the actual system conditions [5,9,15].
The asset management of cable systems is mainly driven to keep capital (CapEx) and operational expenditures (OpEx) at the best possible level. Refs. [5,6,9] confirm that the above asset management parameters are strongly dependent on the actual condition of the infrastructure, including the cable system and possible hazards that might occur during its service life. See Table 4.
The developments in the last two decades of onsite testing methods for power cables [4,6,8,12,13,14,15,16,17,18,23,24] have provided the technology for performing reproducible cable condition assessments based on diagnostic PD detection, as shown in Table 5.
Table 5.
Testing and diagnostic parameters for newly installed and service-aged long-length power cables [13].
Table 6 summarizes recommended testing scenarios based on the authors’ experiences from the worldwide testing of power cables at hundreds of different installations up to 230 kV [5,6,7,8,9]. The cable is accepted for service operation after passing the test when the testing parameters and criteria could be met; see Table 6.
Table 6.
Testing parameters and criteria for newly installed and service-aged long-length power cables with a cable voltage class up to 230 kV [12,13].
5. Onsite Energizing Methods for Long-Length Power Cables
In order to effectively detect all material deficiencies and installation errors, it is necessary to use testing technology combining both the possibility of energizing test objects with large capacitive loads and with sufficient sensitivity (before breakdown occurs) to detect weak spots in the test object in a non-destructive way. The testing methods accepted in the international and national recommendations [12,13,19,25,26,30,31,32] include:
- AC 20 to 300 Hz—Test with a sustained resonant alternating voltage (ACRT)
- Damped AC 20 to 300 Hz—Test with a damped resonant alternating voltage (DAC)
Figure 2 shows the principal differences between the above-mentioned test methods.
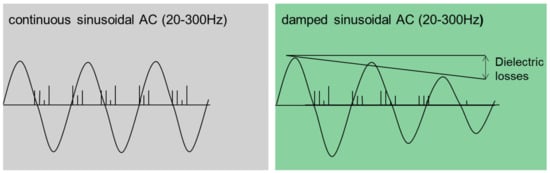
Figure 2.
Visualization of onsite energizing and diagnosis at continuous AC (ACRT) and at damped AC (DAC) voltages.
Based on Refs. [7,8,15,16,17,23,24], the following statements can be made regarding the results of both methods as a consequence of the same type of insulation defects:
- (a)
- There is no difference between PD inception and PD extinction voltages.
- (b)
- There is no significant difference between the detectable PD levels.
- (c)
- The PD pattern information of a single DAC voltage cycle is more informative than that of an AC voltage cycle; this is due to the fact that PD occurrence by decaying DAC voltage is visible.
- (d)
- There is no difference at the maximum voltage level between voltage stress effectiveness in kV/mm.
- (e)
- The test voltage destructiveness of DAC is lower than that caused by AC stresses; this is due to the decaying character of the DAC voltage.
- (f)
- There is no significant difference between the dielectric losses at similar test voltage levels and frequencies.
To illustrate the necessary approach for the sensitive testing and diagnosis of long-length power cables, four basic aspects will be discussed in the following paragraphs.
5.1. Test Characteristics
For the after-laying acceptance test, a test voltage level of 1.4 Uo up to 2.0 Uo is recommended [13,25,26,30], depending on the operational voltage level of the cable. The actual test level should be agreed upon between the purchaser and the manufacturer. The DAC test applies a selected number of excitations, i.e., a minimum of 50 excitations and for ACRT, a test time of 30 to 60 min is recommended [13,25,26,30]. For a maintenance or diagnostic test, in general, the voltage levels are lowered to e.g., 80% of the after-laying acceptance test. The test voltage level and time duration should be defined in agreement between the test service provider and the cable owner.
The goal of an after-laying test is to verify the quality of the accessories and that the installation worked, as well as to show that the cable system can be taken into service operation. Therefore, the effectiveness of the after-laying testing is important. The main goal of an ACRT test is to create a breakdown in a possible defect. This is only effective for significant insulation defects because of the application of a pass/fail destructive criterion during voltage withstand testing [13,25,26,30].
With DAC testing, the effectiveness is higher as it is applicable to all types of possible insulation defects due to PD-monitored voltage withstand testing. The PD detection and localization give information on possible future defects. Although DAC is less destructive than continuous AC, it is possible to create a breakdown with the DAC testing in the presence of very rough insulation defects [7,9,15,16], as with ACRT.
As has already been discussed in this paper, with increasing cable length and consequently increasing cable capacitance, ACRT requires more units to be installed which results in increased size and weight and an increase in the required input power. In comparison, DAC systems are more compact with a very low input power demand. This makes it possible, with a single system, to energize cable lengths of up to e.g., 100 km in length. Moreover, the integrated PD and dissipation factor measurement, applicable for both the after-laying and maintenance testing, provides the possibility of detecting and localizing discharging defects.
5.2. Partial Discharge Detection
For effective partial discharge detection, a standardized PD measurement is recommended. A centralized standardized (IEC 60270 compliance) PD detection at the cable termination(s) is normally performed. In the case of long lengths, the application of dual-side PD detection on both ends of the cable can be performed [13,19,23,24]. In this way, PD localization along the complete line length can be performed, including the terminations, all joint types, and the cable insulation [7,27,28,29].
With ACRT testing, unconventional distributed PD measurements at the cable accessories can be performed that have an accessible sheath connection, e.g., at cross-bonding joints. The voltage source of a resonance test set generates a high level of background noise that influences the sensitivity of the PD measurement. Therefore, high-frequency PD detection is performed locally at terminations and cross-bonding joints only. As a result, this method is not suitable for standardized PD measurements. Moreover, a limited detection distance from the sensor positions is possible and no full detection for the complete cable length can be carried out. Localization based on time domain reflectometry (TDR) is not possible on a complete cable system.
5.3. Cable Condition Assessment
Testing for dedicated quality assurance can be obtained by combining the obtained measurement results, based on the following parameters:
- Breakdown Yes/No
- PD detection in relation to voltage
- PD localization in relation to the cable system length
- Dissipation factor (tan δ) relative to test voltage levels.
The testing and measurement techniques must be suitable to detect the following problems:
- Major installation errors which result in a breakdown
- All installation problems not causing direct breakdowns but that cause PD
- Distributed or localized PD activity.
Referring to the foregoing evaluation, it allows for the conclusion that in contrast to pure voltage withstand testing with ACRT, it is possible to measure those parameters and to detect possible upcoming problems with DAC technology [4,7,9,16].
5.4. Physical Test System Characteristics
As previously discussed, the testing system size and weight are also relevant. With DAC test systems, a small setup footprint (below 15 m2) and low overall system weight (truckload capacity below 1.5 tons) are required. For testing longer lengths, the same system can be applied, keeping the size, weight, and input power demand at the same level. ACRT systems require a much larger footprint (up to 120 m2) and have a heavy weight and fixed equipment installed on truck trailers (1 trailer: 40 ft over 25 tons weight). For testing longer lengths, several trailers and more input power are required. Both technologies have over 20 years of application history in onsite cable testing, which provides a large knowledge base.
6. Comparison of Onsite Energizing Methods for Long Length Power Cables
Referring to Refs. [12,19] different test voltages can be used for the onsite testing of power cables. Considering the above discussion on testing HVAC long-length power cables, a comparison of the two most applicable methods, ACRT and DAC, was made. For this purpose, the eleven most relevant technical parameters have been selected as shown in Table 7.
Table 7.
Example of technical parameters to compare AC resonance test and damped ac test methods regarding long-length power cables.
These parameters, based on practical experience, pertain to the assessment of both after-laying newly installed circuits as well as the service-aged cables.
To quantify the selected technical parameters, typical values from practical applications used for testing a typical 50 km long 220 kV cable were chosen. The comparison shown in Figure 3 confirms that the DAC technology outperforms the ACRT method in the efficient testing and condition assessment of long-length power cable connections.
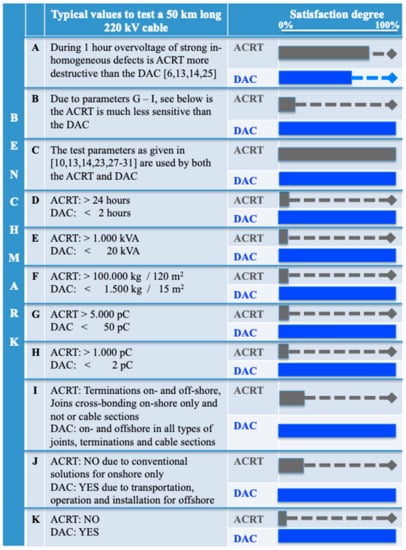
Figure 3.
Example of a comparison of ACRT and DAC testing techniques based on different technical and practical parameters for testing a 50 km long 220 kV cable system.
Moreover, in case of high-ohmic cable breakdowns, DAC testing can be used for less-destructive fault localization due to the possibility of PD localization over the complete cable system length [9,15]. This, in turn, might minimalize the repair effort and costs.
7. Practical Examples
This manuscript presents several examples of post-installation tests of on- and offshore cables that have been performed with damped AC voltages with partial discharge monitoring.
7.1. After-Laying Test of a 110 kV Cable System (30.7 km Long)
A newly installed XLPE insulated cable circuit with a voltage class of 110 kV, with a total circuit length of 30.7 km connecting an onshore wind farm to the power grid, was tested after installation.
The total cable capacitance was 5.9 μF per phase with 37 cable joints installed on each phase. The cable was tested at a maximum voltage level of 2.0× Uo with a withstand test of 50 DAC excitations. Prior to the withstand test, a voltage ramp-up test was performed where the test voltage level was increased in steps from 0.4 Uo up to 2.0 Uo.
The DAC frequency was 28 Hz and the background-noise level during the PD measurement was 25 pC.
The test setup can be seen in Figure 4, with the DAC test system installed at the near end and the additional PD detector installed at the remote end of the cable phase.
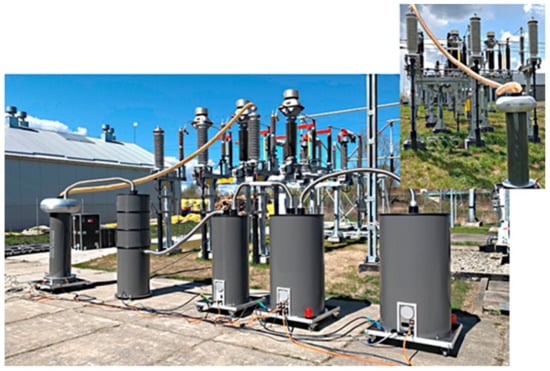
Figure 4.
Test setup with the DAC system connected to the 110 kV cable phase under test at the near end and an additional PD detector at the remote end of the same cable phase.
PD activity was detected during the ramp-up test in cable phase L2; see Figure 5a,b. Starting at a voltage level of 1.7× Uo, a clear PD pattern could be seen; see Figure 5a. After the ramp-up test, the voltage withstand test of 50 DAC excitations was performed, with a duration of 65 min. The analysis resulted in a PD location at cable joint No. 11, located 7520 m from the near end.
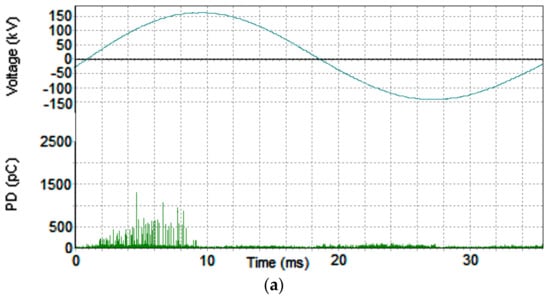
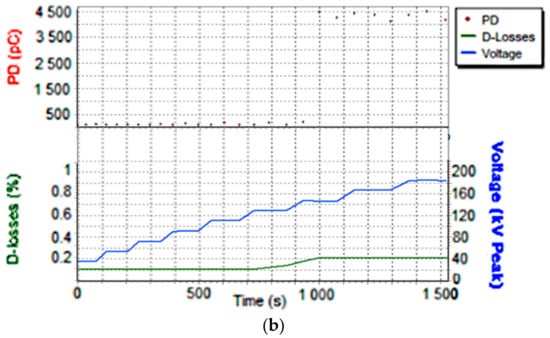
Figure 5.
Test result overview of the PD-monitored ramp-up test (a) Obtained phase-resolved PD pattern at 1.8 Uo, (b) Overview of the ramp-up test from 0.4 Uo to 2.0 Uo prior to the voltage withstand test, duration 25 min.
The PD mapping is a graphical representation of the cable length that shows the concentration of the localized PD pulses along the cable length, see Figure 6.
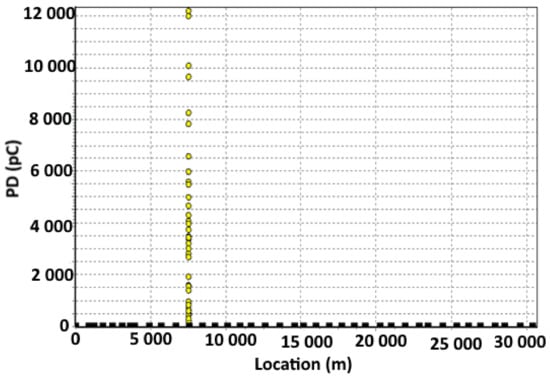
Figure 6.
PD mapping showing the overall cable length versus the PD concentration. The black dots represent the joint locations.
As the PD level was in the range of 100–12.000 pC, it also produced an increase in the dissipation factor tan δ; see Figure 5b. The conclusion was reached that PD could be detected and localized by means of a double-sided measurement.
PD activity was found above the operating voltage in phase L2 at a joint position. The joint at this position was replaced and the test was repeated after the replacement. During the 2nd measurement, the absence of PD activity could be confirmed, and the cable was successfully energized into operation.
7.2. After-Laying Test 132 kV XLPE Cable (60.3 km Long)
A newly installed 132 kV cable circuit connecting an onshore wind farm to the power grid was tested with DAC including a double-sided PD detection. The total length of each cable phase was 60.3 km with a cable capacitance of 13.3 μF per phase. A total of 62 joints per phase (cross-bonding) were installed.
Each phase was tested with DAC with a voltage level of 1.73× Uo and 50 excitations at the maximum voltage level. The DAC frequency was 18.7 Hz. The background-noise level for the PD measurement was 15 pC. The complete setup on both sides of the cable is shown in Figure 7.
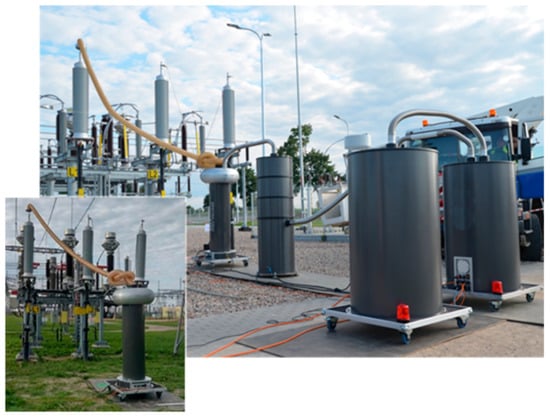
Figure 7.
Test setup with the DAC system connected to the 132 kV cable phase being tested at the near end and an additional PD detector at the far end of the same cable phase.
The test on three phases (executed separately on each phase) resulted in a clear pass as there were no breakdowns and no internal PD was detected in all three phases; see Figure 8.
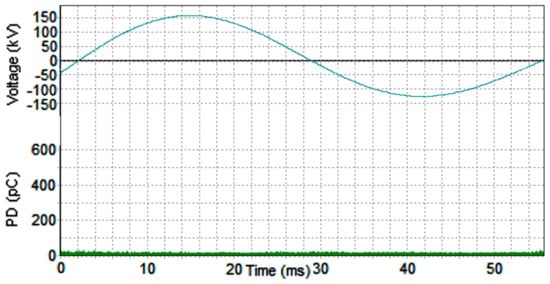
Figure 8.
DAC phase-resolved PD pattern only showing the background-noise level.
In Figure 9, an overview of the voltage withstand test for 50 DAC excitations per phase is shown, indicating there was no breakdown during the test. As a result of this successful after-lying test the cable circuit was successfully taken into service operation.
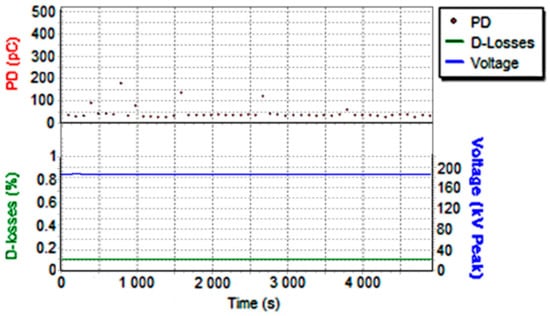
Figure 9.
Test result overview of the PD-monitored voltage withstand test for 50 DAC excitations, with a duration of 1 h 25 min.
7.3. After-Laying Test of an Offshore Inter-Link 66 kV Cable System (10.8 km Long)
In accordance with [13], the after-laying test of a newly installed XLPE off-shore wind farm 66 kV inter-connector cable system between two offshore substations (OSS) was performed by partial-discharge-monitored damped AC (DAC) testing at 2.0 Uo within the recommended frequency testing range (20 Hz–300 Hz) at 79 Hz power; see Figure 10.
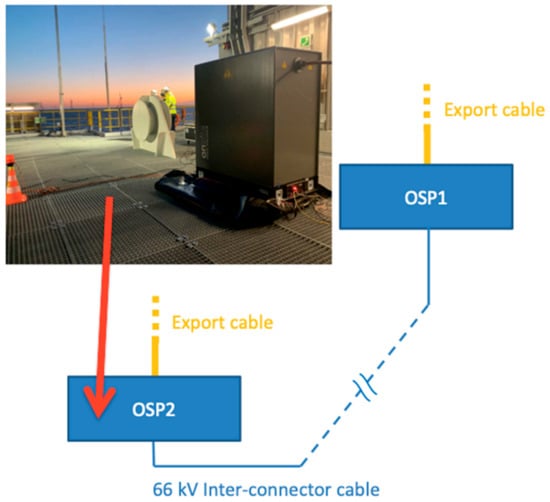
Figure 10.
Onsite testing of a 66 kV 10.8 km long XLPE inter-array connector cable system. The HV system is connected to one of the cable section phases. DAC voltages and PD patterns as observed during DAC-monitored voltage withstand testing.
The length of the cable system was 10.8 km, and the cable capacitance was 3.04 μF. The connection from the array cable to the system was made via a test adapter cable on the T-connector. The PD background-noise level was below 30 pC.
Due to the fact that no PD was detected and there was no breakdown during the voltage withstand test, the 66 kV cable inter-connector was successfully taken into operation.
As a result, the after-laying testing using a damped AC voltage with a DAC HV110os system combined with PD detection proved to be effective for the PD-monitored testing of a long-length, 10.8 km newly installed 66 kV inter-cable system between two offshore substations; see Figure 11.
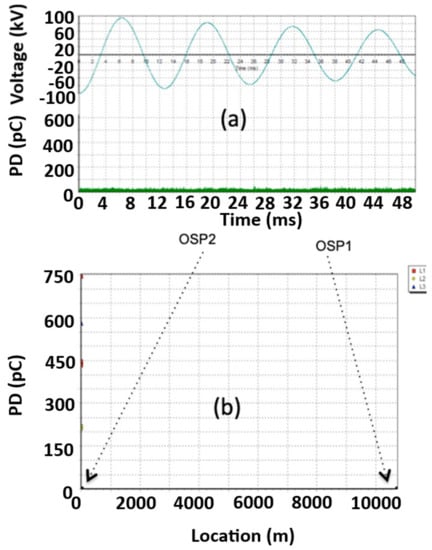
Figure 11.
Onsite testing of a 66 kV 10.8 km long XLPE inter-array connector cable system: (a) PD pattern as observed up to 2.0 Uo test voltage (b) PD mapping showing that there is no PD observed above the background-noise level of 30 pC.
7.4. Overview of Long-Length Cable Circuits That Have Been Recently Tested Using PD-Monitored DAC Voltages
In recent years, DAC voltage in combination with PD measurement has been used for testing HV power cables longer than 10 km in five different countries; see Table 8. In all cases, the after-laying testing was successful and since starting operation, all circuits operate without failure.
Table 8.
The overview of after-laying testing using damped ac test methods of 11 km up to 60 km long HVAC power cables.
Following the survey statistics of PD occurrence and the voltage breakdown at maximum test voltages [13], and having systematic practical experiences of testing different types of long-length power cables, we have observed that up to 5% of newly (onsite) installed accessories show discharging defects and that up to 1% of discharging defects were localized within the cable insulation.
8. Conclusions
From the discussion presented in this paper a number of conclusions can be drawn:
- The present international IEC and IEEE regulations are very general, and therefore, deficiency in providing explicit guidance for the quality control of long-length power cables both on- and offshore.
- Considering offshore wind farms, where long cable circuits are frequently used, it has been shown by several studies that the severity and the frequency of the failures of export and inter-array cables are the highest.
- Specific aspects of long-length on- and offshore cable connections were evaluated and the need for a dedicated onsite testing solution was discussed.
- The criteria required for dedicated quality assurance were proposed, supported by a technical discussion.
- To provide dedicated quality assurance, testing methods suitable for on- and offshore applications were evaluated considering technical and operational factors.
- The main conclusion from this comparison is that, compared to the ACRT method, DAC technology shows much higher applicability for the efficient testing and condition assessment of long-length power cable connections.
- Practical examples illustrated that PD-monitored damped AC voltage testing was successfully applied for the quality control of newly installed on- and offshore long-length HV cable connections. Such tests form a sound basis for condition-based maintenance during service life.
Author Contributions
Conceptualization, E.G., G.J.A. and R.J.; methodology, E.G., G.J.A., J.P. and R.J.; validation, J.P. and R.J.; investigation, E.G., J.P. and R.J.; resources, E.G.; data curation, R.J.; writing—original draft preparation, E.G. and R.J.; writing—review and editing, G.J.A., J.P. and R.J.; visualization, R.J.; supervision, E.G. All authors have read and agreed to the published version of the manuscript.
Funding
This research received no external funding.
Conflicts of Interest
The authors declare no conflict of interest.
References
- International Council on Large Electric Systems. Cigre Technical Brochure 680, Implementation of Long AC HV and EHV Cable Systems; International Council on Large Electric Systems: Paris, France, 2017. [Google Scholar]
- International Council on Large Electric Systems. Cigre Technical Brochure 496, Recommendations for Testing DC Extruded Cable Systems; International Council on Large Electric Systems: Paris, France, 2012. [Google Scholar]
- International Council on Large Electric Systems. Cigre Technical Brochure 610, Offshore Generation Cable Connections; International Council on Large Electric Systems: Paris, France, 2015. [Google Scholar]
- International Council on Large Electric Systems. Cigré Technical Brochure 379, Update of Service Experience of HV Underground and Submarine Cable Systems; International Council on Large Electric Systems: Paris, France, 2009. [Google Scholar]
- Gulski, E.; Jongen, R. Condition-based Maintenance of Transmission Power Cables. IEEE Trans. Power Deliv. 2021, 37, 1588–1597. [Google Scholar] [CrossRef]
- Gulski, E.; Jongen, R.; Quak, B.; Parciak, J.; Rakowska, A. Fifteen Years Damped AC Testing and Diagnosis of Transmission Power Cables. In Proceedings of the 10th International Conference on Insulated Cables, Paris, France, 23–27 June 2019; p. D3-1. [Google Scholar]
- Gulski, E.; Anders, G.; Jongen, R.; Parciak, J.; Siemiński, J.; Piesowicz, E.; Paszkiewicz, S.; Irska, I. Discussion of electrical and thermal aspects of offshore wind farms’ power cables reliability. Renew. Sustain. Energy Rev. 2021, 151, 111580. [Google Scholar]
- Gulski, E.; Jongen, R.; Rakowska, A.; Siodla, K. Offshore Wind Farms On-Site Submarine Cable Testing and Diagnosis with Damped AC. Energies 2019, 12, 3703. [Google Scholar] [CrossRef]
- Gulski, E.; Jongen, R.; Parciak, J.; Sieminski, J. Modern Methods for Quality- and Condition Assessment of High Voltage Cables; VDE VERLAG GMBH: Berlin, Germany, 2020; ISBN 978-3-8007-5353-6. [Google Scholar]
- Buljan, A. Subsea Cables Account for over 50 pct of Total Claims Spend in Offshore Wind—GCube Insurance. Available online: https://www.offshore-energy.biz/subsea-cables-account-for-over-50-pct-of-total-claims-spend-in-offshore-wind-gcube-insurance/?fbclid=IwAR2MXiHivw0elFYAC5YNsZaDEJHJoK1nPwh61BT3Cqx8RNxiH3yDaFox27M (accessed on 1 June 2022).
- Buljan, A. GCube Insurance: Offshore Wind Needs to Mitigate Supply Chain Risks. Available online: https://www.offshore-energy.biz/gcube-insurance-offshore-wind-needs-to-mitigate-supply-chain-risks/ (accessed on 21 February 2022).
- IEEE 400-2012; Guide for Field Testing and Evaluation of the Insulation of Shielded Power Cable Systems Rated 5 kV and Above. IEEE: New York, NY, USA, 2012.
- IEEE 400.4-2015; Guide for Field-Testing of Shielded Power Cable Systems Rated 5 kV and Above with Damped Alternating Current Voltage (DAC). IEEE: New York, NY, USA, 2012.
- Corjanus, R.; van Riet, M.; Staarink, S. Testing High Voltage Cable without Ageing the Cable Itself. In Proceedings of the INMR World Congress (INMR 2022), Berlin, Germany, 16–19 October 2022. [Google Scholar]
- Smit, J.; van Riet, M.; Staarink, B. Non-destructive after Laying Test with PD Localization. In Proceedings of the 10th International Conference on Insulated Cables, JICABLE, Paris, France, 23–27 June 2019; p. D3-4. [Google Scholar]
- Cichecki, P. Testing and Diagnosis of High Voltage and Extra High Voltage Power Cables with Damped AC Voltages; Delft University of Technology: Delft, The Netherlands, 2018; ISBN 978-83-952726-0-8. [Google Scholar]
- Popma, J.; Pellis, J. Diagnostics for High Voltage Cable Systems. In Proceedings of the ERA Conference on HV Plant Life Extension, Linkebeek, Belgium, 23–24 November 2000. [Google Scholar]
- Leufkens, P.P. Cable Testing: State-of-the-Art, Standards & Technological Developments. In Proceedings of the INMR World Congress (INMR 2022), Berlin, Germany, 16–19 October 2022. [Google Scholar]
- International Council on Large Electric Systems. Cigre Technical Brochure 841 after Laying Tests on AC and DC Cable Systems with New Technologies; International Council on Large Electric Systems: Paris, France, 2021. [Google Scholar]
- International Council on Large Electric Systems. Cigre Technical Brochure 815, Update of Service Experience of HV Underground and Submarine Cable Systems; International Council on Large Electric Systems: Paris, France, 2020. [Google Scholar]
- International Council on Large Electric Systems. Cigre Technical Brochure 825, Maintenance of HV Cable Systems; International Council on Large Electric Systems: Paris, France, 2021. [Google Scholar]
- Wu, J.; Mor, A.R.; Smit, J.J. Partial discharges activated by impulses and superimposed voltages in a high voltage cable model. Int. J. Electr. Power Energy Syst. 2020, 120, 106027. [Google Scholar] [CrossRef]
- Wild, M.; Tenbohlen, S.; Gulski, E.; Jongen, R. Basic aspects of partial discharge on-site testing of long length transmission power cables. IEEE Trans. Dielectr. Electr. Insul. 2017, 24, 1077–1087. [Google Scholar] [CrossRef]
- Wild, M. Two-Sided Partial Discharge Measurement to Assess the Condition of Long Power Cables; Sierke Verlag: Göttingen, Germany, 2018; ISBN 978-3-96548-009-4. (In German) [Google Scholar]
- IEC 60840-2011; Power Cables with Extruded Insulation and the Accessories for Rated Voltages above 30 kV up to 150 kV Test Methods and Requirements. IEC: Geneva, Switzerland, 2011.
- IEC 62067-2011; Power Cables with Extruded Insulation and the Accessories for Rated Voltages above 150 kV. IEC: Geneva, Switzerland, 2011.
- IEC 60270-2000; Partial Discharges Measurements. IEC: Geneva, Switzerland, 2000.
- IEC 60885-3-2015; Test Methods for Partial Discharges Measurements on Lengths of Extruded Power Cable. IEC: Geneva, Switzerland, 2015.
- IEEE 400.3-2006; Guide for PD Testing of Shielded Power Cable Systems in a Field Environment. IEEE: New York, NY, USA, 2006.
- IEC 63026-2019; Submarine Power Cables with Extruded Insulation and Their Accessories for Rated Voltages from 6 kV (Um = 7,2 kV) up to 60 kV (Um = 72,5 kV)—Test methods and requirements. IEC: Geneva, Switzerland, 2019.
- ECP 11-0006; Engineering Commissioning Procedure, HV insulation testing. UK Power Networks: London, UK, 2018.
- PSE; Polish TSO. Power Cable Lines 220 kV and 400 kV; PSE; Polish TSO: Warsaw, Poland, 2020. [Google Scholar]
Publisher’s Note: MDPI stays neutral with regard to jurisdictional claims in published maps and institutional affiliations. |
© 2022 by the authors. Licensee MDPI, Basel, Switzerland. This article is an open access article distributed under the terms and conditions of the Creative Commons Attribution (CC BY) license (https://creativecommons.org/licenses/by/4.0/).