
A Simple and Accurate Energy-Detector-Based Transient Waveform Detection for Smart Grids: Real-World Field Data Performance †


Abstract
:1. Introduction
1.1. Related Work
1.2. Contributions
1.3. Organization
2. Signal Model
2.1. Energy Detector
2.2. Threshold Selection Mechanism
Optimal Threshold with Maximum Likelihood Estimation
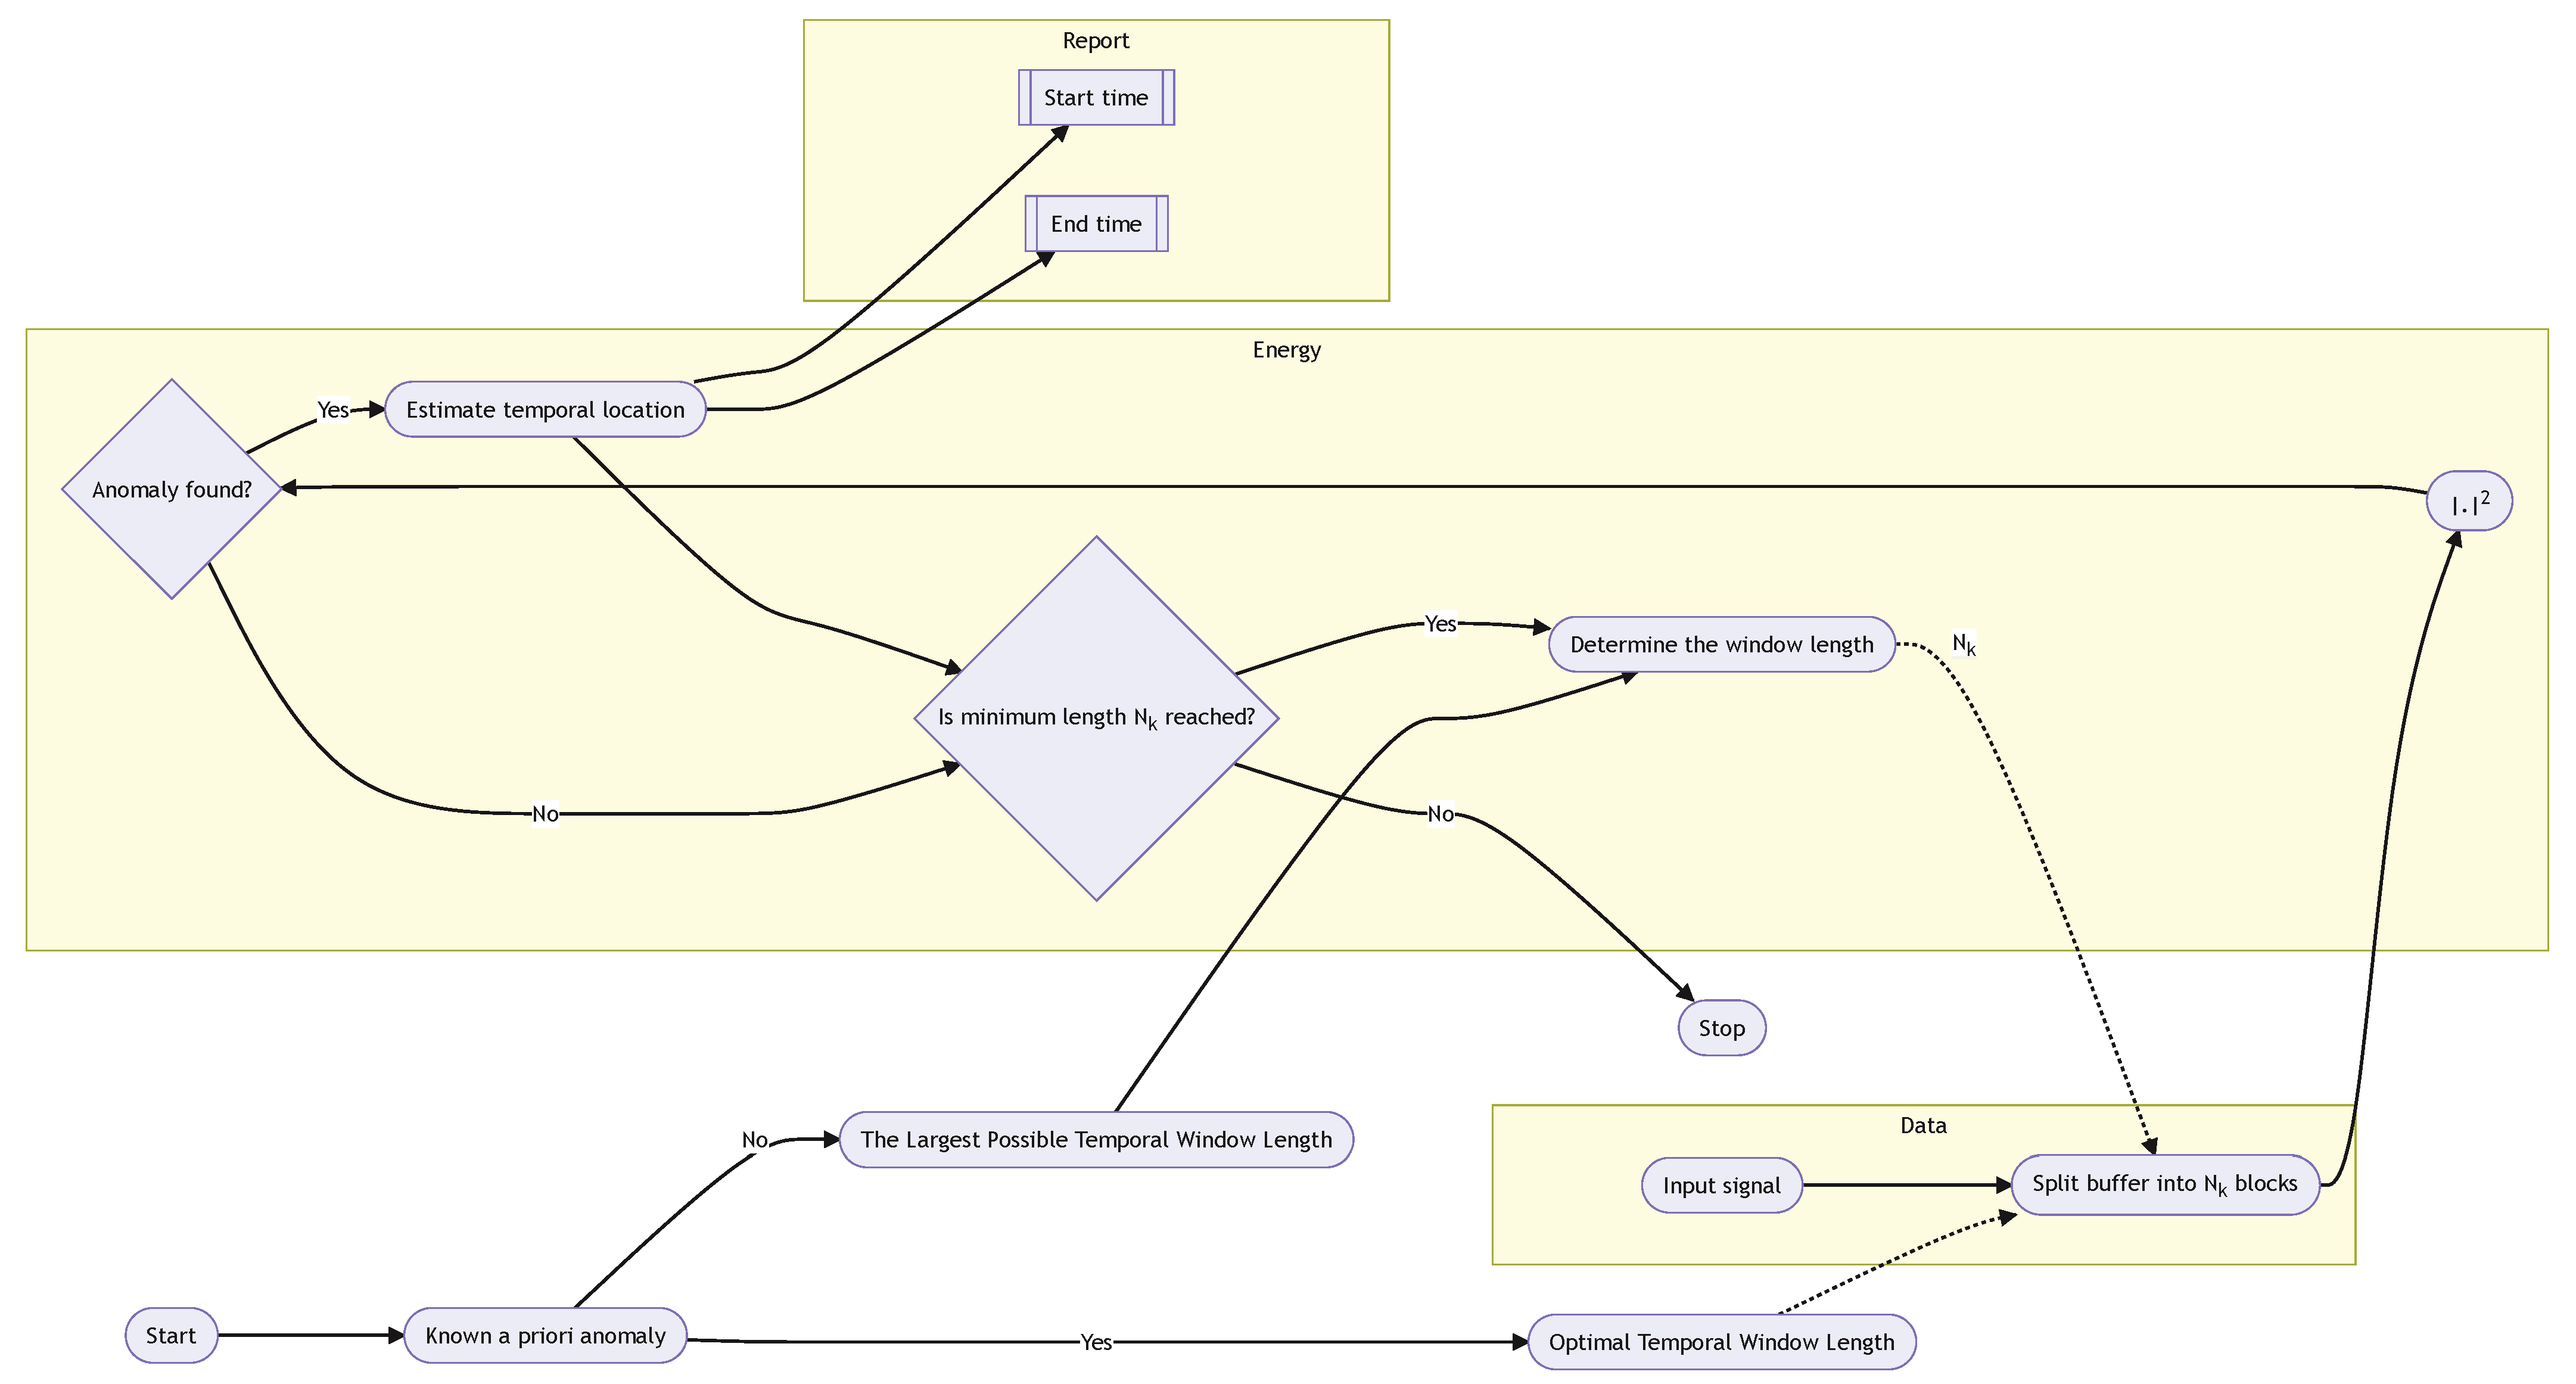
3. Proposed Energy Detector Approach
4. Case Studies and Results
5. Runtime Analysis
6. Concluding Remarks and Future Directions
Author Contributions
Funding
Institutional Review Board Statement
Informed Consent Statement
Data Availability Statement
Conflicts of Interest
Abbreviations
| ADC | analog-to-digital converter |
| DWT | discrete wavelet transform |
| GSL | Grid Signature Library |
| IoT | Internet of Things |
| MLE | maximum likelihood estimation |
| PAPR | peak-to-average power ratio |
| probability density function | |
| RMS | root mean square |
| ROC | receiver operating characteristic |
| SNR | signal-to-noise ratio |
| SINR | signal-to-interference-plus-noise ratio |
| STFT | short-time Fourier transform |
References
- Alonso, M.; Amaris, H.; Alcala, D.; Florez R., D.M. Smart Sensors for Smart Grid Reliability. Sensors 2020, 20, 2187. [Google Scholar] [CrossRef] [PubMed]
- Minh, Q.N.; Nguyen, V.H.; Quy, V.K.; Ngoc, L.A.; Chehri, A.; Jeon, G. Edge Computing for IoT-Enabled Smart Grid: The Future of Energy. Energies 2022, 15, 6140. [Google Scholar] [CrossRef]
- Rivas, A.E.L.; Abrao, T. Faults in Smart Grid Systems: Monitoring, Detection and Classification. Elsevier Electric Power Syst. Res. 2020, 189, 1–26. [Google Scholar]
- Mahmoud, M.A.; Md Nasir, N.R.; Gurunathan, M.; Raj, P.; Mostafa, S.A. The Current State of the Art in Research on Predictive Maintenance in Smart Grid Distribution Network: Fault’s Types, Causes, and Prediction Methods—A Systematic Review. Energies 2021, 14, 5078. [Google Scholar] [CrossRef]
- California Department of Forestry and Fire Protection (CAL FIRE). 2020 Wildfire Activity Statistics. Available online: https://www.fire.ca.gov/media/0fdfj2h1/2020_redbook_final.pdf (accessed on 18 March 2022).
- Farooq, U.; Bass, R.B. Frequency Event Detection and Mitigation in Power Systems: A Systematic Literature Review. IEEE Access 2022, 10, 61494–61519. [Google Scholar] [CrossRef]
- Senaratne, D.; Kim, J.; Cotilla-Sanchez, E. Spatio-Temporal Frequency Domain Analysis of PMU Data for Unsupervised Event Detection. In Proceedings of the IEEE ISGT Power & Energy Society Innovative Smart Grid Technologies Conference, Washington, DC, USA, 16–18 February 2021; pp. 1–5. [Google Scholar]
- Ma, D.; Hu, X.; Zhang, H.; Sun, Q.; Xie, X. A Hierarchical Event Detection Method Based on Spectral Theory of Multidimensional Matrix for Power System. IEEE Trans. Syst. Man. Cybern. Syst. 2021, 51, 2173–2186. [Google Scholar] [CrossRef]
- Niu, H.; Omitaomu, O.A.; Cao, Q.C. Machine Committee Framework for Power Grid Disturbances Analysis Using Synchrophasors Data. Smart Cities 2021, 4, 1–16. [Google Scholar] [CrossRef]
- Khoa, N.M.; Dai, L.V. Detection and Classification of Power Quality Disturbances in Power System Using Modified-Combination between the Stockwell Transform and Decision Tree Methods. Energies 2020, 13, 3623. [Google Scholar] [CrossRef]
- Follum, J.; Holzer, J.; Etingov, P. A Statistics–based Threshold for the RMS–energy Oscillation Detector. Int. J. Electr. Power Energy Syst. 2021, 128, 106685. [Google Scholar] [CrossRef]
- Zhan, L.; Xiao, B.; Li, F.; Yin, H.; Yao, W.; Li, Z.; Liu, Y. Fault—Tolerant Grid Frequency Measurement Algorithm During Transients. IET Energy Syst. Integr. 2020, 2, 173–178. [Google Scholar] [CrossRef]
- Sun, H.; Li, F.; Sticht, C.; Mukherjee, S. Circular Trajectory Approach for Online Sinusoidal Signal Distortion Monitoring and Visualization. IEEE Trans. Smart Grid 2022, 4, 3315–3318. [Google Scholar] [CrossRef]
- Vasile, C.; Ioana, C. On the Multi-modal Sensing of Electrical Arcs. In Proceedings of the IEEE SAS Sensors Applications Symposium, Glassboro, NJ, USA, 13–15 March 2017; pp. 1–5. [Google Scholar]
- Sousa, M. Limitations of Crosscorrelation Radiometer Performance. In Proceedings of the IEEE MILCOM Military Communications Conference, San Diego, CA, USA, 11–14 October 1992; pp. 816–821. [Google Scholar]
- Urkowitz, H. Energy Detection of Unknown Deterministic Signals. Proc. IEEE 1967, 55, 523–531. [Google Scholar] [CrossRef]
- Digham, F.F.; Alouini, M.S.; Simon, M.K. On the Energy Detection of Unknown Signals Over Fading Channels. IEEE Trans. Commun. 2007, 5, 3575–3579. [Google Scholar] [CrossRef]
- Transmission & Distribution Committee Power Quality Subcommittee Working Group on Power Quality Data Analytics. Electric Signatures of Power Equipment Failures: IEEE PES–TR73. Available online: https://resourcecenter.ieee-pes.org/publications/technical-reports/PES_TP_TR73_TD_122019.html (accessed on 18 April 2022).
- Oak Ridge National Laboratory and Lawrence Livermore National Laboratory. Grid Signature Library. Available online: https://gsl.ornl.gov/ (accessed on 8 August 2022).
- DOE/EPRI National Database Repository of Power System Events. Available online: https://pqmon.epri.com/see_all.html (accessed on 19 October 2022).


| Publications | Complexity | A Priori Information | Use of Transform Domain | Implementation Difficulty |
|---|---|---|---|---|
| [6] | High | Yes | Yes | High |
| [7] | Medium | Yes | Yes | Medium |
| [8] | High | Yes | Yes | High |
| [9] | High | No | Yes | High |
| [10] | High | No | Yes | High |
| [11] | Medium | Yes | Yes | Medium |
| [12] | Medium | No | Yes | Medium |
| [13] | Medium | No | No | Medium |
| [14] | Medium | No | Yes | Medium |
| [15] | Medium | No | No | Medium |
| The proposed method | Medium | No | No | Low |
| Sig ID | # Total Sample per Waveform | Duration of Waveform (in Sec.) | Time per Sample (in Sec.) | Reference Start Sample | Estimated Start Sample | Reference End Sample | Estimated End Sample | # Sample Difference for Start | # Sample Difference for End | Time Difference for Start (in Sec.) | Time Difference for End (in Sec.) |
|---|---|---|---|---|---|---|---|---|---|---|---|
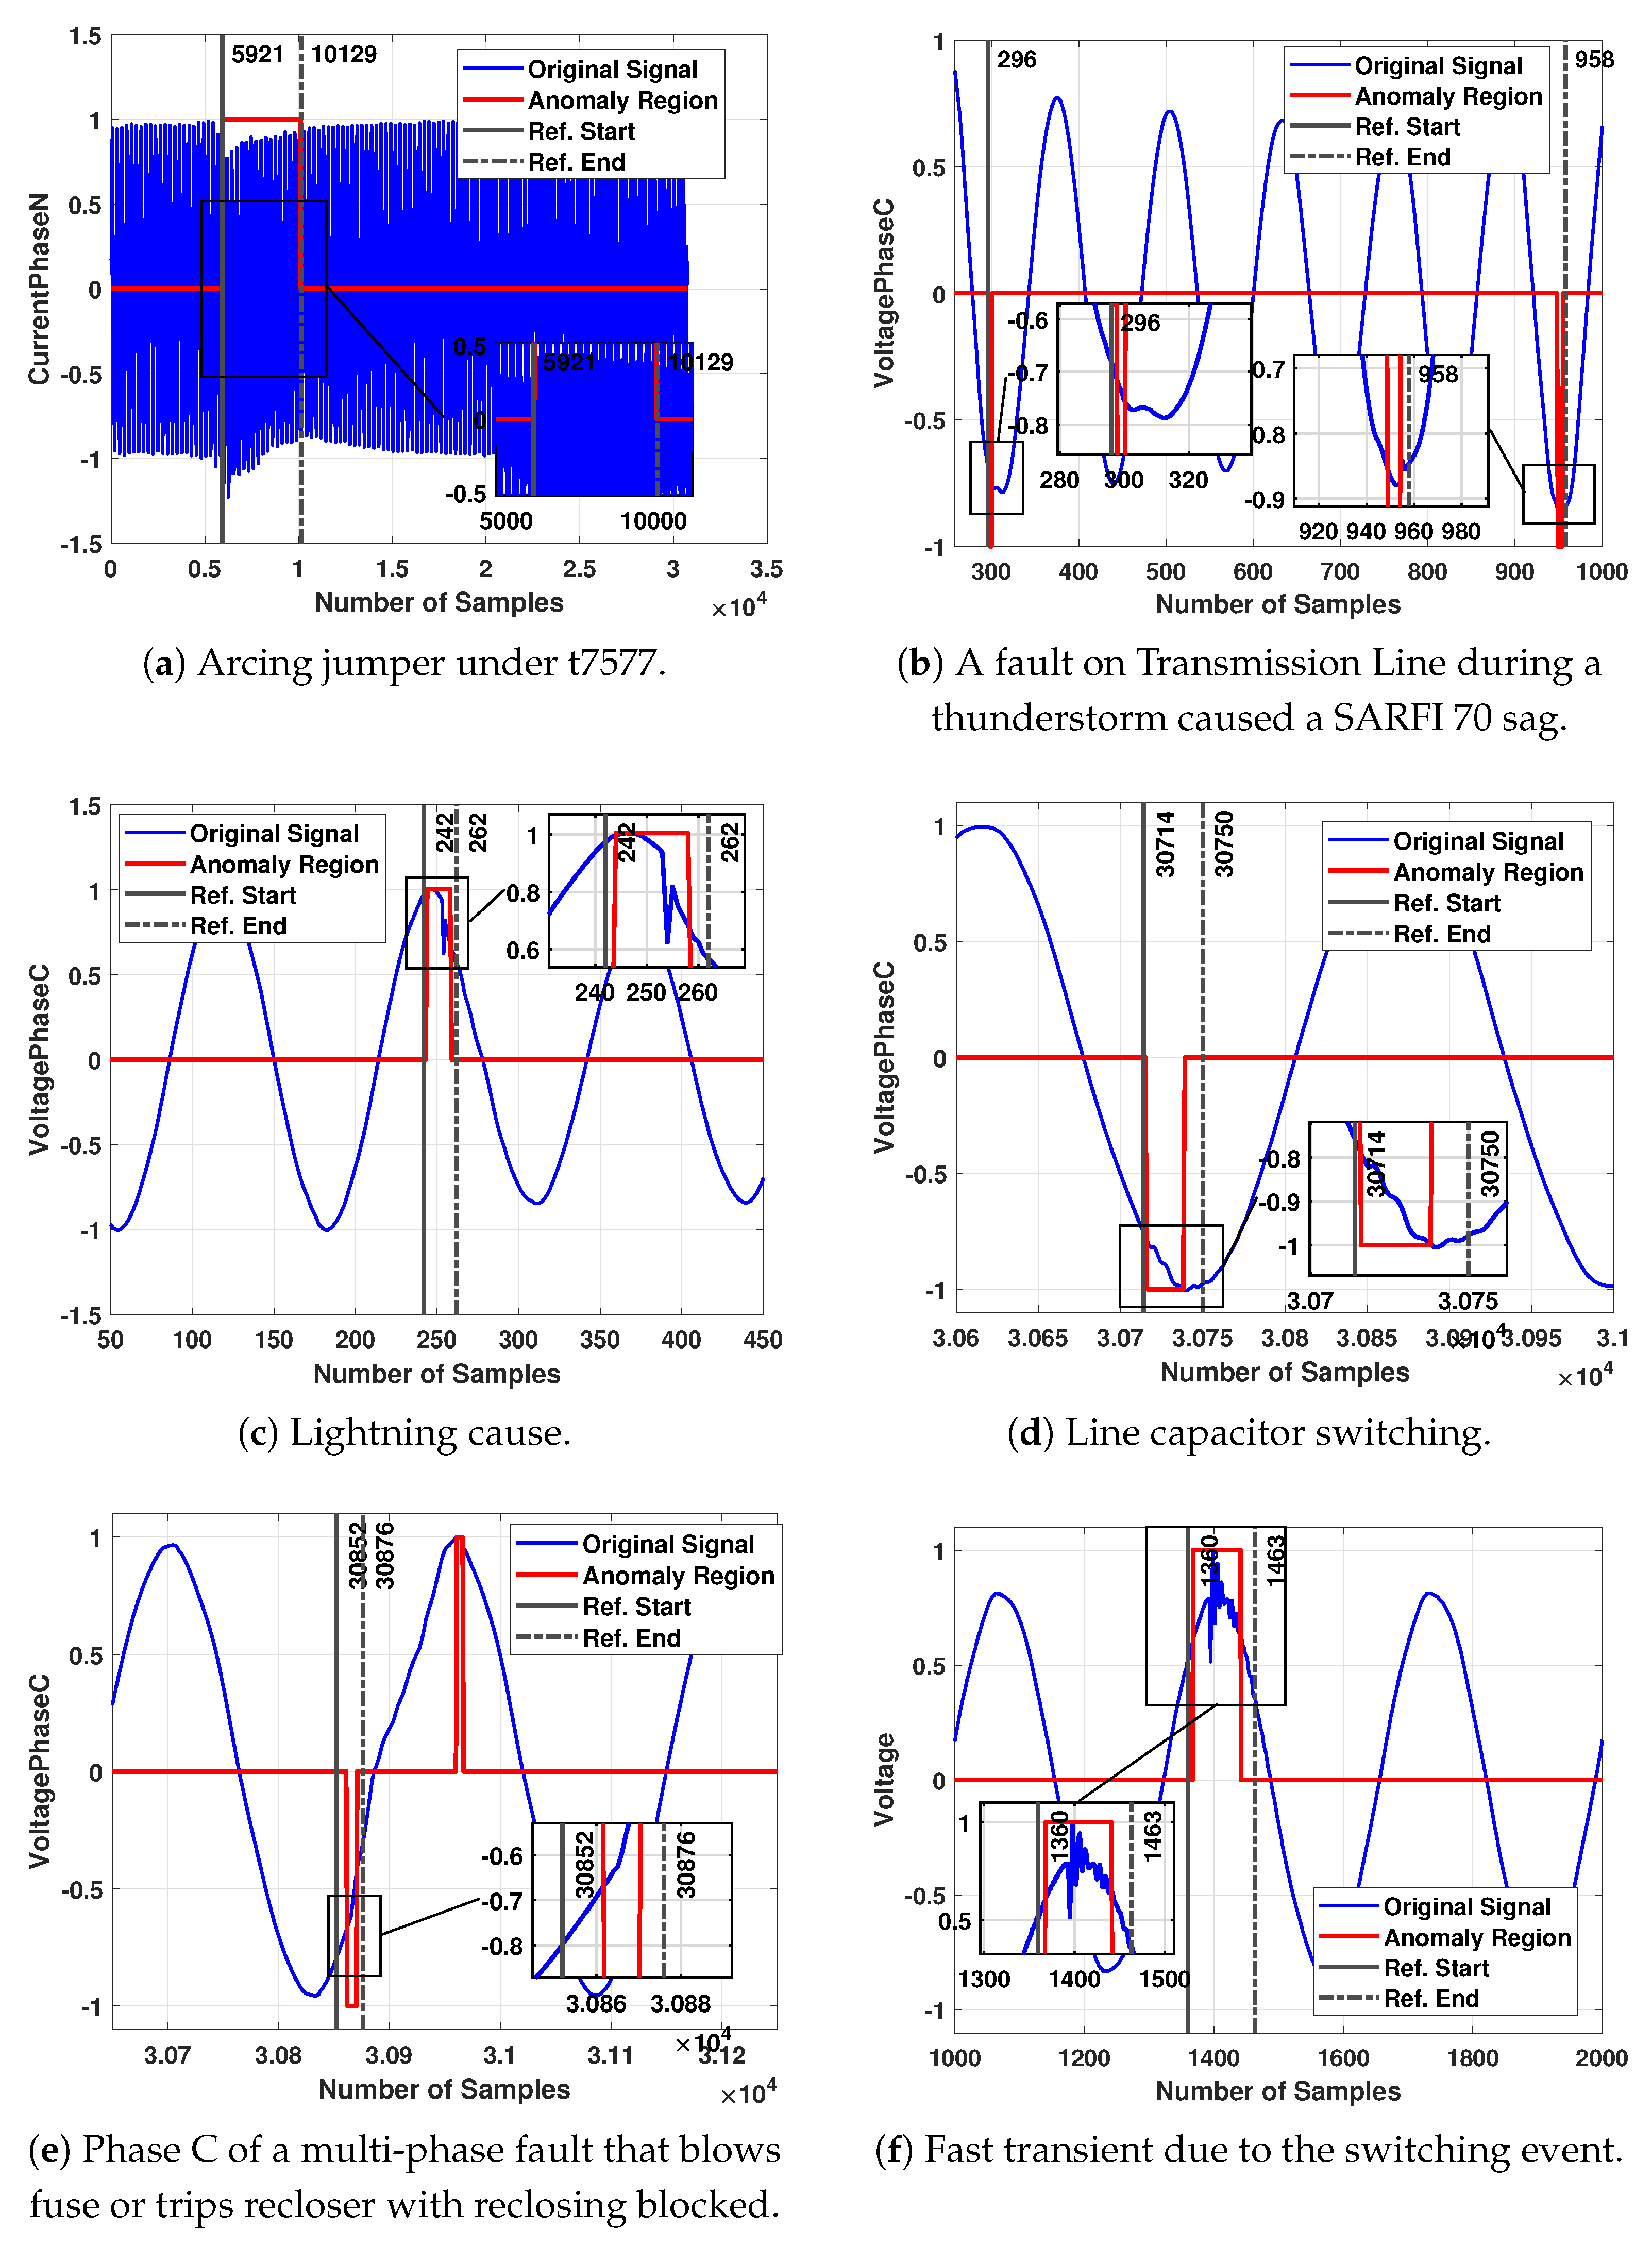
| Arcing Jumper under t7577 | 30,721 | 1.9968 | 6.49979E-05 | 5921 | 5957 | 10,129 | 10,100 | 36 | −29 | 0.002339924 | −0.001884939 |
| A fault on Transmission Line during a thunderstorm caused a SARFI 70 sag | 1280 | 0.16658 | 0.000130141 | 296 | 298 | 958 | 955 | 2 | −3 | 0.000260281 | −0.000390422 |
| Lightning cause | 1152 | 0.149928 | 0.000130146 | 242 | 244 | 262 | 259 | 2 | −3 | 0.000260292 | −0.000390438 |
| Line capacitor switching | 168,960 | 11 | 6.51042E-05 | 30,714 | 30,715 | 30,750 | 30,738 | 1 | −12 | 6.51042E-05 | −0.00078125 |
| Phase C of a multi-phase fault that blows fuse or trips recloser with reclosing blocked | 199,680 | 13 | 6.51042E-05 | 30,852 | 30,862 | 30,876 | 30,871 | 10 | −5 | 0.000651042 | −0.000325521 |
| Fast transient due to the switching event | 3397 | 0.17 | 5.00442E-05 | 1360 | 1367 | 1463 | 1442 | 7 | −21 | 0.000350309 | −0.001050927 |
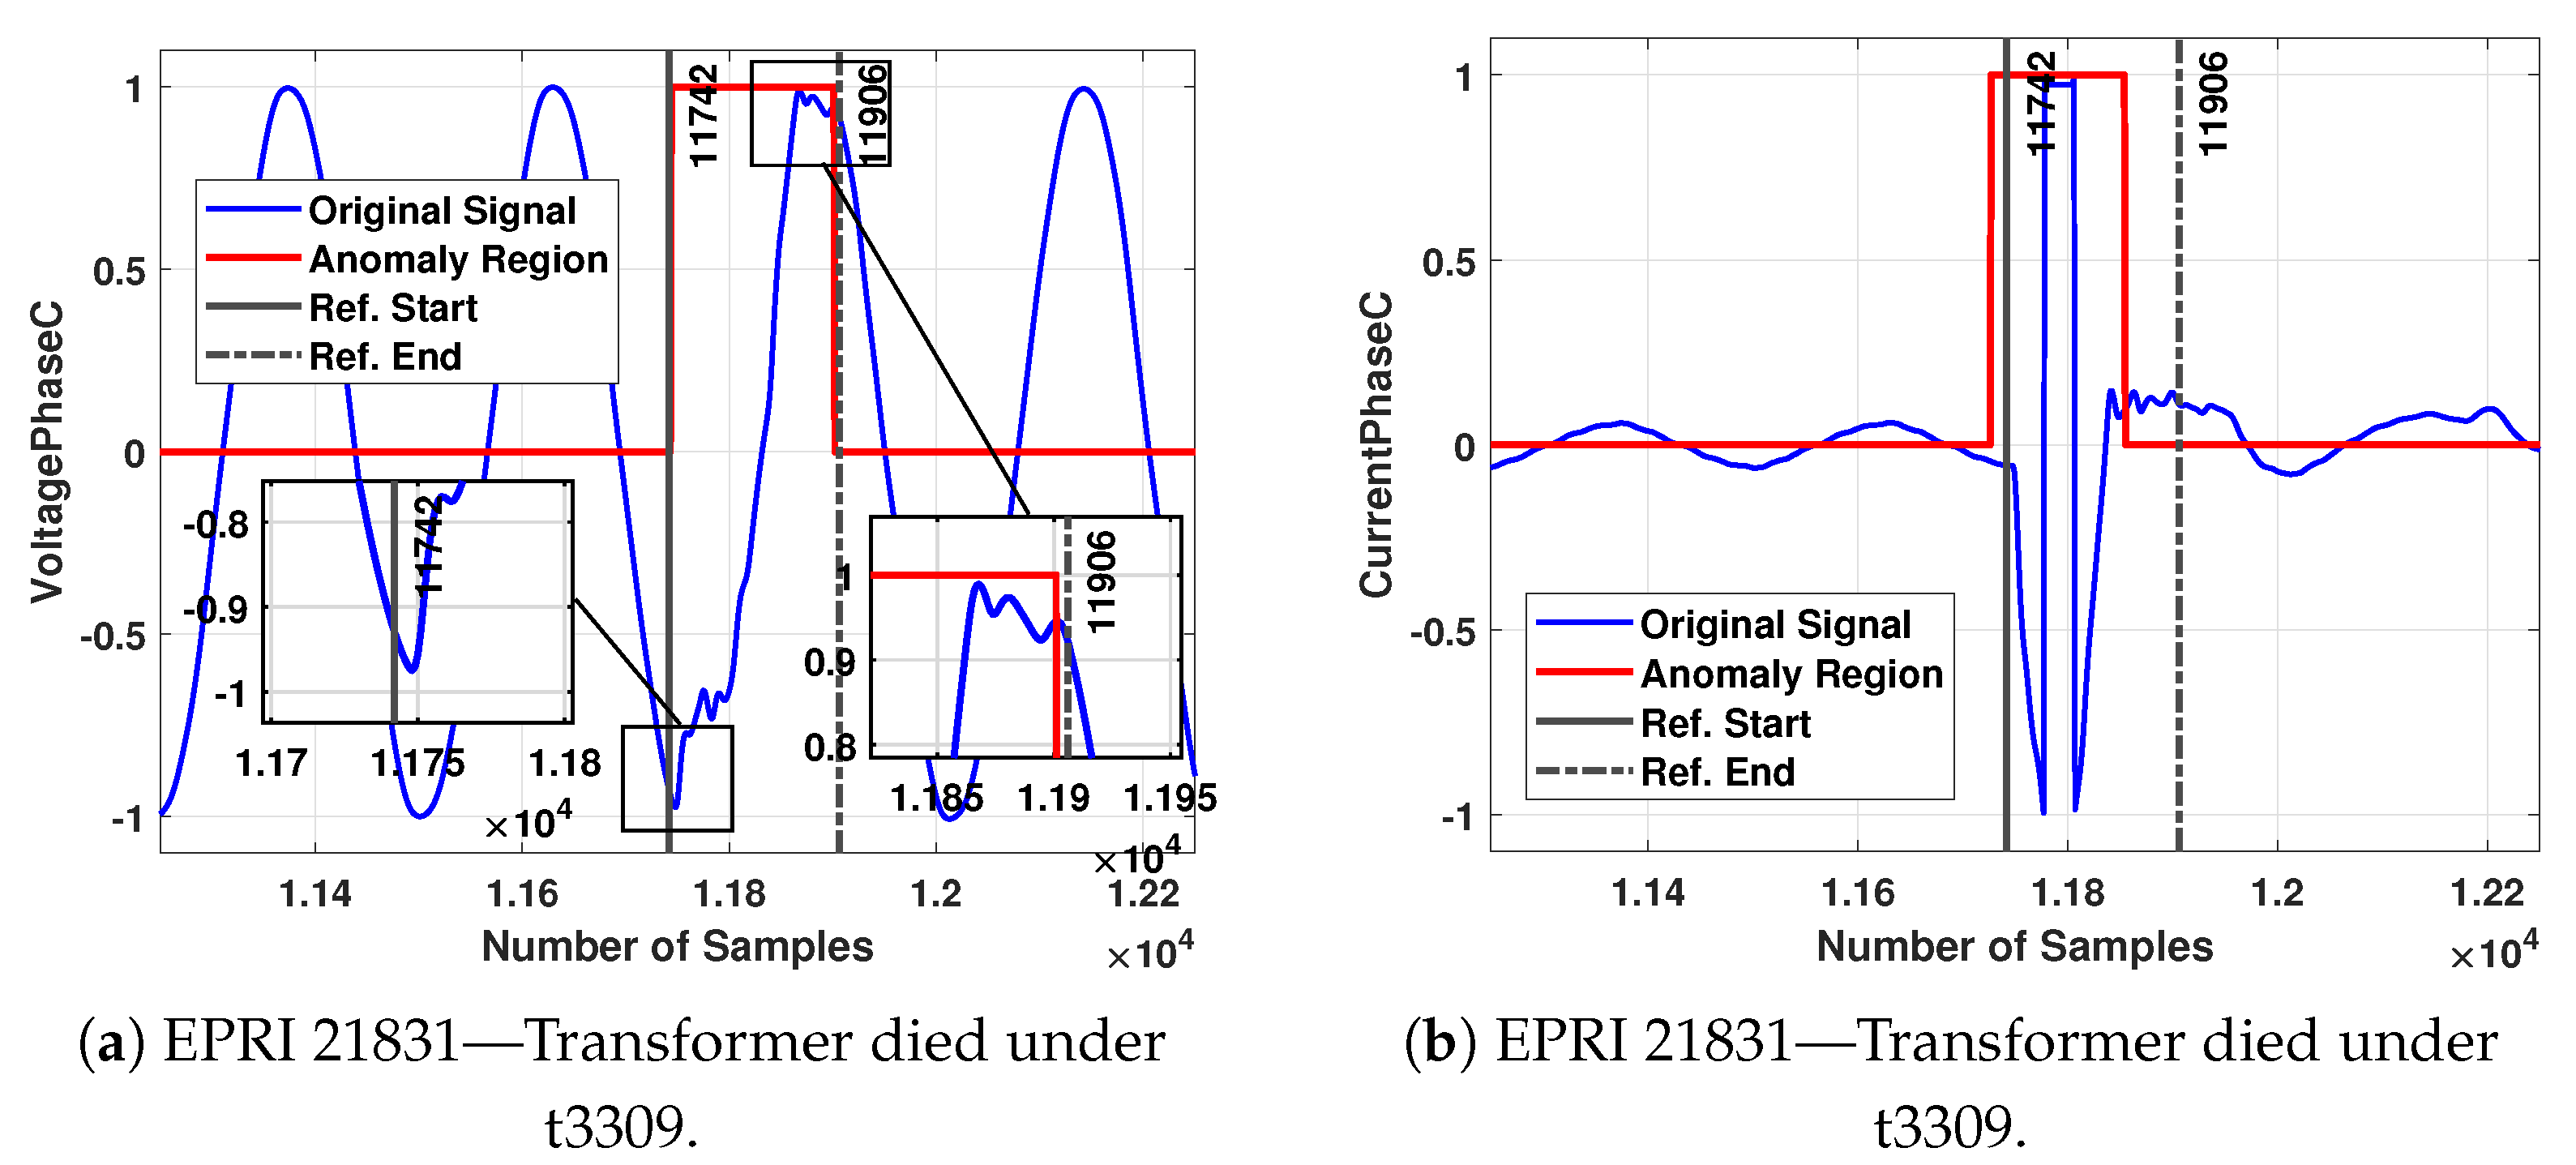
| EPRI 21831 Transformer died under t3309 (VoltagePhaseC) | 30,721 | 1.9968 | 6.49979E-05 | 11,742 | 11,742 | 11,906 | 11,901 | 0 | −5 | 0 | −0.000324989 |
| EPRI 21831 Transformer died under t3309 (CurrentPhaseC) | 30,721 | 1.9968 | 6.49979E-05 | 11,742 | 11,726 | 11,906 | 11,854 | −16 | −52 | −0.001039966 | −0.00337989 |
Publisher’s Note: MDPI stays neutral with regard to jurisdictional claims in published maps and institutional affiliations. |
© 2022 by the authors. Licensee MDPI, Basel, Switzerland. This article is an open access article distributed under the terms and conditions of the Creative Commons Attribution (CC BY) license (https://creativecommons.org/licenses/by/4.0/).
Share and Cite
Ekti, A.R.; Wilson, A.; Olatt, J.; Holliman, J., II; Yarkan, S.; Fuhr, P. A Simple and Accurate Energy-Detector-Based Transient Waveform Detection for Smart Grids: Real-World Field Data Performance. Energies 2022, 15, 8367. https://doi.org/10.3390/en15228367
Ekti AR, Wilson A, Olatt J, Holliman J II, Yarkan S, Fuhr P. A Simple and Accurate Energy-Detector-Based Transient Waveform Detection for Smart Grids: Real-World Field Data Performance. Energies. 2022; 15(22):8367. https://doi.org/10.3390/en15228367
Chicago/Turabian StyleEkti, Ali Riza, Aaron Wilson, Joseph Olatt, John Holliman, II, Serhan Yarkan, and Peter Fuhr. 2022. "A Simple and Accurate Energy-Detector-Based Transient Waveform Detection for Smart Grids: Real-World Field Data Performance" Energies 15, no. 22: 8367. https://doi.org/10.3390/en15228367
APA StyleEkti, A. R., Wilson, A., Olatt, J., Holliman, J., II, Yarkan, S., & Fuhr, P. (2022). A Simple and Accurate Energy-Detector-Based Transient Waveform Detection for Smart Grids: Real-World Field Data Performance. Energies, 15(22), 8367. https://doi.org/10.3390/en15228367