Article

The Control of Shale Composition on the Pore Structure Characteristics of Lacustrine Shales: A Case Study of the Chang 7 Member of the Triassic Yanchang Formation, Ordos Basin, North China

1
State Key Laboratory of Shale Oil and Gas Enrichment Mechanisms and Effective Development, Beijing 100083, China
2
Key Laboratory of Tectonics and Petroleum Resources of Ministry of Education, China University of Geosciences, Wuhan 430074, China
3
School of Earth Resources, China University of Geosciences, Wuhan 430074, China
4
College of Resources and Environment, Yangtze University, Wuhan 430100, China
5
Research Institute Company Limited, CNOOC, Beijing 100028, China
*
Author to whom correspondence should be addressed.
Energies 2022, 15(22), 8353; https://doi.org/10.3390/en15228353
Submission received: 11 October 2022 / Revised: 3 November 2022 / Accepted: 7 November 2022 / Published: 9 November 2022

Abstract

:
The pore structure characteristics of shales are controlled by their mineral and organic matter compositions. However, the contributions of different components to the pore structure characteristics of lacustrine shales remain poorly understood. In this study, fifteen Chang 7 Member shales of the Yanchang Formation, Ordos Basin, were investigated through total organic carbon (TOC), X-ray diffraction (XRD), scanning electron microscopy (SEM), and low-pressure N2 and CO2 adsorption analyses to study the control of shale composition on the pore structure characteristics of lacustrine shales. The results show that the average TOC content of the Chang 7 Member shales is 9.63 wt.%. XRD analysis shows that minerals in the Chang 7 Member shales consist of quartz, feldspars, clay minerals, and pyrite. The clay minerals were dominated by illite, chlorite, and interstratified illite/smectite. The mesopore characteristics of the Chang 7 Member shales and micropore characteristics of organic-lean shales are mainly controlled by clay minerals, whereas the micropore characteristics of organic-rich samples are controlled by both clay minerals and organic matter. SEM observations show that the phyllosilicate framework pores are the main pore type in the Chang 7 Member shales. The results of this study provide important insights into compositional control on the pore structure characteristics of lacustrine shales.

1. Introduction

The exploration and development of shale oil and gas changed the energy structure worldwide [1,2]. Successful extraction of oil and gas from shale formations depends on the reservoir properties (porosity, permeability, brittleness, etc.) of the shales, which are controlled by shale composition [3,4,5,6]. Studying the control of shale composition on the shale reservoir properties is critically important for shale oil and gas exploration and development.
Shales are composed of organic (kerogen) and inorganic components (minerals) [1,7,8,9]. Organic matter (OM) can not only generate hydrocarbons [10,11], but also provide storage space for them [12,13,14,15,16,17,18,19,20,21,22,23,24]. OM can adsorb large amounts of oil and gas because of its microporous nature, and its adsorption capacity has been reported to increase with increasing thermal maturity [22]. In comparison, most minerals have a relatively low specific surface area (SSA) and pore volume [3,5,25]. The contributions of OM and minerals to the SSA and pore volume of bulk shales depend on the OM content, thermal maturity, and mineralogical compositions [5,22].
Black shales are highly heterogeneous in terms of organic and inorganic compositions. Heterogeneity in shale composition causes uncertainties in assessing the reservoir properties of shales. The purpose of this study is to study the compositional control on the pore structure characteristics of lacustrine shales using the Chang 7 Member of the Triassic Yanchang Formation, Ordos Basin, as an example. The specific objectives are to (1) investigate the pore structure characteristics of the Chang 7 Member of the Yanchang Formation; and (2) reveal the control of shale composition on the pore structure characteristics of lacustrine shales.

2. Geological Setting

The Ordos Basin is one of the largest petroliferous basins in China, covering an area of 2.4 × 10⁵ km2 [26]. It is bounded by the Yin Mountains to the north, Lvliang Mountains to the east, Qinling Orogen to the south, and Liupan and Helan Mountains to the west [27]. During the Middle and Late Triassic, a large inland freshwater lake basin formed as a result of the Indosinian orogeny [27,28].
The Middle to Late Triassic Yanchang Formation was deposited in varying environments, including fluvial, deltaic, and lacustrine environments. The Yanchang Formation can be subdivided into 10 members, namely, from the Chang 10 to Chang 1 Member in ascending order [29,30,31]. The Chang 7 Member was deposited in semi-deep and deep lake environments and may represent maximum transgression. The Chang 7 Member can be further subdivided into three sub-members, namely, Chang 7-3, Chang 7-2, and Chang 7-1, from bottom to top. Total organic carbon (TOC) content in the black shales of the Chang 7 Member can reach as high as over 20 wt.% [31,32].

3. Samples and Analytical Methods

3.1. Samples

A total of fifteen samples from two outcrop sections (Figure 1) [33] were collected to study the shale composition and pore structure characteristics of black shales of the Chang 7 Member of the Triassic Yanchang Formation, Ordos Basin. The Danzhou section (DZ section) is located in Yichuan County, Yan’an, Shaanxi, and the Kuquan section (KQ section) is located in Yijun County, Tongchuan, Shaanxi. Shale samples of different TOC contents were selected to analyze the impact of OM content on shale pore structure characteristics.

3.2. Analytical Methods

3.2.1. Vitrinite Reflectance

Shale samples were crushed to rock chips to pass through a 20-mesh sieve. The chips were made into whole-rock pellets following the standard coal petrography procedures [34]. The vitrinite reflectance (Ro) of the studied shale samples was measured using a Zeiss Photoscope III reflected-light microscope linked to a TIDAS PMT IV photometric system.

3.2.2. TOC Content

TOC content analysis was conducted using an ELEMENTRAC CS-i elemental analyzer. Powdered samples were pretreated with 10 wt.% HCl to remove the carbonate minerals. Solid residues were analyzed with an elemental analyzer.

3.2.3. X-ray Powder Diffraction

X-ray diffraction patterns were acquired with a Bruker D8 A25 Advance X-ray diffractometer with CuKα radiation (40 kV and 40 mA) and a position-sensitive LynxEyeXE detector. Powdered samples were scanned from 5° to 90° 2θ with a step size of 0.01°. Quantitative mineralogical analysis of the shale samples was performed using Siroquant™ V5.0, a commercial interpretation software developed by Taylor [35], based on the refinement principles of Rietveld [36].

3.2.4. SEM Imaging

A field-emission scanning electron microscope (SEM; FEI Quanta 400 FEG) was used to examine the mineralogical composition and pore types of the studied shales. Shale samples were first cut into small blocks (~1 cm wide and 1–2 mm thick) and then mechanically polished using successively finer grits (as fine as 1 μm). The mechanically polished samples were argon ion milled with a Gatan 600 DuoMill. During SEM imaging, the SEM was operated in low vacuum mode. The accelerating voltage is 15 kV, and the working distance is about 10 mm. More details of the SEM imaging and ion milling can be found in our previous research [14,15,19,37].

3.2.5. Low-Pressure N2 and CO2 Adsorption

Low-temperature N2 analysis of shale samples was performed using a Micromeritics ASAP-2460 porosimeter and surface area analyzer. Adsorption isotherms were acquired at liquid nitrogen temperature (77.35 K at 101.3 kPa). The relative pressure (p/p0; p0 is the saturation vapor pressure of the adsorbed gas) ranges from 0 to 0.99. Brunauer–Emmett–Teller (BET) theory was used to calculate the SSA of the samples [38]. Barrett–Joyner–Halenda (BJH) theory was used to obtain the mesopore pore volume, mesopore size, and mesopore size distribution of the samples [39,40]. Pore size classification is based on the IUPAC scheme; i.e., micropores (pore diameter < 2 nm), mesopores (2–50 nm diameter), and macropores (pore diameter > 50 nm) [41].
Low-pressure CO2 adsorption analysis of shale samples was performed using a Micromeritics ASAP-2020 porosimeter and surface area analyzer. Adsorption isotherms were acquired at 0 °C (273.15 K), and the relative pressure (p/p0) ranged from 0 to 0.03. The micropore SSA was obtained using the Dubinin–Radushkevich (D-R) equation, and the micropore volume and micropore size were obtained with the Dubinin–Astakhov (D-A) equation [42].

4. Results

4.1. Organic Matter Content and Thermal Maturity

The average Ro of the samples from the KQ and DZ sections is 0.70% and 0.71%, respectively, indicating oil-window maturity. The TOC content of samples from the KQ section ranges from 12.48 to 33.15 wt.%, with an average value of 21.86 wt.% (Table 1). In comparison, samples from the DZ section have a much lower TOC content (average 1.48 wt.%).

4.2. Mineralogical Composition

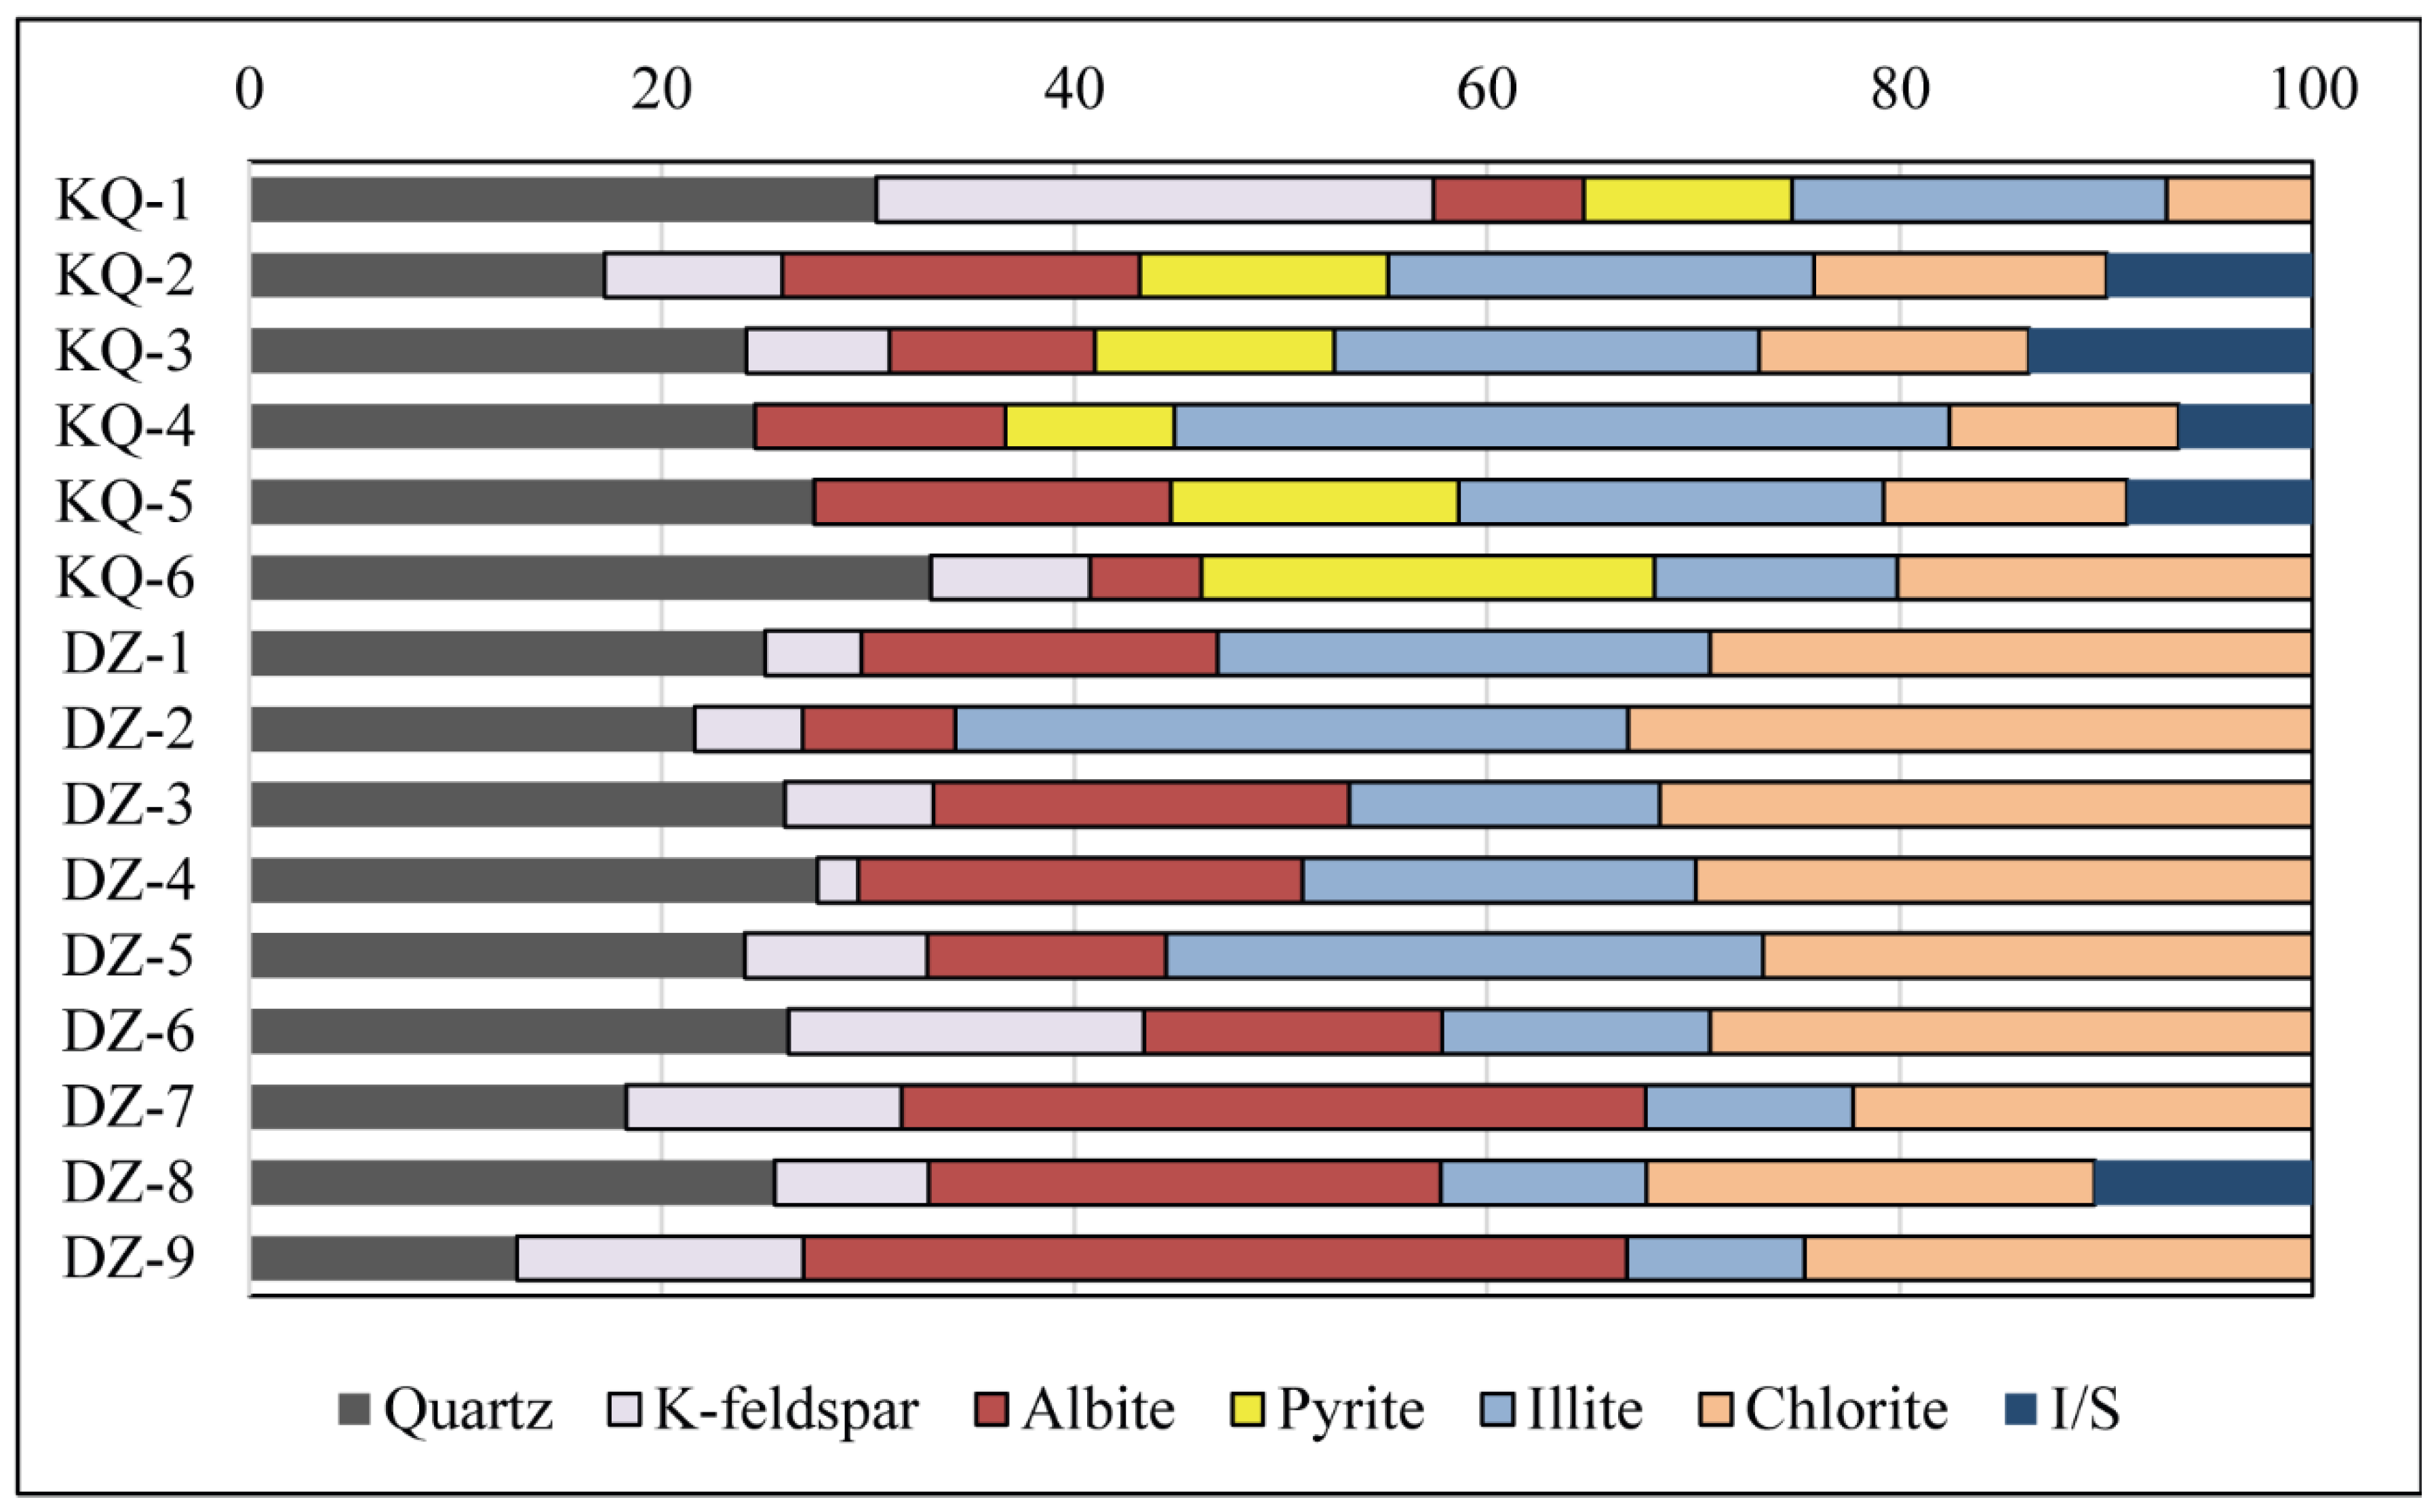
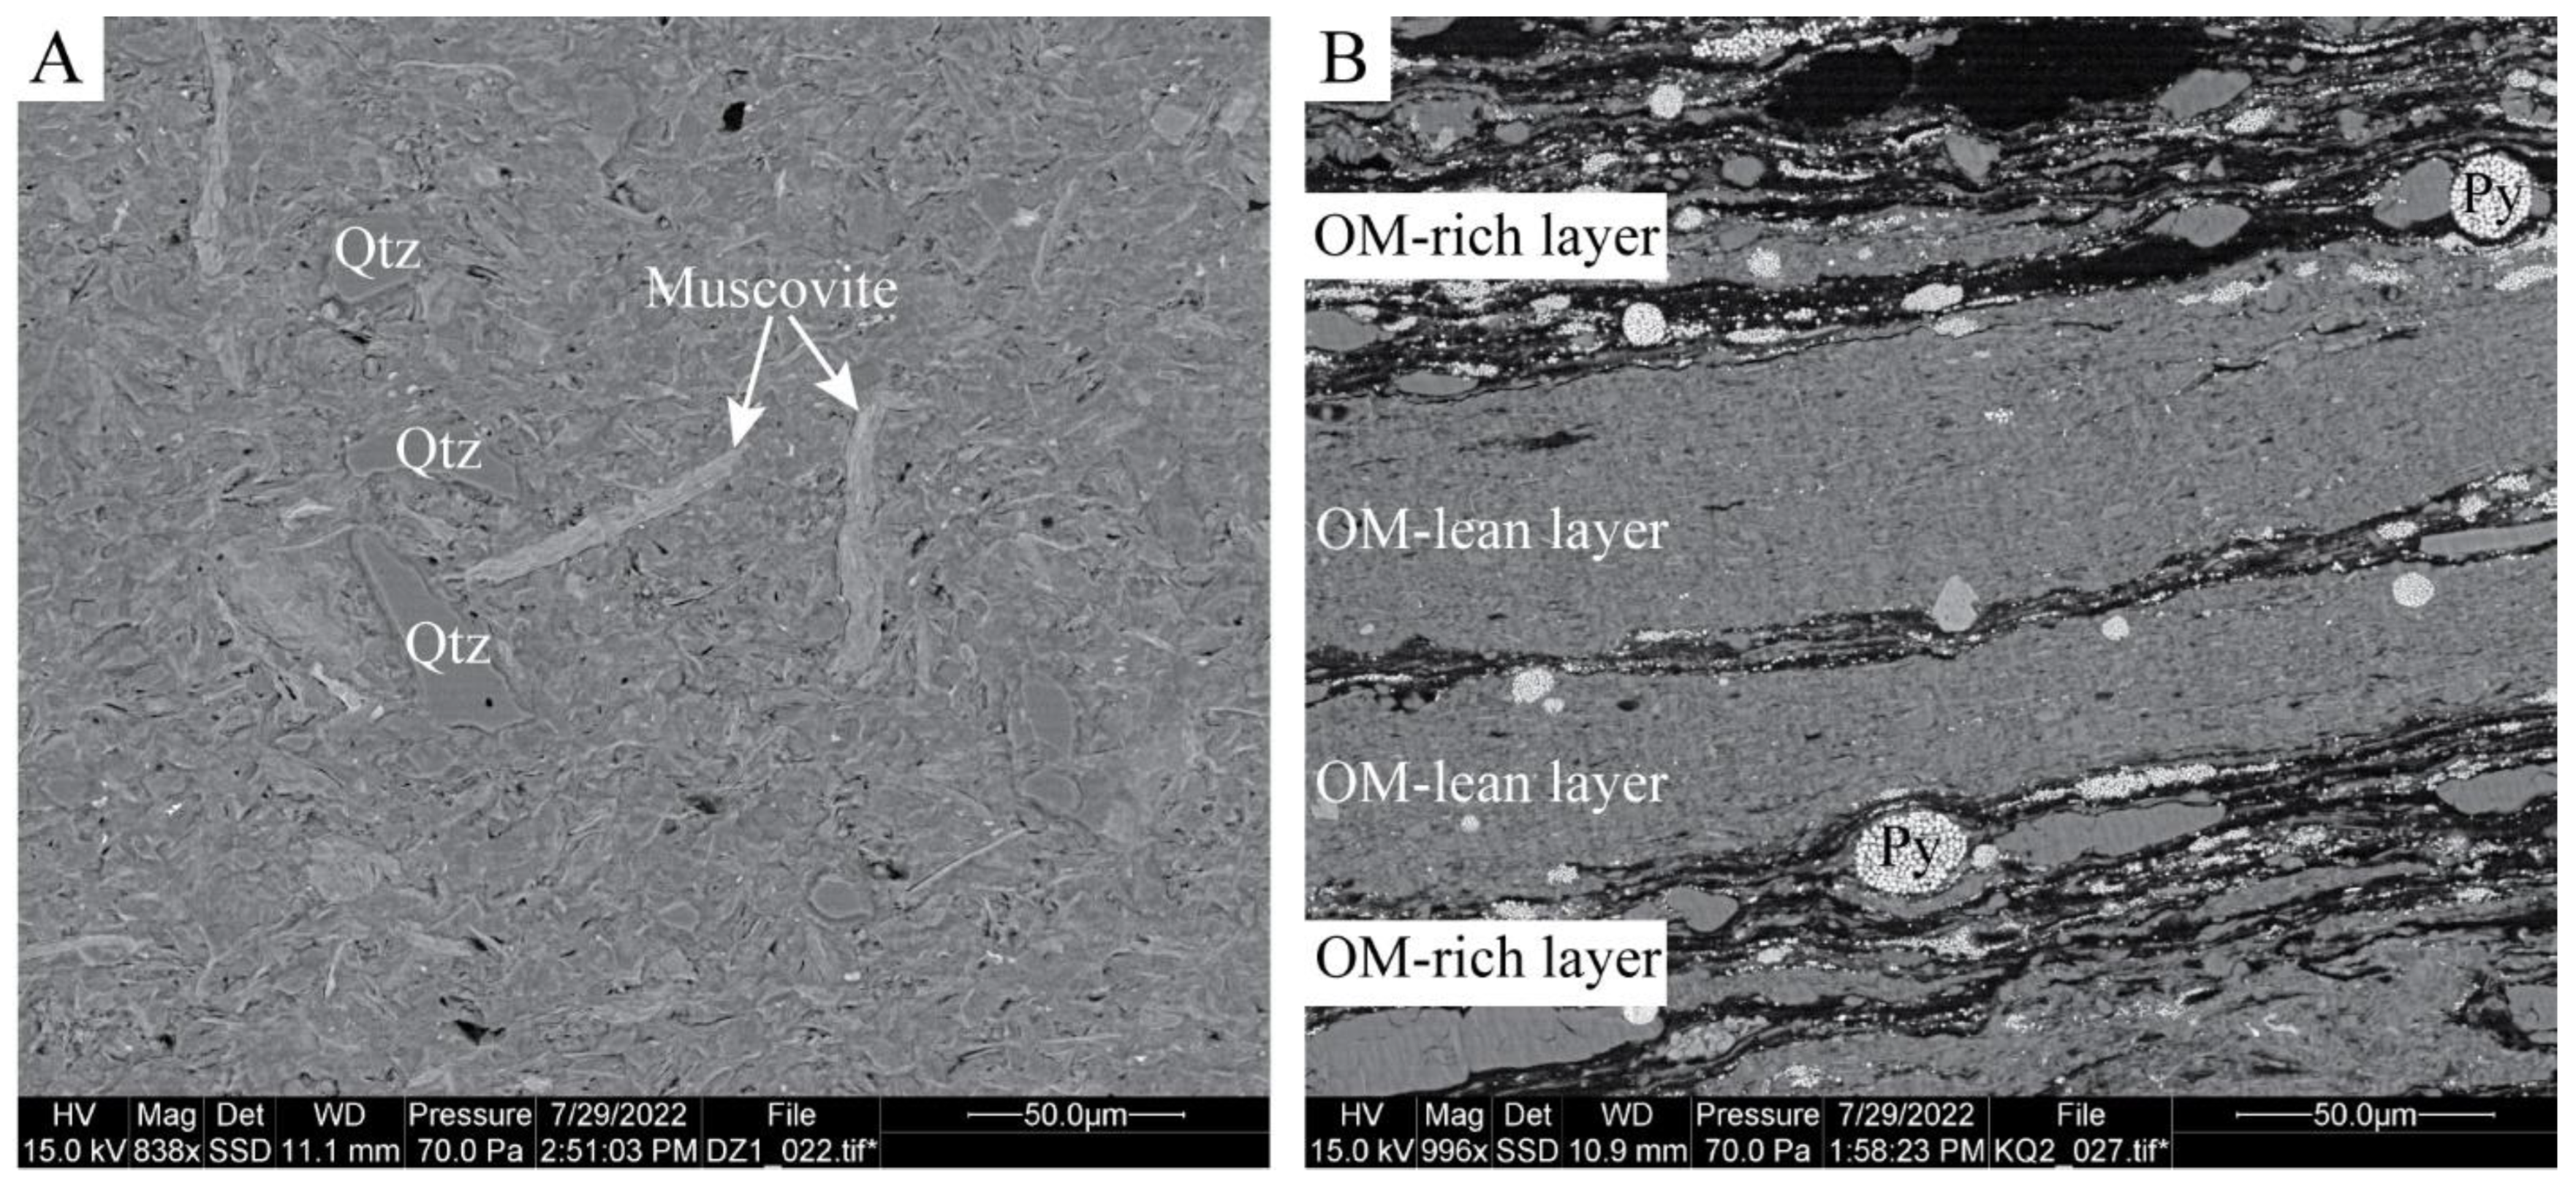
X-ray diffraction analysis shows that the studied Chang 7 Member shale samples consist of quartz, feldspars, clay minerals, and pyrite (Table 1; Figure 2). Samples from the KQ section have a higher quartz content (average 26.1%) and lower total clay mineral content (average 41.0%) than those from the DZ section (average 23.0% for quartz and 46.7% for total clay mineral). The clay minerals are dominated by illite and chlorite. Samples from the DZ section have a higher chlorite content (27.6%) than those from the KQ section (12.9%). Minor illite/smectite interlayers were present in both sections. The pyrite content is 13.0% in the KQ section on average, but it was not detected in the DZ section. Silt-sized grains are dispersed in the clay matrix (Figure 3A). Samples from the DZ section are relatively homogeneous in fabric (Figure 3A), whereas samples from the KQ section show intercalation of OM-rich and OM-lean layers (Figure 3B).

4.3. Pore Structure Characteristics

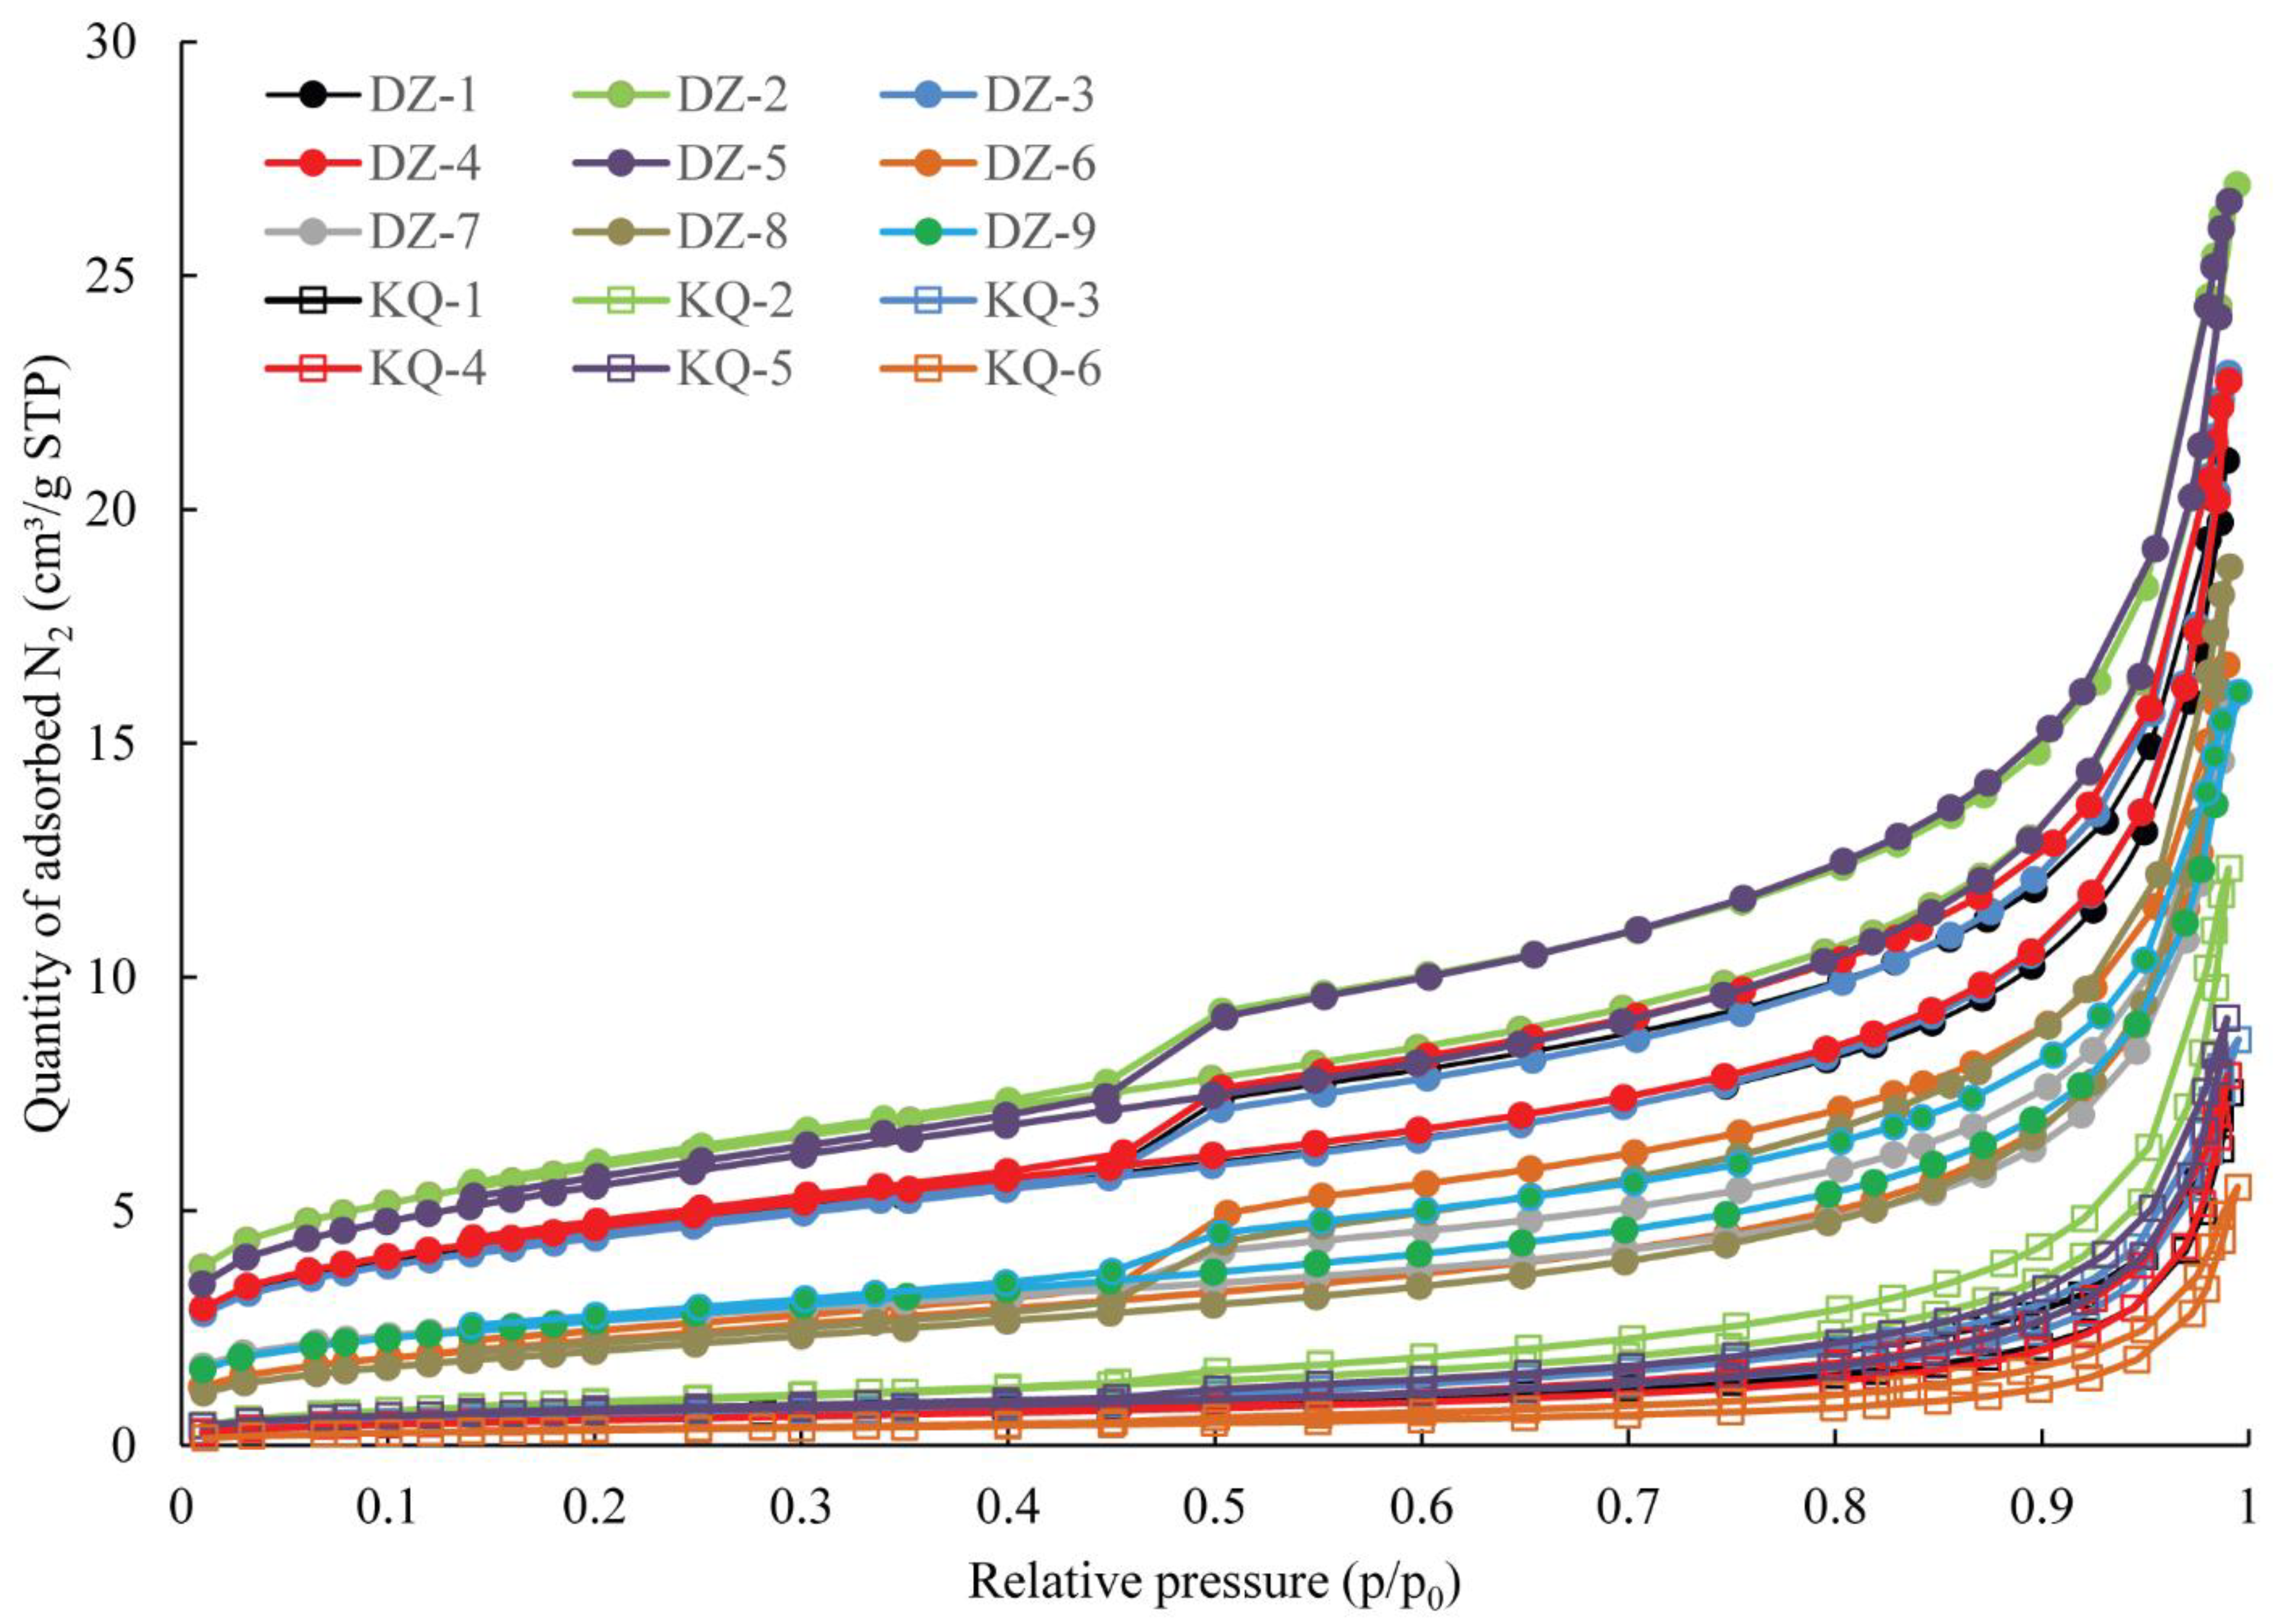
The N2 adsorption–desorption isotherms of the studied Chang 7 Member shale samples are shown in Figure 4. Samples from the DZ section adsorbed more N2 than those from the KQ section (Figure 4). As determined by the N2 adsorption isotherms, the BET specific surface area (SSA) of the studied shale samples ranges from 1.17 to 20.86 m2/g, with an average value of 9.05 m2/g (Table 2). Samples from the DZ section have a higher BET SSA (average 13.60 m2/g) than those from the KQ section (average 2.22 m2/g). The BJH pore volume ranges from 0.0085 to 0.0403 cm3/g, with an average value of 0.0243 cm3/g (Table 2). As with the BET SSA, the BJH pore volumes of the samples from the DZ section (average 0.0318 cm3/g) are higher than those from the KQ section (average 0.0132 cm3/g).
The BET SSA and BJH mesopore volumes of the shale samples are negatively correlated (R2 = 0.90 and 0.89) with the TOC content (Figure 5A,B) but are positively correlated (R2 = 0.69 and 0.83) with total clay mineral content (Figure 6A,B), which indicates that the SSA and mesopore volumes of shale samples in the early oil window are mainly contributed by clay minerals.
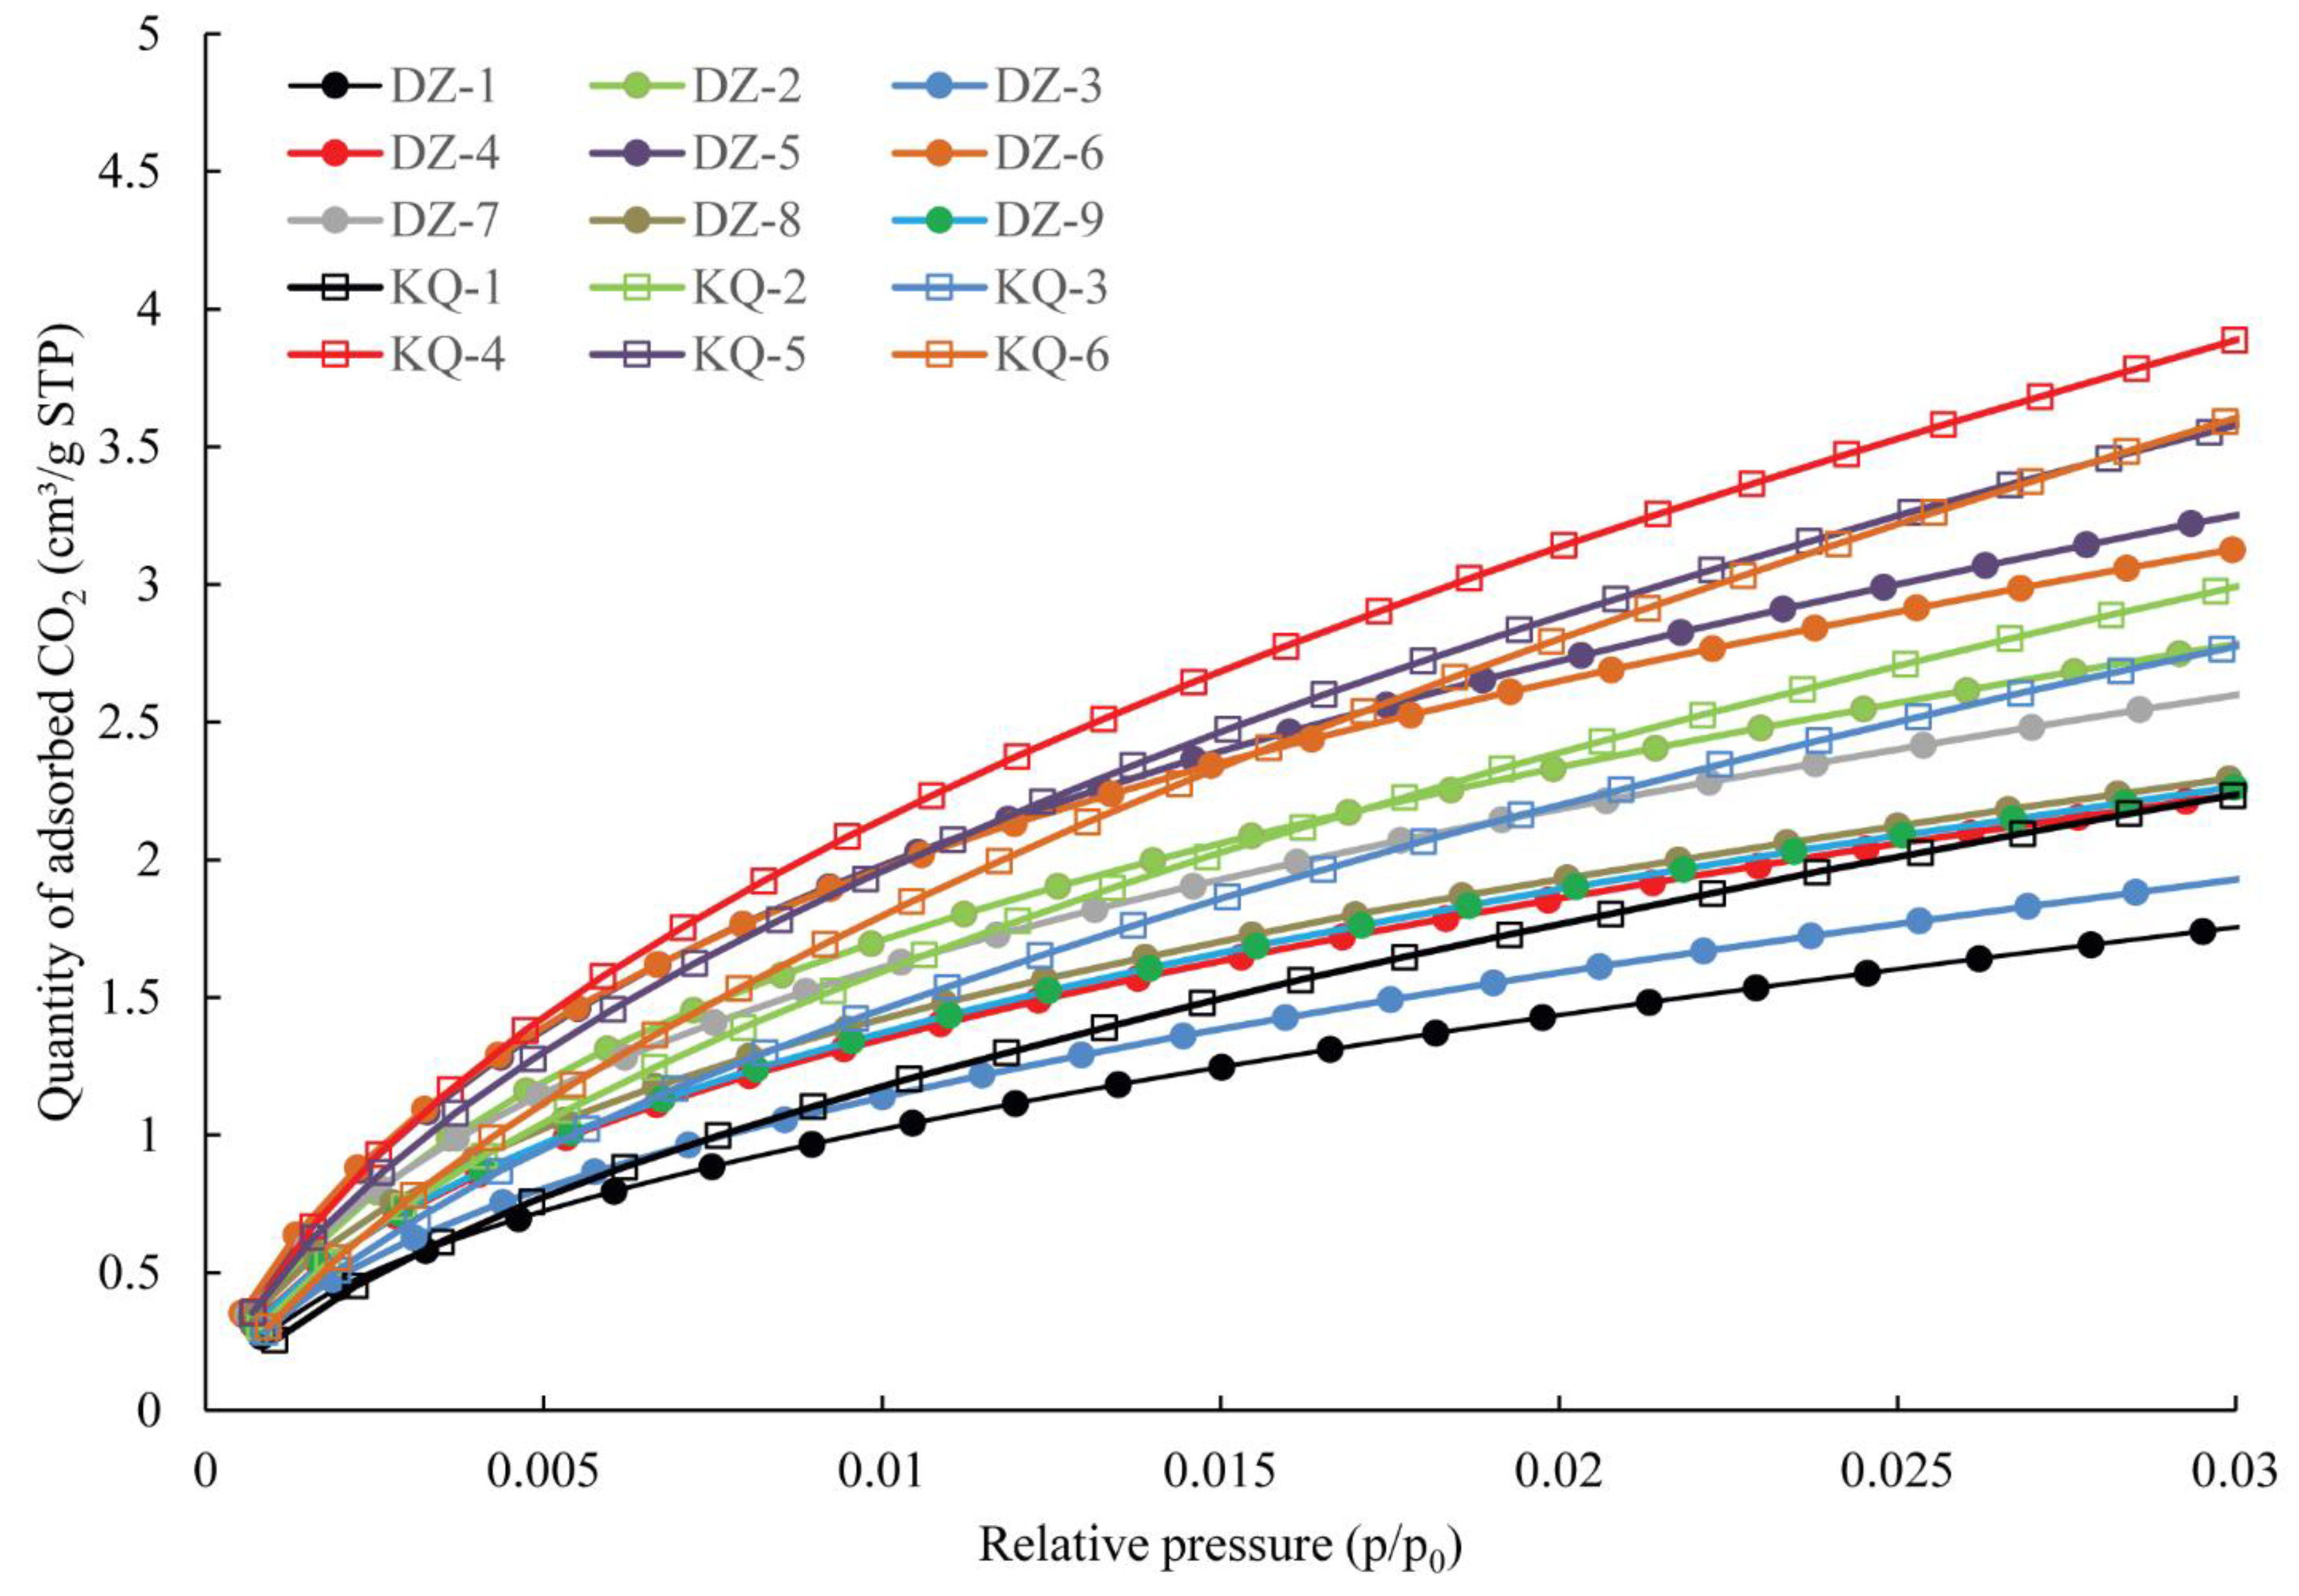
The CO2 adsorption isotherms of the studied Chang 7 Member shale samples are shown in Figure 7. CO2 adsorption results show that the D-R micropore surface area of samples from the KQ section ranges from 21.05 to 36.73 m2/g (average 29.80 m2/g), and the D-A micropore volume ranges from 0.0149 to 0.0261 cm3/g (average 0.0207 cm3/g) (Table 2). In comparison, samples from the DZ section have a lower micropore surface area (average 20.26 m2/g) and micropore volume (average 0.0110 cm3/g) (Table 2).
The micropore surface area and volume are positively correlated (R2 = 0.50 and 0.70) with TOC content (Figure 5C,D), suggesting that OM makes significant contributions to micropores in shales in the early oil window. The micropore surface area and volume have no correlation (R2 = 0.08) and are slightly negatively correlated (R2 = 0.28) with clay mineral content (Figure 6C,D).

4.4. Pore Types

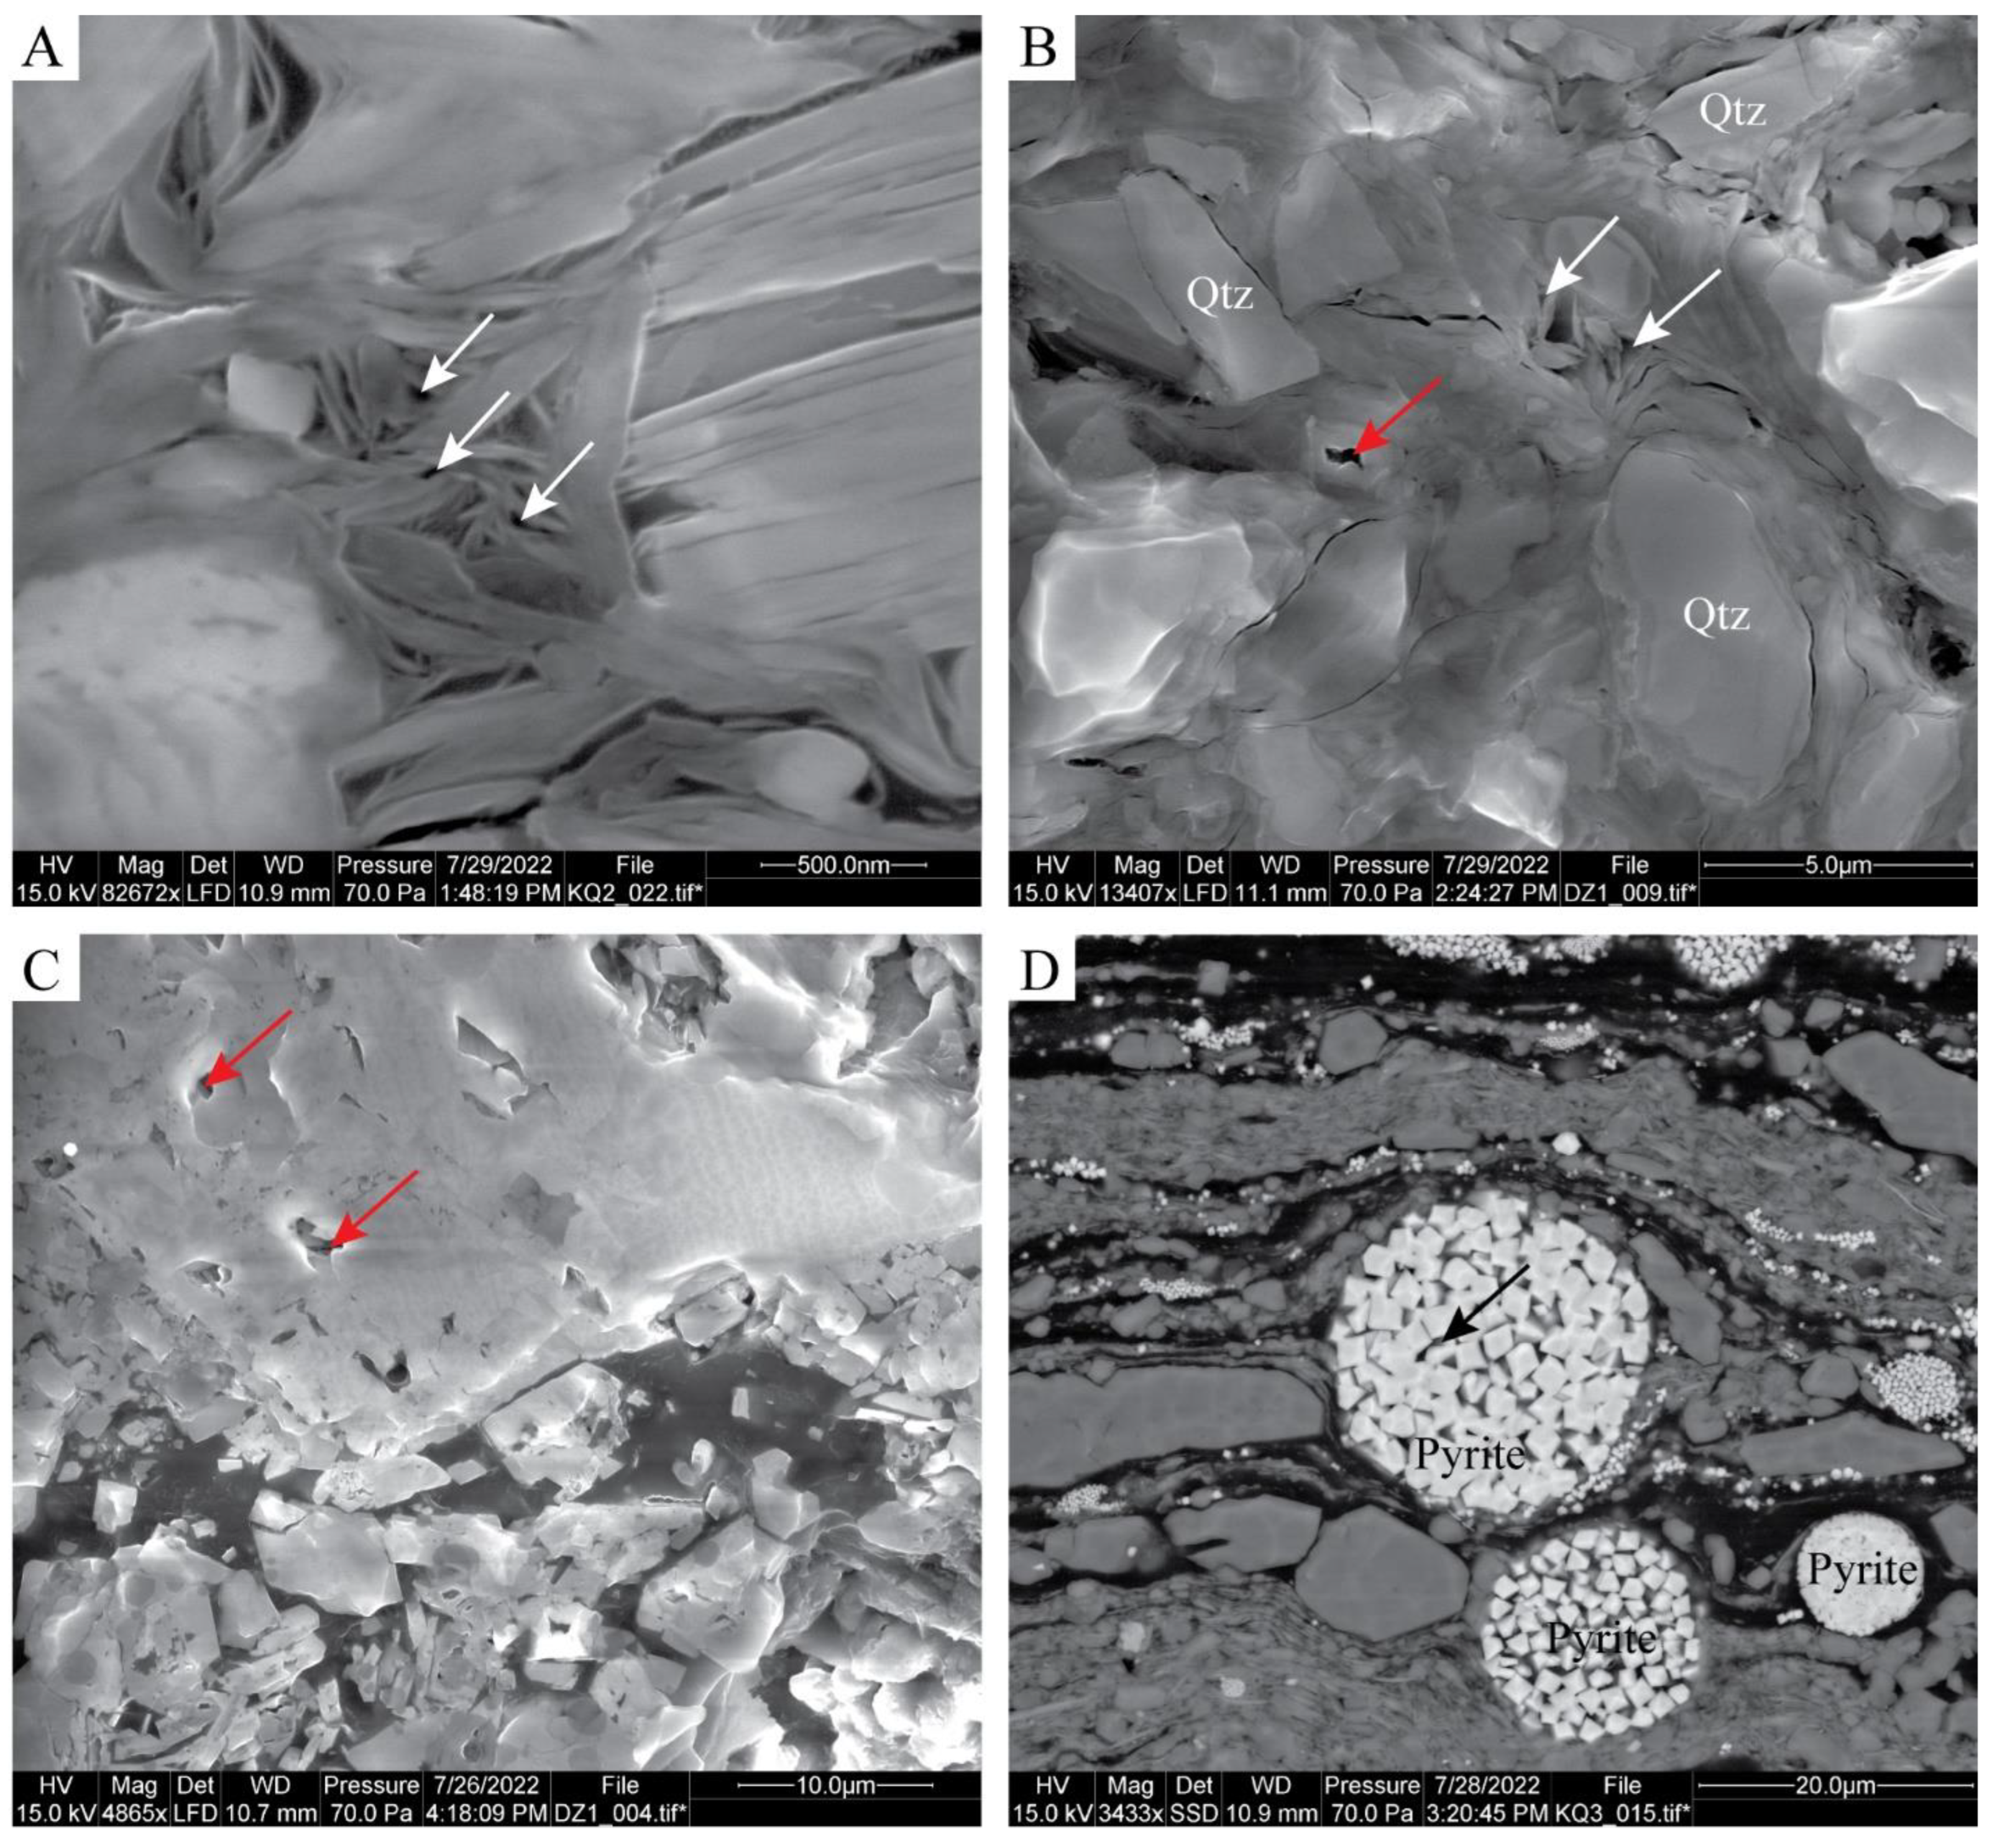
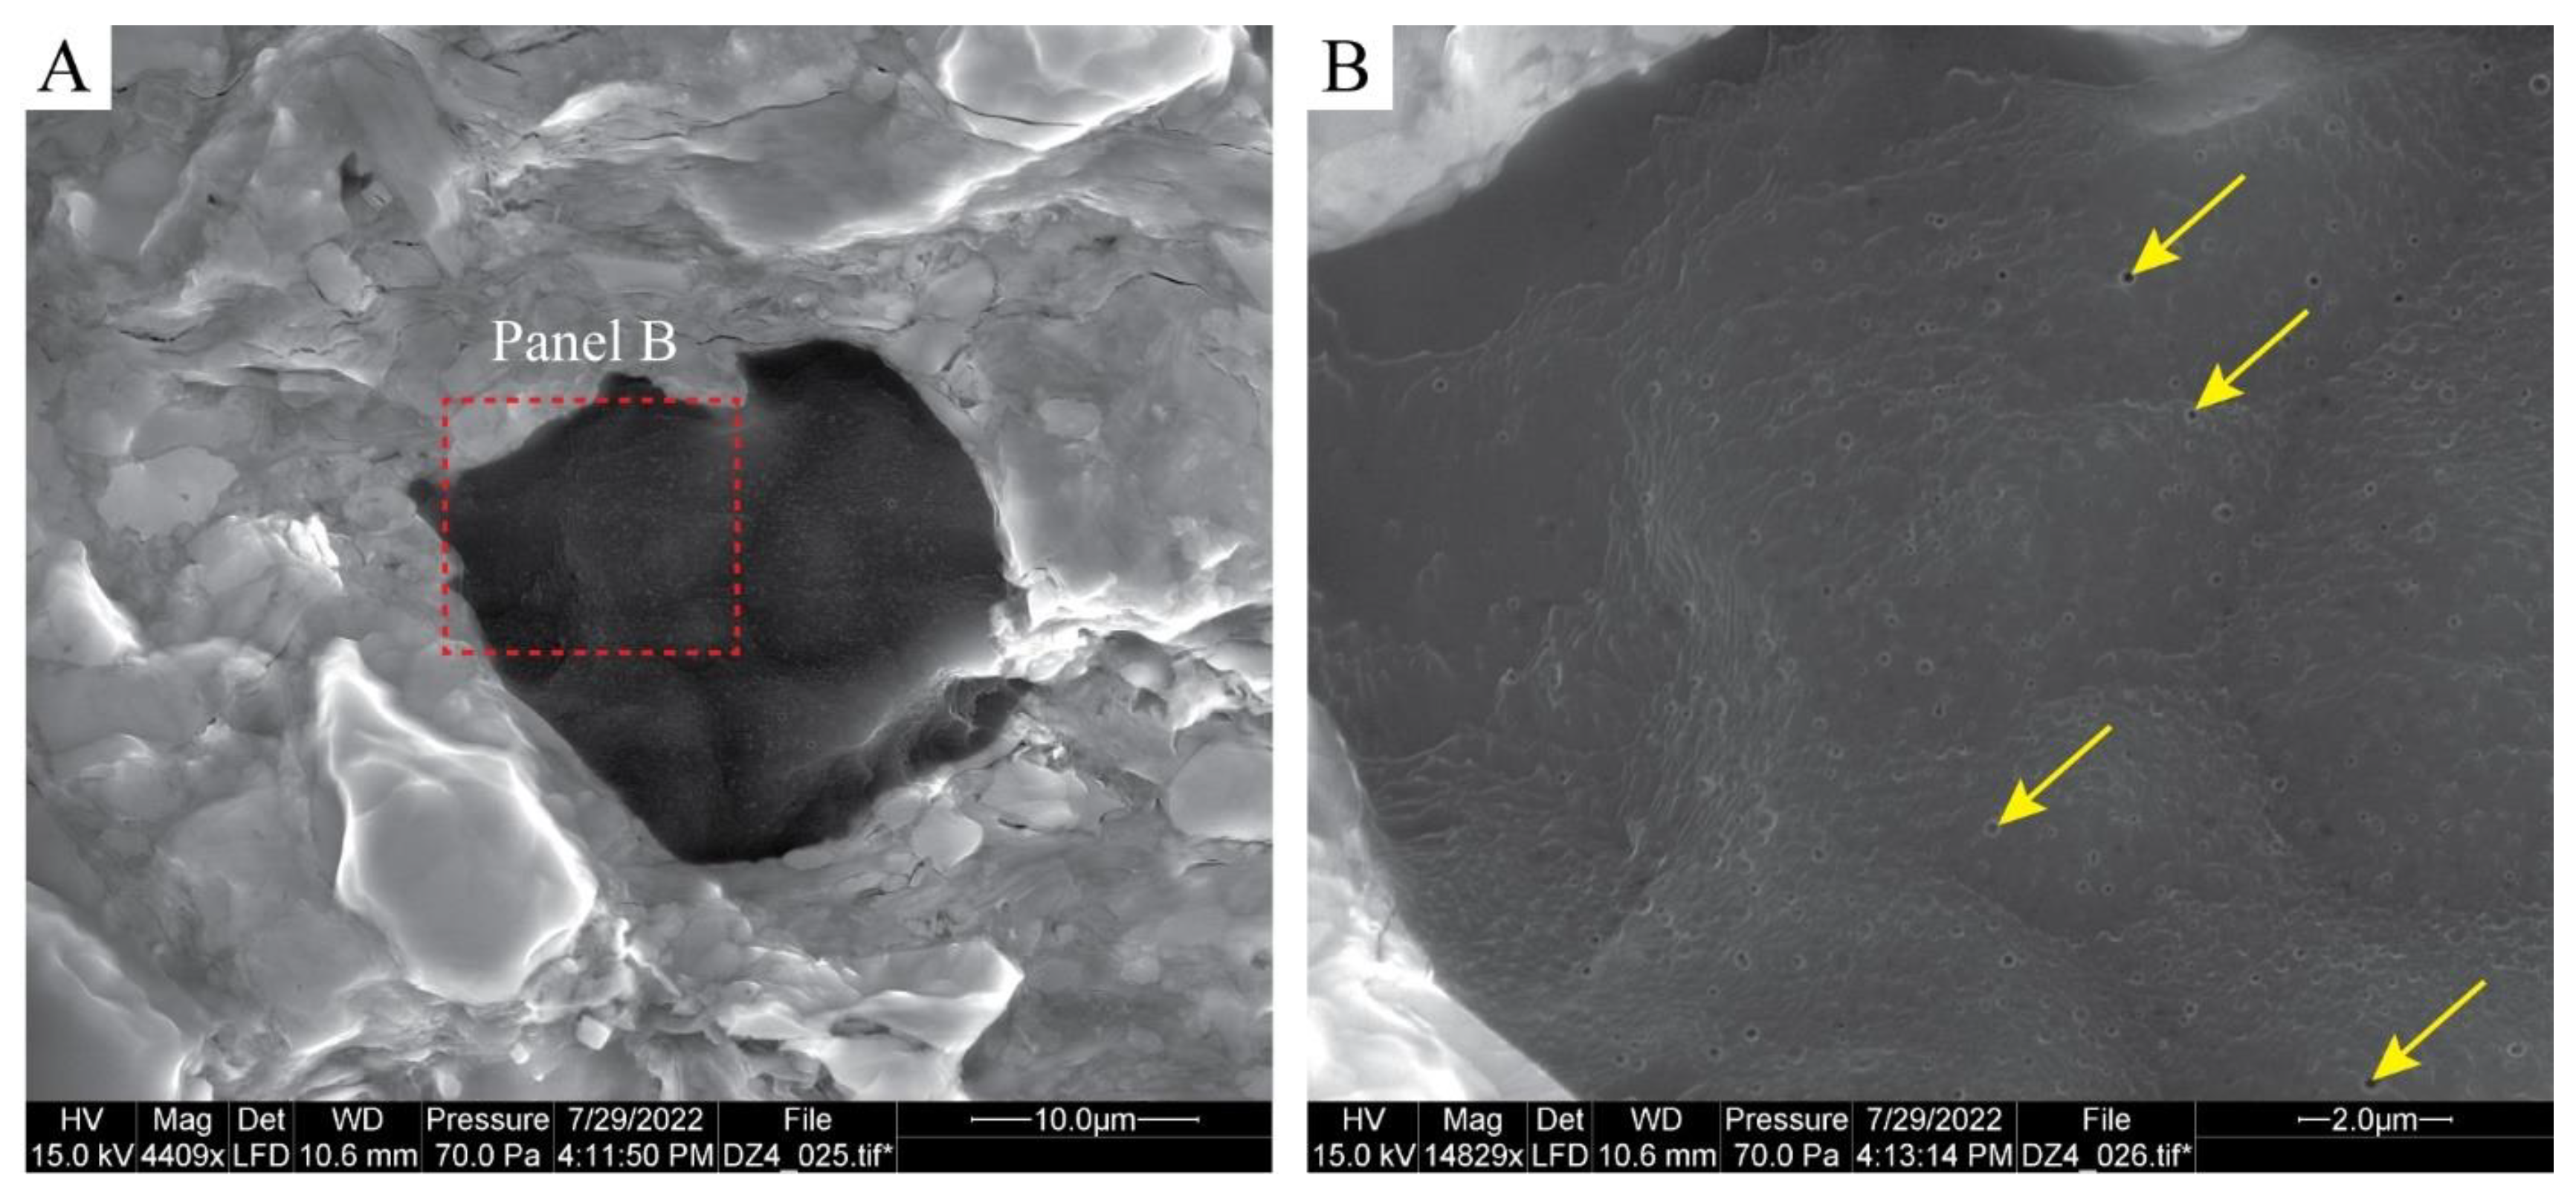
Pore types in the Chang 7 Member shale samples include phyllosilicate framework pores (Figure 8A,B), and intraparticle pores within mineral grains such as grain dissolution pores (Figure 8C) and pores in pyrite framboids (Figure 8D). OM-hosted pores were observed in terrestrial OM under SEM in samples from the DZ section (Figure 9). No organic pores were detected in samples from the KQ section. Interparticle pores between silt-sized mineral grains (e.g., quartz and feldspar) are very rare due to the OM- and clay-rich nature of the studied samples and mechanical compaction during burial.

5. Discussion

The pore structure characteristics of black shales are critically controlled by shale composition [3,4,5,6,43]. OM-hosted pores, to a large degree, control the SSA and pore volume of shales [5,22,44], and as a result, control their gas contents and methane adsorption capacities [17,45]. The development of OM-hosted pores is controlled by both maceral type and thermal maturity [20,22,23,46]. OM-hosted pores, except pores in terrestrial OM, were not observed in the studied Chang 7 Member shales because of the low maturity of samples from the KQ section and a dominance of terrestrial OM in samples from the DZ section. Although no organic pores were observed under SEM in the studied shale samples, low-pressure N2 and CO2 adsorption analyses show that OM in them contain abundant micropores, demonstrated by the positive correlations between micropore SSA and volume and TOC content (Figure 5C,D). Pores in the micropore size range are voids within the macromolecular structure of OM and are beyond the detection limit of SEM.
Mineral-, especially clay-associated pores, make significant contributions to the pore structure characteristics of shales [3,5,25,47]. The BET SSA of the smectite, illite, and smectite/illite interlayers is approximately 30–100 m2/g [3,5,25,48], and their mesopore volume is in the 0.03–0.07 cm3/g range [25,49,50]. Clay minerals in the studied Chang 7 Member shales are dominated by illite, chlorite, and, interstratified illite/smectite (Table 1; Figure 2). The positive correlations between the BET SSA and BJH mesopore volumes and total clay mineral content (Figure 6A,B) demonstrate that the mesopore properties of the studied shales are controlled by clay minerals. Because of the OM-lean and clay-rich nature of samples from the DZ section, the pore characteristics of the shales are mainly controlled by clay minerals. For example, samples DZ-2 and DZ-3 have the same TOC content (0.3 wt.%), but sample DZ-2 has a higher clay content (65.6%) than that of sample DZ-3 (46.5%). The BET SSA (20.86 m2/g) and micropore surface area (23.93 m2/g) of sample DZ-2 are higher than those (15.63 m2/g and 15.49 m2/g) of sample DZ-3 (Table 2). In comparison, because of the OM-rich nature of samples from the KQ section, the pore characteristics of shales are controlled by both OM and clay minerals.

6. Conclusions

Mineralogical and low-pressure N2 and CO2 adsorption analyses of the Chang 7 Member shales of the Yanchang Formation, Ordos Basin, revealed the control of shale composition on pore structure characteristics of lacustrine shales. The TOC content of the Chang 7 Member shales can be as high as 33.15 wt.%. Minerals in the Chang 7 Member shale samples consist of quartz, feldspars, clay minerals, and pyrite. SEM observations show that the main pore type in the Chang 7 Member shales is phyllosilicate framework pores. In organic-lean shales, the pore characteristics are mainly controlled by clay minerals, whereas in organic-rich shales, the pore characteristics are mainly controlled by both clay minerals and OM.

Author Contributions

Conceptualization, B.L. (Bei Liu); Formal analysis, B.L. (Bei Liu), J.T. and C.L.; Funding acquisition, B.L. (Bei Liu); Investigation, B.L. (Bei Liu), J.T., B.L. (Baoqing Li), S.B. and Y.W.; Writing – original draft, B.L. (Bei Liu), J.T. and C.L.; Writing – review & editing, B.L. (Bei Liu) and B.L. (Baoqing Li). All authors have read and agreed to the published version of the manuscript.

Funding

This research was supported by the Open Fund (33550000-21-ZC0613-0325) of the State Key Laboratory of Shale Oil and Gas Enrichment Mechanisms and Effective Development (Sinopec) and the National Science Foundation of China (Grant Nos. 42102194 and 42202167). Many thanks to Juergen Schieber and Zalmai Yawar from Indiana University Bloomington for SEM work.

Conflicts of Interest

The authors declare no conflict of interest.

References

  1. Passey, Q.R.; Bohacs, K.M.; Esch, W.L.; Klimentidis, R.; Sinha, S. From oil-prone source rock to gas-producing shale reservoir-geologic and petrophysical characterization of unconventional shale-gas reservoirs. In Proceedings of the Chinese Petroleum Society/Society of Petroleum Engineers International Oil and Gas Conference and Exhibition, Beijing, China, 8–10 June 2010. SPE Paper 131350. [Google Scholar]
  2. Qiu, Z.; Zou, C. Controlling factors on the formation and distribution of “sweet-spot areas” of marine gas shales in South China and a preliminary discussion on unconventional petroleum sedimentology. J. Asian Earth Sci. 2020, 194, 103989. [Google Scholar] [CrossRef]
  3. Ross, D.J.K.; Bustin, R.M. The importance of shale composition and pore structure upon gas storage potential of shale gas reservoirs. Mar. Pet. Geol. 2009, 26, 916–927. [Google Scholar] [CrossRef]
  4. Clarkson, C.R.; Solano, N.; Bustin, R.M.; Bustin, A.M.M.; Chalmers, G.R.; He, L.; Melnichenko, Y.B.; Radliński, A.P.; Blach, T.P. Pore structure characterization of North American shale gas reservoirs using USANS/SANS, gas adsorption, and mercury intrusion. Fuel 2013, 103, 606–616. [Google Scholar] [CrossRef]
  5. Liu, B.; Teng, J.; Mastalerz, M.; Schieber, J.; Schimmelmann, A.; Bish, D. Compositional control on shale pore structure characteristics across a maturation gradient: Insights from the Devonian New Albany Shale and Marcellus Shale in the eastern United States. Energy Fuels 2021, 35, 7913–7929. [Google Scholar] [CrossRef]
  6. Teng, J.; Deng, H.; Liu, B.; Chen, W.; Fu, M.; Xia, Y.; Yu, H. Insights of the pore system of lacustrine shales from immature to late mature with the aid of petrology, mineralogy and porosimetry: A case study of the Triassic Yanchang Formation of the Ordos Basin, North China. J. Pet. Sci. Eng. 2021, 196, 107631. [Google Scholar] [CrossRef]
  7. Xiong, F.; Jiang, Z.; Li, P.; Wang, X.; Bi, H.; Li, Y.; Wang, Z.; Amooie, M.A.; Soltanian, M.R.; Moortgat, J. Pore structure of transitional shales in the Ordos Basin, NW China: Effects of composition on gas storage capacity. Fuel 2017, 206, 504–515. [Google Scholar] [CrossRef]
  8. Xu, Q.; Liu, B.; Ma, Y.; Song, X.; Wang, Y.; Chen, Z. Geological and geochemical characterization of lacustrine shale: A case study of the Jurassic Da’anzhai member shale in the central Sichuan Basin, southwest China. J. Nat. Gas. Sci. Eng. 2017, 47, 124–139. [Google Scholar] [CrossRef]
  9. Craddock, P.R.; Haecker, A.; Bake, K.D.; Pomerantz, A.E. Universal curves describing the chemical and physical evolution of type II kerogen during thermal maturation. Energy Fuels 2020, 34, 15217–15233. [Google Scholar] [CrossRef]
  10. Tissot, B.P.; Welte, D.H. Petroleum Formation and Occurrence, 2nd ed.; Springer: Berlin/Heidelberg, Germany, 1984. [Google Scholar]
  11. Jarvie, D.M.; Hill, R.J.; Ruble, T.E.; Pollastro, R.M. Unconventional shale-gas systems: The Mississippian Barnett Shale of north-central Texas as one model for thermogenic shale-gas assessment. AAPG Bull. 2007, 91, 475–499. [Google Scholar] [CrossRef]
  12. Loucks, R.G.; Reed, R.M.; Ruppel, S.C.; Jarvie, D.M. Morphology, genesis, and distribution of nanometer-scale pores in siliceous mudstones of the Mississippian Barnett Shale. J. Sediment. Res. 2009, 79, 848–861. [Google Scholar] [CrossRef]
  13. Loucks, R.G.; Reed, R.M.; Ruppel, S.C.; Hammes, U. Spectrum of pore types and networks in mudrocks and a descriptive classification for matrix-related mudrock pores. AAPG Bull. 2012, 96, 1071–1098. [Google Scholar] [CrossRef] [Green Version]
  14. Schieber, J. Common themes in the formation and preservation of intrinsic porosity in shales and mudstones-illustrated with examples across the Phanerozoic. In Proceedings of the SPE Unconventional Gas Conference. Society of Petroleum Engineers, Pittsburgh, PA, USA, 23–25 February 2010. SPE Paper 132370. [Google Scholar]
  15. Schieber, J. SEM observations on ion-milled samples of Devonian black shales from Indiana and New York: The petrographic context of multiple pore types. In Electron Microscopy of Shale Hydrocarbon Reservoirs; Camp, W., Diaz, E., Wawak, B., Eds.; American Association of Petroleum Geologists (AAPG): Tulsa, OK, USA, 2013; AAPG Memoir; Volume 102, pp. 153–171. [Google Scholar]
  16. Curtis, M.E.; Cardott, B.J.; Sondergeld, C.H.; Rai, C.S. Development of organic porosity in the Woodford Shale with increasing thermal maturity. Int. J. Coal Geol. 2012, 103, 26–31. [Google Scholar] [CrossRef]
  17. Hao, F.; Zou, H.; Lu, Y. Mechanisms of shale gas storage: Implications for shale gas exploration in China. AAPG Bull. 2013, 97, 1325–1346. [Google Scholar] [CrossRef]
  18. Cardott, B.J.; Landis, C.R.; Curtis, M.E. Post-oil solid bitumen network in the Woodford Shale, USA—A potential primary migration pathway. Int. J. Coal Geol. 2015, 139, 106–113. [Google Scholar] [CrossRef]
  19. Schieber, J.; Lazar, R.; Bohacs, K.; Klimentidis, R.; Dumitrescu, M.; Ottmann, J. An SEM study of porosity in the Eagle Ford Shale of Texas—Pore types and porosity distribution in a depositional and sequence-stratigraphic Context. In The Eagle Ford Shale: A Renaissance in U.S. Oil Production; Breyer, J.A., Ed.; American Association of Petroleum Geologists (AAPG): Tulsa, OK, USA, 2016; AAPG Memoir; Volume 110, pp. 167–186. [Google Scholar]
  20. Liu, B.; Schieber, J.; Mastalerz, M. Combined SEM and reflected light petrography of organic matter in the New Albany Shale (Devonian-Mississippian) in the Illinois Basin: A perspective on organic pore development with thermal maturation. Int. J. Coal Geol. 2017, 184, 57–72. [Google Scholar] [CrossRef]
  21. Liu, K.; Liu, J.; Huang, X. Coupled stratigraphic and petroleum system modeling: Examples from the Ordos Basin, China. AAPG Bull. 2021, 105, 1–28. [Google Scholar] [CrossRef]
  22. Liu, B.; Mastalerz, M.; Schieber, J. SEM petrography of dispersed organic matter in black shales: A review. Earth Sci. Rev. 2022, 224, 103874. [Google Scholar] [CrossRef]
  23. Katz, B.J.; Arango, I. Organic porosity: A geochemist’s view of the current state of understanding. Org. Geochem. 2018, 123, 1–16. [Google Scholar] [CrossRef]
  24. Chen, S.; Zhang, C.; Li, X.; Zhang, Y.; Wang, X. Simulation of methane adsorption in diverse organic pores in shale reservoirs with multi-period geological evolution. Int. J. Coal Sci. Technol. 2021, 8, 844–855. [Google Scholar] [CrossRef]
  25. Kuila, U.; Prasad, M. Specific surface area and pore-size distribution in clays and shales. Geophys. Prospect. 2013, 61, 341–362. [Google Scholar] [CrossRef]
  26. Chen, Y.; Zhu, Z.; Zhang, L. Control actions of sedimentary environments and sedimentation rates on lacustrine oil shale distribution, an example of the oil shale in the Upper Triassic Yanchang Formation, southeastern Ordos Basin (NW China). Mar. Pet. Geol. 2019, 102, 508–520. [Google Scholar] [CrossRef]
  27. Yang, Y.; Li, W.; Ma, L. Tectonic and stratigraphic controls of hydrocarbon systems in the Ordos basin: A multicycle cratonic basin in central China. AAPG Bull. 2005, 89, 255–269. [Google Scholar] [CrossRef]
  28. Zhao, M.; Behr, H.J.; Ahrendt, H.; Wemmer, K.; Ren, Z.; Zhao, Z. Thermal and tectonic history of the Ordos Basin, China: Evidence from apatite fission track analysis, vitrinite reflectance, and K-Ar dating. AAPG Bull. 1996, 80, 1110–1133. [Google Scholar]
  29. Zhao, J.; Mountney, N.P.; Liu, C.; Qu, H.; Lin, J. Outcrop architecture of a fluvio-lacustrine succession: Upper Triassic Yanchang Formation, Ordos Basin, China. Mar. Pet. Geol. 2015, 68, 394–413. [Google Scholar] [CrossRef]
  30. Xie, X. Provenance and sediment dispersal of the Triassic Yanchang Formation, southwest Ordos Basin, China, and its implications. Sed. Geol. 2016, 335, 1–16. [Google Scholar] [CrossRef]
  31. Zou, C.; Zhu, R.; Chen, Z.; Ogg, J.G.; Wu, S.; Dong, D.; Qiu, Z.; Wang, Y.; Wang, L.; Lin, S.; et al. Organic-matter-rich shales of China. Earth Sci. Rev. 2019, 189, 51–78. [Google Scholar] [CrossRef]
  32. Chen, Y.; Lin, S.; Bai, B.; Zhang, T.; Pang, Z.; Tao, S.; Hu, S. Effects of petroleum retention and migration within the Triassic Chang 7 Member of the Ordos Basin, China. Int. J. Coal Geol. 2020, 225, 103502. [Google Scholar] [CrossRef]
  33. Teng, J.; Deng, H.; Xia, Y.; Chen, W.; Fu, M. Controls of amorphous organic matter on the hydrocarbon generation potential of lacustrine shales: A case study on the Chang 7 Member of Yanchang Formation, Ordos Basin, North China. Energy Fuels 2021, 35, 5879–5888. [Google Scholar] [CrossRef]
  34. ASTM-D2797; Standard Practice for Preparing Coal Samples for Microscopical Analysis by Reflected Light. ASTM International: West Conshohocken, PA, USA, 2015.
  35. Taylor, J.C. Computer programs for standardless quantitative analysis of minerals using the full powder diffraction profile. Powder. Diffr. 1991, 6, 2–9. [Google Scholar] [CrossRef] [Green Version]
  36. Rietveld, H.M. A profile refinement method for nuclear and magnetic structures. J. Appl. Crystallogr. 1969, 2, 65–71. [Google Scholar] [CrossRef]
  37. Mastalerz, M.; Schieber, J. Effect of ion milling on the perceived maturity of shale samples: Implications for organic petrography and SEM analysis. Int. J. Coal Geol. 2017, 183, 110–119. [Google Scholar] [CrossRef]
  38. Brunauer, S.; Emmett, P.H.; Teller, E. Adsorption of gases in multimolecular layers. J. Am. Chem. Soc. 1938, 60, 309–319. [Google Scholar] [CrossRef]
  39. Harkins, W.D.; Jura, G. Surfaces of solids. XIII. A vapor adsorption method for the determination of the area of a solid without the assumption of a molecular area, and the areas occupied by nitrogen and other molecules on the surface of a solid. J. Am. Chem. Soc. 1994, 66, 1366–1373. [Google Scholar] [CrossRef]
  40. Barrett, E.P.; Joyner, L.G.; Halenda, P.P. The determination of pore volume and area distributions in porous substances. I. Computations from nitrogen isotherms. J. Am. Chem. Soc. 1951, 73, 373–380. [Google Scholar] [CrossRef]
  41. Rouquerol, J.; Avnir, D.; Fairbridge, C.W.; Everett, D.H.; Haynes, J.M.; Pernicone, N.; Ramsay, J.D.F.; Sing, K.S.W.; Unger, K.K. Recommendations for the characterization of porous solids (Technical Report). Pure Appl. Chem. 1994, 66, 1739–1758. [Google Scholar] [CrossRef]
  42. Rouquerol, F.; Rouquerol, J.; Sing, K.S.W.; Llewellyn, P.; Maurin, G. Adsorption by Powders and Porous Solids: Principles, Methodology and Applications, 2nd ed.; Academic Press: Oxford, UK, 2014. [Google Scholar]
  43. Ju, W.; You, Y.; Chen, Y.; Feng, S.; Xu, H.; Zhao, Y.; Liu, B. Nanoscale pore structure and fractal characteristics of the continental Yanchang Formation Chang 7 shale in the southwestern Ordos Basin, central China. Energy Sci. Eng. 2019, 7, 1188–1200. [Google Scholar] [CrossRef] [Green Version]
  44. Cheshire, S.; Craddock, P.R.; Xu, G.; Sauerer, B.; Pomerantz, A.E.; McCormick, D.; Abdallah, W. Assessing thermal maturity beyond the reaches of vitrinite reflectance and Rock-Eval pyrolysis: A case study from the Silurian Qusaiba formation. Int. J. Coal Geol. 2017, 180, 29–45. [Google Scholar] [CrossRef]
  45. Qiu, Z.; Zou, C.; Wang, H.; Dong, D.; Lu, B.; Chen, Z.; Liu, D.; Li, G.; Liu, H.; He, J.; et al. Discussion on the characteristics and controlling factors of differential enrichment of shale gas in the Wufeng-Longmaxi formations in south China. J. Nat. Gas Geosci. 2020, 5, 117–128. [Google Scholar] [CrossRef]
  46. Mastalerz, M.; Drobniak, A.; Stankiewicz, A.B. Origin, properties, and implications of solid bitumen in source-rock reservoirs: A review. Int. J. Coal Geol. 2018, 195, 14–36. [Google Scholar] [CrossRef]
  47. Hou, L.; Wu, S.; Jing, Z.; Jiang, X.; Yu, Z.; Hua, G.; Su, L.; Yu, C.; Liao, F.; Tian, H. Effects of types and content of clay minerals on reservoir effectiveness for lacustrine organic matter rich shale. Fuel 2022, 327, 125043. [Google Scholar] [CrossRef]
  48. Ji, L.; Zhang, T.; Milliken, K.L.; Qu, J.; Zhang, X. Experimental investigation of main controls to methane adsorption in clay-rich rocks. Appl. Geochem. 2012, 27, 2533–2545. [Google Scholar] [CrossRef]
  49. Wang, Z.; Zhang, Y.; Guo, P.; Liu, H.; Liao, H. A novel method to calculate the gas adsorption of mixed minerals. SN Appl. Sci. 2020, 2, 292. [Google Scholar] [CrossRef] [Green Version]
  50. Gonciaruk, A.; Hall, M.R.; Fay, M.W.; Parmenter, C.D.; Vane, C.H.; Khlobystov, A.N.; Ripepi, N. Kerogen nanoscale structure and CO2 adsorption in shale micropores. Sci. Rep. 2021, 11, 3920. [Google Scholar] [CrossRef] [PubMed]
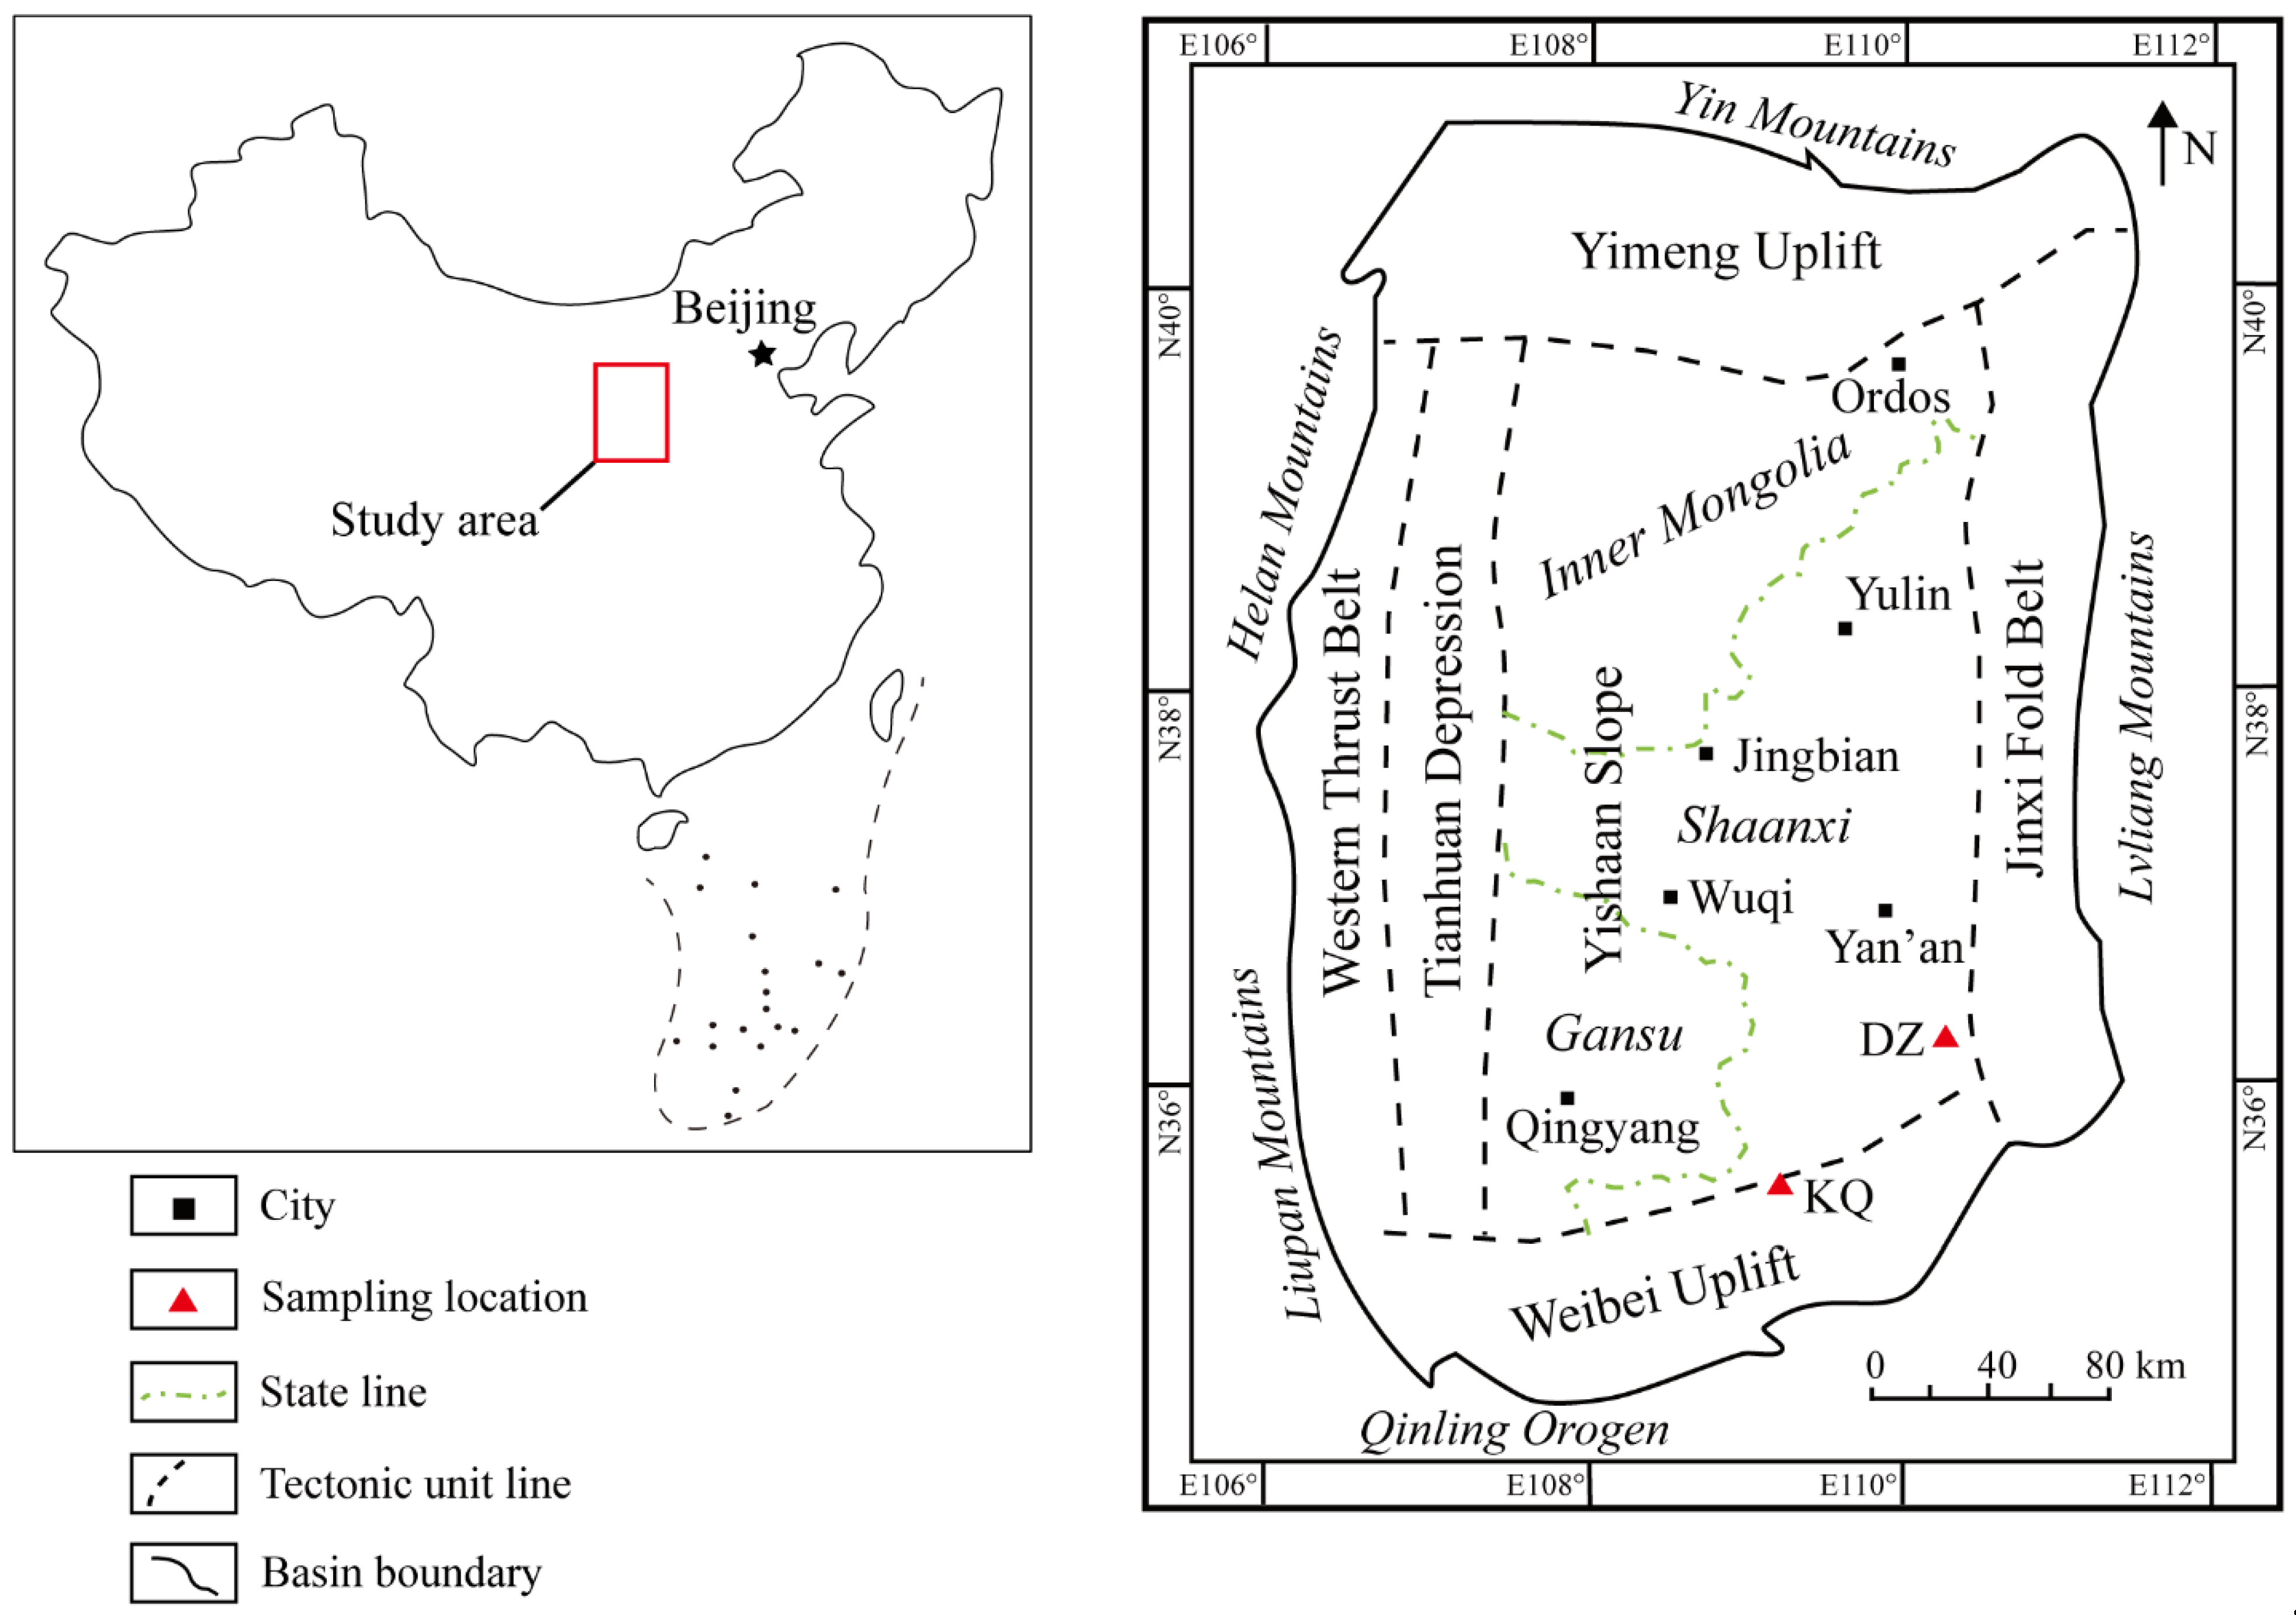
Figure 1. Map showing the extent of the Ordos Basin and sampling locations. KQ = Kuquan section; DZ = Danzhou section.
Energies 15 08353 g001
Figure 2. Mineralogical compositions of the studied Chang 7 Member shale samples determined by X-ray diffraction. I/S = illite/smectite interlayers.
Energies 15 08353 g002
Figure 3. SEM images showing the mineralogical composition and fabric of the studied Chang 7 Member shale samples. (A) Quartz and muscovite grains dispersed in the clay matrix. Sample DZ-1. (B) Intercalation of OM-rich and OM-lean layers. Sample KQ-2. SEM images also show that samples from the KQ have higher OM contents than those from the DZ section. Qtz = quartz; OM = organic matter; Py = pyrite.
Energies 15 08353 g003
Figure 4. N2 adsorption isotherms of the studied Chang 7 Member shale samples.
Energies 15 08353 g004
Figure 5. Relationships between (A) BET SSA; (B) BJH pore volume; (C) D-R micropore surface area; and (D) D-A micropore volume and total organic carbon (TOC) content.
Energies 15 08353 g005
Figure 6. Relationships between (A) BET SSA; (B) BJH pore volume; (C) D-R micropore surface area; and (D) D-A micropore volume and total clay mineral content. The total clay mineral content was normalized by making the sum of organic matter and minerals in shales 100%.
Energies 15 08353 g006
Figure 7. CO2 adsorption isotherms of the studied Chang 7 Member shale samples.
Energies 15 08353 g007
Figure 8. SEM images showing mineral-associated pores in the studied Chang 7 Member shale samples. (A) Phyllosilicate framework pores (white arrows). Sample KQ-2. (B) Phyllosilicate framework pores (white arrows) and dissolution pores (red arrows). Sample DZ-1. (C) Dissolution pores (red arrows). Sample DZ-1. (D) Pores within pyrite framboids (black arrows). Sample KQ-3. Qtz = quartz.
Energies 15 08353 g008
Figure 9. SEM images showing organic matter-hosted pores (yellow arrows) in the studied Chang 7 Member shale samples. The particulate OM dispersed in the shale matrix in (A) is most likely a terrestrial OM; (B) is the close-up view of the red dashed areas in (A). Sample DZ-4.
Energies 15 08353 g009
Table 1. Total organic carbon (TOC) content, vitrinite reflectance (Ro), and mineralogical composition of the studied shale samples.
SampleLocation TOC (wt.%)Ro (%)nQuartzK-FeldsparAlbitePyriteIlliteChloriteI/STotal Clay
KQ-1Kuquan section, Yijun County, Tongchuan, Shaanxi12.480.692530.427.07.310.118.17.10.025.2
KQ-222.800.672517.28.617.312.020.614.210.044.8
KQ-319.390.711624.16.910.011.620.613.113.747.4
KQ-421.620.671024.50.012.18.237.611.16.555.2
KQ-521.730.742227.40.017.313.920.611.89.041.4
KQ-633.150.692233.07.75.422.011.820.10.031.9
Average21.860.702026.18.411.613.021.512.96.541.0
DZ-1Danzhou section, Yichuan County, Yan’an, Shaanxi0.310.722625.04.717.30.023.929.20.053.1
DZ-20.300.722321.65.27.40.032.633.20.065.8
DZ-30.300.712726.07.220.10.015.131.60.046.7
DZ-40.550.702727.52.021.50.019.129.90.049.0
DZ-50.720.712224.08.811.60.028.926.60.055.6
DZ-61.760.682126.117.214.50.013.029.20.042.2
DZ-73.700.702718.313.336.10.010.122.30.032.3
DZ-82.140.712325.57.524.80.010.021.710.542.3
DZ-93.540.712413.013.939.90.08.624.60.033.3
Average1.480.712423.08.921.50.017.927.61.246.7
I/S = illite/smectite interlayers; n = number of Ro measurements.
Table 2. Pore structure characteristics of shales determined by low-pressure N2 and CO2 adsorption.
SampleTOC (wt.%)BET SSA (m2/g)BJH Pore Volume (cm3/g)D-R Micropore Surface Area (m2/g)D-A Micropore Volume (cm3/g)
KQ-112.482.080.011621.050.0149
KQ-222.803.360.019127.480.0209
KQ-319.392.330.013425.970.0200
KQ-421.621.940.012235.640.0196
KQ-521.732.450.014231.950.0228
KQ-633.151.170.008536.730.0261
Average21.862.220.013229.800.0207
DZ-10.3115.990.03200.011414.08
DZ-20.3020.860.04020.010223.93
DZ-30.3015.630.03510.010715.49
DZ-40.5516.380.03420.010618.04
DZ-50.7219.560.04030.013227.42
DZ-61.768.070.02620.011725.90
DZ-73.709.230.02400.011020.70
DZ-82.147.310.02940.010518.11
DZ-93.549.380.02480.010118.64
Average1.4813.600.03180.011020.26
BET = Brunauer–Emmett–Teller; BJH = Barrett–Joyner–Halenda; D-R = Dubinin–Radushkevich; D-A = Dubinin–Astakhov; SSA = specific surface area.
Publisher’s Note: MDPI stays neutral with regard to jurisdictional claims in published maps and institutional affiliations.