This section presents experimental observations, validation of theoretical models, and thermodynamic performance comparison of water-to-water heat pump using environment friendly refrigerants. In addition, the total equivalent warming impact of the system working with R134a, and its possible alternatives is discussed.
4.1. Experimental Results
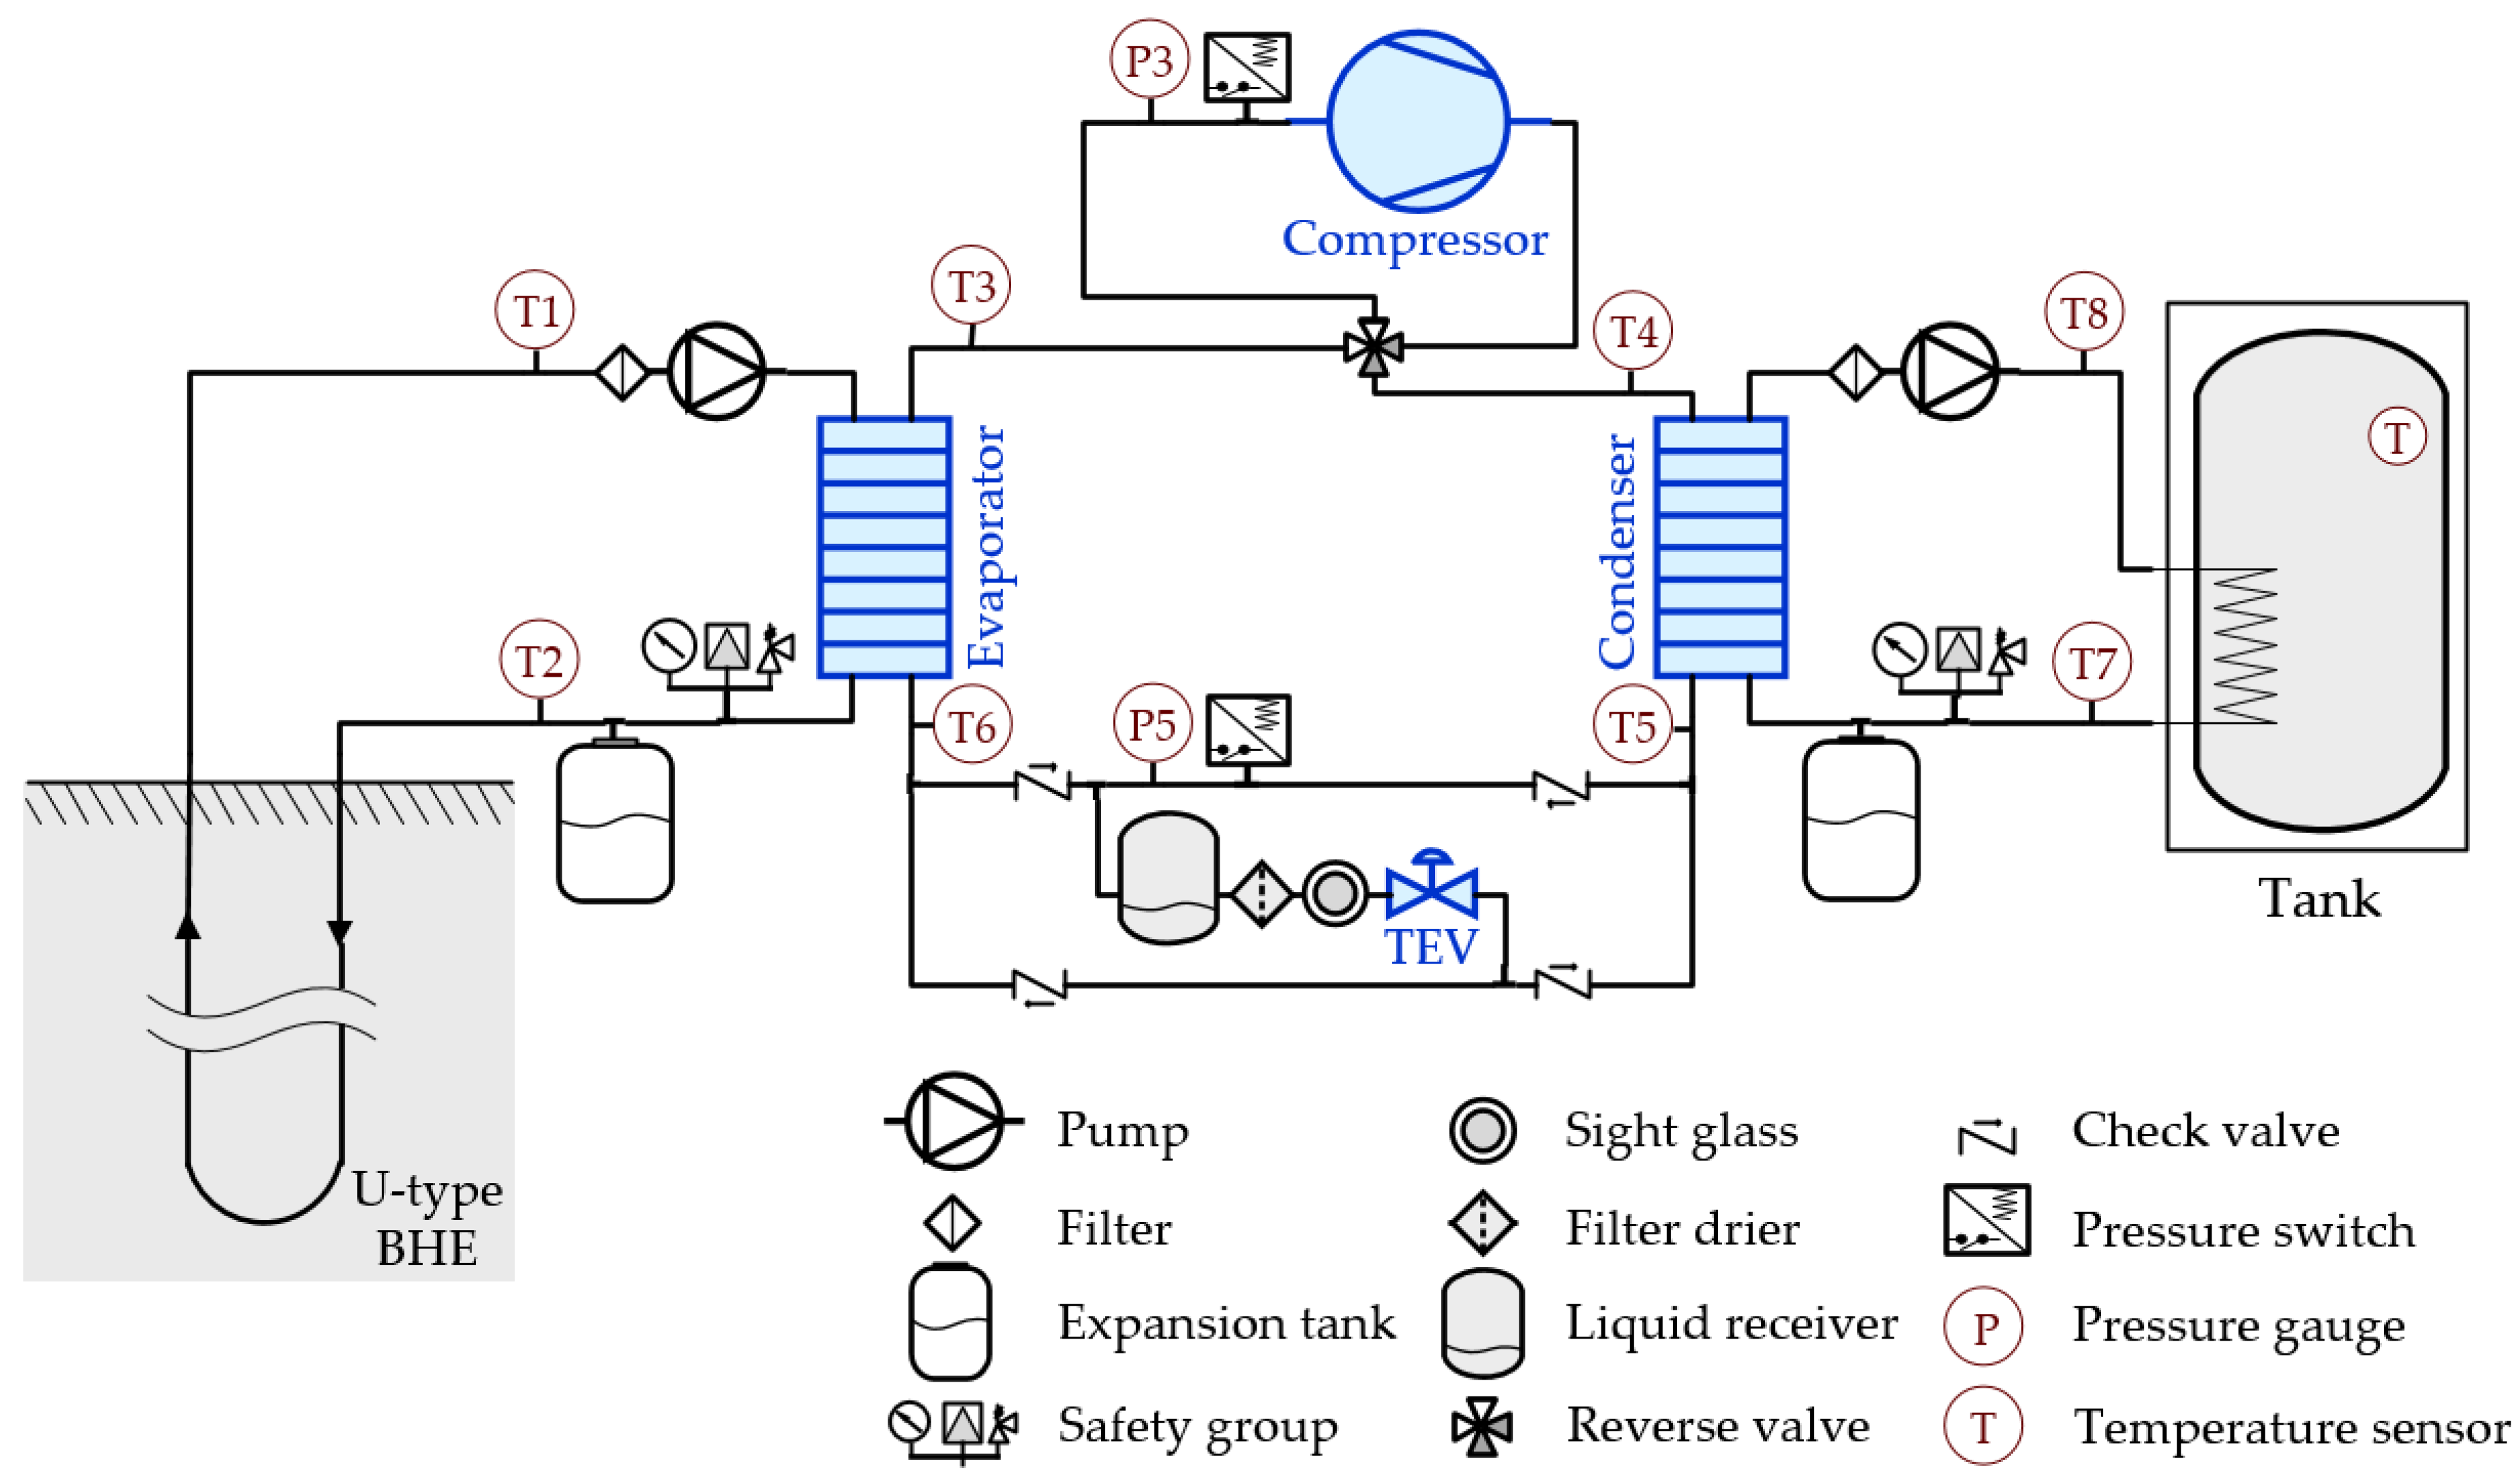
The measurements were carried out using the measuring devices shown in
Figure 2. As seen from
Figure 2, temperature and pressure sensors are installed at the nodal points of the GSHP. In addition, in the hydraulic loops between BHE and the evaporator, as well as between the condenser and the water storage tank, liquid flow meters are installed. The observations are depicted in
Figure 4,
Figure 5,
Figure 6,
Figure 7 and
Figure 8 for the water heating in the storage tank.
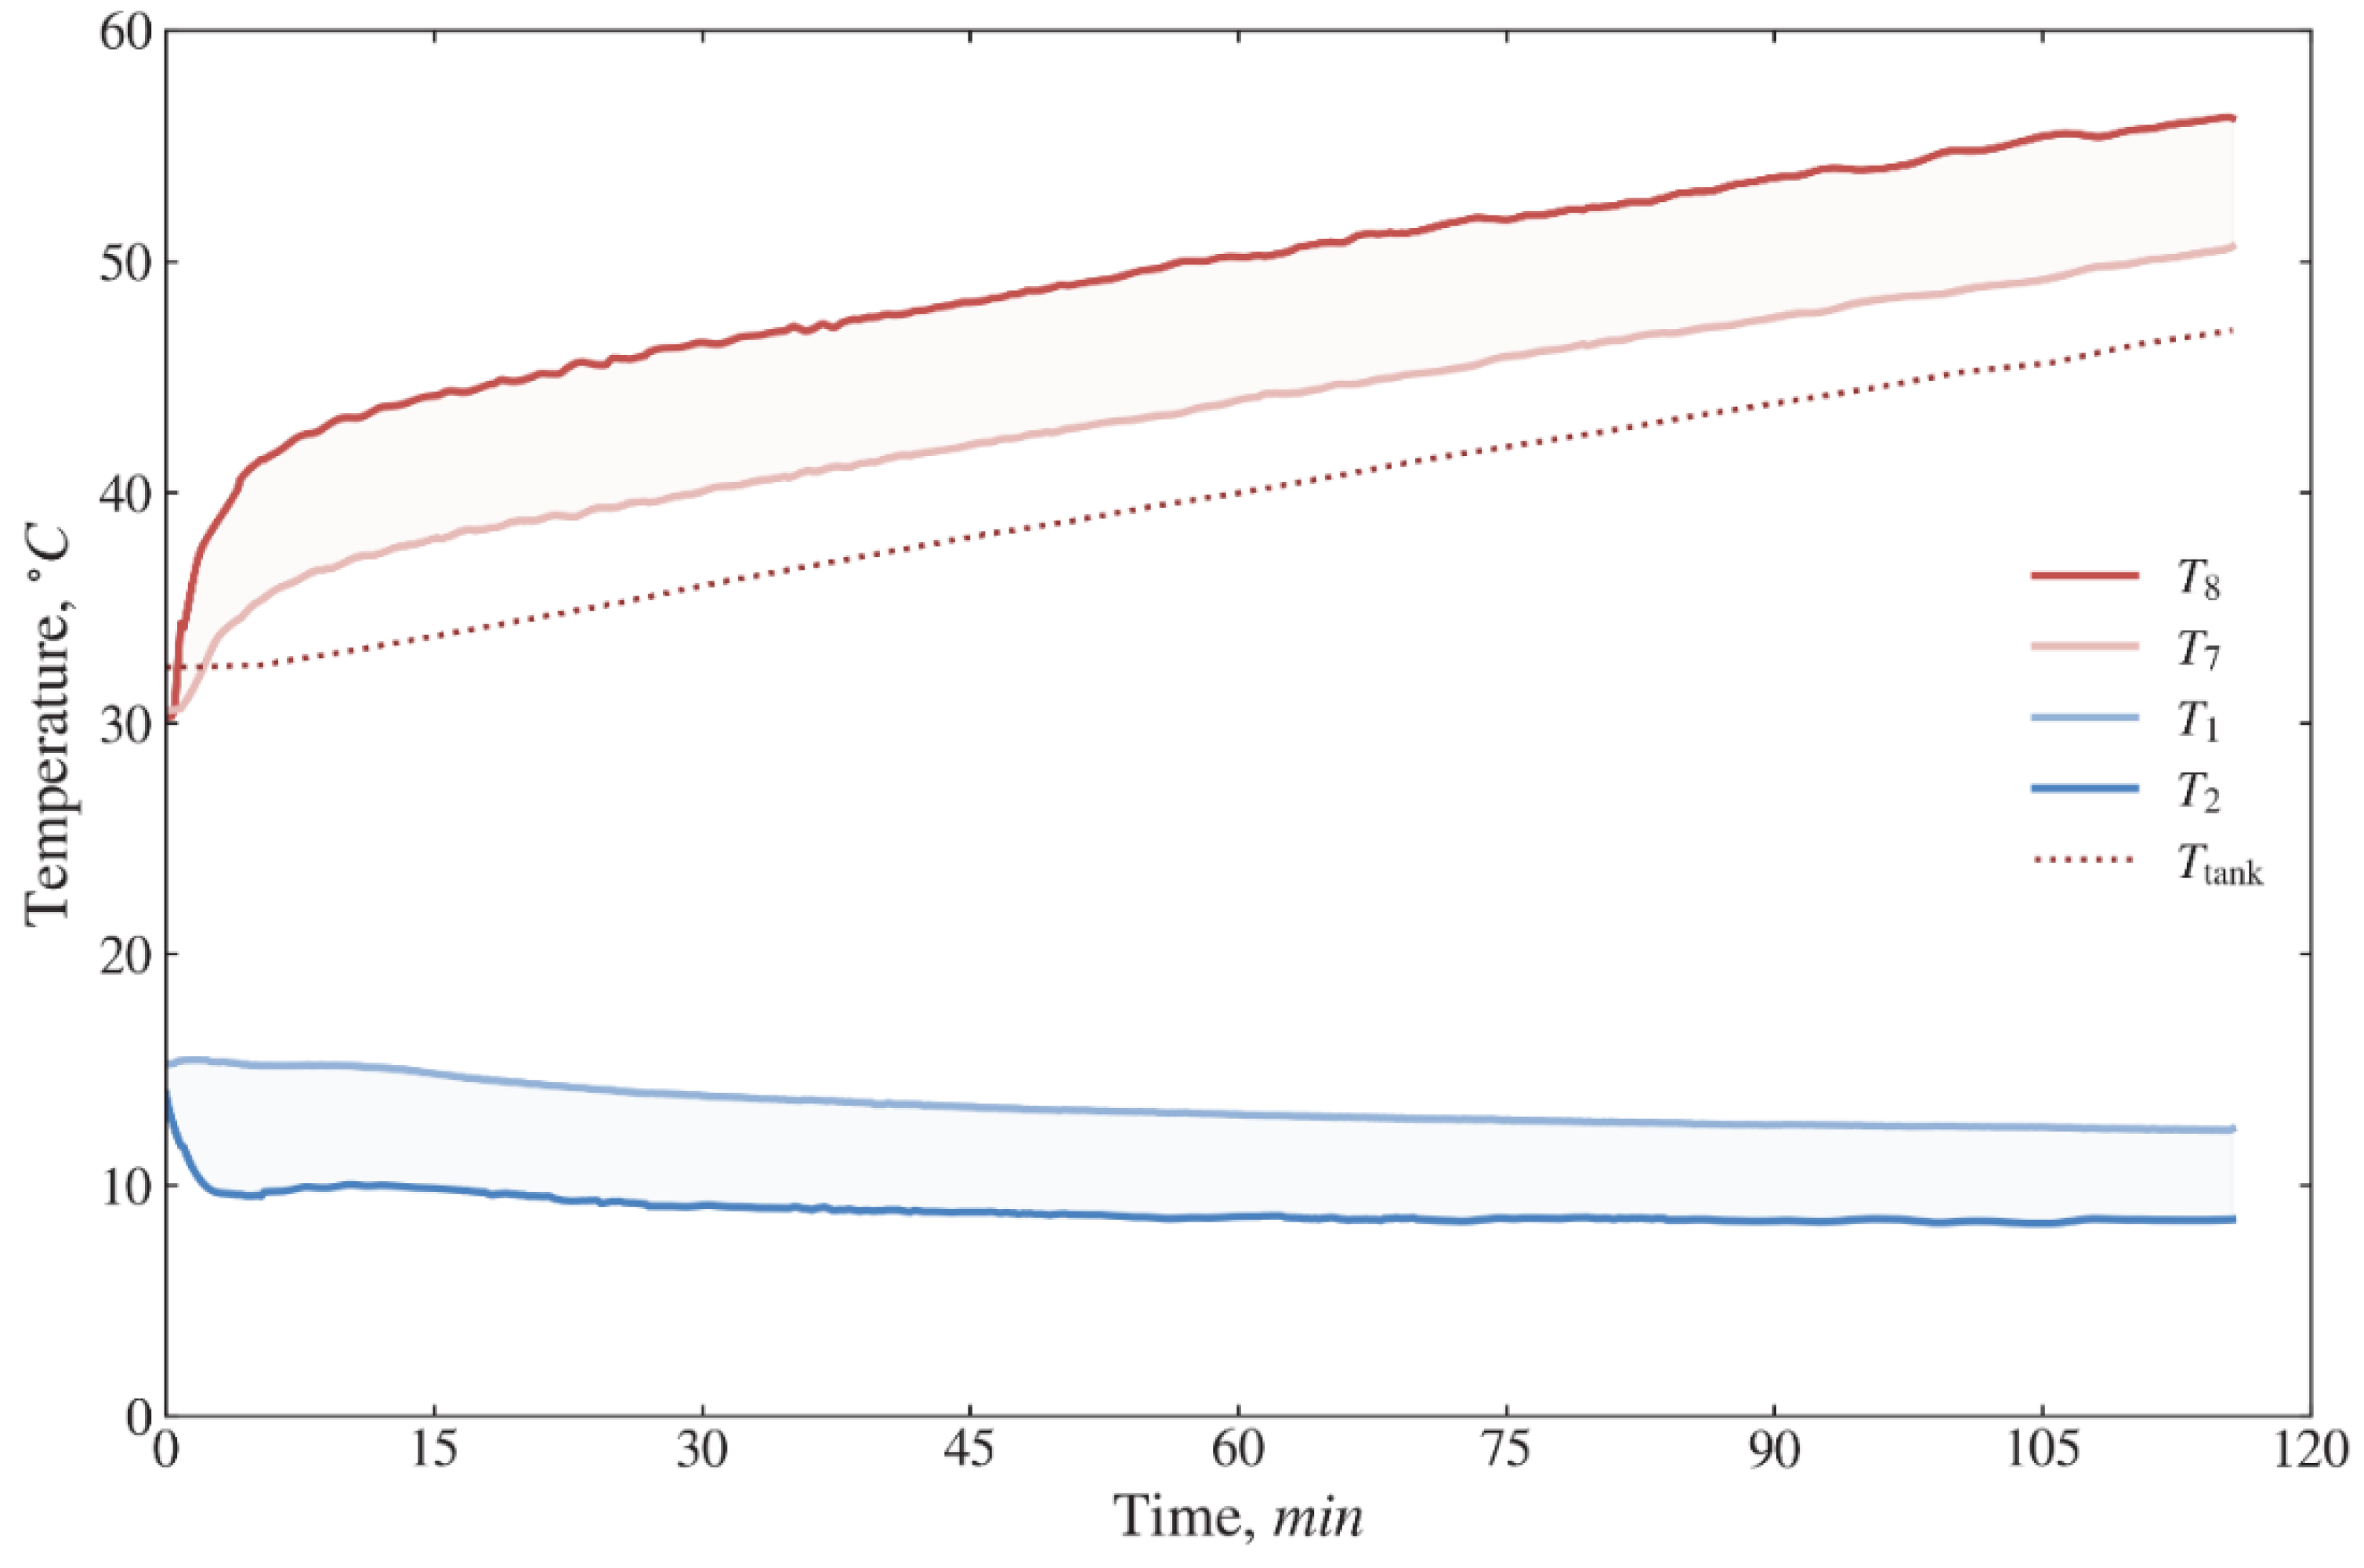
Figure 4 and
Figure 5 show the measurement data of a single experiment for the temperatures of the HTF and refrigerant R134a ( see the nodal points shown in
Figure 2).
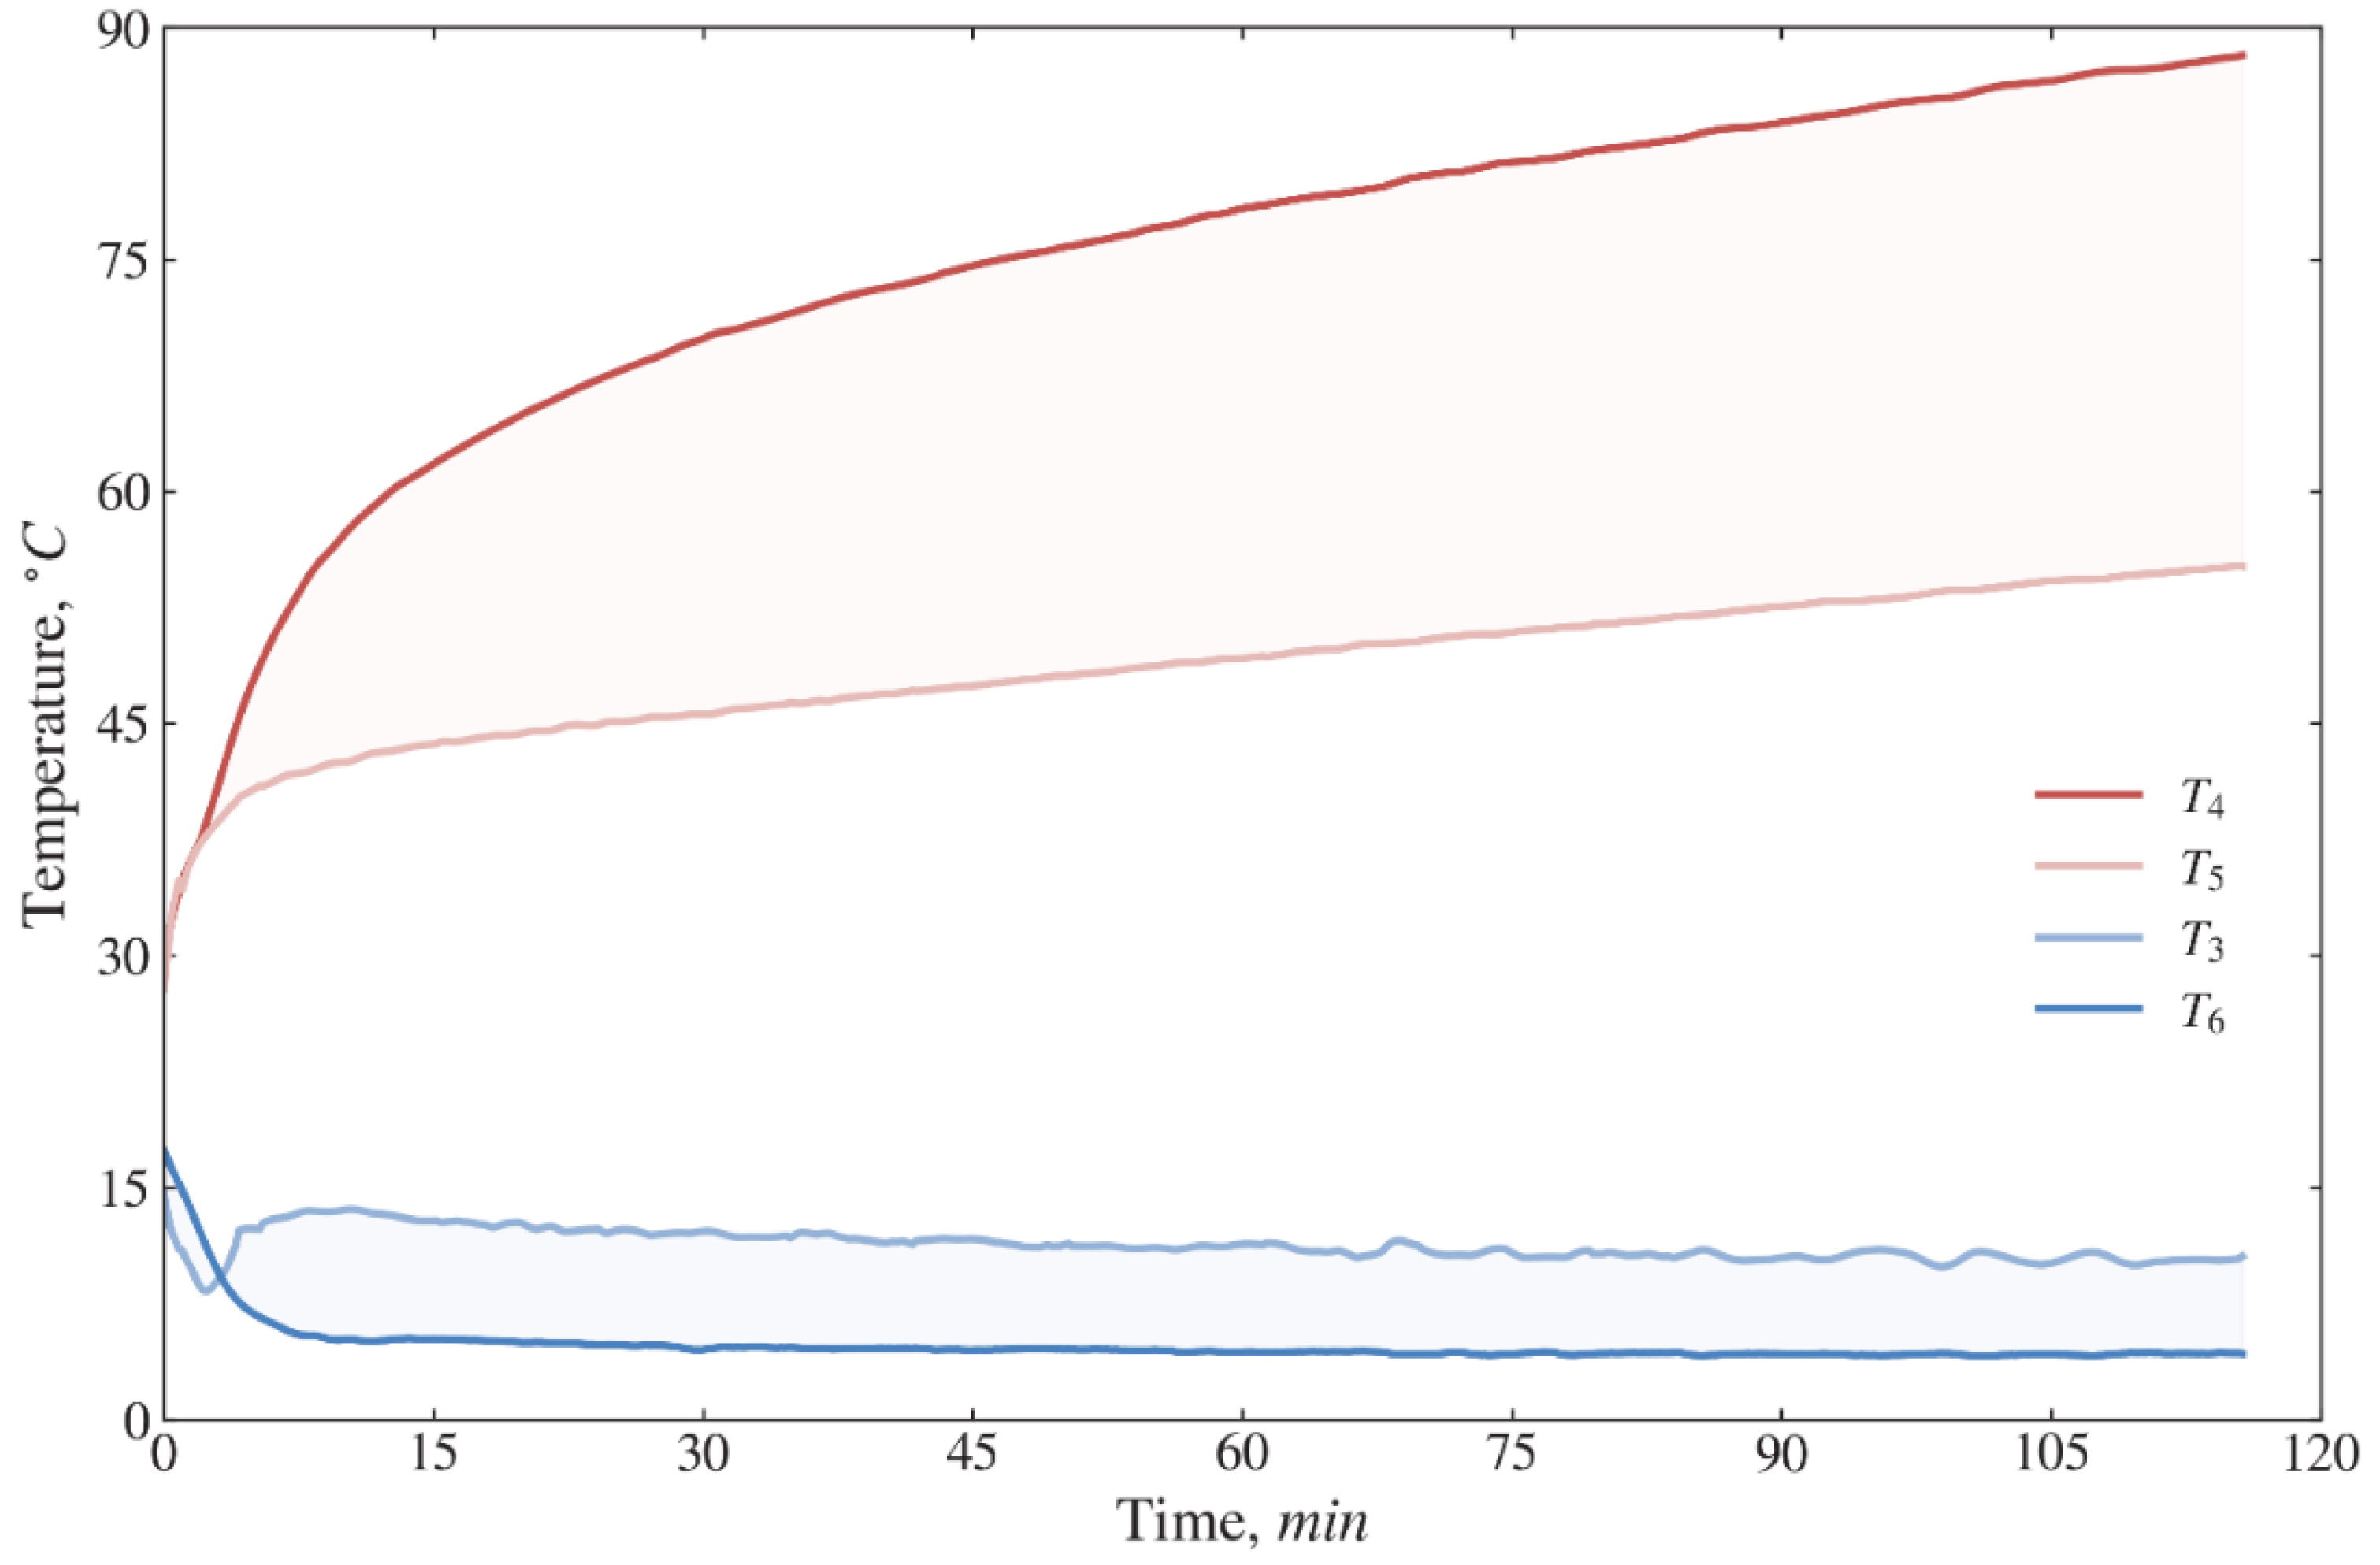
Figure 4 shows the results on changes in the water temperature in the tank. For two hours of operation of the GSHP, after establishing the vapor compression cycle operation (≈10 min) the temperature range for
is 15.2–12.4 °C,
is 10–8.5 °C,
is 37–50.6 °C,
is 43.2–56.2 °C, while the temperature of the water in the tank rises from 33 °C to 47 °C. As shown in
Figure 5, the temperatures of refrigerant R134a at the nodal points of the vapor compression heat pump cycle vary in the following ranges:
= 13.6–10.6 °C,
= 57–88 °C,
= 42.5–55.2 °C,
= 5.2–4.3 °C.
To describe the operation of GSHP, as indicated in the diagram of
Figure 2 and in the thermodynamic model (1)–(35), the temperature of the HTF
was taken as the source temperature
, while the temperature
was taken as the sink temperature
. All measurements and calculations were obtained for
values in the range of 40–50 °C. The results of several experiments on
and
are presented in
Figure 6 and
Figure 7, respectively.
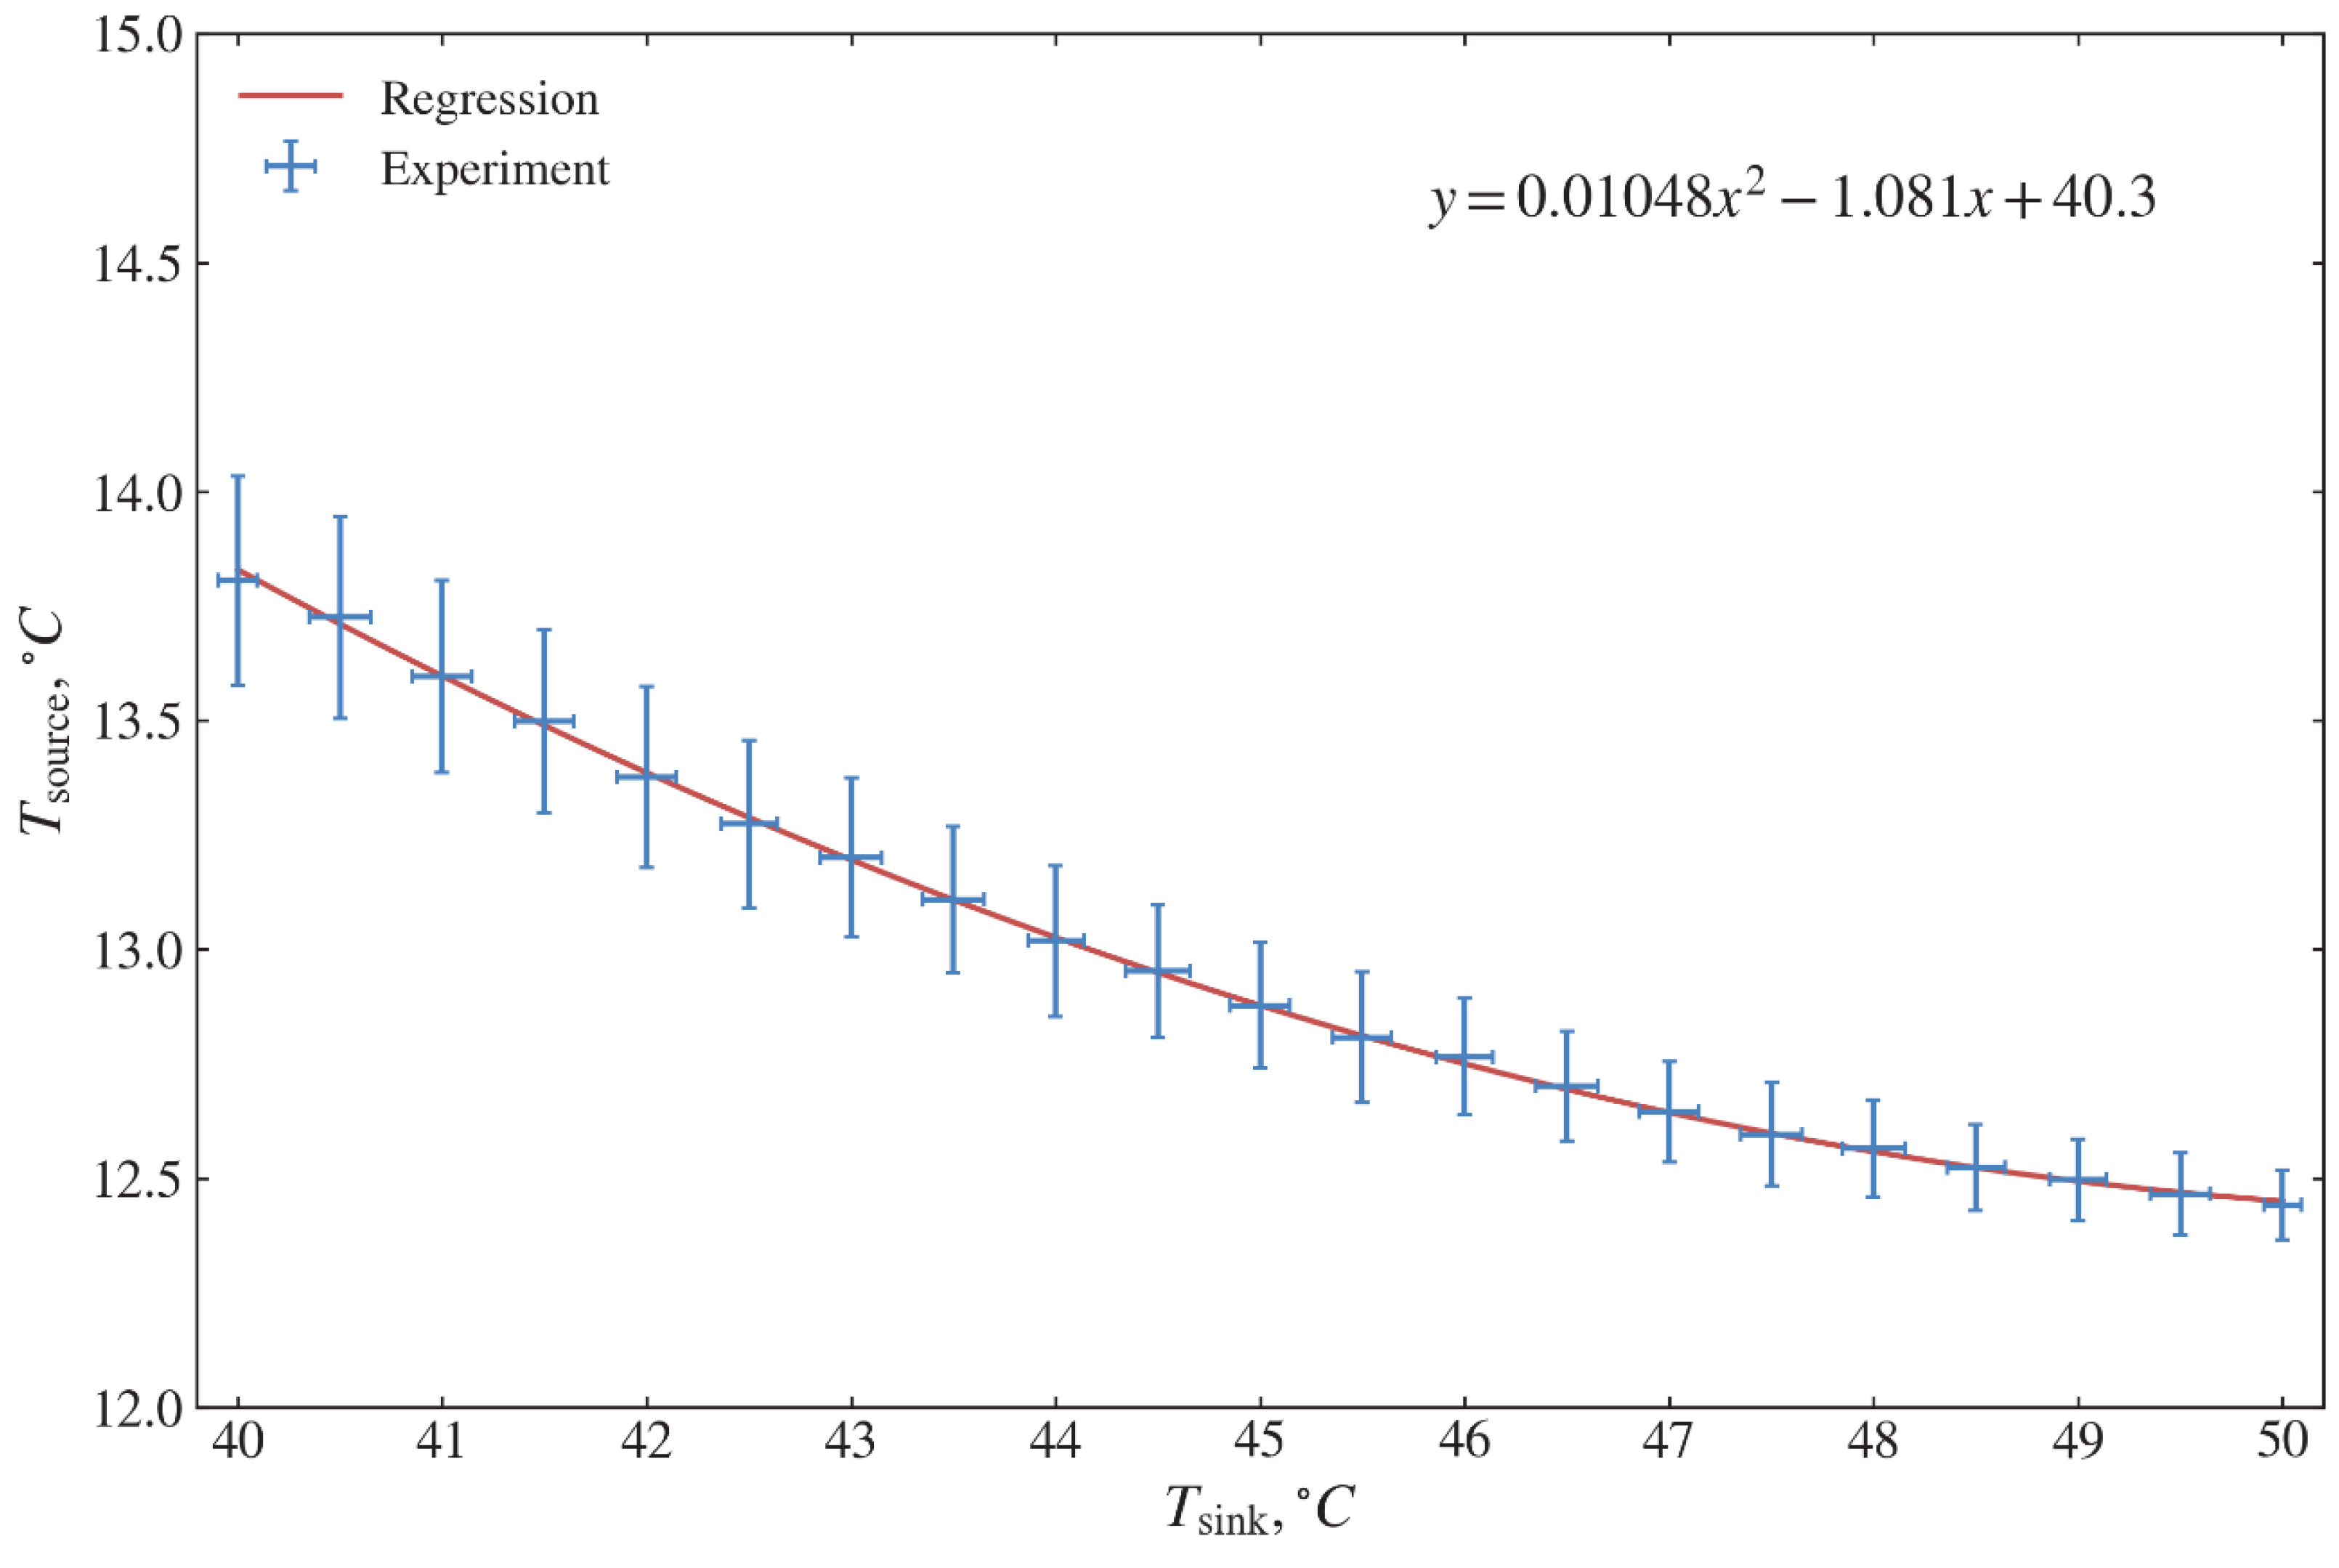
As shown in
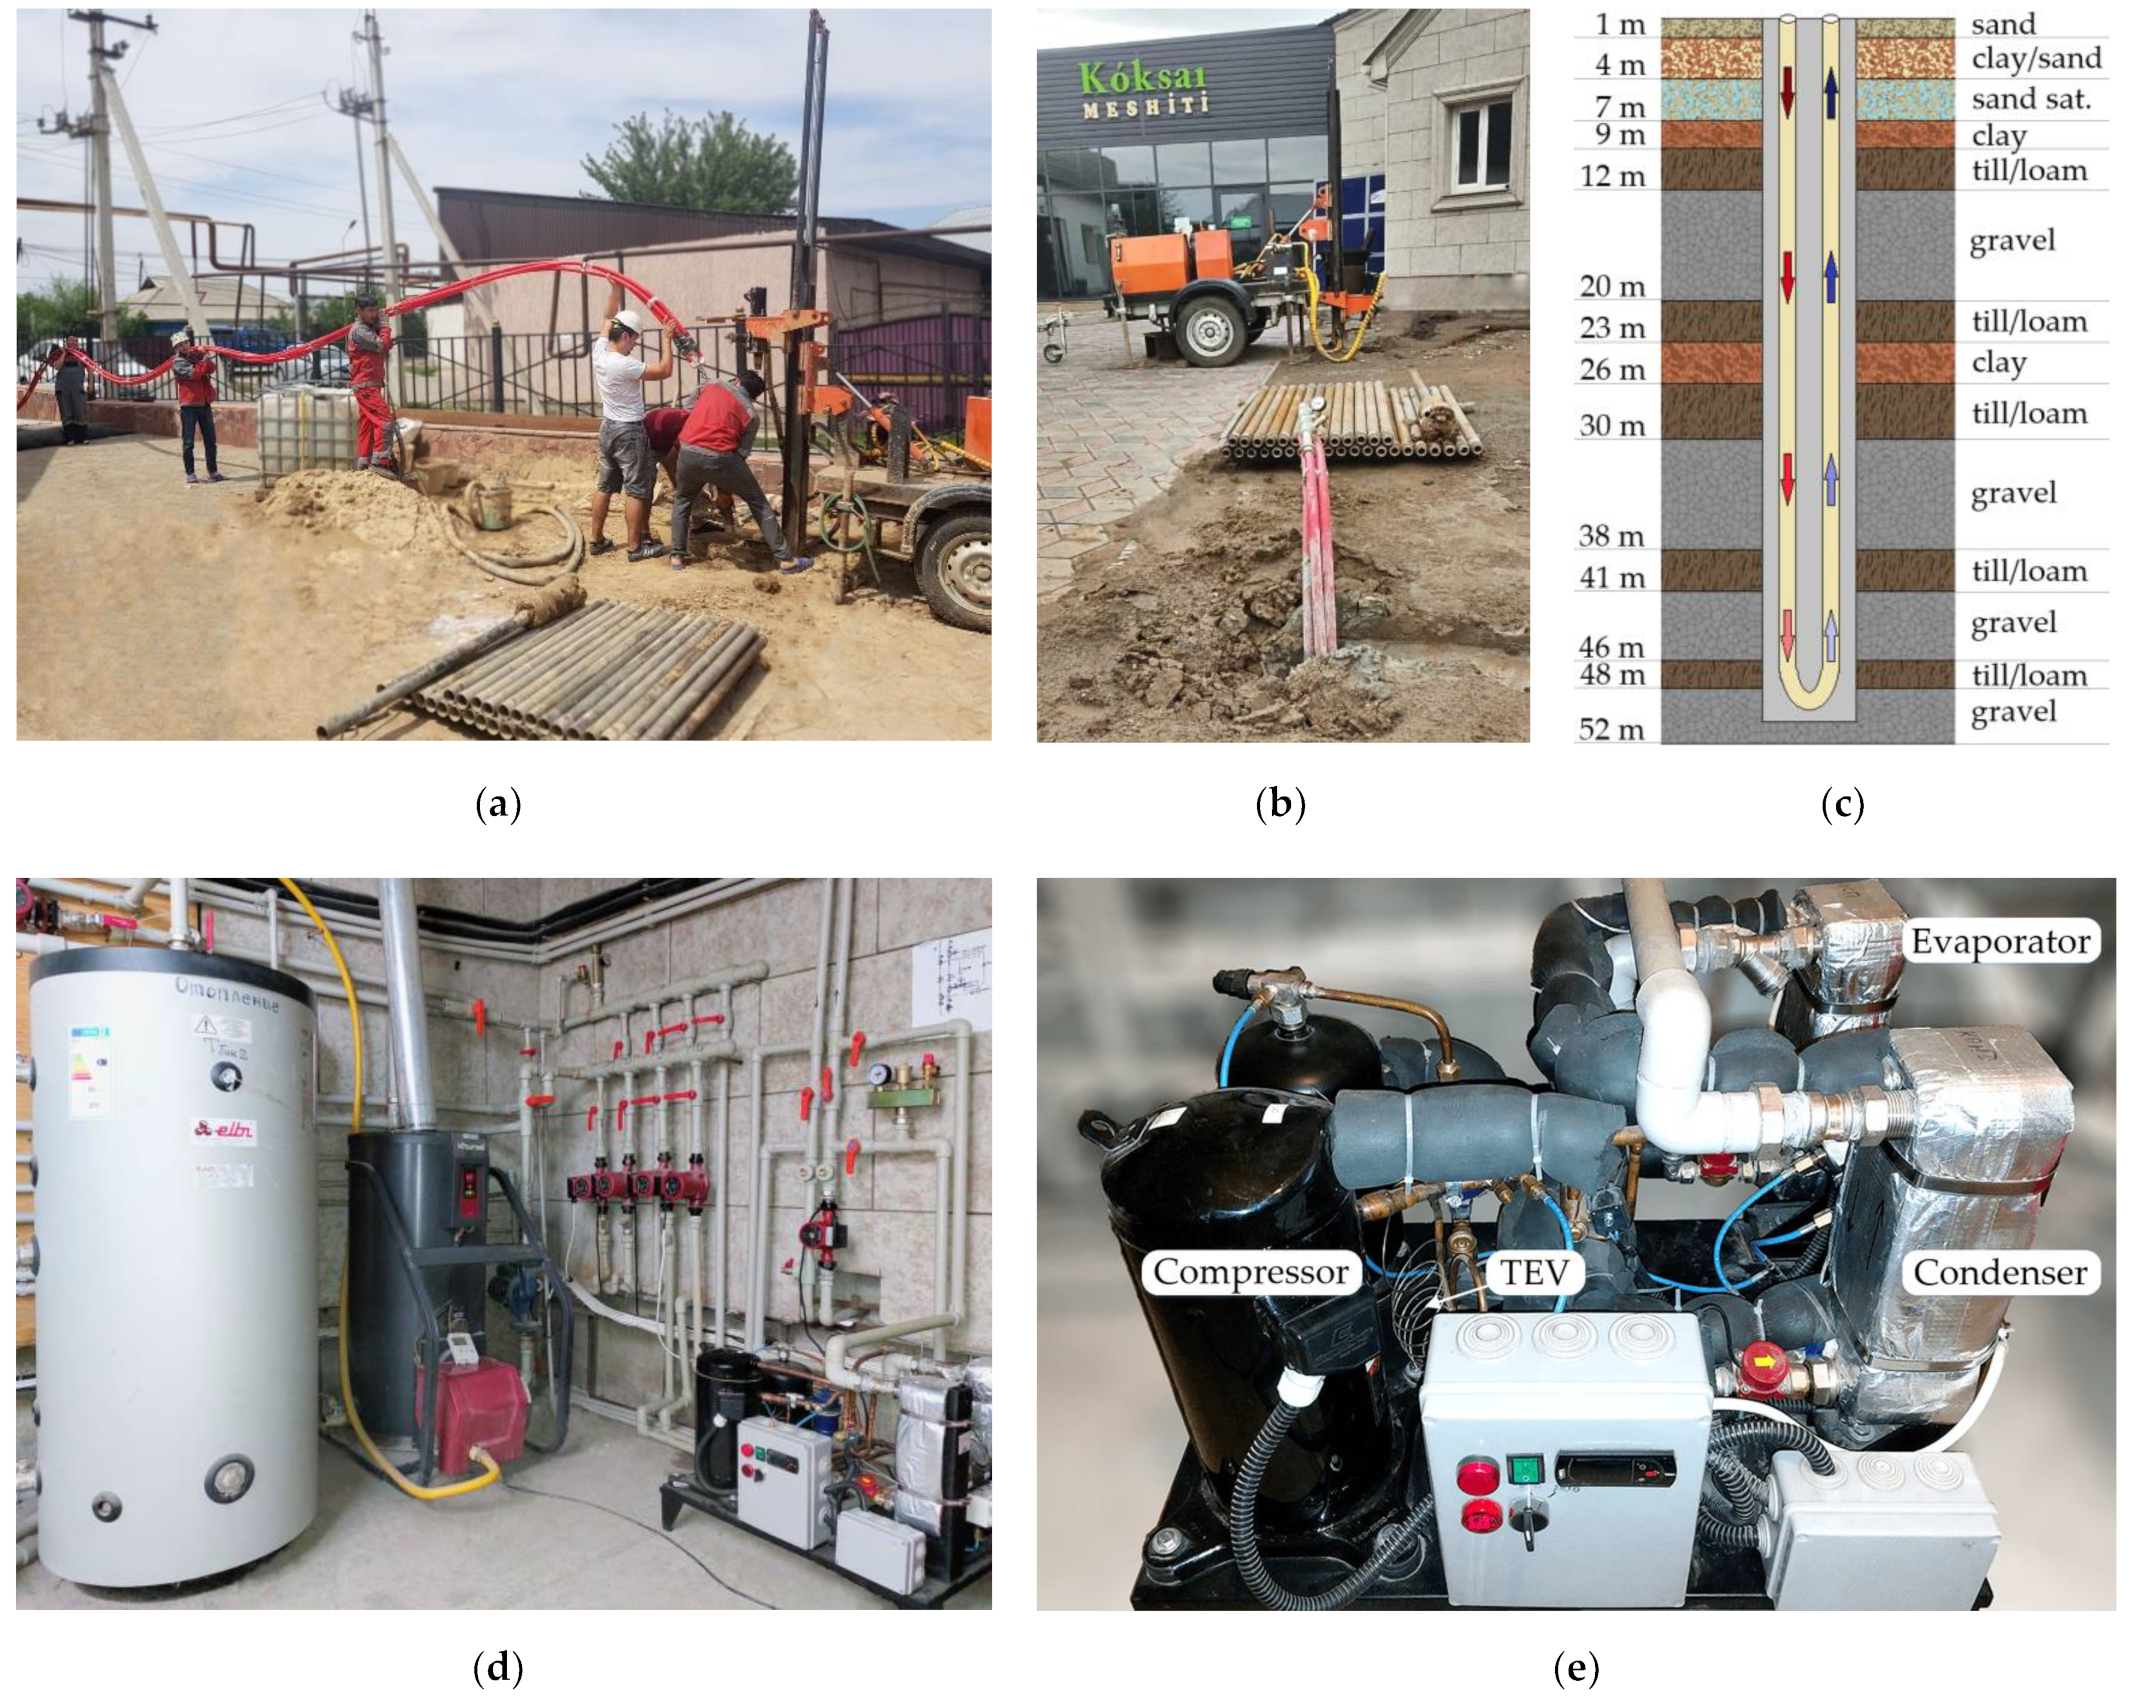
Figure 6, the source temperature changes from 12.45 °C to 13.83 °C. The ground type of the local terrain is mainly composed of gravel and till/loam. For the specified type of ground, the operation of the constructed GSHP gives the specified regression dependence between two temperatures, which is then used for validation (see
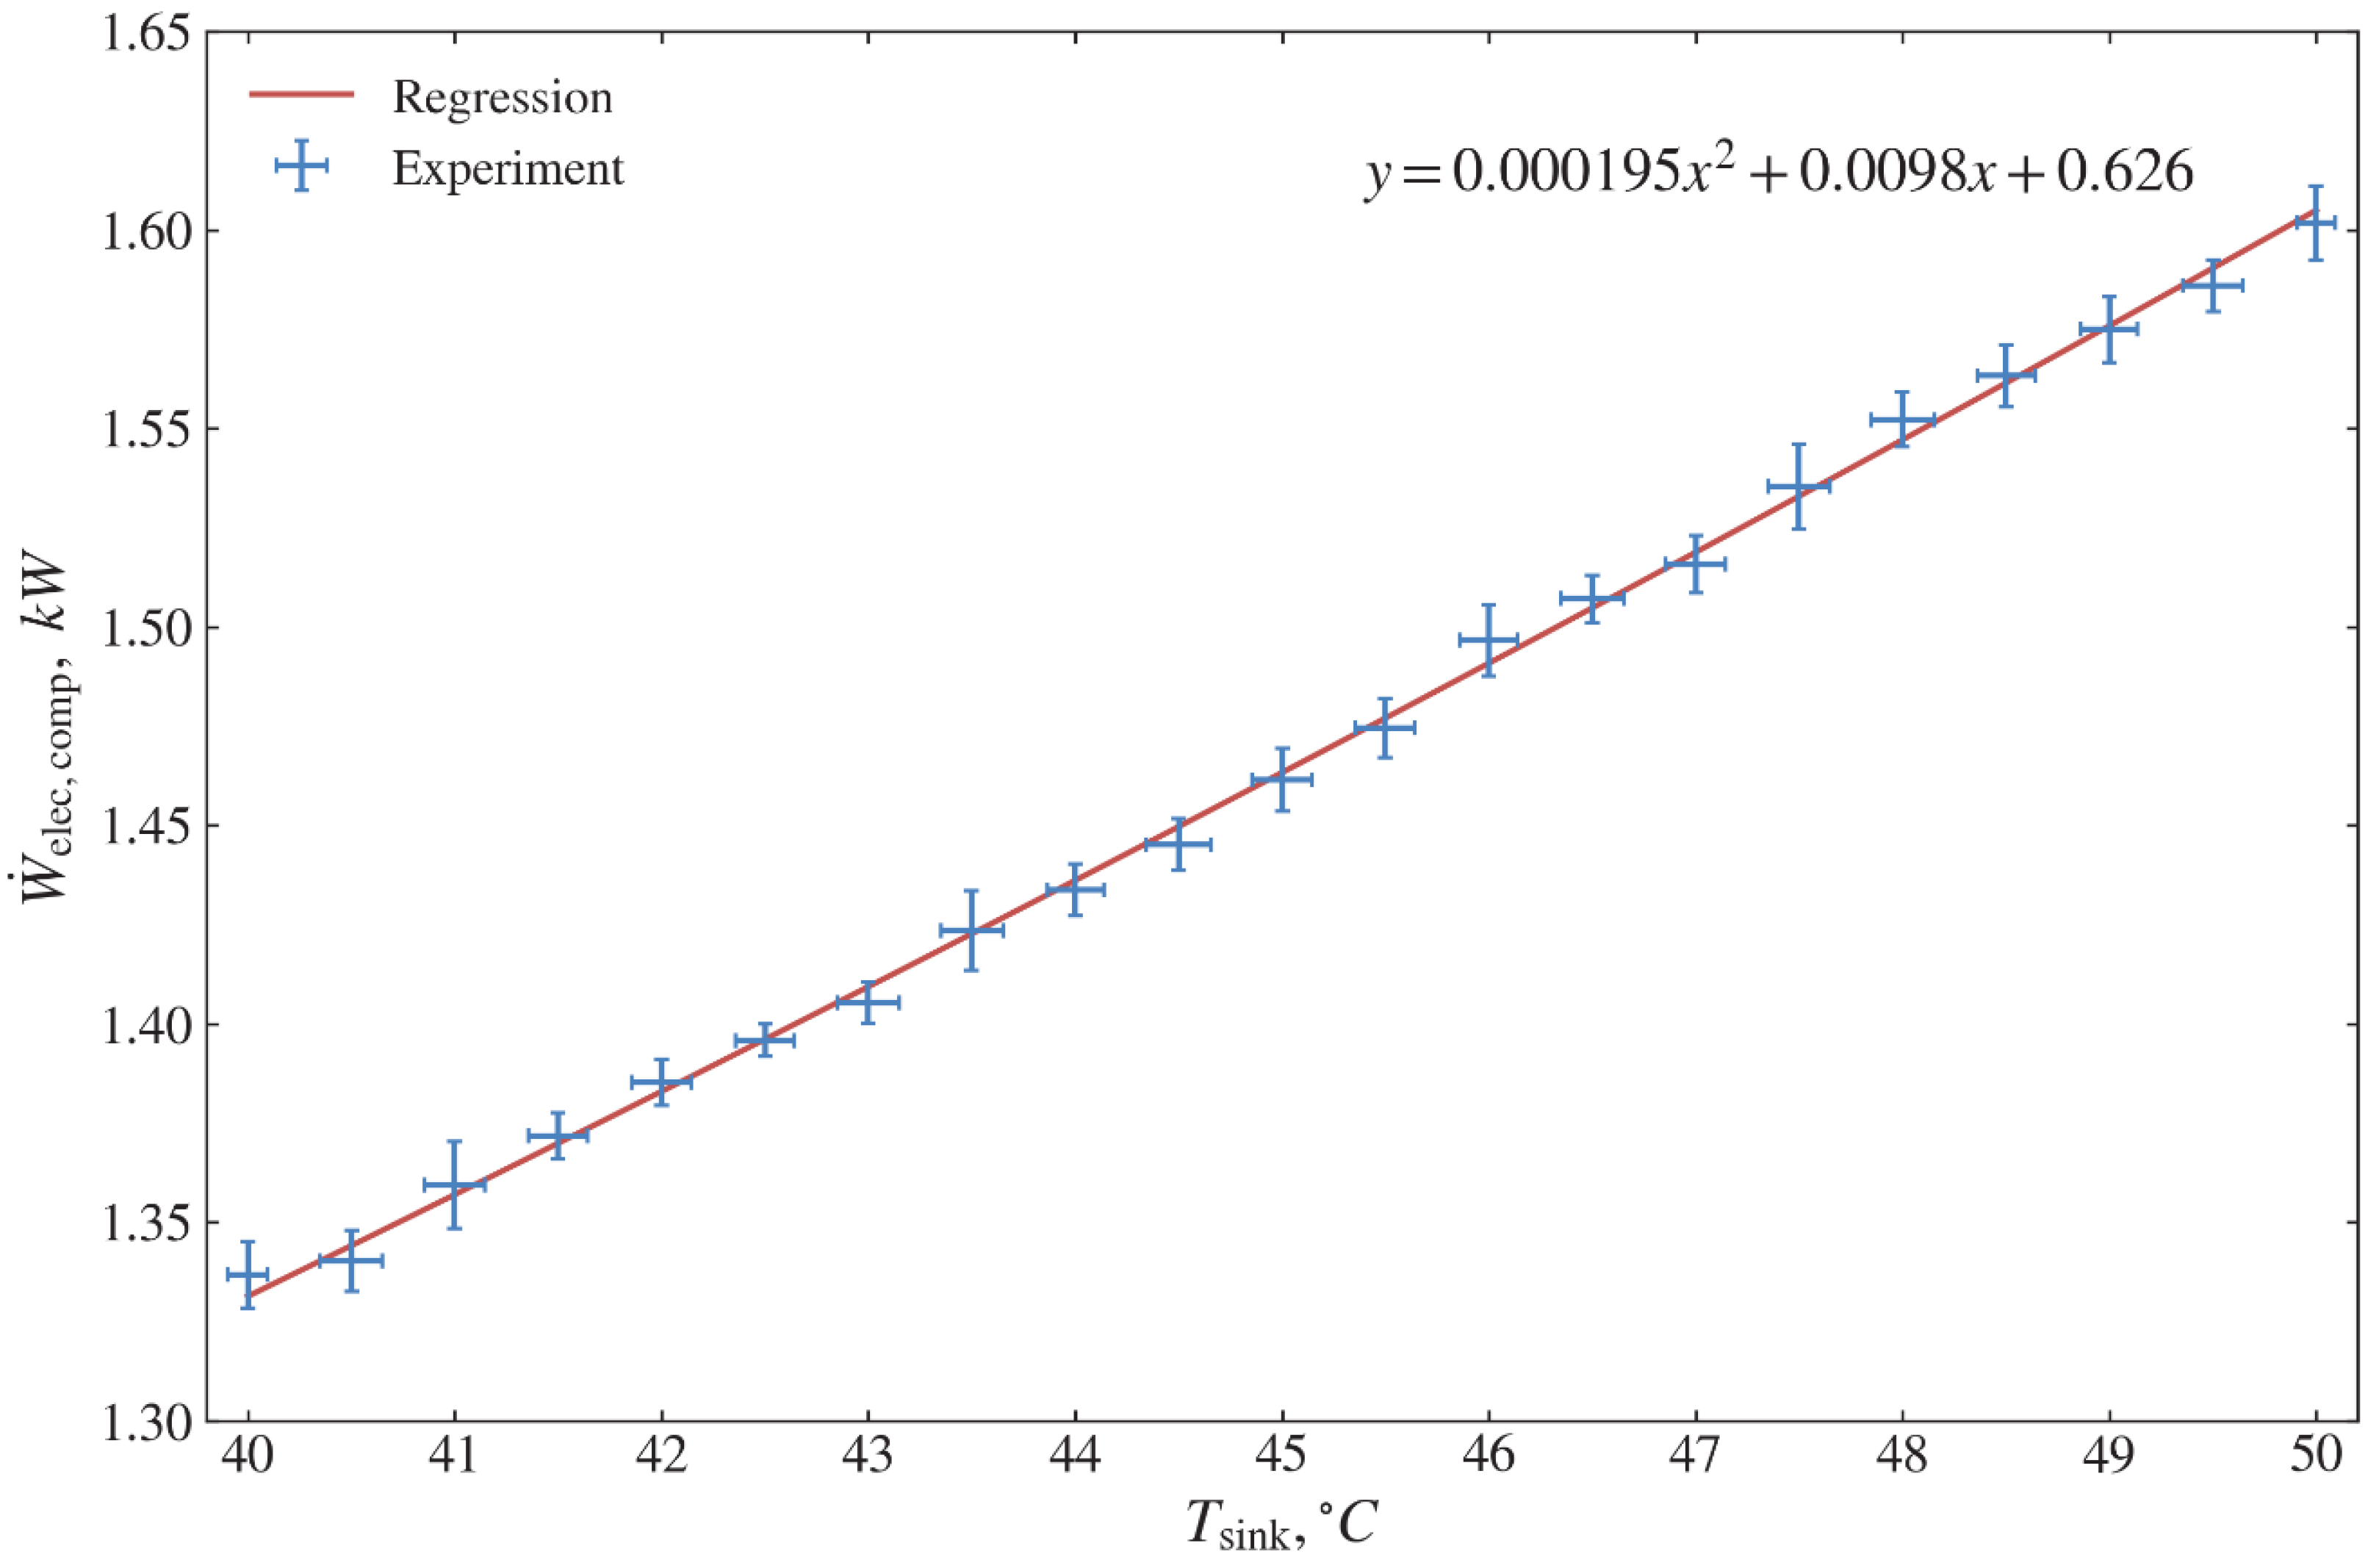
Table 4). A similar relationship for measuring the compressor electricity consumption
is shown in
Figure 7.
is in the range of 1.33–1.61 kW.
Furthermore, to compare the measured and calculated results, the following parameters such as superheating
, sub-cooling
, evaporator approach temperature
, and condenser approach temperature
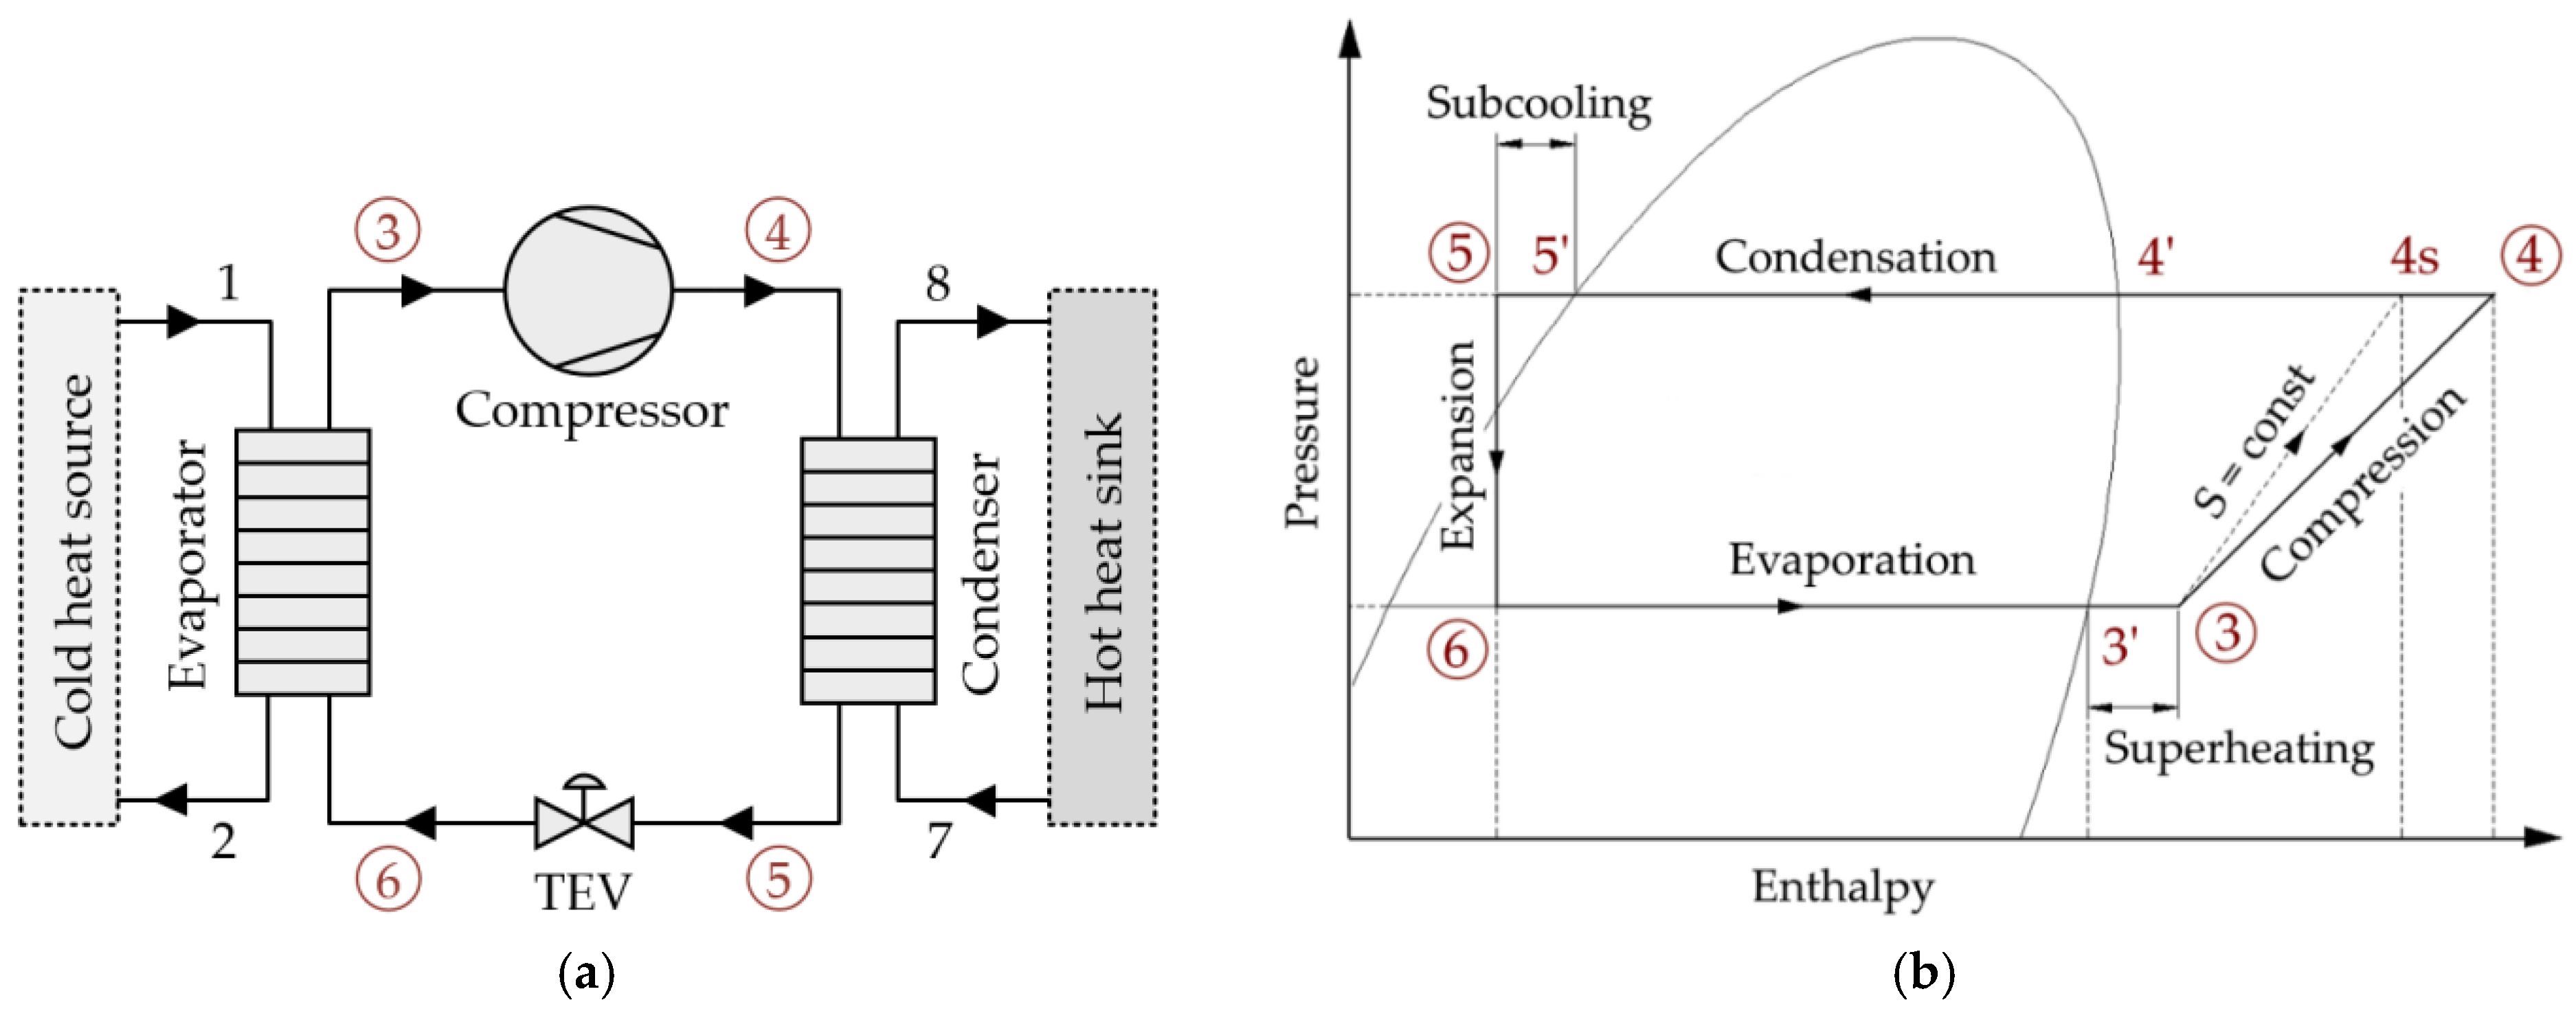
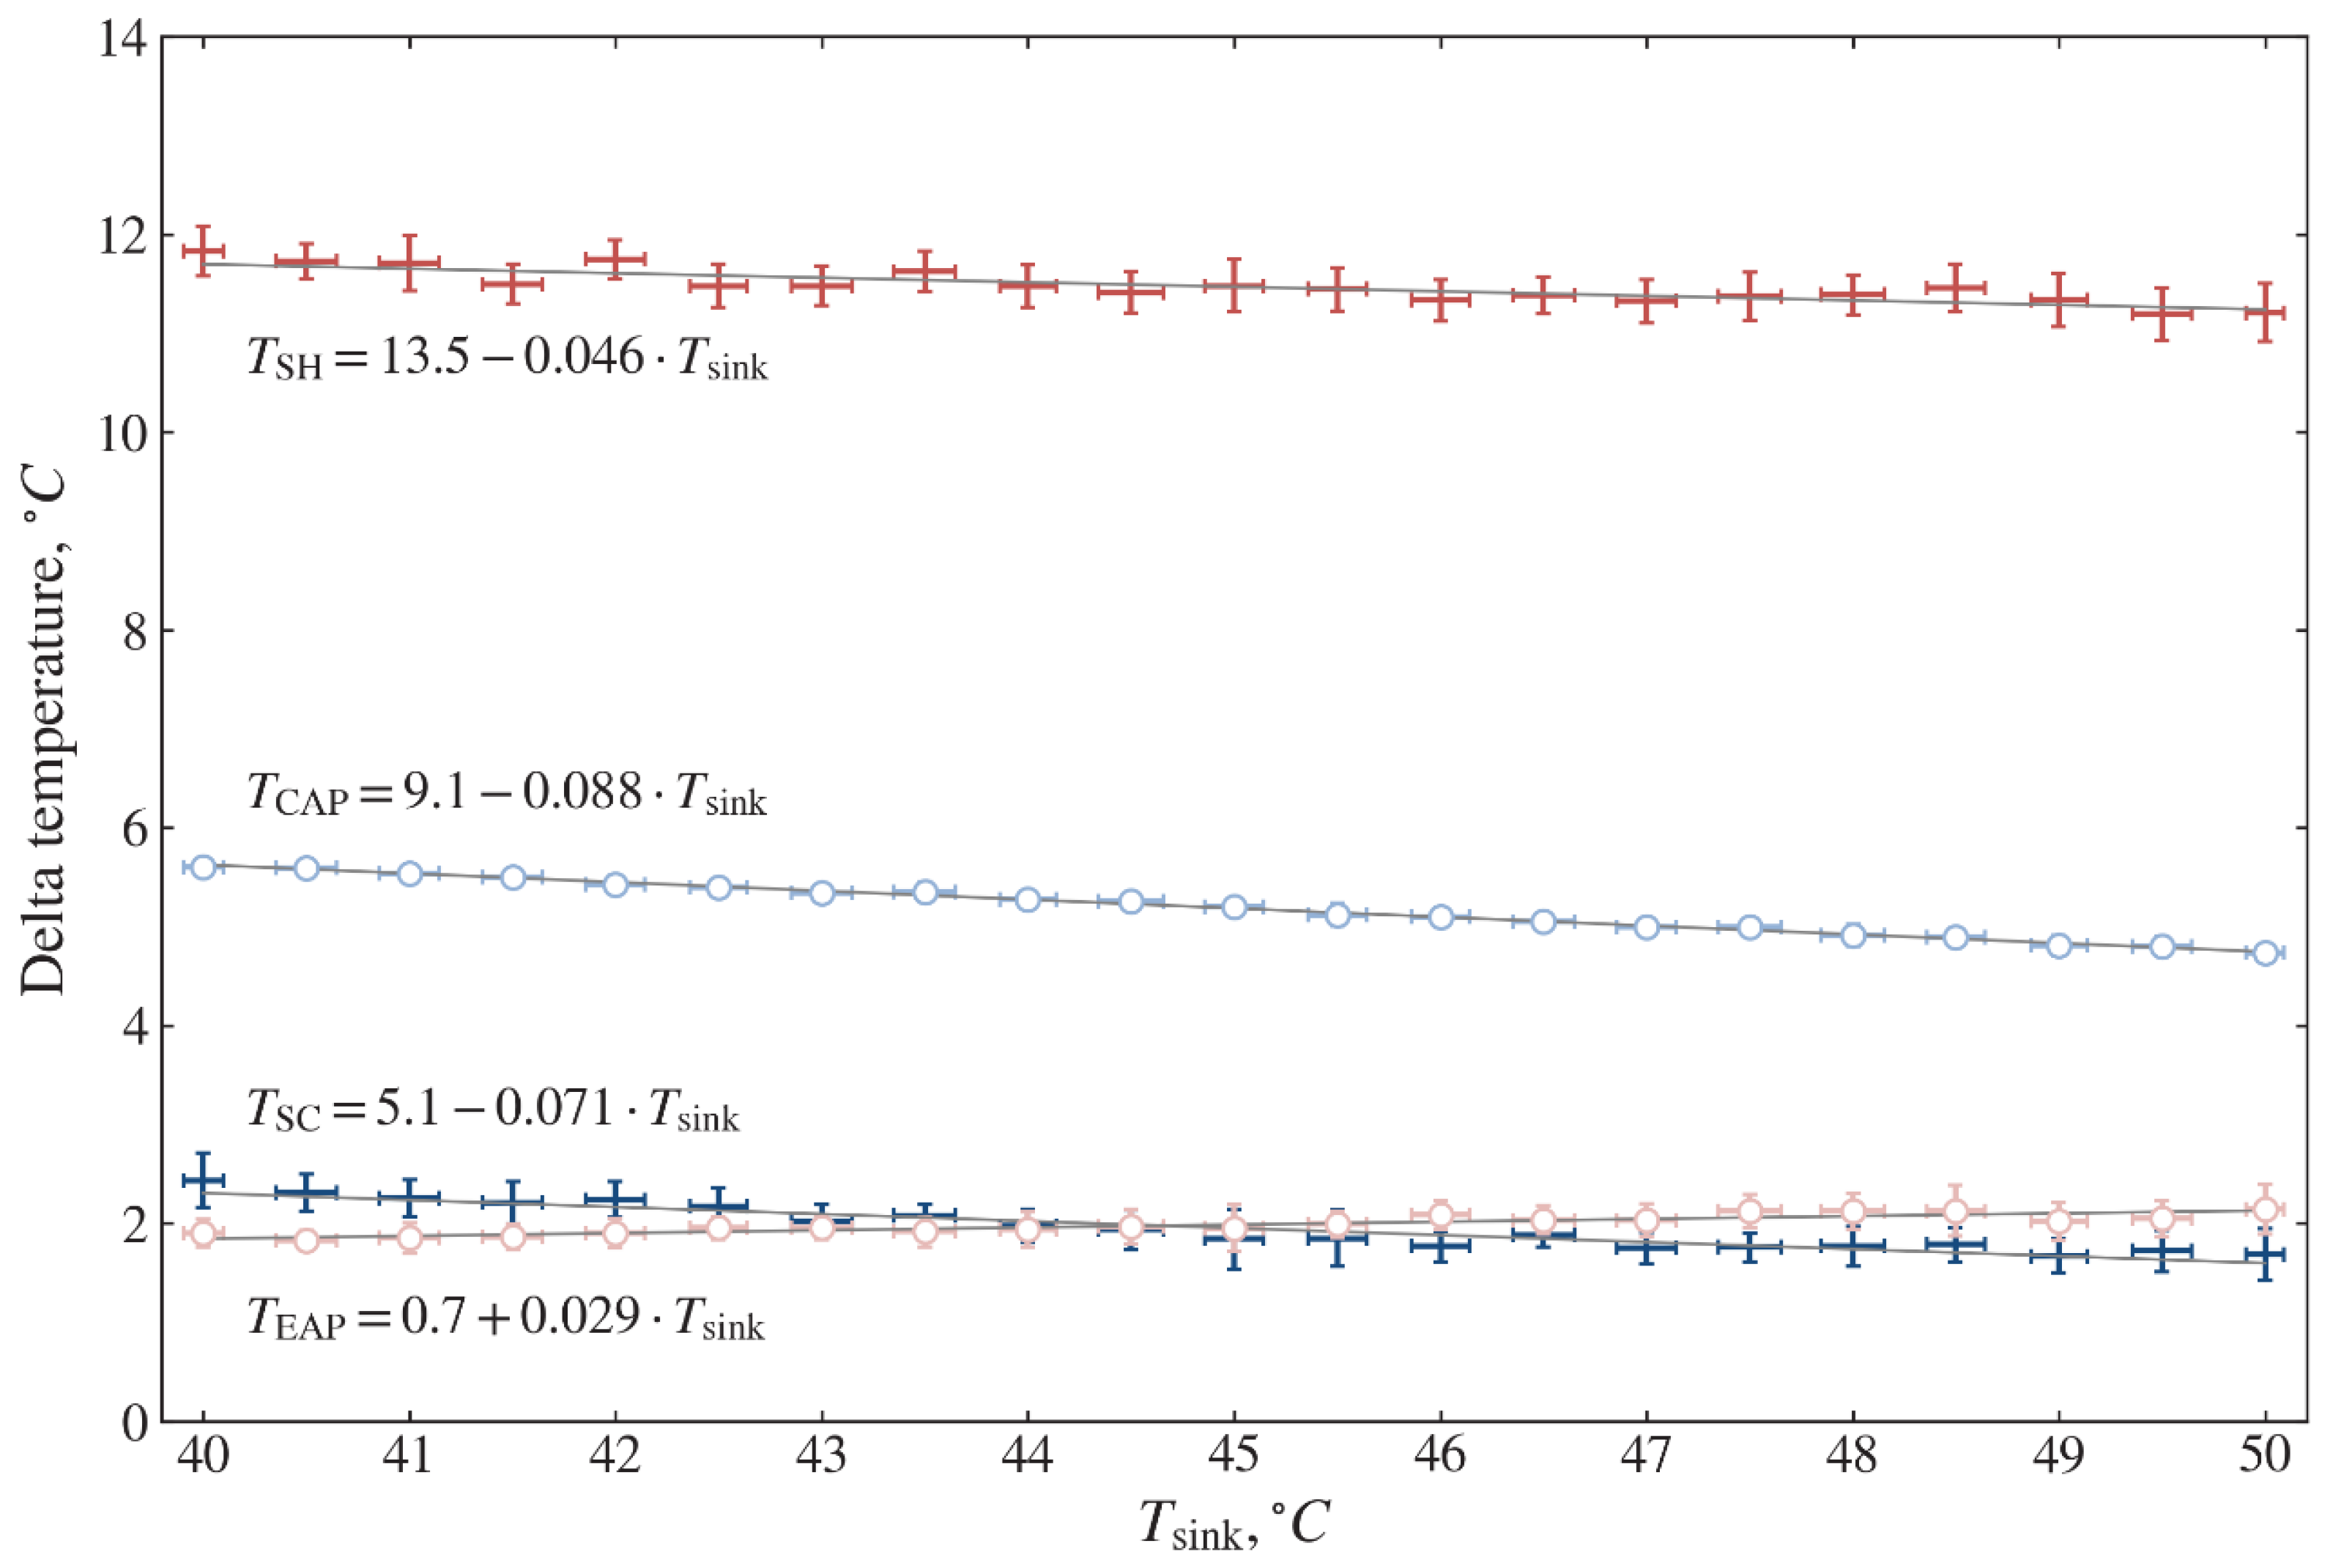
are used and encountered in Equations (1) and (10). Based on the superheating and sub-cooling results, the operation of the vapor compression heat pump system, the amount of refrigerant mass charge in the system, and the thermostatic expansion valve, adjustments are ascertained.
Figure 8 shows the calculated values of
,
,
, and
based on temperature measurements. For these parameters, linear regression dependencies are found. The values are in the ranges of
= 11.2–11.7 °C,
= 1.6–2.3 °C,
= 1.8–2.1 °C,
= 4.7–5.6 °C. These values are used for validation (see
Table 4).
4.2. Thermodynamic Model Validation
This subsection contains the comparison of experimental and theoretical results on temperatures in the heat pump cycle, evaporator, and condenser heat fluxes,
of the cycle and system. For the thermodynamic calculations based on Equations (1)–(18), the parameters indicated in
Table 4 are taken. The theoretically predicted thermodynamic performance results are compared with experimental results for validation.
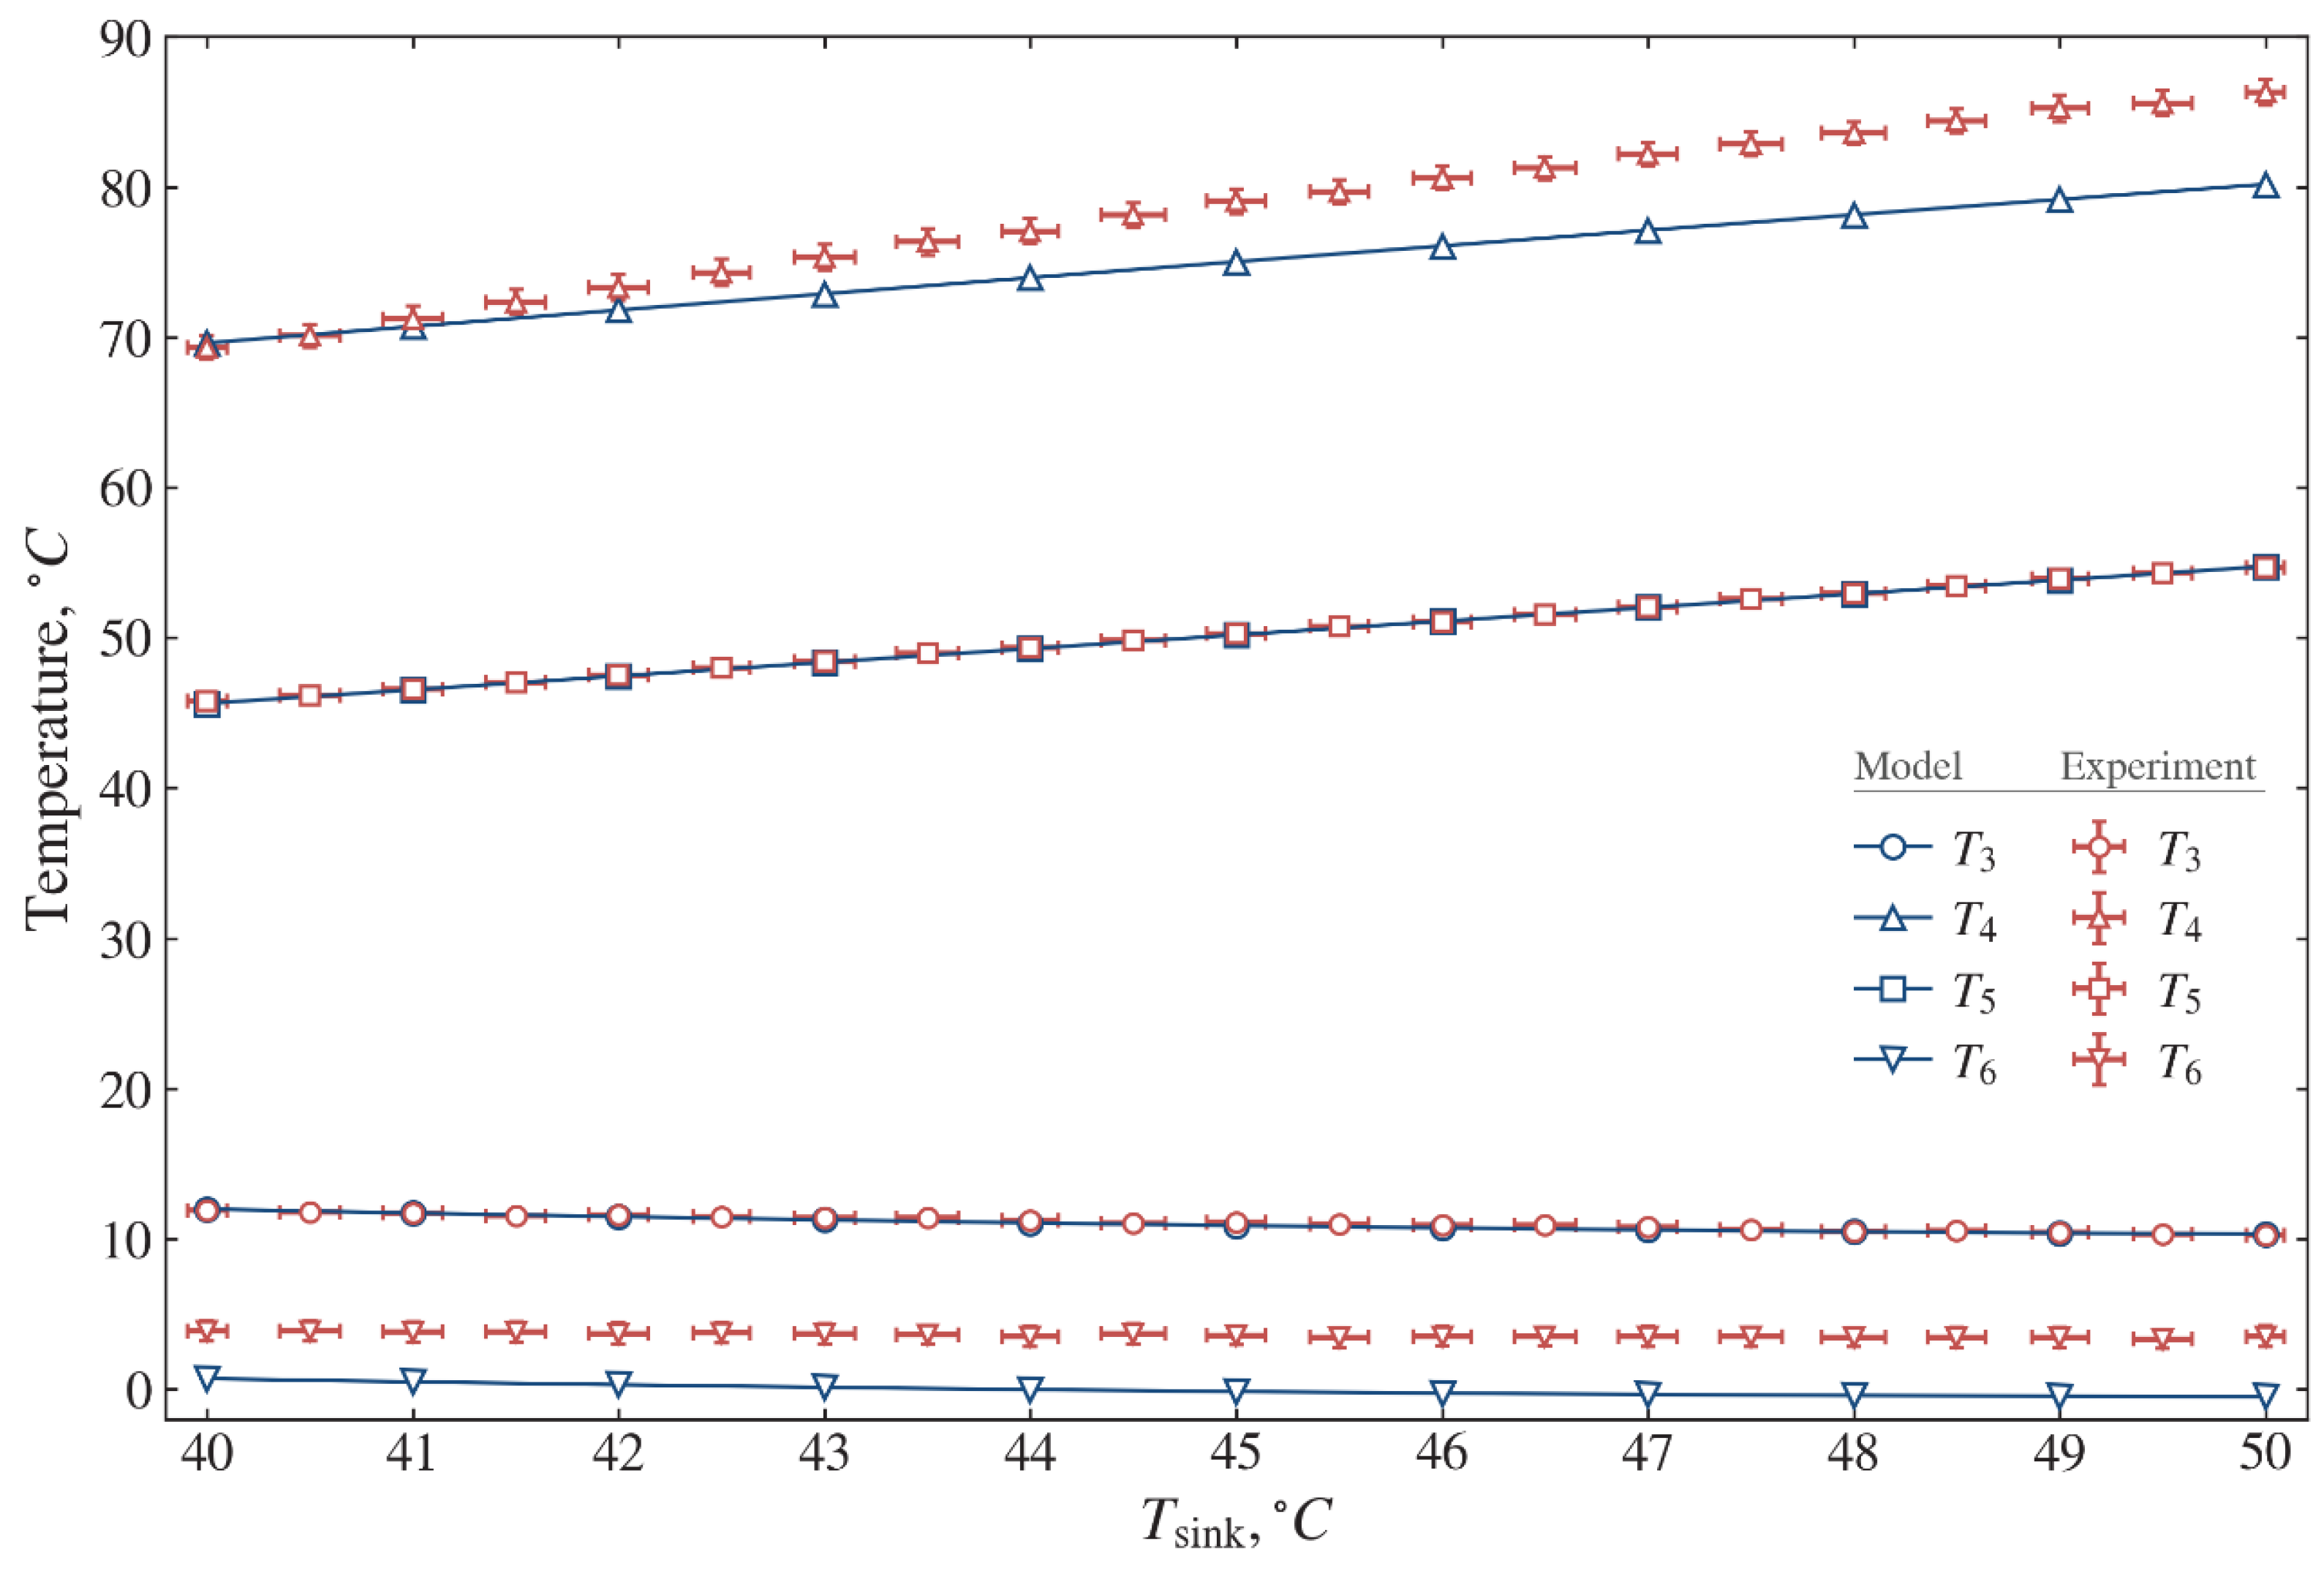
Figure 9 illustrates the temperature at typical nodal points as the function of the sink temperature
. The experimental and calculated values of the refrigerant temperatures at the compressor suction line
, as well as at the condenser outlet
, are in very good agreement. The temperature difference at the evaporator inlet
is 3.16–4.01 °C with an average value 3.66 °C. The difference at the compressor discharge line
is 0.06–6.12 °C. This difference between the experiment and the model is because the model does not consider the presence of a four-way reverse valve.
Figure 10 shows comparisons of the predicted and measured heat capacities for the evaporator and condenser. The measured amount of useful heat
provided by the condenser is in the range of 3.59–3.96 kW, while the simulated values are in the range of 3.88–4.26 kW. The average systematic difference is 6.2%, which is equivalent to 251 W. Such a systematic difference is because the presented thermodynamic model does not consider pressure drops and heat losses. The experimental value of received heat by evaporator
is in the range of 2.73–3.31 kW, while the simulated values are in the range of 2.86–3.37 kW. The average systematic difference is 2.6%, which is equivalent to 79.6 W.
Figure 11 shows the comparisons of the predicted and measured
of the cycle and system with the temperature of the heat sink. The experimental values of
vary in the range of 2.24–2.97, while theoretical values calculated using Equation (16) vary in the range of 2.42–3.20. The average difference between the experimental and theoretical values is 6.2%. The experimental values of
vary in the range of 2.11–2.76, while the theoretical values calculated using Equation (17) vary in the range of 2.28–2.98. The minimum, maximum and average differences between the experimental and theoretical values are 4.9%, 7.5% and 6.2%, respectively. Therefore, the thermodynamic model developed in the present work is validated and can be used to further analyze the thermal performance of the GSHP system.
4.3. Thermodynamic and Environmental Calculations
Using the theoretical model, the thermodynamic performance of the heat pump is simulated for the environment friendly refrigerant options. The principle behind selecting alternative refrigerants is affordability, similar thermodynamic and thermo-physical properties, low
values, and non- or mild flammability.
Table 5 shows the thermodynamic properties of selected refrigerants in this work.
The thermodynamic analysis is performed using the model of Equations (1)–(35) and the operating conditions given in
Table 4. However, instead of the given input power consumption, a value of
= 5 kW is fixed as an input condition.
Figure 12 shows the relationship between
required of the system and the specific latent heat of vaporization of refrigerants. The highest value of the specific latent heat of vaporization corresponds to refrigerant R152a with the lowest value of
while the lowest value of the specific latent heat refers to refrigerant R1234yf with the highest value of
. As seen from
Figure 12, the refrigerant mass flow rate required with the increase in the specific latent heat of vaporization of refrigerants.
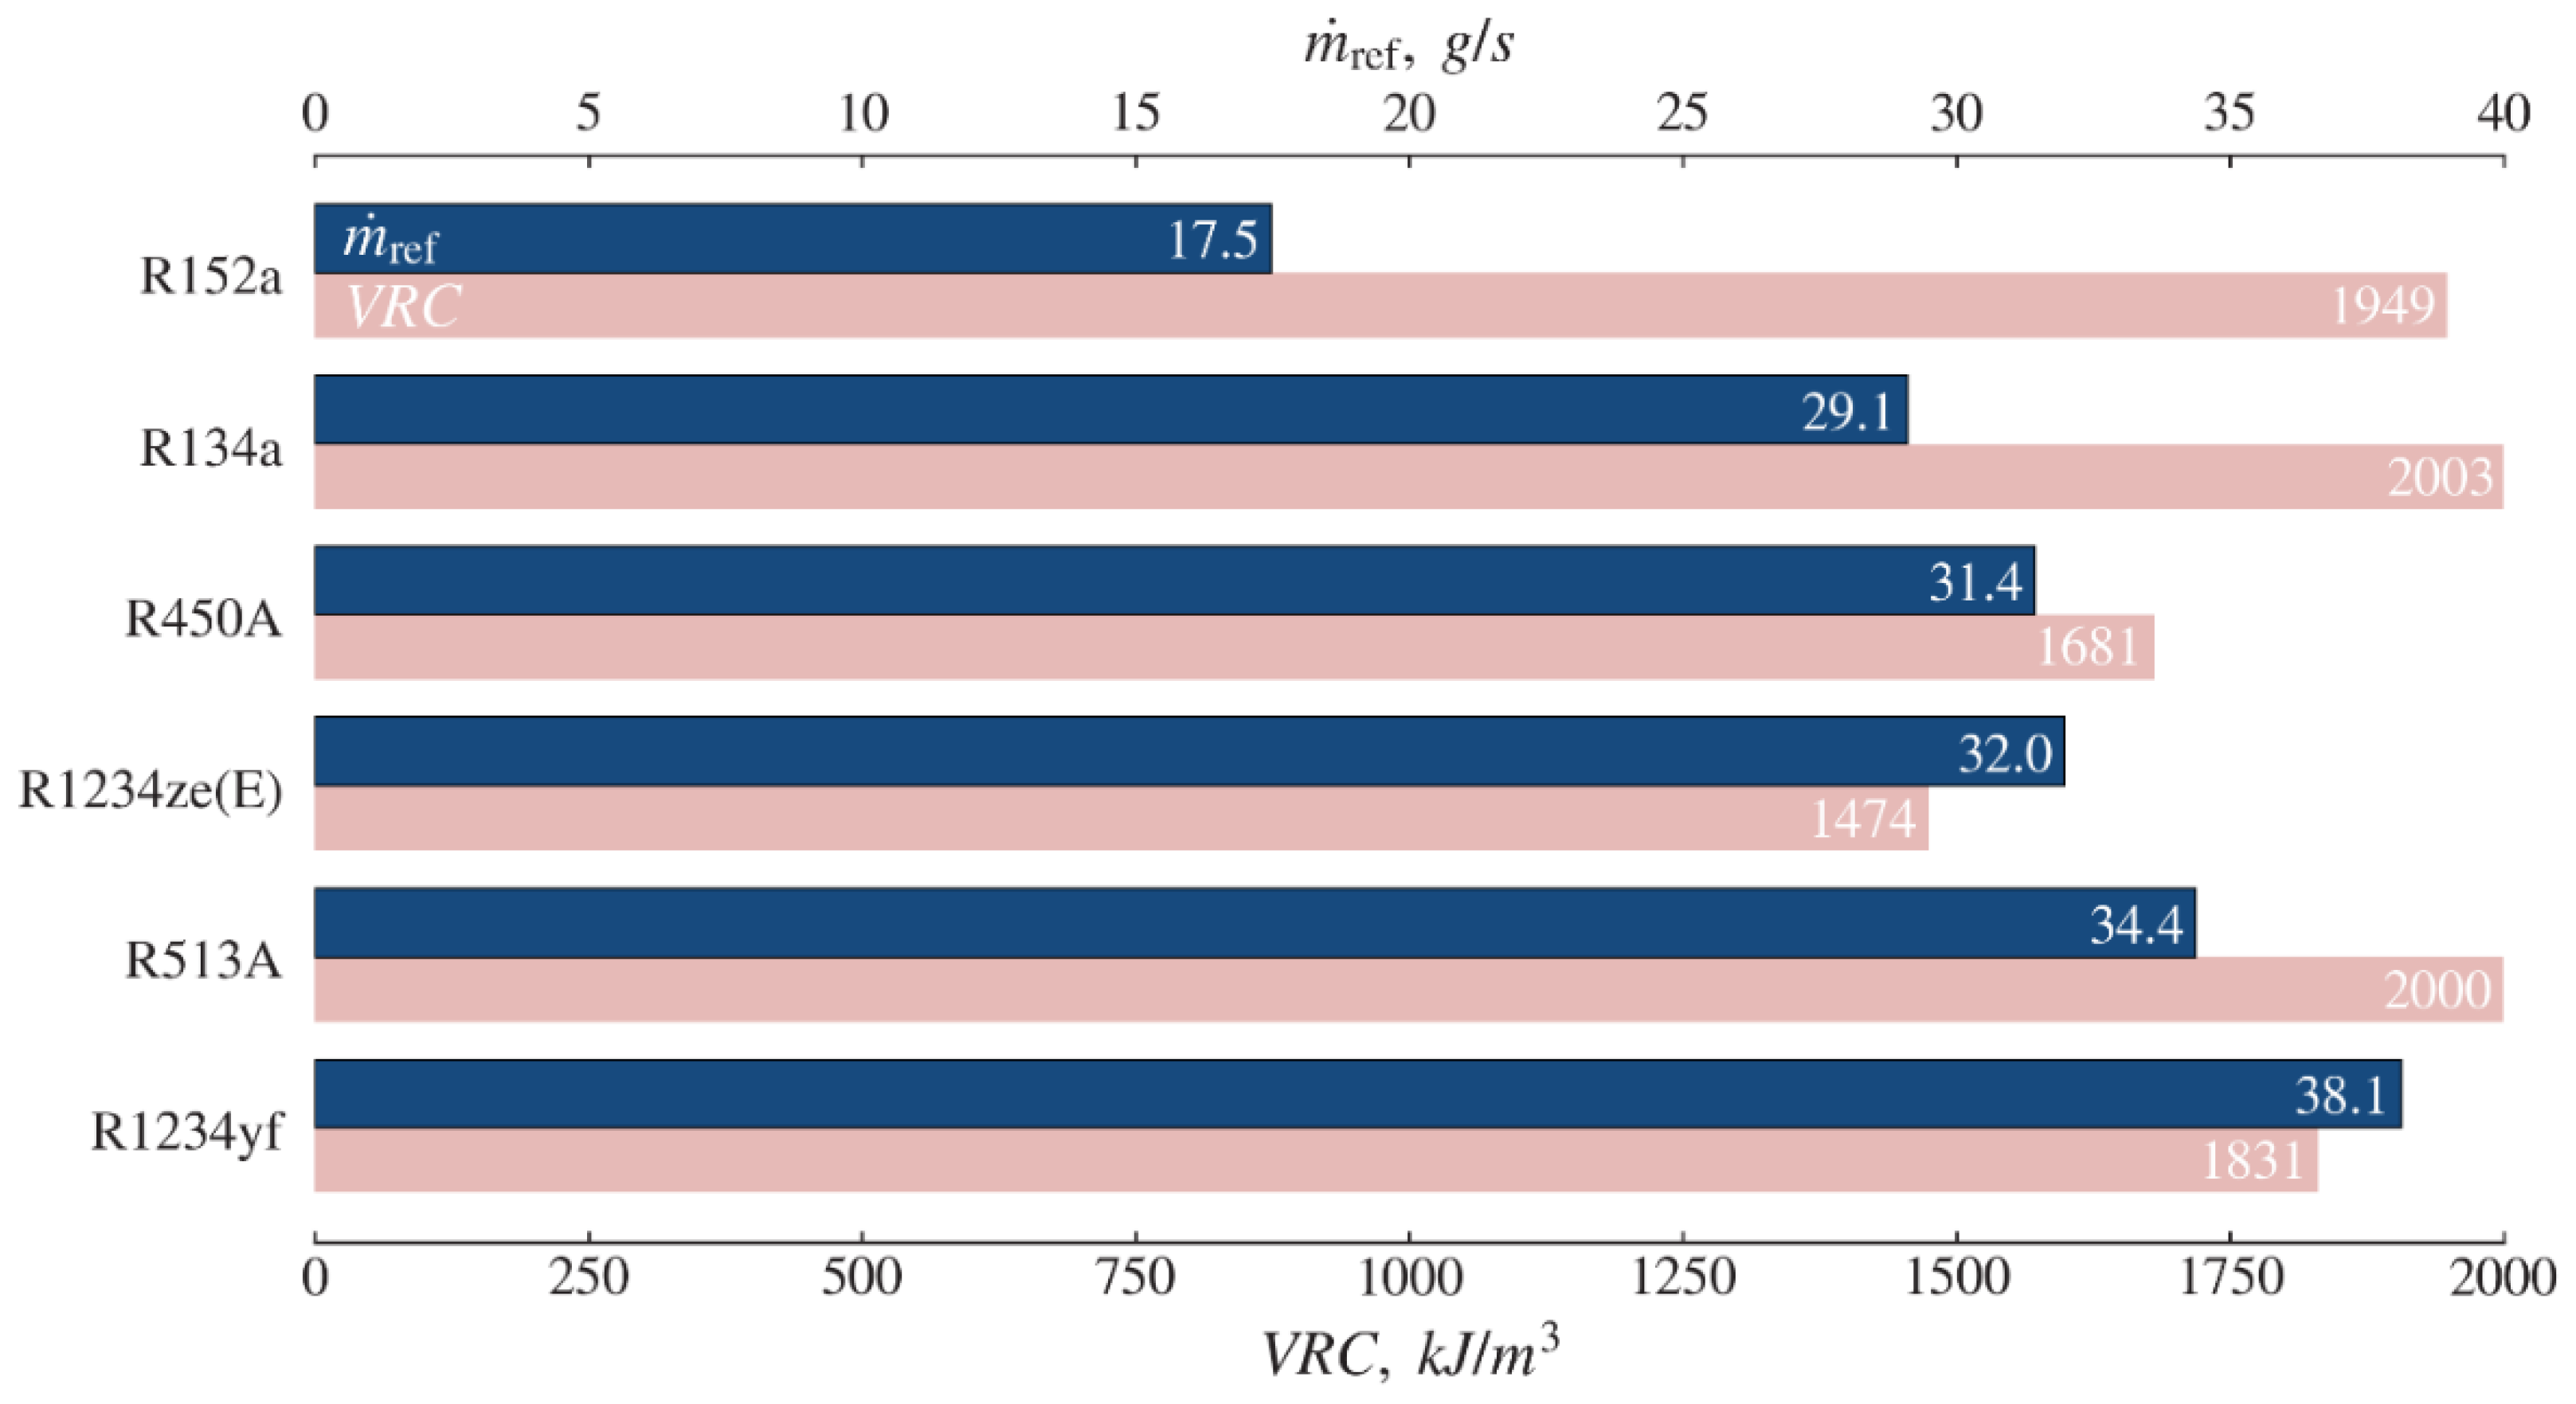
Figure 13 shows the comparison of the required refrigerant mass flow rate and volumetric refrigeration capacity (
) for a given heat capacity for refrigerant R134a and environment-friendly alternative refrigerants. For the same heating capacity as refrigerant R134a, the low refrigerant mass flow rate (
) with high
results in a smaller size compressor. In this regard, refrigerant R152a is seen to be the best option. For R152a, the refrigerant mass flow rate (
) required is estimated to be 17.5 g/s and
1949 kJ/m
3. The mass flow rates required for R450A and R1234ze(E) are close to that of R134a, with the values of 31.4 g/s and 32.0 g/s, respectively. However, refrigerant R450A and R1234ze(E) have lower values of
than that of R134a, which requires a large volume compressor. In addition, R513A and R1234yf have closer values of
to that of R134a at higher mass flow rates.
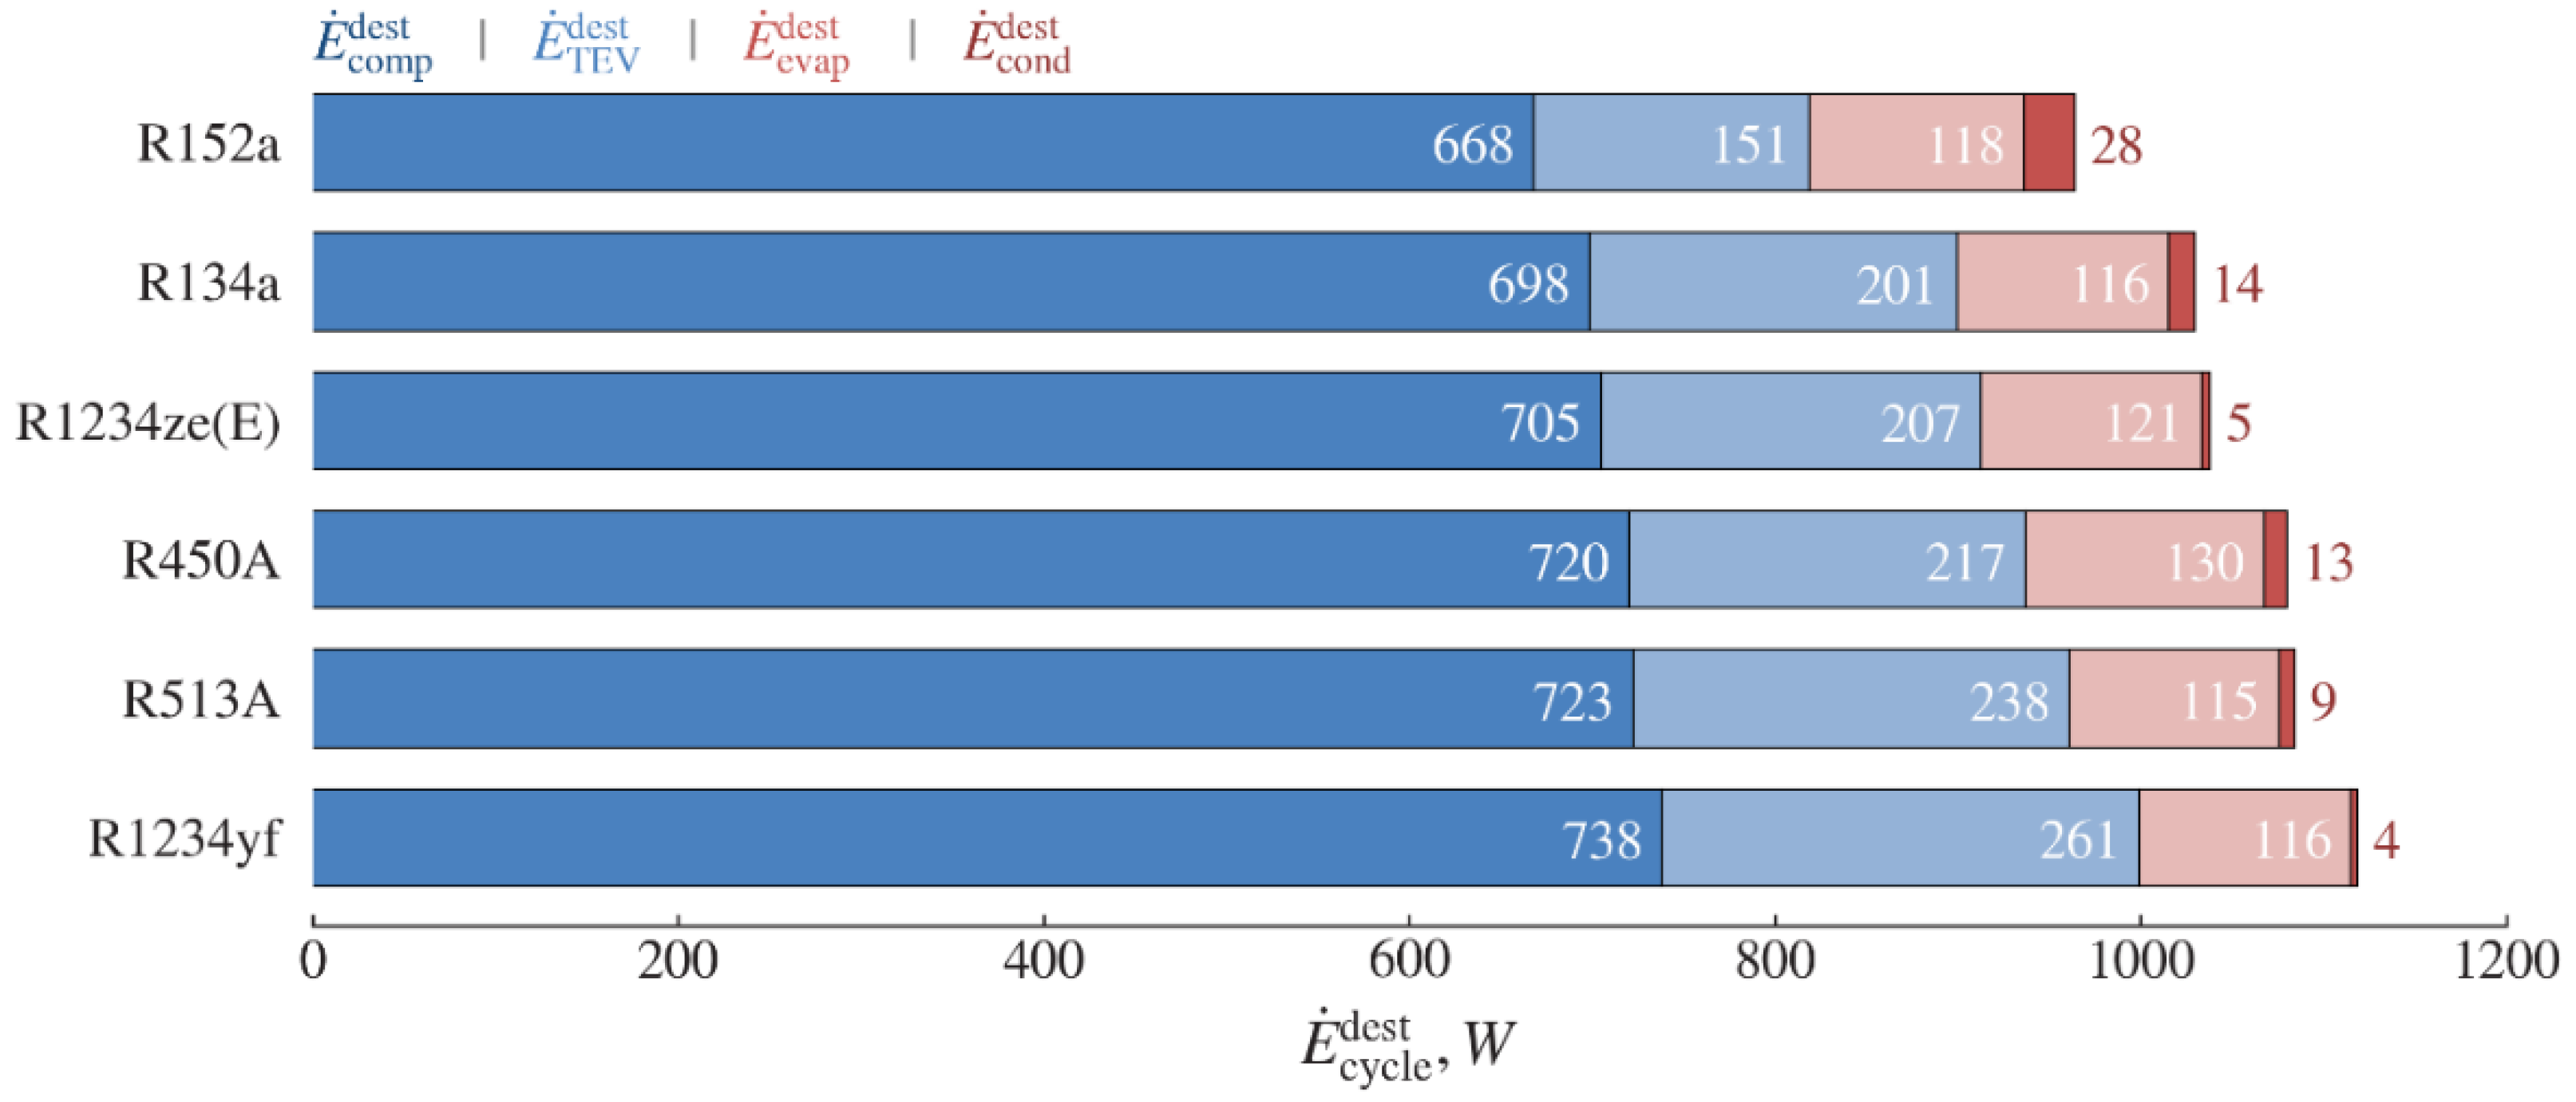
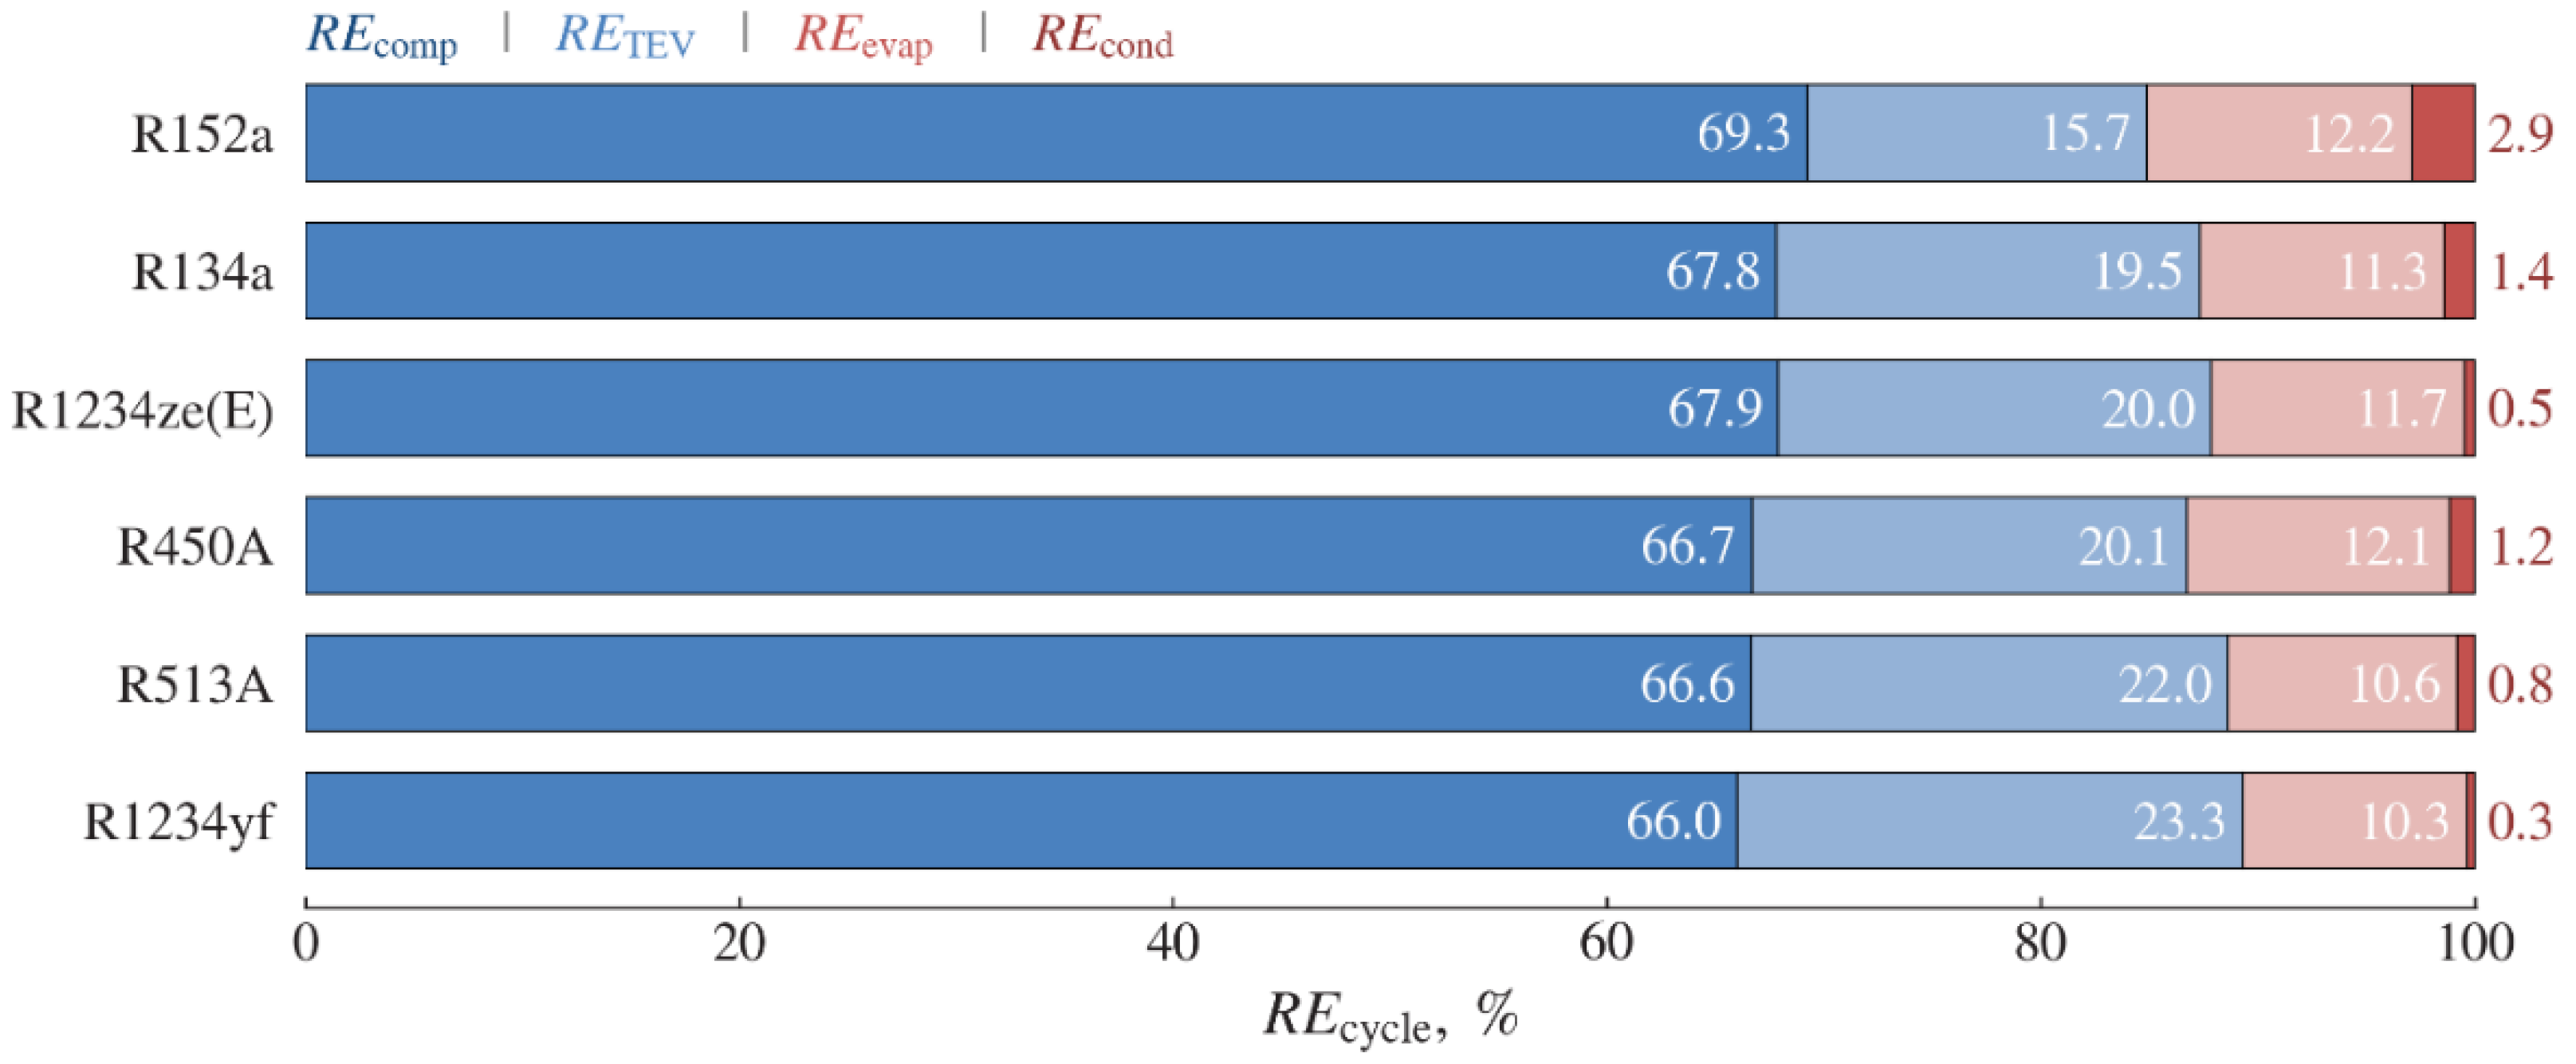
Figure 14 and
Figure 15 show the comparison of the exergy destructions and relative exergy destructions of the system components and cycle for different refrigerants, respectively. Among the selected refrigerants, the minimum system exergy destruction
is observed for R152a with a value of 965 W and the maximum exergy destruction of 1119 W is observed for R1234yf. Among components, the maximum exergy destruction is observed in the compressor, followed by the expansion valve, evaporator, and condenser.
As is seen from
Figure 15, the expansion valve can apparently affect the growth of system exergy destruction for these refrigerants. The share of the expansion device
increases from 16% to 23%, while the relative exergy destructions of other components vary slightly by 1–3%. Referring to
Table 4, since
and HTF flow rate
are fixed for the evaporator, for these refrigerants, there is no significant difference in
. Although
and
for the condenser are fixed,
is different. This is due to the different discharge temperature
depending on the thermodynamic properties of the refrigerant.
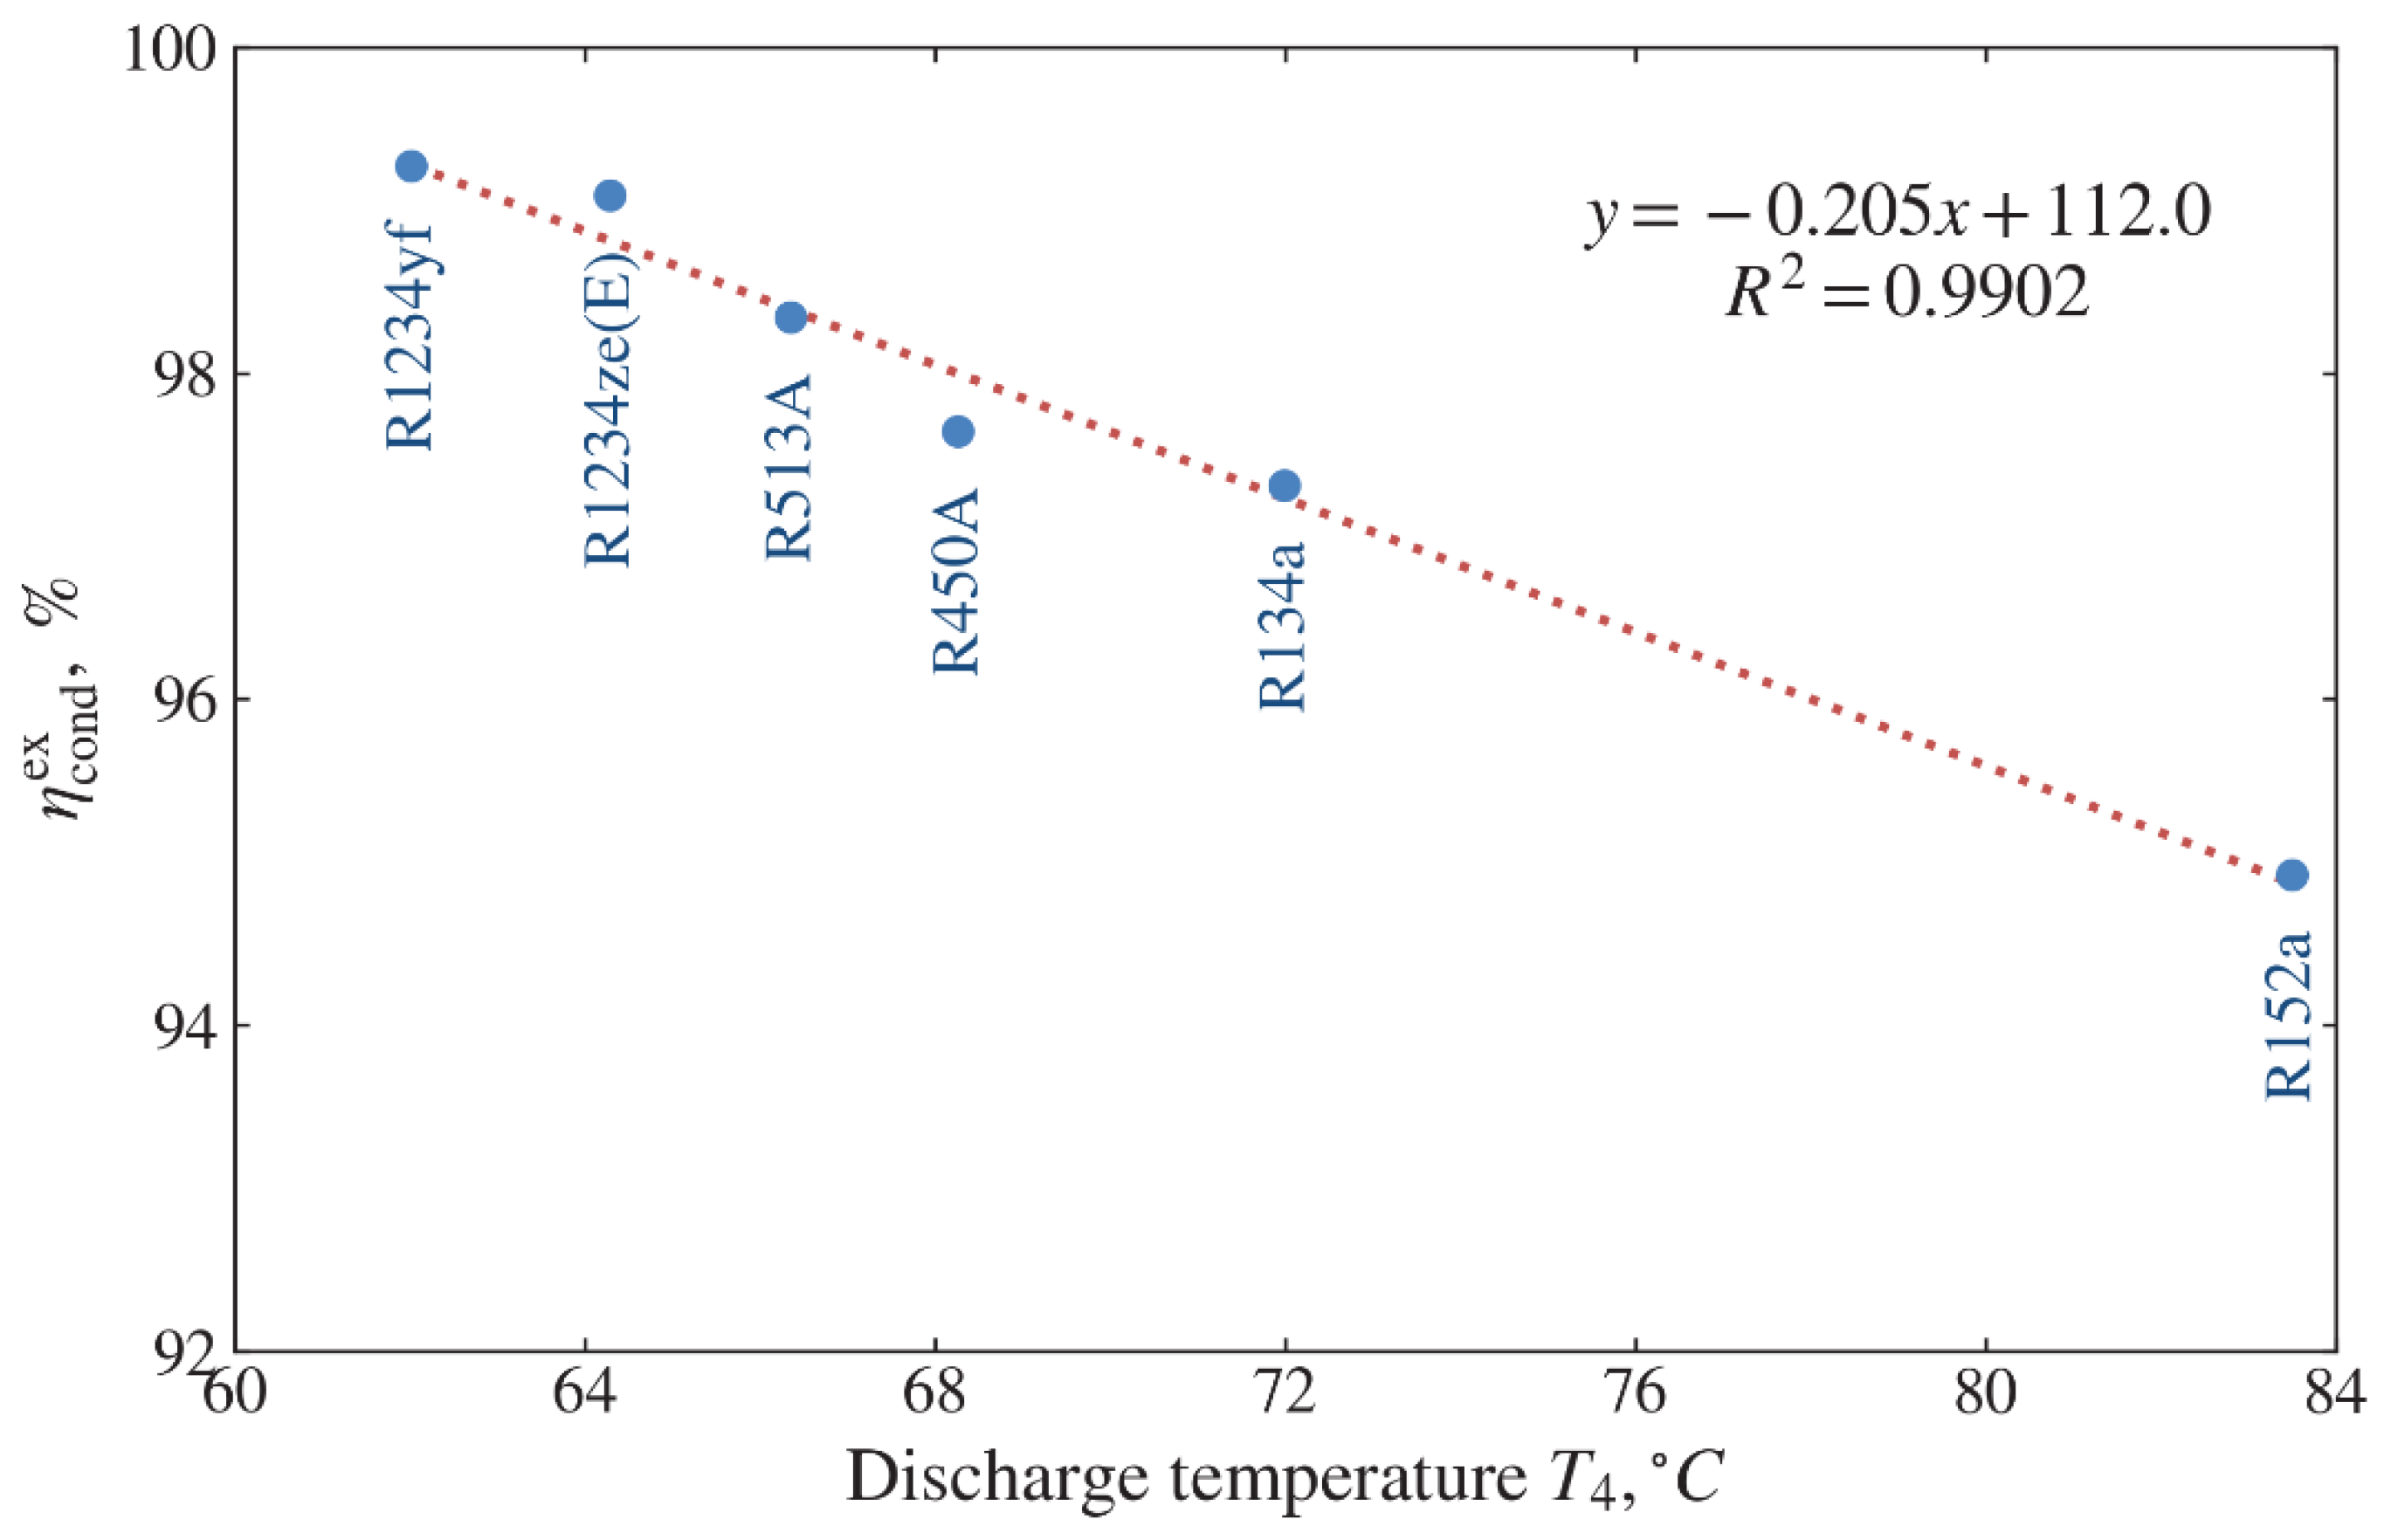
Figure 16 shows the effect of discharge temperature
on the condenser exergy efficiency
. The highest value of
corresponds to refrigerant R1234yf with the lowest value of
whereas the lowest value of
refers to refrigerant R152a with the highest value of
. It is found that a linear relationship between
and
. Thus, this dependence shows that with an increase in the discharge temperature, the condenser efficiency decreases in this operation mode. For these refrigerants, the condenser exergy efficiency varies between 94.9% and 99.3%. The exergy efficiencies of other components are given in
Table 6. The exergy efficiencies of the evaporator, compressor and expansion valve are in the range of 50.4–53.6%, 58.3–58.8% and 79.9–85.7%, respectively.
The second law
, cycle
, and overall system
efficiencies are calculated using Equations (32)–(34).
Figure 17 shows the evaluating results of these efficiencies. These efficiencies for all the refrigerants appear a similar trend in the ranges of 32.3–35.3%, 29.4–32.1%, and 27.8–30.2%, respectively. As is seen from
Table 6, the maximal values of the efficiencies correspond to refrigerant R152a, and the minimal values to refrigerant R1234yf. Among the selected refrigerants, only R152a is superior to R134a while R1234ze(E) has the closest values to those of R134a. The values of
and
vary similarly.
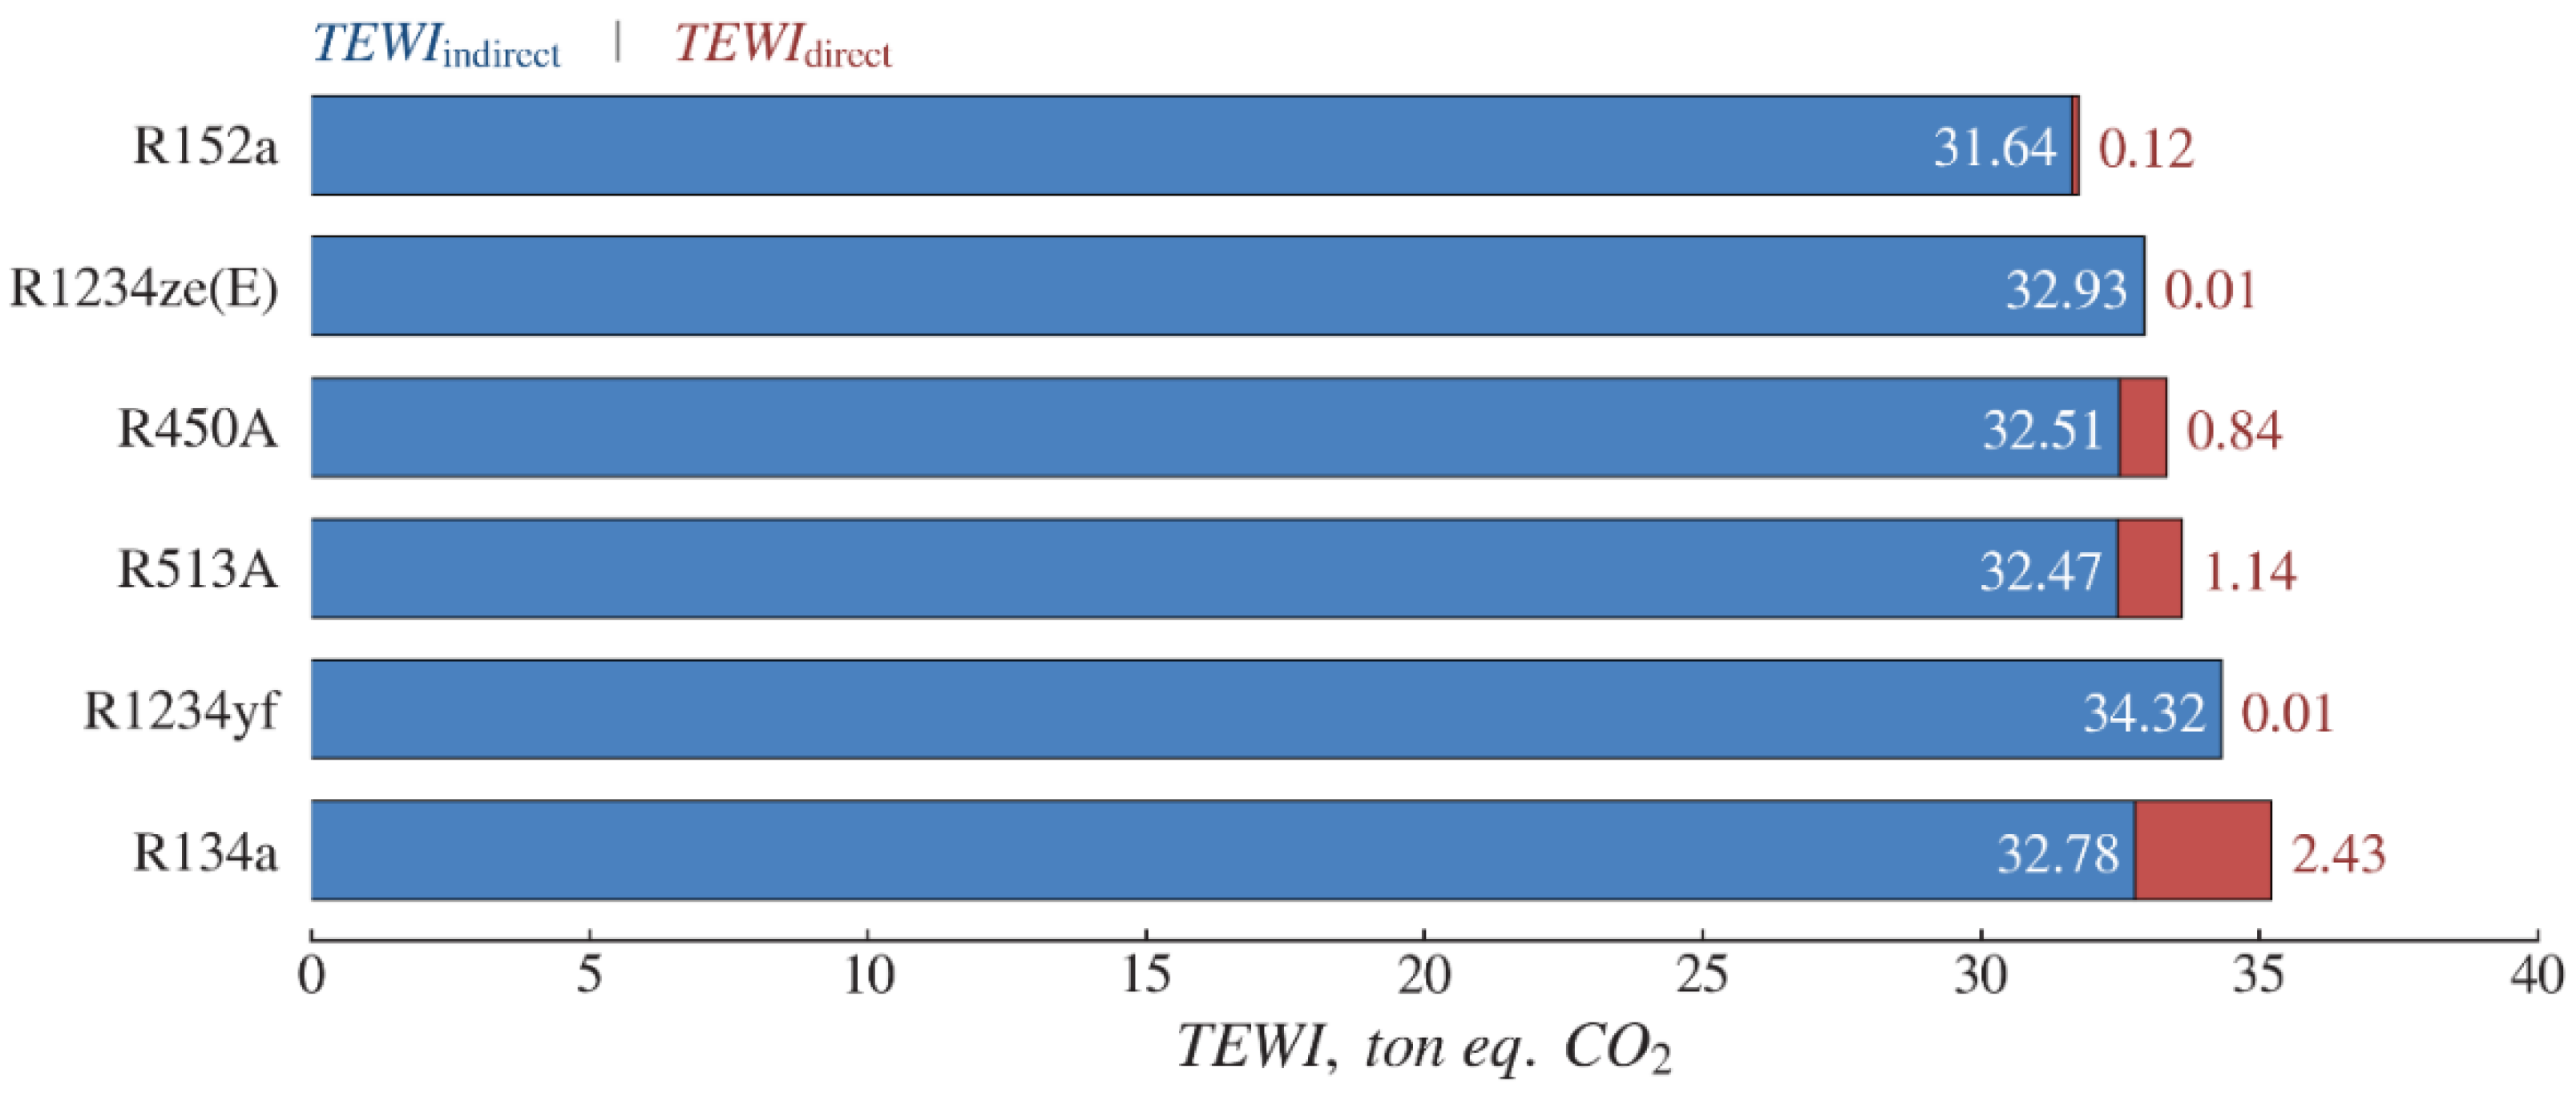
Figure 18 shows the total equivalent warming impact (
) of a water-to-water heat pump using R134a and environment-friendly alternative refrigerants. The
includes both direct and indirect emissions depending on the
of the refrigerant. R134a appears the maximum direct emission due to its high
than other refrigerants, followed by R513A, R450A, and R152a having the direct impacts of 1.14, 0.84, and 0.12 tons of CO
2 equivalent, respectively. The lowest value of direct emissions is observed for HFO refrigerants like R1234yf and R1234ze(E) with a value of 0.01. The lowest value of indirect emissions is observed for R152a with 31.64-ton eq. CO
2 while the highest value of 34.32-ton eq. CO
2 is associated with R1234yf due to its high compressor power consumption. The carbon-dioxide emission factor (
) is assumed to be 0.8 kg of CO
2 per kWh for coal-based electric power generation system [
41].
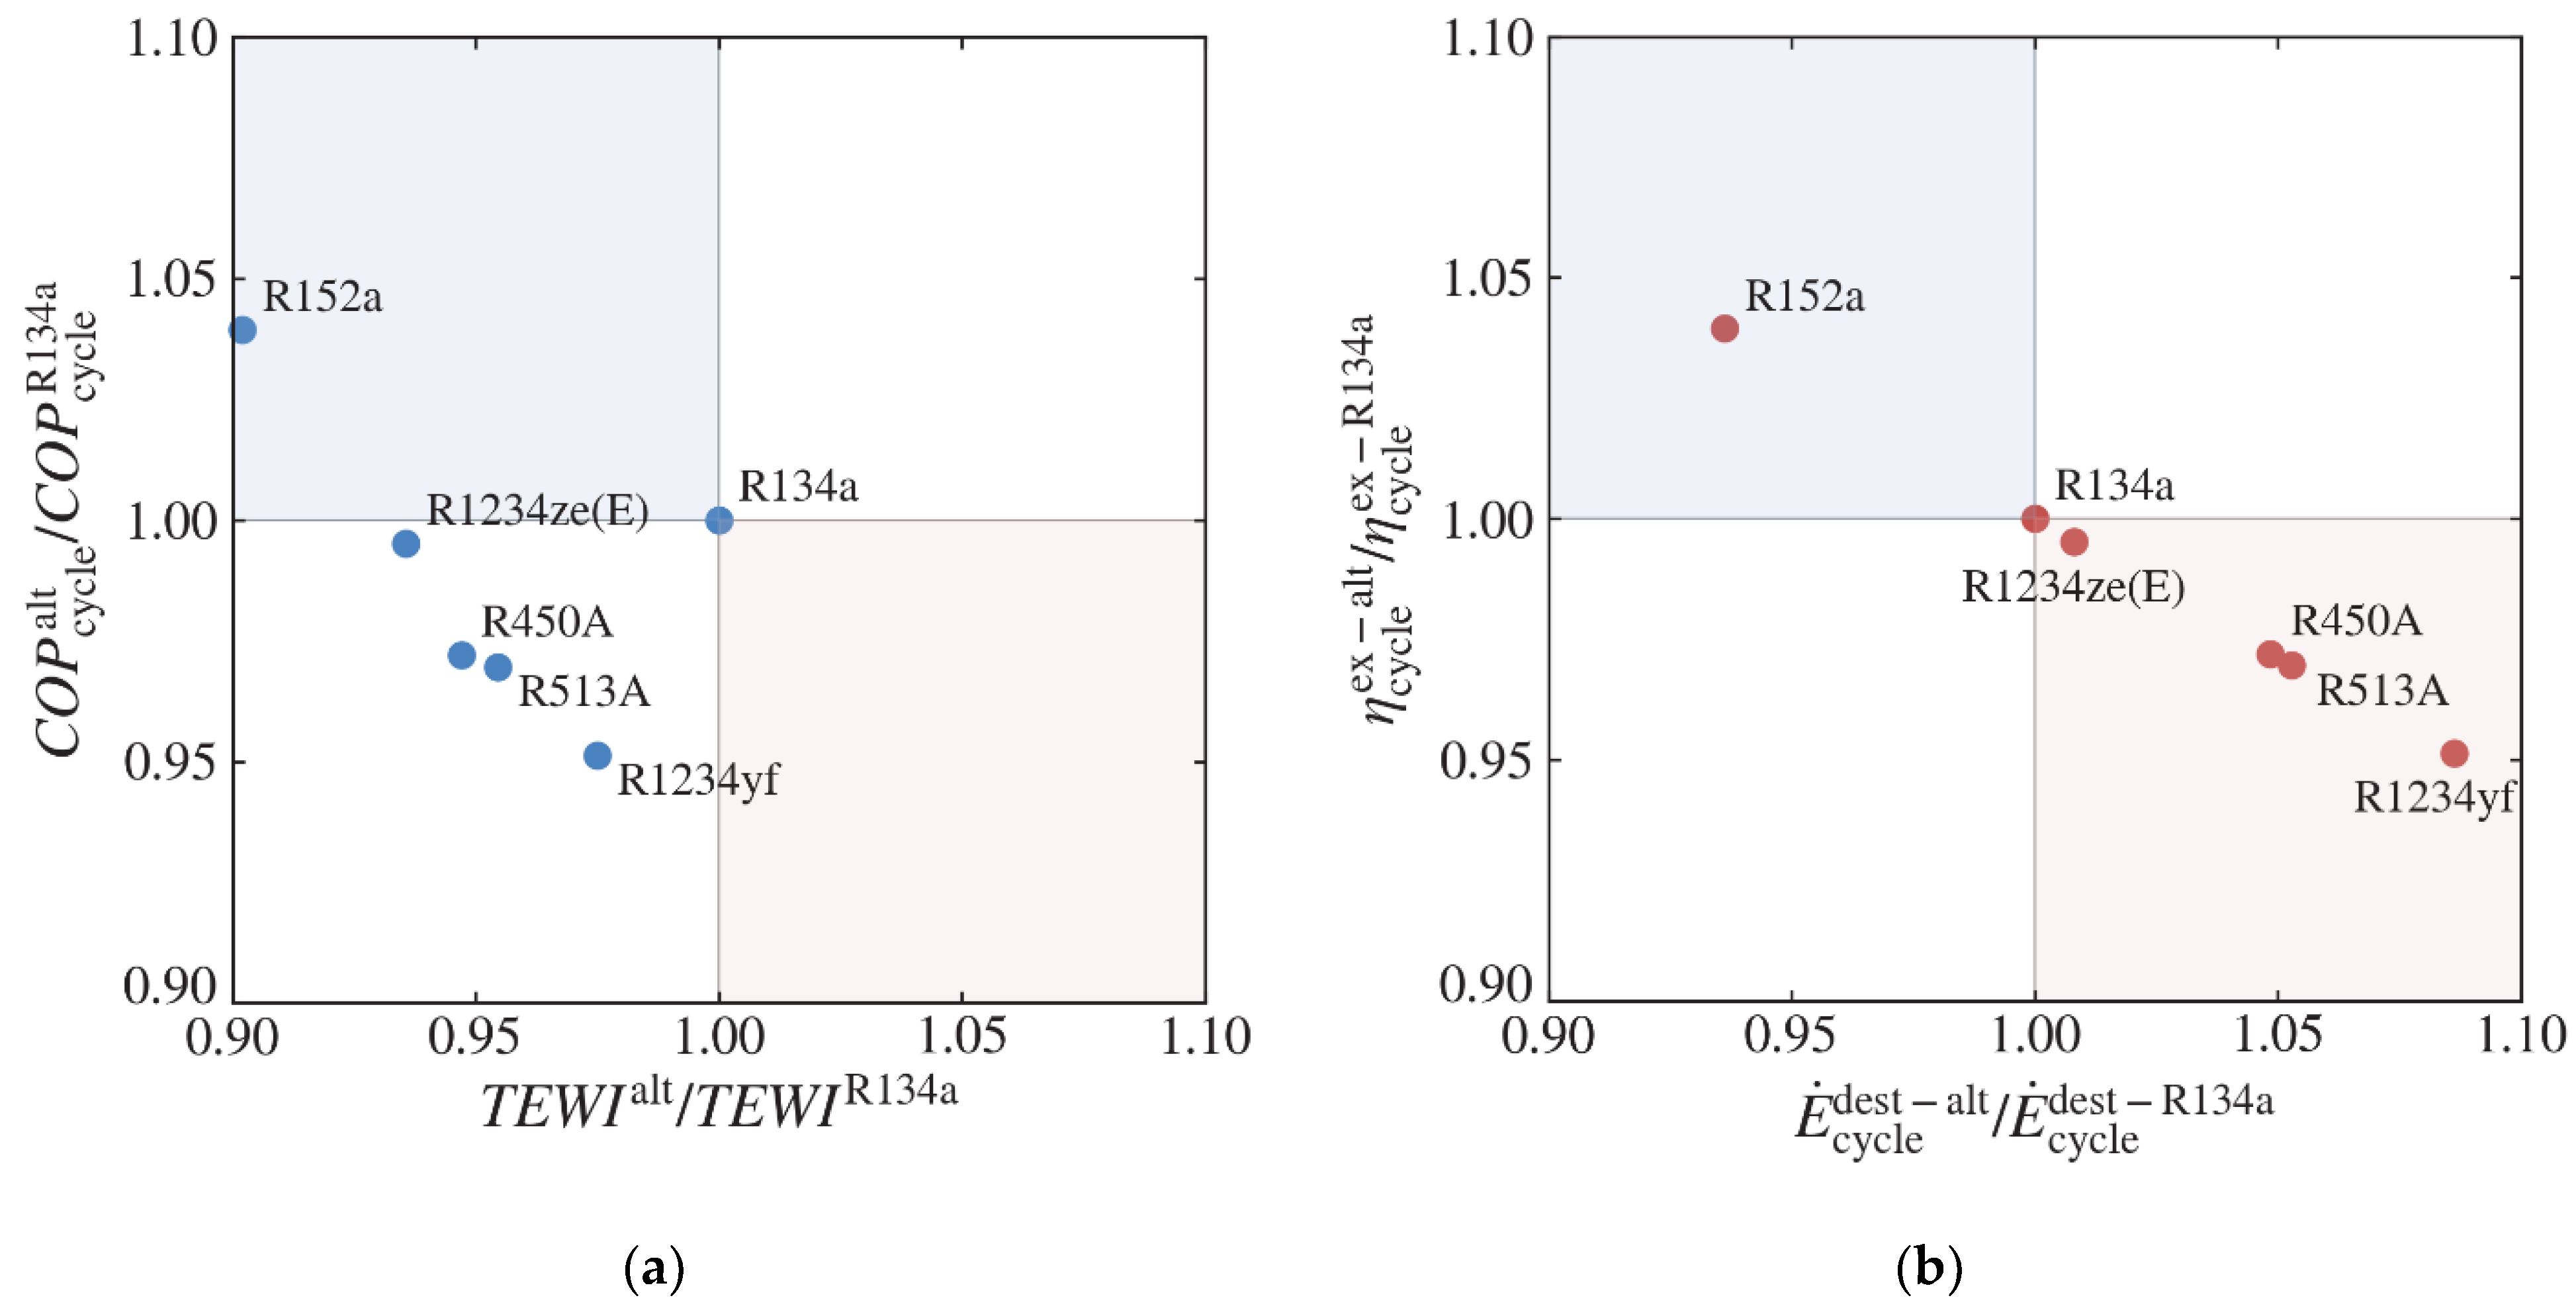
Figure 19 shows normalized system parameter dependences like
vs.
and
vs.
for different refrigerants. R134a is used as the base refrigerant and others refrigerants are considered as the low
alternatives. HFCs such as R134a will be phased out soon according to the Paris protocol 2016 (Kigali agreement). The second quadrant is the best choice for both cases in
Figure 19a,b. In this respect, a normalized
lower than one, and a
greater than one is preferable. Similarly, a normalized
greater than one, and a
lower than one is preferable.
As shown in
Figure 19, R152a is a good choice with higher
and
than R134a; moreover, its values of
and
are the lowest. The next refrigerant with lower
is R1234ze(E), while the remaining parameters are close to those of R134a. The lowest efficiency parameters are observed for R1234yf with a lower
than that of R134a, but with the highest exergy destruction. Refrigerant R450A and R513A display similar properties, with efficiencies lower than that of R134a despite their low
. Refrigerant R152a is seen to be a good alternative to replace R134a. However, due to its flammability, the mass charge of R152a is limited [
40]. The HFO refrigerants such as R1234yf and R1234ze(E) are considered to be the key substitutes for the HFC refrigerants. Even though these HFOs have low global warming potential, the thermo-physical properties are found to be lower than those of R134a, which results in poor thermodynamic performance. Moreover, fast decomposition of HFO refrigerants in the atmosphere results in formation of trifluoroacetate (TFA) [
42]. For example, the level of TFA for R1234yf is almost five times higher than that for R134a [
42]. The release of TFA in the atmosphere leads to the pollution of aquatic systems [
2,
3]. Therefore, HFC/HFO blends such as R450A and R513A are being considered as alternative refrigerants. Refrigerant R450A and R513A are non-flammable with a
60% lower than that of R134a. For these reasons, R450A and R513A can be recommended as good alternatives.
