1. Introduction
Biogas is produced mainly by landfills and anaerobic digesters as a by-product of breaking down organic waste in the absence of oxygen. Biogas is an attractive and potentially renewable source since these materials, decomposing in a landfill or field, would otherwise provide no benefit and release heat-trapping methane into the atmosphere, contributing to global warming [
1]. As we know, methane has about 21 times the global warming effect of carbon dioxide because of its ability to trap heat radiating from the Earth [
2]. Therefore, the methane produced by organic waste degradation must be treated through combustion and cannot be directly discharged into the atmosphere. At the same time, the usage of biogas can also decrease the dependence on fossil fuels since the biomass is considered as renewable energy. The primary components of biogas from landfills is CH
4, CO
2, and N
2, however, the content of various components can be different, depending on the gasification technology and the feedstock used [
3].
Since biogas can generate electricity from products that are usually waste products, several studies have been conducted on the utilization of biogas on gas turbines. The gas turbine shows good combustion performance and operation performance when adopting a combustor particularly designed for biogas [
4,
5,
6]. Some experimental test work has been presented, and the test facilities and conditions include researching rigs at atmospheric condition, high pressure and high temperature test rigs, and gas turbine engine field tests [
7,
8]. According to the results, the feasibility of biogas as a gas turbine fuel has been confirmed, and a significant advantage is that compared to natural gas, by reducing the gas heat value, the NO
x emissions can be reduced. If the fuel contains 50% and 35% N
2, NO
x emissions can be reduced by 40% and 20%, respectively. If CO
2 is selected as the diluent at the same engine power output due to the fuel binding nitrogen effect, NO
x production can be reduced by up to 5 PPM [
9,
10,
11]. According to reviews [
5,
12,
13,
14,
15,
16,
17,
18,
19] from the aspects of chemistry, physics as well as the physical and chemical interaction points of view, to help reduce the use of such fuel, NO
x factors have contributed to some explanation. From the chemical point of view, as the reactant contains thinner, with the loss of the flame temperature, the chemical reaction rate will slow down. Slower reactions can reduce the laminar flame speed and the flame thickness is thicker, thus reducing the NO
x emissions. In the presence of CO
2 and/or N
2 in the fuel, the oxygen concentration decreases, thereby inhibiting NOx formation. Meanwhile, CO
2 will compete with O
2 for H atoms. This can effectively reduce the size of the O/H/OH free radical pool and inhibit the formation of NO
x. From a physical point of view, the mixing uniformity is an important factor affecting the formation of NO
x. The mixing uniformity can be improved by the penetration of the fuel jet through the air stream. Due to the increase in the mass flow rate, the fuel penetration will increase as the calorific value of the fuel decreases, which may increase the level of mixing uniformity in the burner and produce less NO
x. The last factor is related to the pressure loss throughout the combustion system. As the fuel mass flow rate increases to meet the same heat release as when the fuel calorific value decreases, the increased combustor pressure drop will enhance the air and fuel mixing through the possible downstream displacement of the flame. This will also reduce the combustion gas residence time and reduce the thermal NO
x from the Zeldovich mechanism. However, these studies are mainly carried out for large gas turbines. Large gas turbine combustors have a larger space, which can meet the requirements of premixed combustion for the mixing distance and space.
The micro-gas turbine is a type of gas turbine that has received increasing attention in the past two decades because of its advantages of small size, high efficiency, and multi-fuel capacity [
20,
21]. It has been used for distributed power generation and powering hybrid electric vehicles. micro-gas turbines can use a wide variety of fuels such as natural gas, syngas, biogas, and diesel, depending upon the application of the gas turbine engine [
22]. The micro-gas turbine is a more suitable power equipment for distributed power generation when using biogas as a fuel considering the characteristics of biogas generation and the working characteristics of the micro-gas turbine. Increasing interest in using biogas from small digesters has been recognized [
23,
24,
25]. A problem with the usage of micro-gas turbines is their combustion products (e.g., CO
2 and NO
x) because they are considered as the main culprits for global warming and environmental harm. In order to meet the stringent emission regulations for the power plant industry, advanced low emission combustion technologies have been proposed and tested experimentally. Flameless combustion, also called flameless oxidation (FLOX
®) and MILD (moderate or intense low-oxygen dilution) combustion technology can bypass the issues caused by the biogas such as low calorific value and NO
x emissions [
26,
27]. In MILD and FLOX
® combustion mode, reagents are diluted by combustion products in a high temperature environment. To obtain a flameless oxidation regime, it is necessary to dilute fuel and/or oxidant jets by a strong recirculation of flue gas before the reaction. It needs to recirculate a large amount of hot combustion products with low oxygen content, within a limited volume, and over a wide range of operating conditions. It should be emphasized that recirculating combustion products by aerodynamic means only (i.e., without the use of mechanical means such as pumps) is difficult [
28]. micro-gas turbine combustors have a compact structure, and there are still many technical problems to be solved in the application of these two combustion technologies. Lean premixed combustion technology is one kind of DLE (dry low emission) combustion technology, which can guarantee NO
x emissions below 9 ppm at 15% of oxygen in many natural gas-fired gas turbines in operation in power plants [
29,
30]. Fuel and air are premixed before the reaction to reduce the main combustion zone temperature and then reduces NO
x emissions for lean premixed combustion technology. Therefore, the mixing technology is the core part for this kind of combustion technology and the focus of this study [
31,
32]. However, there are several hindrances restricting the application of biogas in a low emission micro-gas turbine since the characteristics of biogas differ from those of natural gas [
33]. A micro-gas turbine designed to produce low emissions on natural gas may not achieve the same emission goals and performance on a different gaseous fuel, therefore, it is necessary to modify the combustor before burning biogas [
34]. The presence of the diluent in biogas can significantly affect the combustion characteristics of the fuel through at least three ways of affecting the flame (1) through changes in the mixture of specific heat and adiabatic flame temperature; (2) chemical kinetic rates; and, (3) radiant heat loss [
35]. Therefore, these factors should be taken into account in the redesign of a micro-gas turbine combustor for the use of biogas [
36]. The study on micro-gas turbine low emission combustors with the utilization of biogas has mainly focused on the injector improvement and the fuel/air premixing performance [
26,
37,
38]. The CH
4 content of natural gas is usually 71–95%, while the typical CH
4 concentration range of biogas is 70–35%, and the rest is N
2 and CO
2 [
6]. The inert gases in the fuel tend to prevent the onset of a spontaneous combustion chain reaction, hence the combustion instability such as auto-ignition and flashback are not major considerations, while the lean blow out, flame stabilization, combustion dynamics, and pollutant emissions are among the key issues.
The can combustor under current study was designed for the micro-gas turbine using biogas. A previous study experimentally investigated the effects of the fuel composition, fuel injector position, and fuel pilot split on the combustion performance [
39], which showed that the fuel jet velocity and fuel pilot split had an important influence on the combustion performance. However, the effects of air flow characteristics, fuel jet characteristics on the fuel/air mixing characteristics, and the combustion characteristics in combustors have not been deeply studied. In this work, we further extend the study of the fuel/fuel mixing performance and the effects of mixing performance on the combustion performance for a certain biogas fuel. A certain fuel pilot split for the combustor was adopted, and the used biogas fuel is a representative biogas with the components CH
4 (59%, vol.), CO
2 (36.8%, vol.) and N
2 (4.2%, vol.), which was experimentally tested in this combustor.
2. Combustor and Operating Conditions
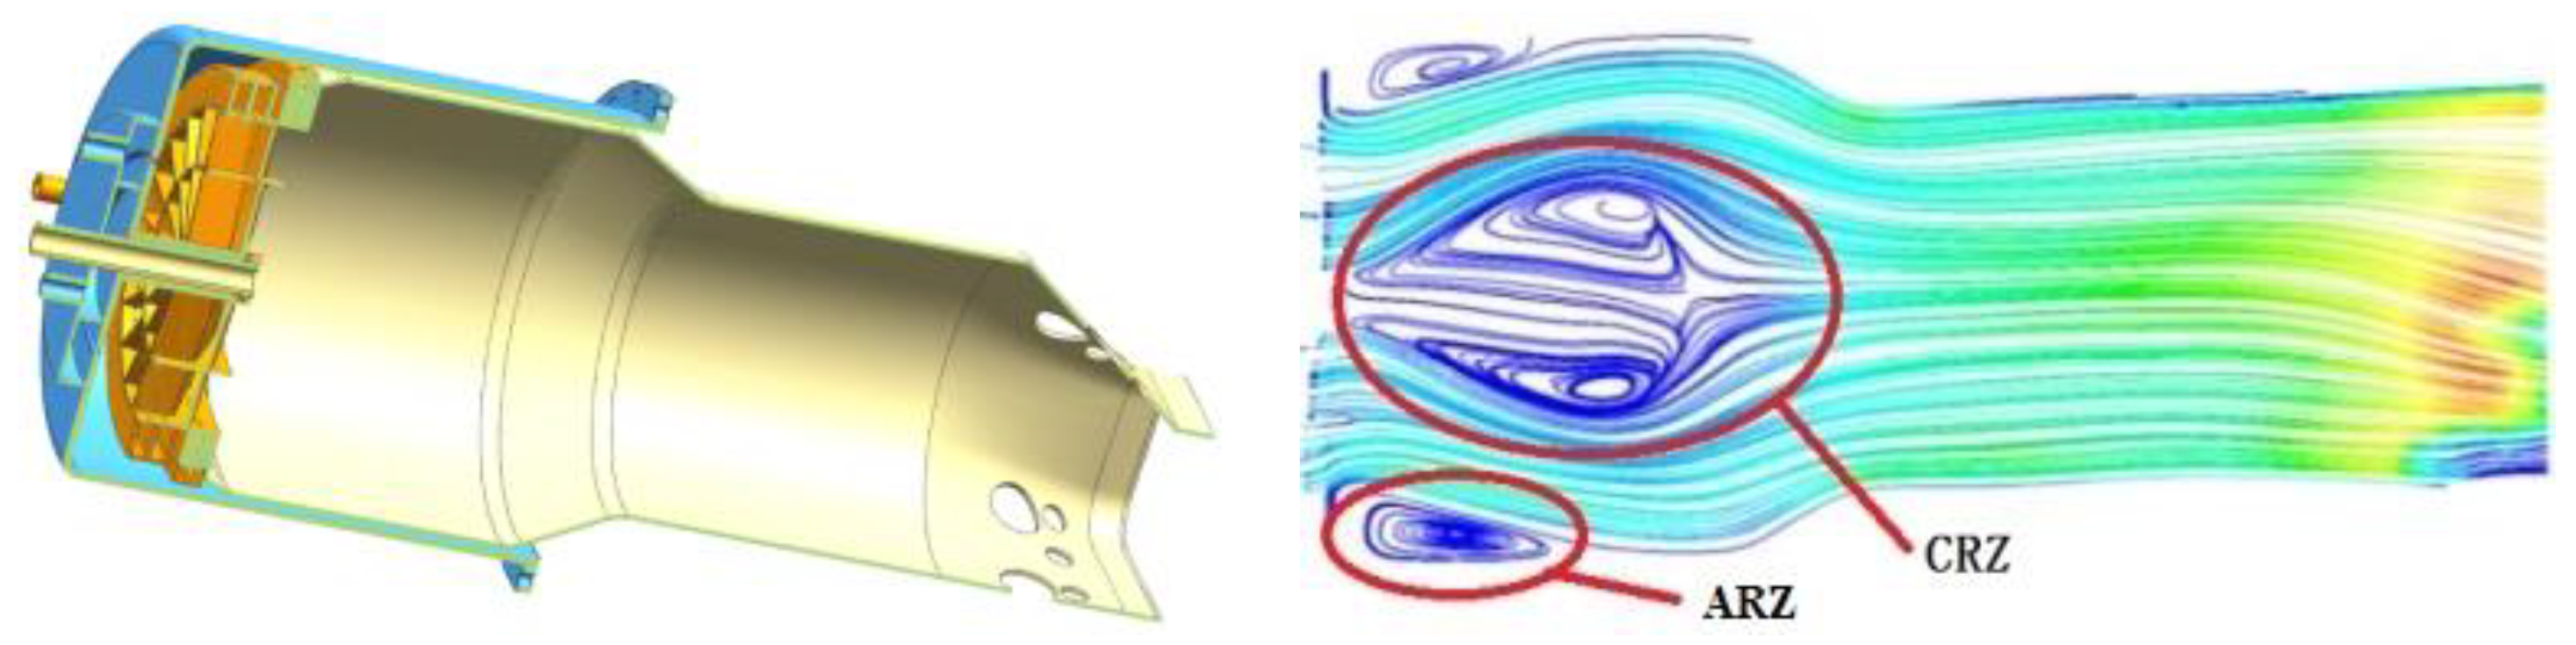
The combustor designed for the micro-gas turbines is counter flow, and the structure and section diagram are shown in
Figure 1. Lean premixed combustion technology is used to reduce the pollutant emissions in the combustor. According to the study by Liu et al., the problems associated with lean combustion instabilities such as weaker flame-holding and higher combustion dynamic pressure amplitude can be controlled by the pilot fuel schedule [
6]. Therefore, centrally-staged combustion technology is used to meet the combustion stability. A two-stages axial swirler is used for the DLE combustor. The swirler for the pilot burner has a greater swirl number to create a vortex breakdown reverse flow feature along the axis of the combustor. This flow feature is called the internal reverse flow zone or central recirculation zone (CRZ). The smaller cycle area near the sides of the combustion chamber wall is called the angular recirculation zone (ARZ). In this DLE concept, the reverse flow zone remains attached to the center of the combustor, thereby establishing a firm aerodynamic base for flame stabilization. The flow field characteristics in the combustor has also been shown in
Figure 1, where different colors represent different flow velocities. The flame stabilizes in a shear layer generated by aerodynamics around the internal and external countercurrent regions. The inlet conditions of the combustor are shown in
Table 1 for the design point of the gas turbine.
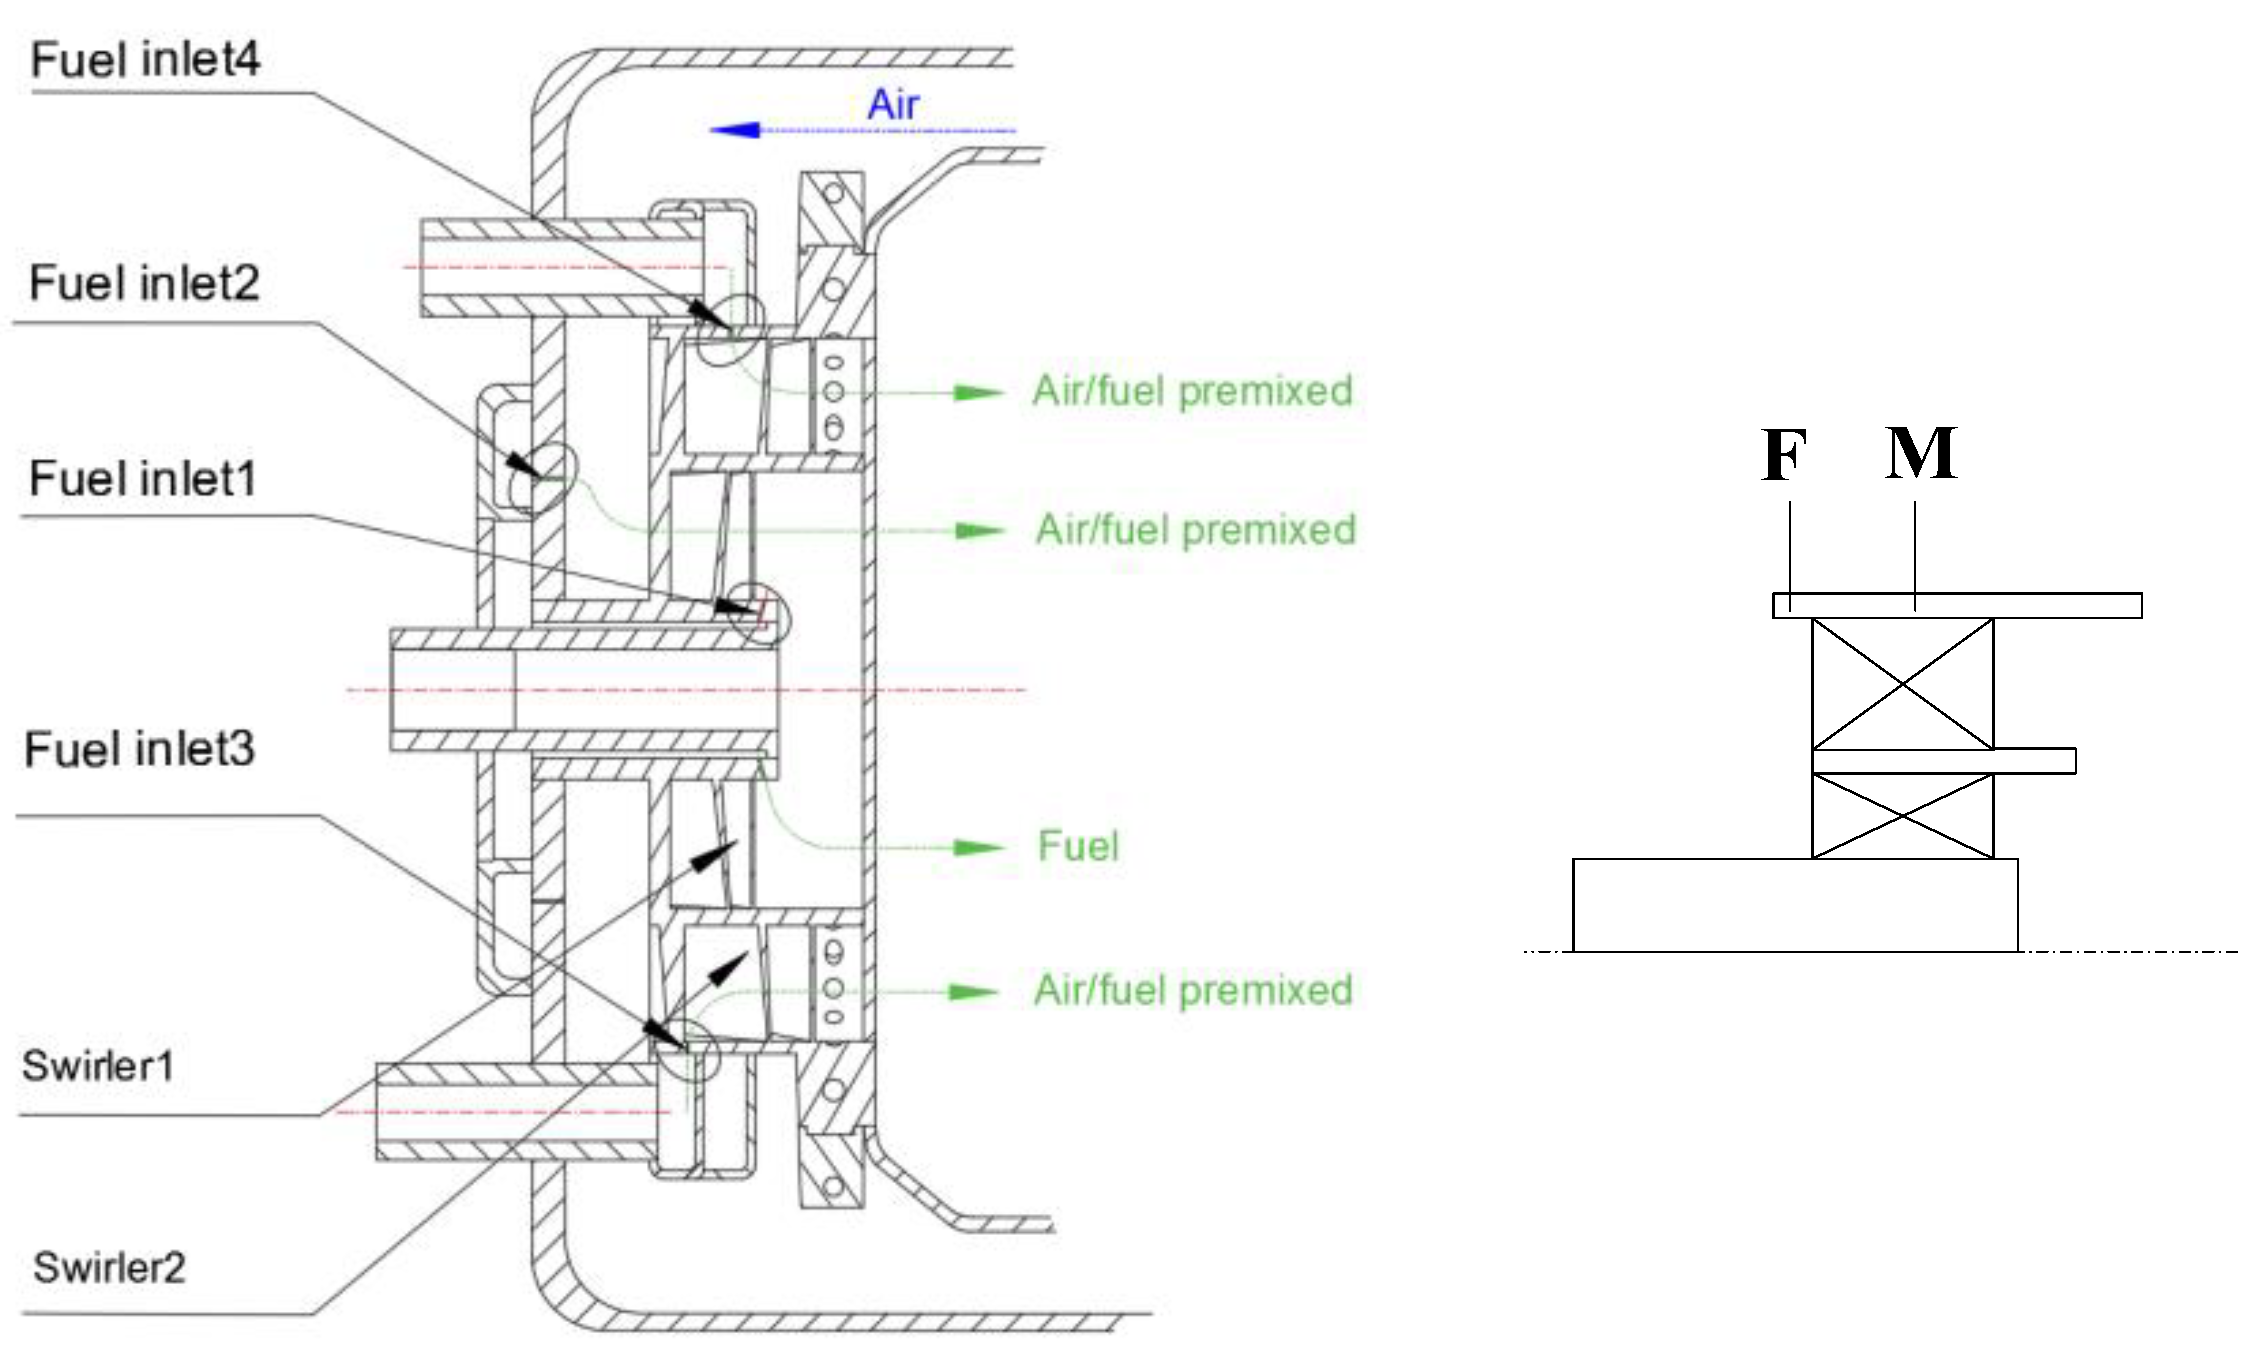
The fuel enters the combustor from the fuel inlet, in which fuel inlet1 and fuel inlet2 cooperate with swirler1 to form a pilot burner, which is used to ensure the combustion stability. The main combustion stage of the combustor adopts premixed combustion to reduce pollutant emissions. Fuel inlet3 and fuel inlet4 are the main combustion stage fuel nozzles located in different positions, as shown in
Figure 2, which are used to analyze the influence of the main stage nozzle position (denoted by
np in
Table 2) and diameter (denoted by
d in
Table 2) on the combustion characteristics. In
Figure 2, F and M represents the fuel inlet is located different position of swirler, N and T represent numerical calculation and test methods respectively.
For a lean premixed combustion system, the mixing uniformity is a factor that can affect NOx emissions. The fuel and air mixing uniformity is related to the air flow characteristics and the fuel jet performance. Therefore, this paper will work from the effects of the air flow characteristics and fuel injection characteristics on the fuel/air mixing characteristics and combustion characteristics in the combustor. When studying the mixing characteristics and combustion characteristics of the combustor, the air and fuel condition for the combustor inlet are kept unchanged.
The air enters the combustor through the swirler and mixes with the fuel before the chemical reaction. The air flow characteristics are mainly affected by the swirler. The swirler structural characteristic parameters include the swirler blade angle
and the blade number
n. Swirl number (
Sn) is a swirler characteristic parameter that is defined using the swirler structural characteristic parameters as shown in Equation (1):
where
R1 represents the swirler inside circle radius;
R2 is the outer circle radius;
is the blade installation angle;
n is the number of blades;
c is the average spacing between the adjacent blade outlets.
Three different swirler blade angles, 30°, 45°, 60°, and three different swirler blade numbers, 16, 22, and 28, were selected to form a swirler with different
Sn. Case 1 to 5, shown in
Table 2, are presented to study the influence of the air flow characteristics at the inlet of the combustor on the fuel/air mixing and combustion characteristics.
The nozzle diameter will affect the fuel jet depth and momentum which can, in turn, affect the mixing of fuel and air. Three diameter values of
d = 1 mm, 1.5 mm, and 2 mm were selected, as shown in
Table 2. For case 3, 6, and 7, only the nozzle diameter was different, and the other parameters were the same. This was used to study the influence of the nozzle diameter change on the mixing and combustion performance. When different fuel nozzle diameters are used, the fuel mass flow is kept the same by adjusting the fuel pressure. The main combustion stage fuel nozzle position can be changed at different positions, as shown in
Figure 2. Among them, “front(F)” refers to the inlet position of the swirler 2, and “middle(M)” refers to the middle position of swirler 2. Case 3, 8, and 9 in
Table 2 present different main combustion stage fuel nozzle positions. Especially for case 9, the main combustion stage nozzles were located in the “front(F)” and “middle(M)” of the swirler, respectively. At this time, the diameter of the fuel nozzle remains unchanged, and the number of nozzles located in the front and middle remains the same. In the study of the influence of nozzle position on the combustion characteristics, only the position of the main combustion stage nozzle is changed, and the position and quantity of the pilot nozzle remain unchanged. Fuel jet angle
α is the inclination angle between the injected fuel and the normal of the wall. The studied
α for the main combustion stage nozzle including 30°, 60°, and 90° are shown in
Table 2 for case 3, 10, and 11.
This paper mainly used the numerical calculation method to study the fuel air mixing characteristics and combustion characteristics under different air flow and fuel injection characteristics for a micro-gas turbine biogas combustor. In order to ensure the accuracy of the calculation results, experimental tests were carried out under some working conditions.
Table 2 represents the cases investigated in the present study in which the swirler blade angle
, blade number
n, and swirl number
Sn were all for swirler 2, and swirler 1 was kept the same for all cases. The fuel nozzle diameter
d, nozzle position
np, and fuel jet angle
α were all for fuel inlet 3 and fuel inlet 4. All cases were studied by numerical simulation and case 3, 6, 7, 9 were also experimentally tested. In
Table 2, the symbol
N represents the numerical simulation method and symbol
T represents the experimental test method. For all conditions in
Table 2, fuel inlet 1 and inlet 2 were used and kept unchanged.
5. Governing Equations and Computational Model
The commercial software package of ANSYS-Fluent 19.2 was used to conduct all of the simulations. The combined mathematical model solves the component transfer equation and the conservation equations of mass, momentum, and energy using a large eddy simulation (LES) model representing scalar variables in a three-dimensional (3D) region of a gas turbine combustor. The species transport equation and mass conservation, momentum conservation, and energy conservation equation are based on the following general equation:
where
and
represent the Reynolds average and fluctuating components of the dependent variable, respectively;
is the velocity component in
j direction;
is the diffusion component; and
sϕ represents the source term.
Turbulence is solved by large eddy simulation. For the simulation of large vortices, small vortices dissipate turbulent kinetic energy and large vortices represent the average flow length. For large eddy simulation, the vortices that have significant influence on the flow field are retained, and the vortices smaller than their size are filtered out. The scale model of subfilters was modeled by the large eddy simulation technique to study the influence of filter scale. For quantity [
31], the low-pass filtering operation can be performed using the following equation:
The integral equation was used to solve the whole domain. The scale of the decomposed vortices was determined by the filter function. The box filter was used, and the filter truncation scale was selected to select the grid size of the local element.
A general equation of the following form can be derived using continuity, Navier–Stokes equations, and filtering functions:
where
represents the stress tensor, and the subgrid-scale stress
is given by:
Filtering operations generate stress at a subgrid scale, which is involved in modeling. Therefore, the isotropic part of the sub-grid scale stress was combined with the filtered static pressure term, and the deviation part was modeled using turbulent viscosity:
where
and
are the turbulent viscosity and rate of stain tensor, respectively. The turbulent viscosity was solved through the wall-adapting local Eddy-viscosity, as given by:
where
Ls symbolizes the mixing length for the subgrid-scale.
The radiative heat transfer equation is solved using the discrete coordinate (DO) model so that there is one radiative iteration for every five energy iterations. This model is suitable for a wide range of optical thicknesses and has been recommended to simulate oxygen fuel combustion. The absorption coefficient was calculated by the grey gas weighting and model. Based on the weighted sum of grey gases, the total emissivity ε can be assessed using the following equation:
where
indicates the emissivity weighting factor for the grey gas
at temperature
T;
represents the adsorption coefficient.
All of the studied cases were fully premixed combustion and the partially premixed combustion model was modified to accommodate the simulation. The transport equations for the mean mixture fraction
, the mixture fraction variance
, and the mean reaction progress variable
c were solved to obtain other scalar variables. The reaction progress variable is defined as the mass fraction of a specific species in the mixture and possesses a value of 1.0 for the burnt gas mixture and zero for the unburnt mixture. The mixture fraction is given as:
where
Y represents the mass fraction and
s represents the oxidizer to fuel ratio. The probability density function and progress variable were computed with the distinct mixture fraction and the density weighted average scalars. The species fraction was calculated based on the following equation:
where
u and
b denote the unburnt and burnt mixtures, respectively.
c is the reaction progress variable, which is defined as a function of mass fraction of the product species and is given by:
where subscripts
i and
ad represent the product and the complete combustion species, respectively.
Maintain CFL < 1 in the calculation process. After comprehensive consideration of the time resolution and time cost, determine that the time step is 1 μs. Two flow characteristic times were calculated for the model transient calculation, and then three flow times were calculated on average for the opening time statistics. The calculation was advanced by 12 ms in physical time. The present study applied the LES model to a micro-gas turbine combustor and the simulation results were compared to the experimental data to examine the accuracy of the numerical model. After validation, the obtained simulation results were analyzed.
6. Numerical Mesh and Boundary Conditions
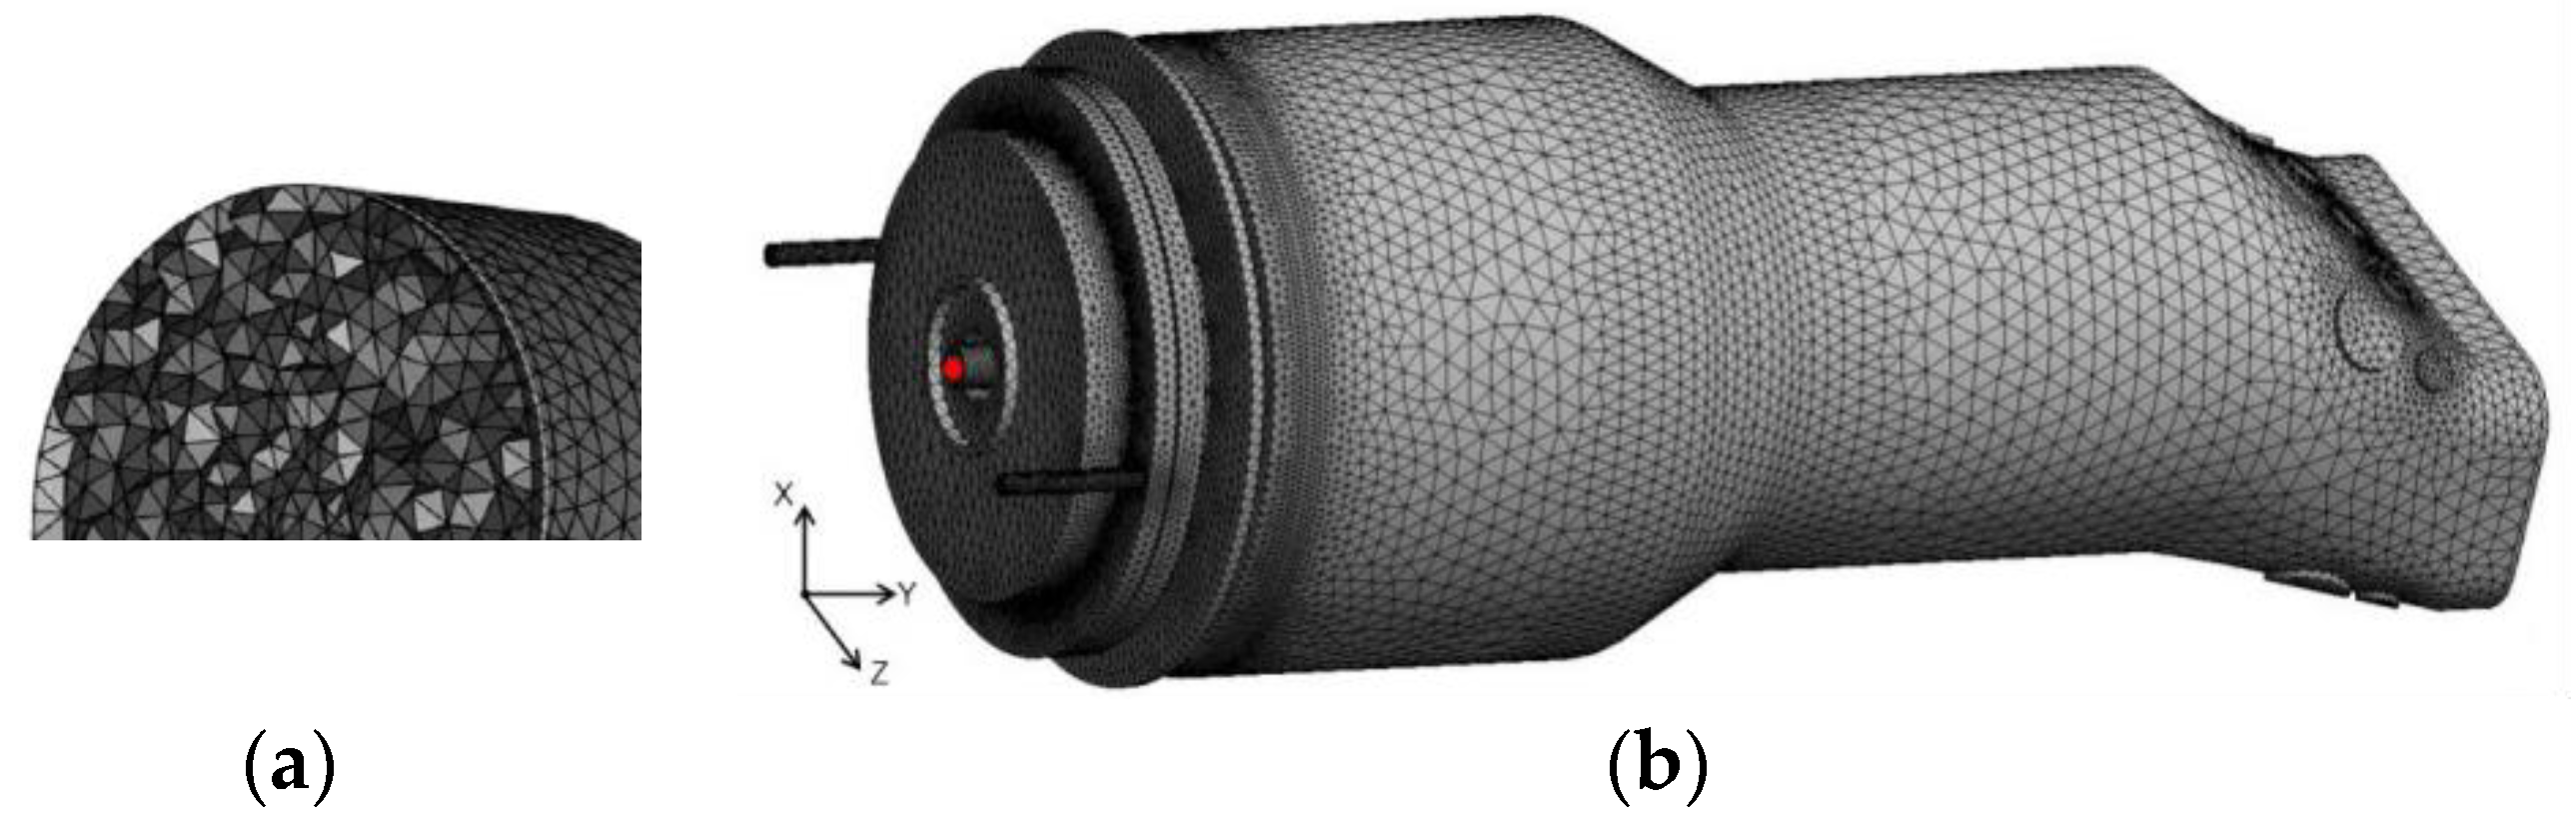
The established mesh model for the numerical calculation is shown in
Figure 4. The combustor model was divided into structural/unstructured hybrid grids, and the grid nodes were merged at the interface between them. A hexahedral structure grid was generated at the main position where the chemical reaction occurred in the flame tube, as shown in
Figure 4a, and other areas adopted a tetrahedral unstructured grid. Because the film cooling orifice is not only small in diameter but also large in number, the area method and unstructured grid were used to divide the orifice. The basic unit of the grid was tetrahedral and hexahedral grid, and the positions of the fuel orifice and the main combustion zone were partially encrypted. The grid independence was verified: the 2.86 million grid met the requirements of grid independence, and the total number of nodes was 530,000.
The vortex method algorithm was used to solve for the fluctuating velocity. According to the set values of the equivalence ratio and mixture composition, calculations were performed for the mean mixture fraction using the modified partially premixed model.
The mixed thermal boundary condition was defined at the combustor wall with both external-radiation and convection heat-transfer mechanisms as well as a free stream temperature of 300 K and convective heat transfer coefficient of 20 W/(m2 K). The semi-transparent boundary type was set to the 6.0 mm wall thickness.
Therefore, the same inlet conditions were adopted for the calculation of different cases. The inlet boundary conditions of air and fuel are the mass inlet, and the mass flow rate and temperature are given. The outlet of the combustor is the pressure outlet boundary condition, and the static pressure is given. The convergence criteria for iterative calculation were set according to the Fluent software standard. The convergence criterion for energy was a residual value less than 10−6, and the convergence criterion for other variables was a residual value less than 10−6.
7. Flow-Field Structure
The flow characteristics in the combusor are closely related to the swirler. Swirl number
Sn is a dimensionless parameter representing the swirl angle, blade number, and other structural parameters of the swirler. It is generally considered that when
Sn < 0.4, it is a weak swirling flow, 0.4 <
Sn < 0.6 is medium swirling flow, and
Sn > 0.6 is a strong one. When
Sn > 1.2, there will be super swirling flow in the combustor, which may lead to tempering in the combustor under high temperature and high pressure. For premixed combustion, too strong a swirling flow will also lead to unstable combustion in the combustor. Case 1 to case 5, shown in
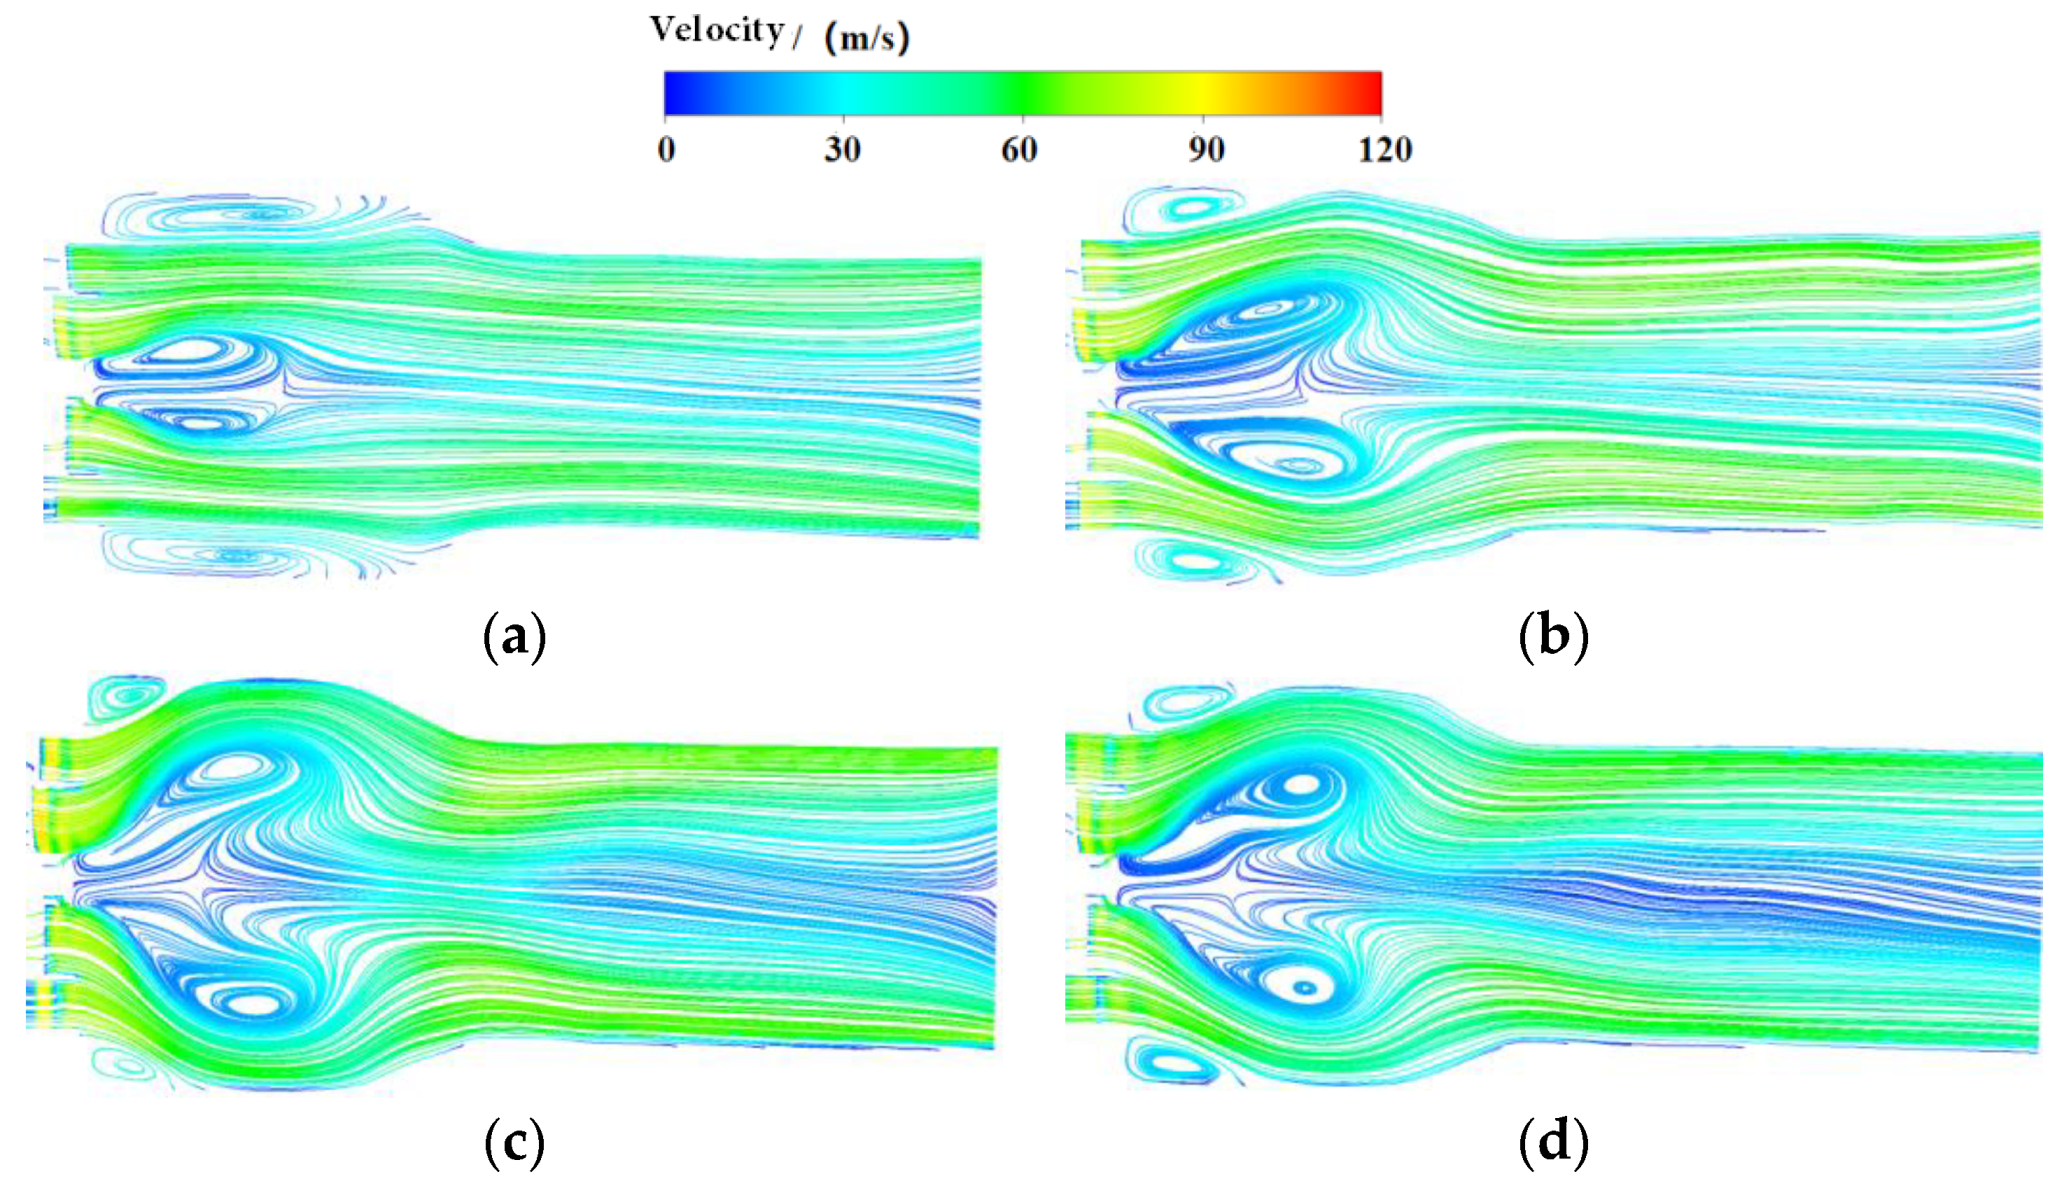
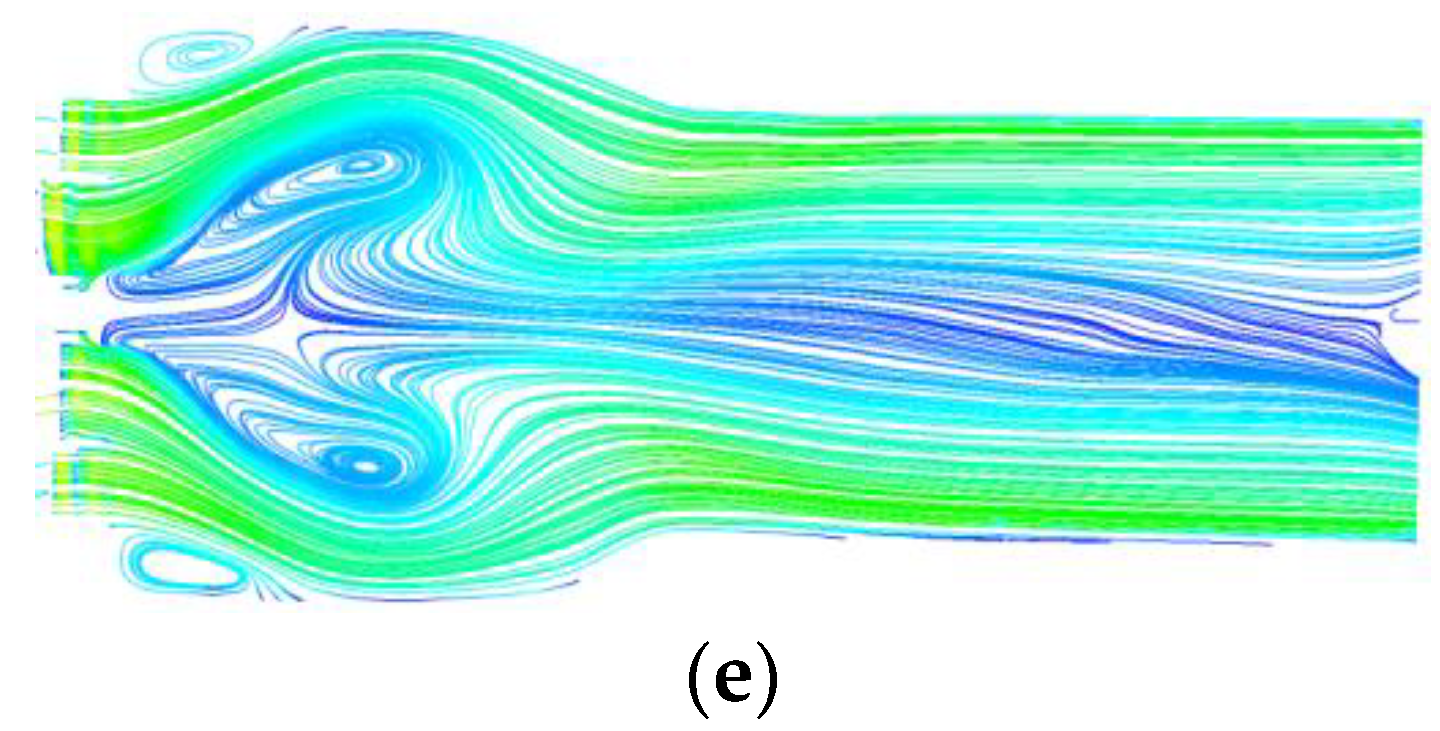
Table 2, are cases in which the swirl number is changed by changing the swirl angle and the blade number of the swirler. The flow characteristics in the combustor for case 1 to case 5 are shown in
Figure 5.
The central recirculation zone (CRZ) and angular recirculation zone (ARZ) can be formed in the combustor for all of the studied cases. The increase in the swirl angle will lead to obvious changes in the size and shape of the recirculation zone. With the increase in the swirl angle, the axial length decreases slightly, but the radial length increases significantly, resulting in the increase in the area of the recirculation zone. When the swirl angle is constant, the swirl number Sn will increase with the increase of the blade number, but the change has no obvious effect on the size and shape of the flow field, as can be seen from the calculation. The velocity distribution in the combustor inlet is different for a different number of swirler blades. The gap between adjacent blades will decrease with the increase in the number of swirler blades, resulting in different air velocity and turbulence through the swirler. The increase in the swirl angle and blade number can both increase the swirl number Sn, while there are some differences considering the flow field. Therefore, when designing a combustor, we should not only consider the range of swirl number, but also study the flow characteristics at different swirl angles and the number of swirlers.
8. Fuel/Air Mixing Characteristics
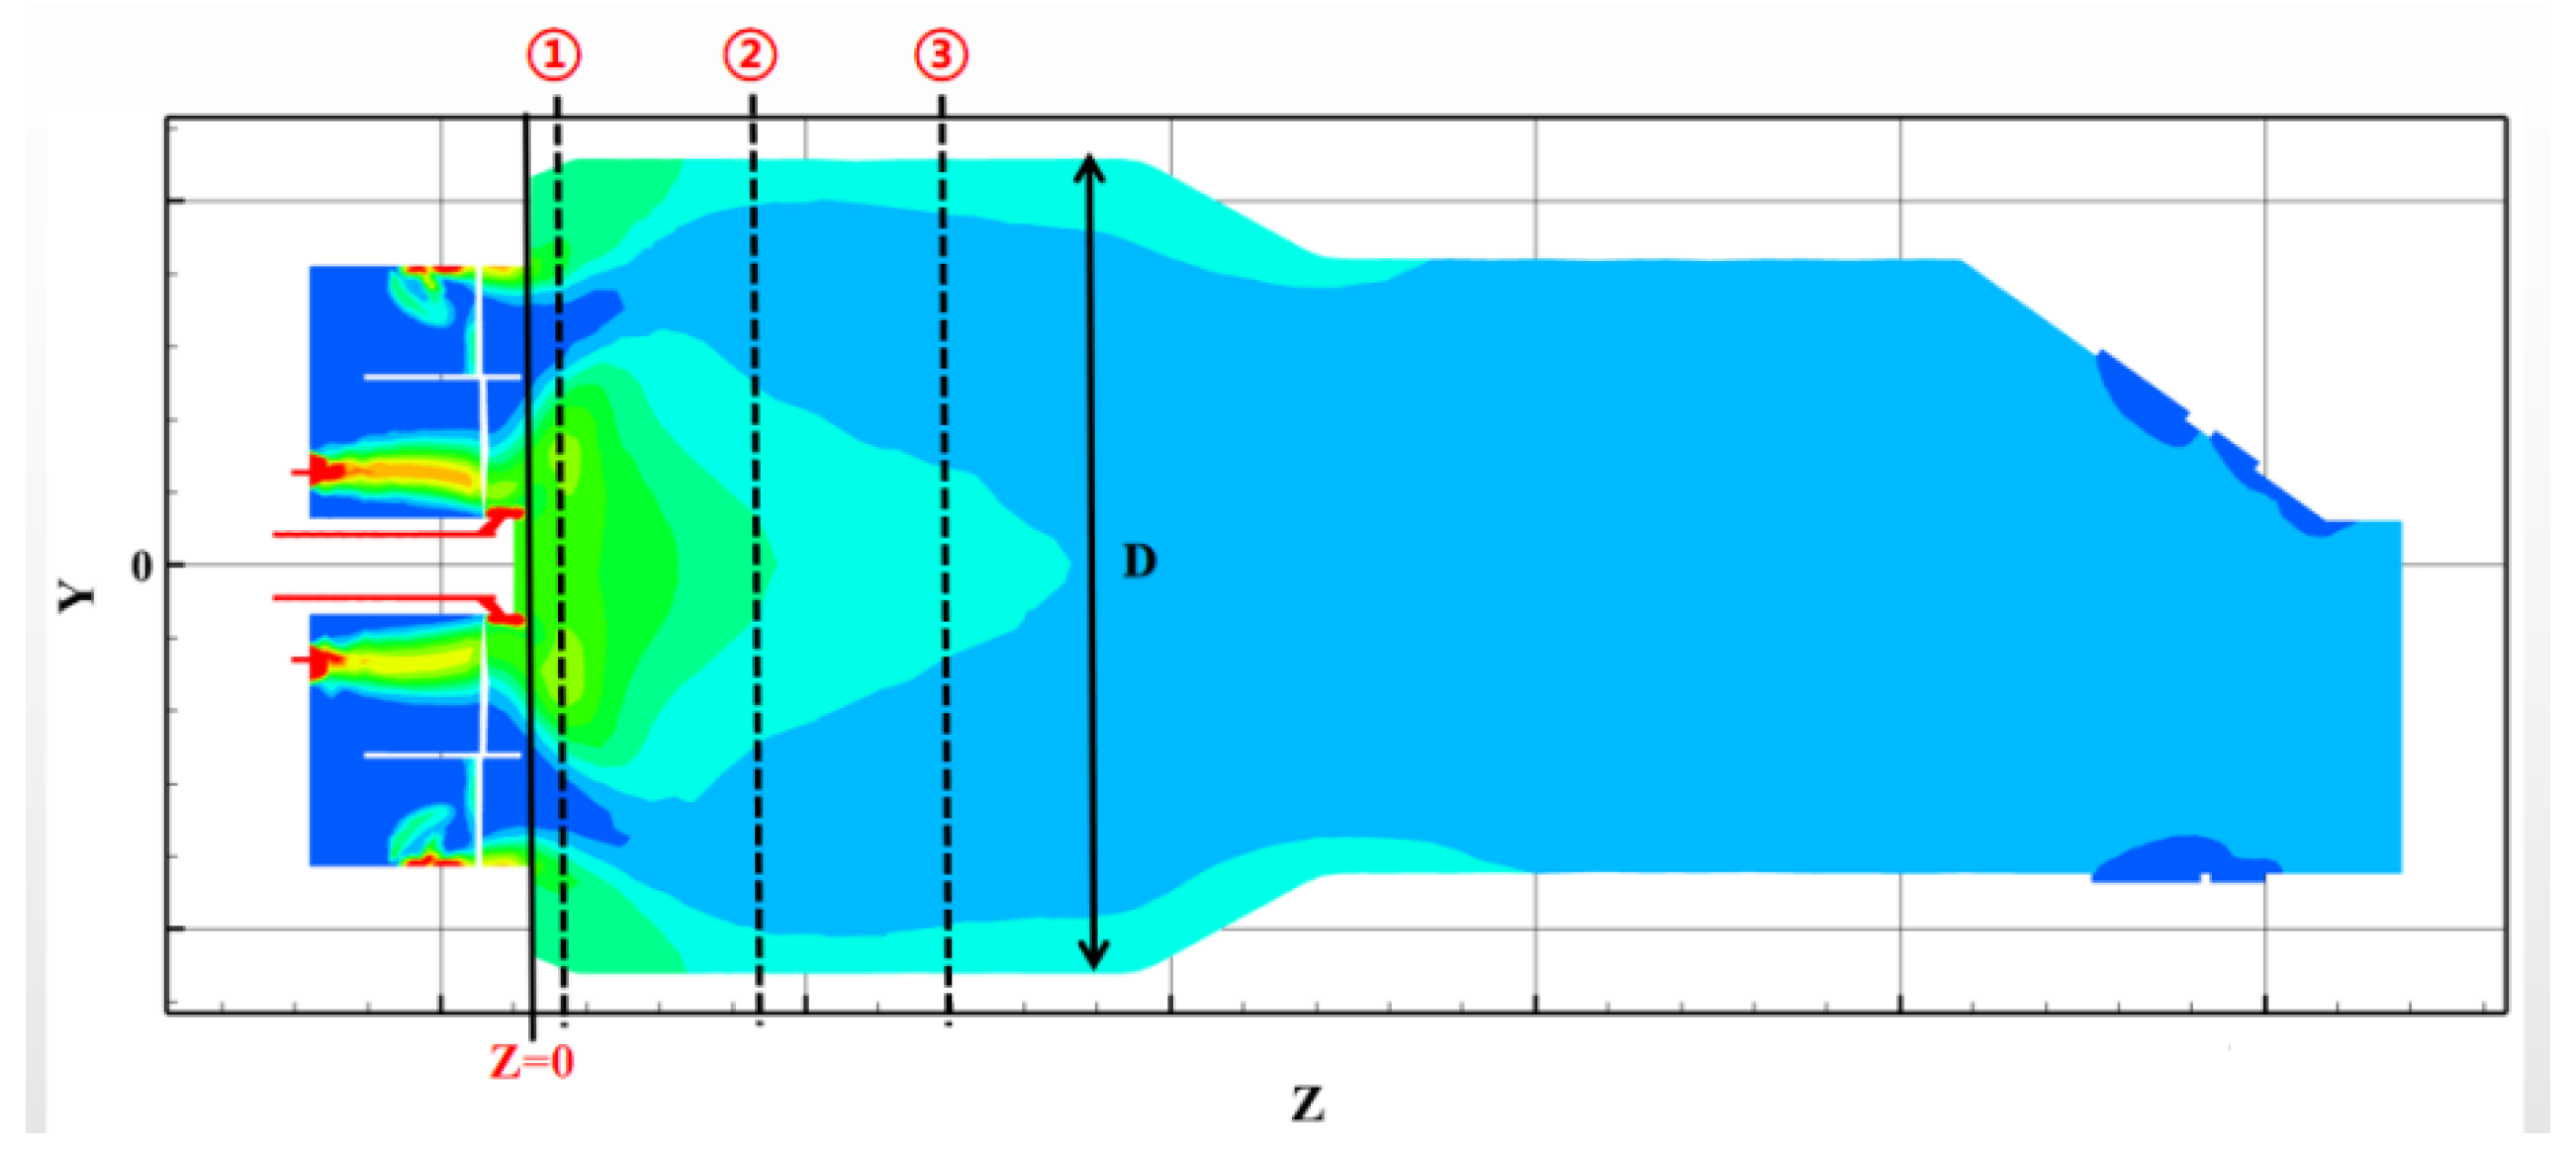
For lean premixed combustion, the mixing uniformity of fuel and air is an important factor affecting the combustion performance. The axial section positions Z/D = 0.05, 0.30, 0.55 (planes ①, ②, and ③) were selected to study the mixing performance for the studied cases, as shown in
Figure 6, where D is the diameter of the flame tube and Z is the axial distance. The mixing non-uniformity of fuel and air can be calculated according to the following definition.
where
NS is the mixing non-uniformity coefficient;
is the concentration of fuel;
is the average concentration of fuel in the plane; and
is the standard deviation of the fuel concentration.
NS = 1 means no mixing, and
NS = 0 means full mixing.
The fuel/air mixture performance calculation results are shown in
Table 3. Among them, case 1 to case 5 is the
Sn change and then the change of flow characteristics, as shown in the previous section. There were four high concentration fuel points at the section center for Z/D = 0.05, as shown in
Table 2. This is because the fuel injected from fuel inlet1 is directly injected into the middle of the flame tube through the nozzles and does not participate in premixing, so the fuel concentration at this position is high. The fuel injected from the main combustion stage nozzle is first mixed with air, and then flows into the main combustion zone of the combustor with the air. In the flow process, the mixing uniformity of fuel and air is gradually improved. This feature can be seen from the gradual decrease in
Ns at different axial positions under each case. Case 3 had the best mixing uniformity according to the calculation results. From the comparison of case 1, 2, 3, the blade installation angle increased, which is beneficial to the improvement in the mixing uniformity. For case 3, 4, 5, the increase in
Sn was caused by increasing the swirler blade number, while the effect of the increase in the number of blades on the mixing uniformity coefficient did not show obvious regularity. From the change in the fuel and air mixing uniformity shown in
Table 3, it can be seen that the change in the air flow characteristics had a certain impact on the mixing uniformity coefficient, but there was no clear correlation with
Sn. Therefore, there is an optimal number of blades to make the mixing uniformity best.
Case 3, case 6, and case 7 are the mixing uniformity comparisons for the different main combustion stage fuel nozzle diameters. Different nozzle diameters will lead to different fuel jet momentum and a different depth of fuel jet entering the combustor. At the position of Z/D = 0.05, there are great differences in the mixing uniformity of nozzles with different diameters, but it is not that the greater the jet depth, the better the mixing uniformity; there is an optimal value to obtain the best mixing uniformity. When Z/D = 0.3 and Z/D = 0.55, the difference in the mixing uniformity caused by the jet momentum still exists, but is not so obvious
Case 3, case 8, and case 9 are the comparison for different fuel nozzle positions. Case 8 was better than case 3 at the section of the premixed outlet. This is because fuel inlet 3 is located in front of fuel inlet 4 and the channel available for premixing is slightly longer. The fuel distribution was similar for the three cases, indicating that the change in nozzle position had no significant effect on the mixing performance. The above phenomena are mainly caused by the compact structure of the combustor head and the short premixing channel at the main combustion stage. Therefore, changing the fuel nozzle position of the main combustion stage has little effect on the premixing distance, so it has no obvious effect on the mixing performance.
Case 3, case 10, and case 11 are the comparison of different fuel inlet jet angles. The jet angle has a significant effect on the premixing characteristics according to the results. For the three jet angles studied, the mixing characteristics for 60° were the best. Too large or too small a jet angle will lead to the increase in the mixing uniformity coefficient and the deterioration of mixing uniformity. At different jet angles, the position of the fuel jet entering flowing air is different. Due to the different turbulence characteristics at different positions in the flow field, there is a great difference in the mixing uniformity coefficient at the axial position closest to the fuel nozzle at Z/D = 0.05, but with the flow of air, the mixing uniformity is basically the same at the position after Z/D = 0.3.
9. Temperature Distribution Characteristics in Combustor
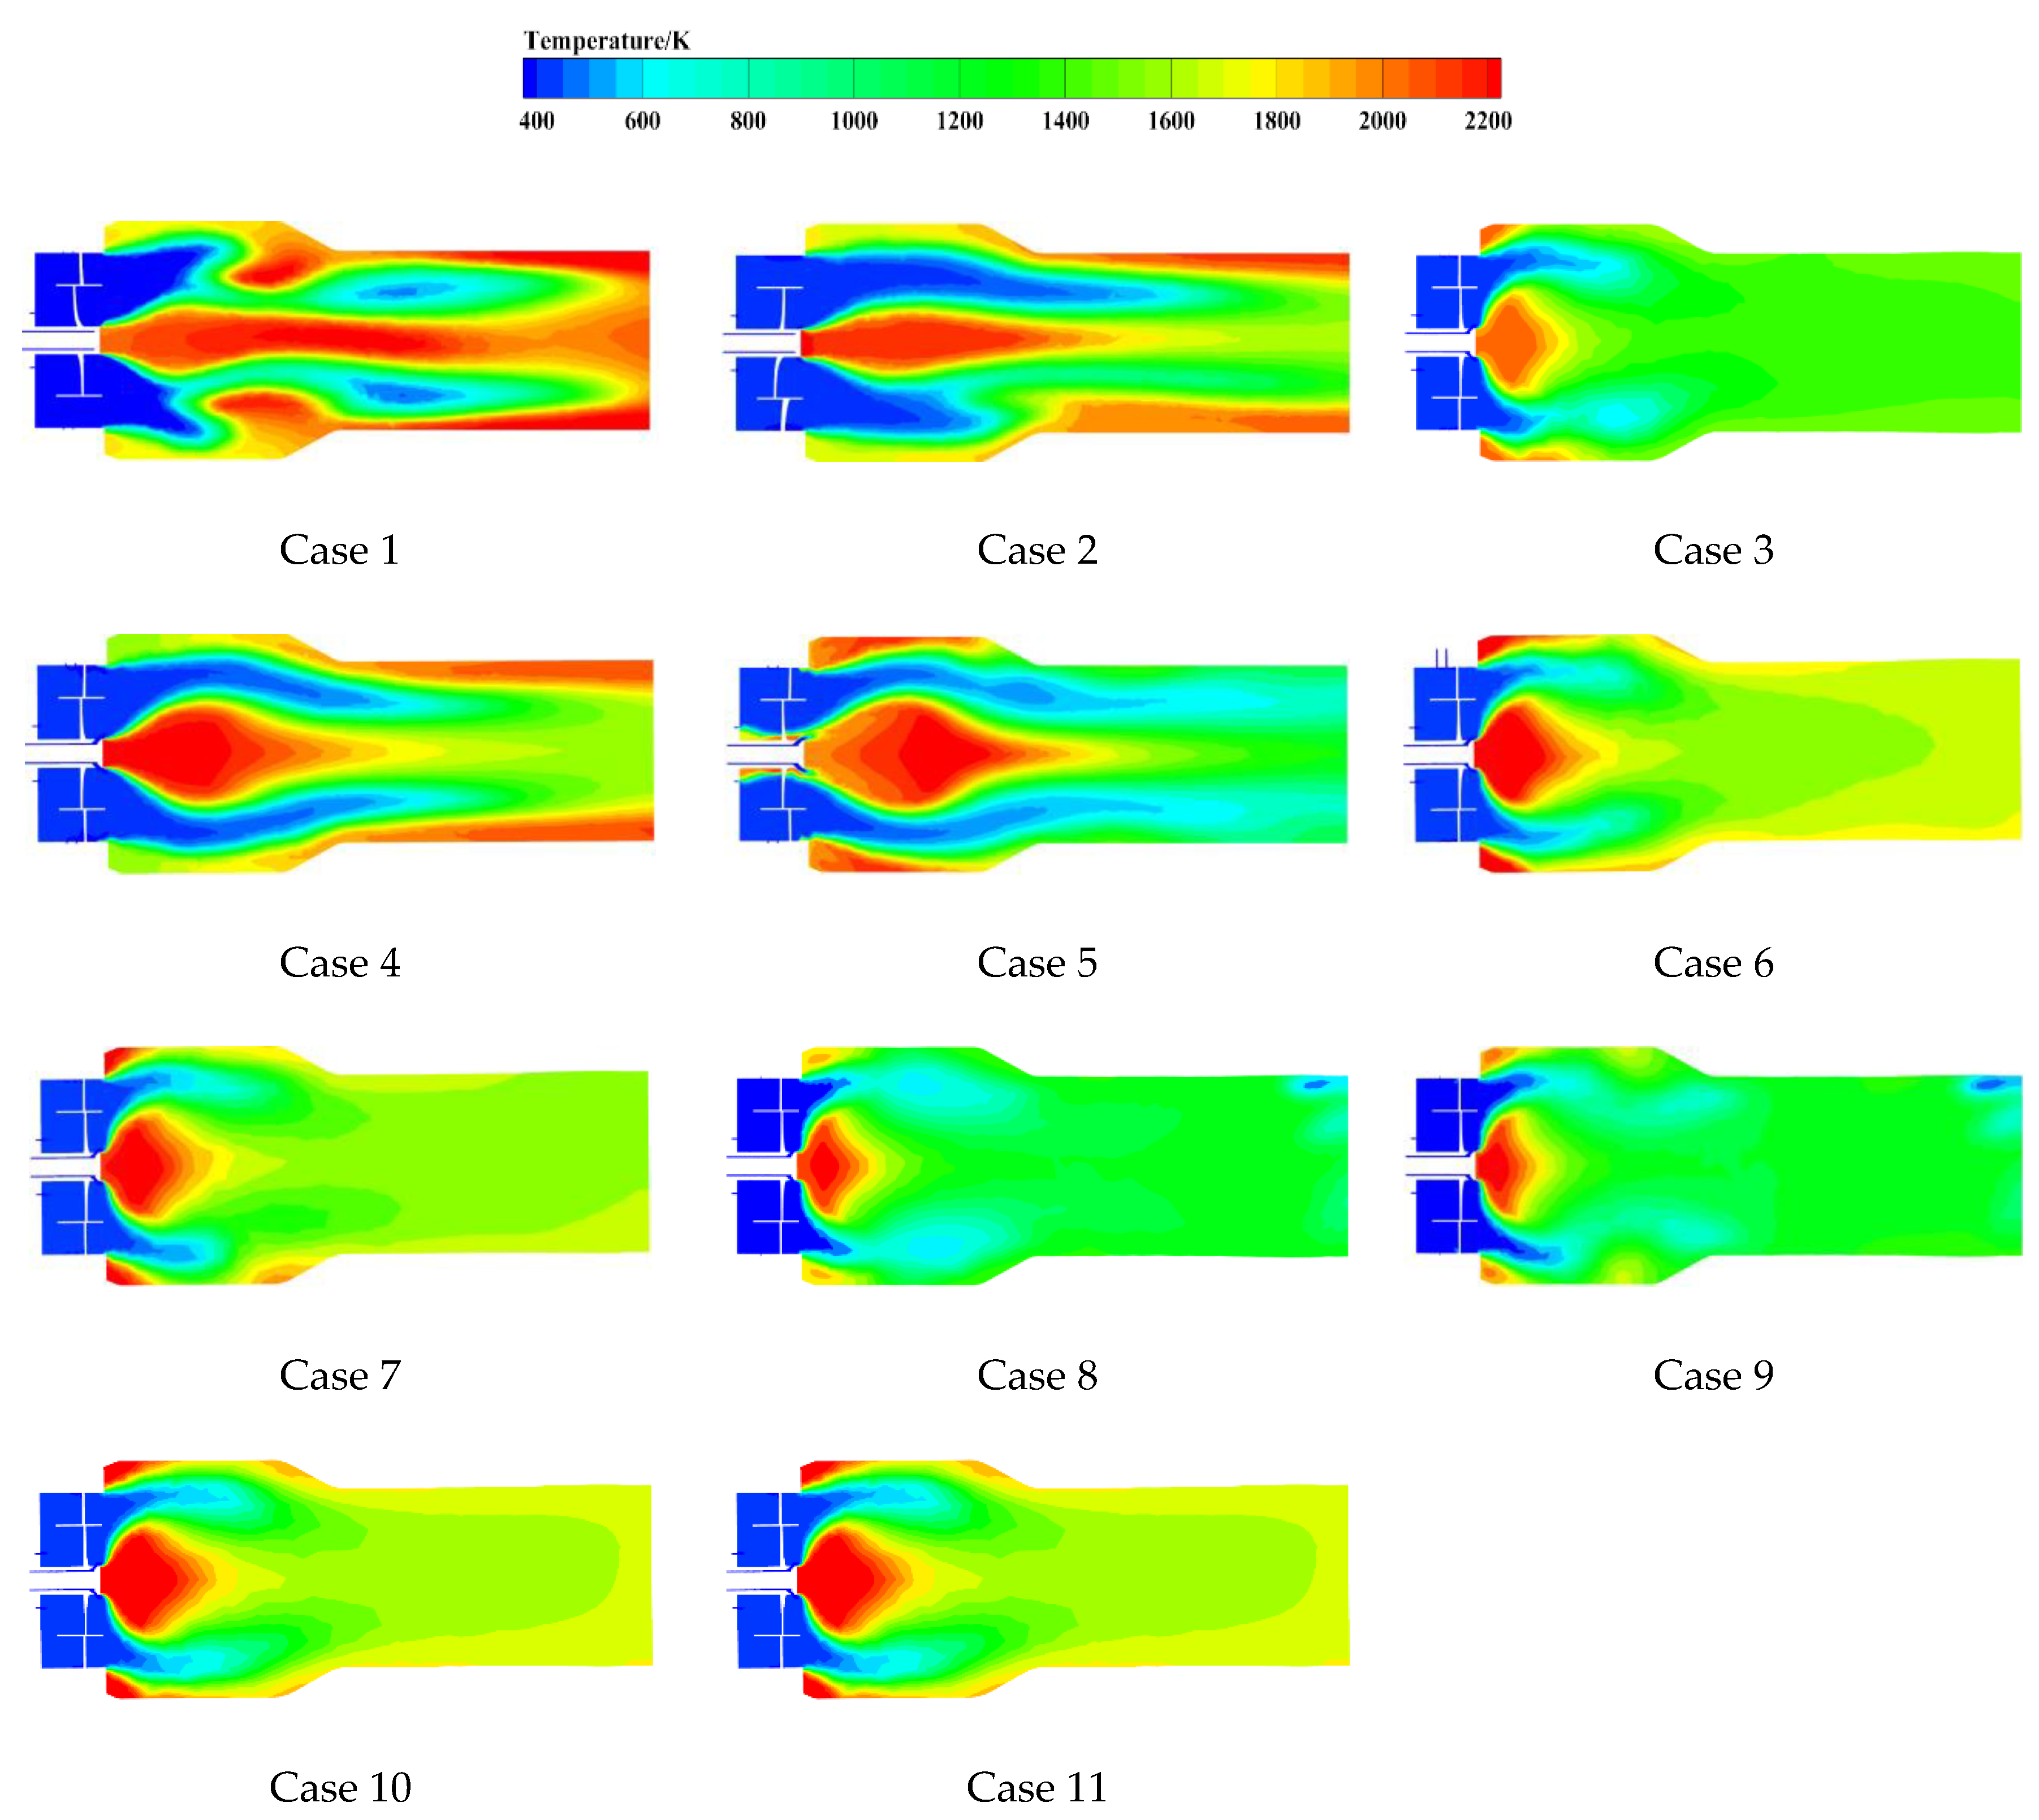
The flow characteristics in the combustor and the mixing characteristics of fuel and air determine the combustion characteristics in the combustor. The temperature distribution in the combustor can directly show the combustion characteristics of the combustor. Numerical calculation is the most common method to study the temperature distribution in the combustor. By analyzing the distribution of the temperature field under different working conditions, the combustion characteristics in the combustor can be qualitatively analyzed. The change in swirl number
Sn will cause the change of the flow field in the combustor. Comparing the temperature field in
Figure 7 and the flow field calculation results in
Figure 5, it can be seen that the shape of the recirculation zone in the combustion state was the same as that in the cold state, but the size became larger. The increase in
Sn caused by the increase in the swirl angle
is beneficial to the uniformity of the temperature distribution, but the change in
Sn caused by the change in blade number had no obvious effect on the temperature field. The differences were the swirl angle
for case 1, case 2, and case 3. According to the temperature distribution calculation results, the area of the high-temperature area will increase with the increase in the swirl angle of the main combustion stage, and the temperature distribution will gradually be uniform. This result is consistent with the previous flow field.
Case 3, case 6, and case 7 are the comparison for the different main combustion stage fuel nozzle diameters. The proper momentum ratio between the fuel and the air benefits the good mixing uniformity, which can lead to a uniform temperature distribution. There is an optimum value of fuel jet momentum, which makes the temperature distribution in the combustor mostly uniform.
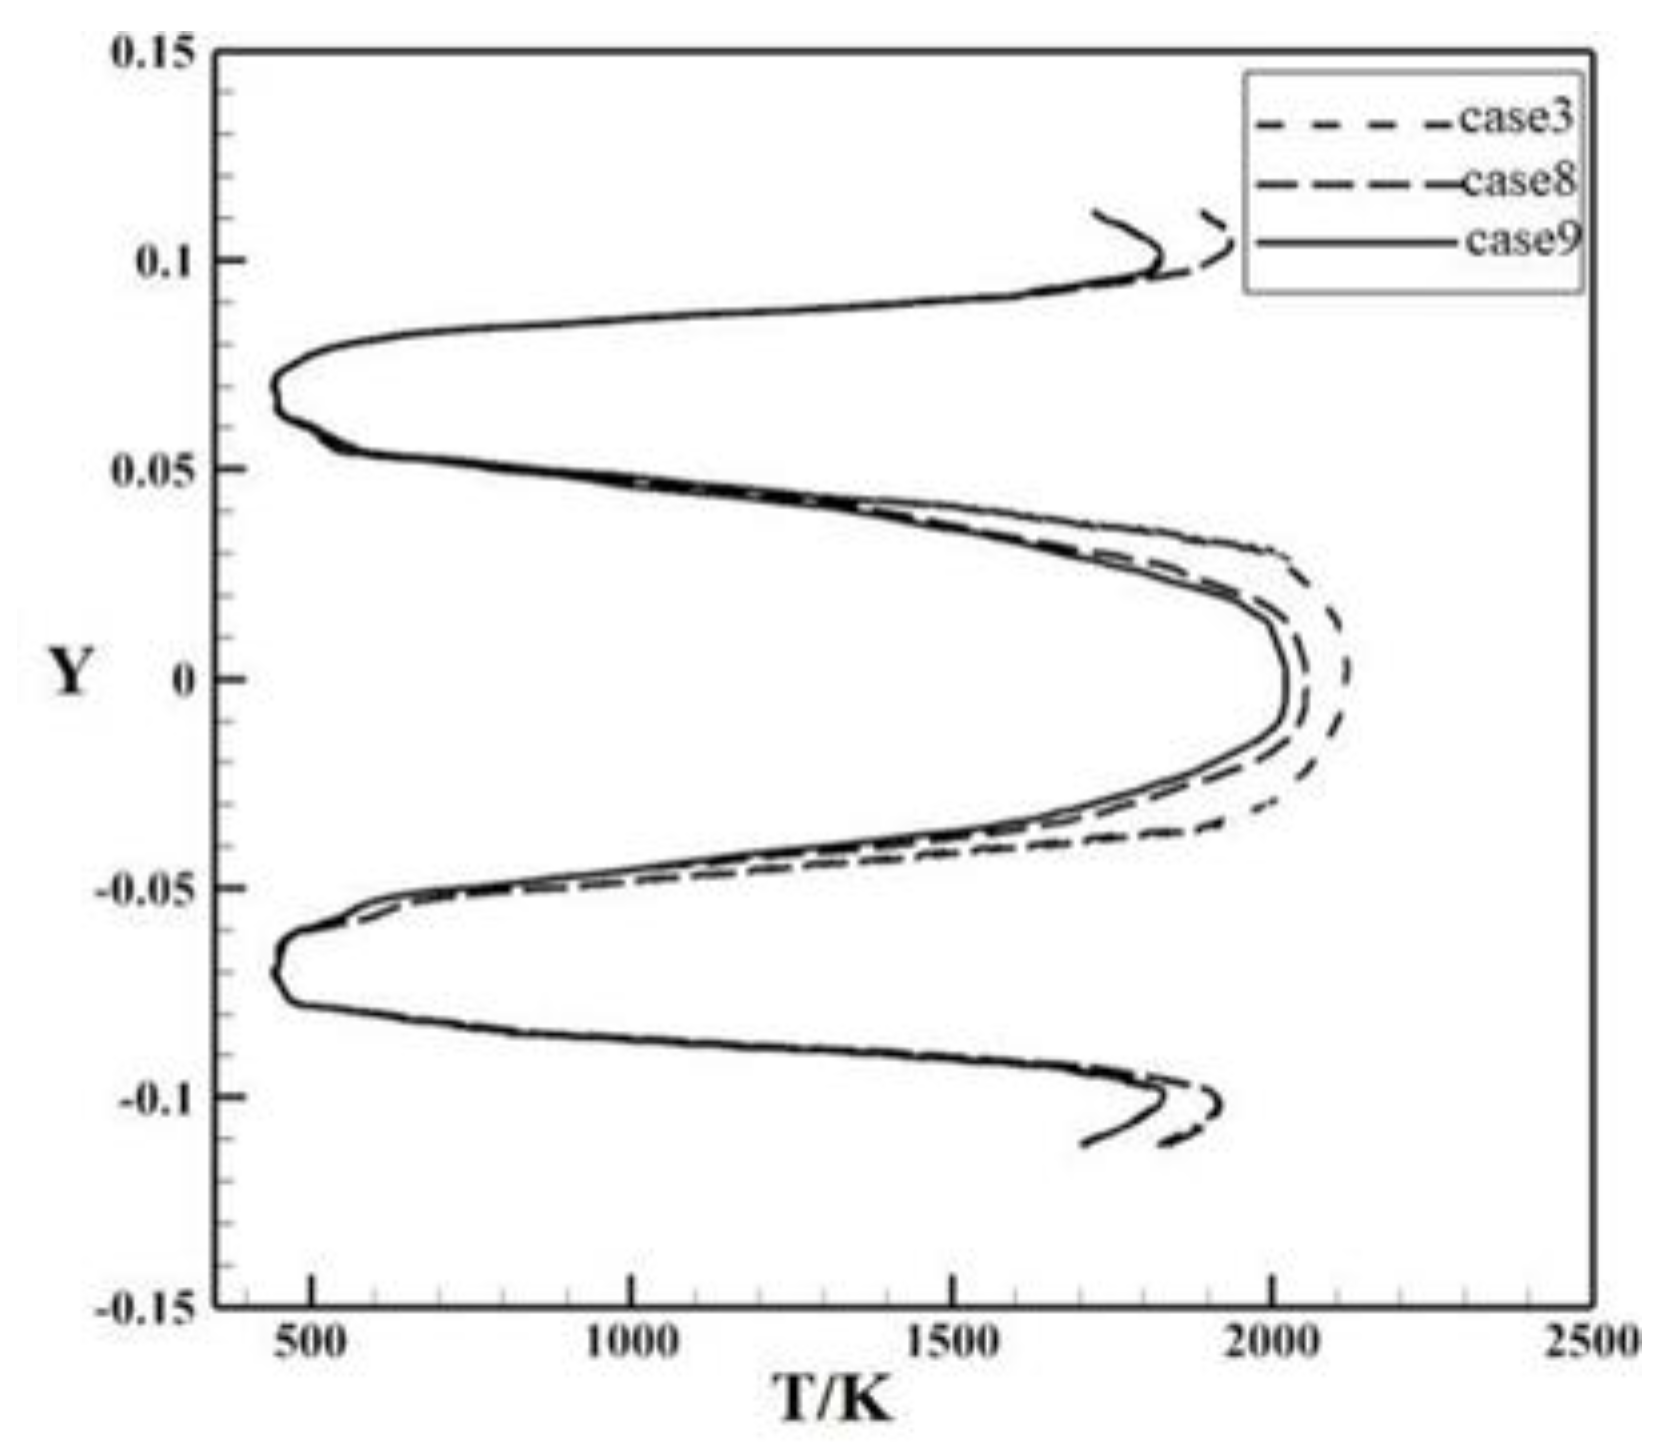
Case 3, case 8, and case 9 are the comparison for different fuel nozzle positions. Compared with case 3, the position of the main combustion stage nozzle moves forward for case 8, and the premixing channel becomes longer. The fuel/air mixing performance becomes better, resulting in an uniformity trend in the gas temperature in this zone. The temperature distribution of the combustor central section at Z/D = 0.05 is shown in
Figure 8. Compared with case 3, the main combustion stage gas temperature of case 8 and case 9 will be slightly lower. It can be seen that the increase in the premixed distance had a certain role in reducing the gas temperature, but the effect was not obvious.
From the previous calculation results of the mixing uniformity, it can be seen that the mixing uniformity is different at different fuel jet angles. However, from the results of the temperature distribution, the effect of this difference on the temperature distribution was not obvious. There was little difference in the shape and distribution of the temperature field at three different jet angles.
Through the qualitative analysis of the temperature field under different working conditions, it can be seen that the blade angle of the swirler at the head of the combustor has a greater impact on the flow field and temperature field. In the structural design of the combustor, the design of the swirler at the head should be fully considered according to the characteristics of the fuel used, and the most suitable swirler structure should be selected. Compared with natural gas, biogas has a lower heat value. Under the same requirements of the combustor outlet temperature field, the increase in the fuel flow will lead to the increase in the fuel jet momentum. When using low heat value biogas as fuel in a micro-gas turbine combustor, the jet hole diameter of the fuel nozzle should be adjusted to establish a suitable relationship between the jet momentum and air flow. Due to the limitation of the structural size, the change range of the fuel nozzle position is small, which has little impact on the fuel/air mixing uniformity and temperature field. When the flow characteristics are the same, the change in the fuel jet angle will lead to different positions of the fuel jet entering the flow field, which will lead to the change in the mixing characteristics. However, from the calculation results of the temperature field, it can be seen that this difference has little effect on the distribution of the temperature field
10. Combustion Performance
Several parameters can be used to evaluate the combustion performance such as the combustion efficiency, combustor outlet temperature fluctuation, combustion stability, and ignition and flameout. The stability map, which involves a wide range of equivalence ratios, was not studied in this research. For steady-state simulation, ignition and flameout is not an issue. Therefore, the combustion efficiency and combustor exit temperature fluctuation were discussed for this study. At the same time, the NOx and CO are also of great concern for low emission combustion technology.
The combustor outlet gas conditions have a significant impact on the gas turbine performance. Severe temperature fluctuation at the combustor outlet may damage the turbine blades, which causes a hindrance in the gas turbine engine operation. Temperature fluctuation at the combustor outlet is evaluated by the pattern factor, which is defined by Equation (13).
where
Tmax is the maximum combustor outlet temperature.
Tave is the average combustor outlet temperature, which is calculated by taking the mass-weighted average at the combustor exit.
Tinlet is the combustor inlet air temperature.
The formulation used to calculate the combustion efficiency is described in Equation (14).
where
cp is the specific heat of the gas mixture, a function of temperature for different compositions.
minlet is the air mass flow rate (summation of fuel flow rate and airflow rate),
mf is the fuel flow rate.
HV is the lower heat value of the fuel used.
The NOx and CO emission are the results converted to 15% oxygen concentration on dry basis using Equation (15).
The comparison of the combustion characteristics between the experiment and numerical calculation is shown in
Table 4. The data before the separator are the calculation results, and behind the separator are the experimental test results for case 3, case 6, case 7, and case 9.
De represents the absolute value of the deviation between the calculated result and the test result. In all four of the comparisons presented in
Table 4, the numerical results are in agreement with the experimental, which validates the numerical code used for these simulations. The combustion efficiency
ηc for the experimental test was lower when compared with the numerical calculation because the temperature rise method was used in the combustion efficiency calculation. The experimental process is not adiabatic, which will lead to the decrease in the combustor outlet temperature, and therefore, the combustion efficiency decreases.
The parameter values evaluating the combustion performance are shown in
Table 5 for different cases. According to the calculation results, the fuel/air mixing characteristics had an obvious influence on the combustion performance. The smaller the mixing non-uniformity
NS, the better the mixing uniformity. Following these results, the increase in the fuel air mixing uniformity lowered the NOx emissions, and a better temperature distribution at the outlet. However, the combustion efficiency decreased and the CO emission increased.
11. Conclusions
The current work presents a numerical simulation investigation for the fuel/air mixing characteristics, combustion performance, and the experimental investigation for the combustion performance in a DLE type can combustor. For aa lean premixed combustion system, the mixing uniformity is a factor that can affect the combustion performance. The fuel and air mixing uniformity is related to the air flow characteristic and the fuel injection performance. In order to understand the effect of air flow and fuel injection on the mixing and combustion performance, a number of Sn and fuel inlet parameters were studied. The simulation results including the flow-field structure, fuel/air mixing characteristics, temperature distribution characteristics in the combustor, and combustion performance at the combustor outlet were presented. Additionally, the combustion efficiency, pattern factor, and the pollutant emissions were tested for four cases.
The comparison shows that the numerical results are in agreement with the experiment, which validates the numerical code used for these simulations. The increase in the swirler blade angle and blade number could both increase the Sn. However, from the results, the increase in Sn caused by the blade angle is beneficial to the mixing uniformity, while the blade number is not. Due to the limitation of mixing space for the micro-gas turbine combustor, the position of the fuel nozzle has little effect on the mixing uniformity. Different fuel nozzle diameters will lead to different jet momentums of fuel entering the combustor. From the simulation results, there was the best jet momentum. Different jet angles will lead to different turbulence characteristics at the entry position of the fuel jet. As such, there is an optimal jet angle to make the fuel/air have a high mixing uniformity.
From the simulation results, it was found that the fuel/air mixing characteristics had an obvious influence on the combustion performance for the studied DLE combustor. The increase in the fuel air mixing uniformity can decrease the NOx emissions and generate a better temperature distribution at the combustor outlet. However, the combustion efficiency decreases and the CO emission rises with better mixing uniformity.


