Article

Predictive Emission Management Based on Pre-Heating for Heavy-Duty Powertrains

Division of Vehicular Systems, Department of Electrical Engineering, Linköping University, 581 83 Linköping, Sweden
*
Author to whom correspondence should be addressed.
Energies 2022, 15(21), 8232; https://doi.org/10.3390/en15218232
Submission received: 5 September 2022 / Revised: 20 October 2022 / Accepted: 21 October 2022 / Published: 4 November 2022

Abstract

:
Hybrid electric vehicles are promising solutions to the need for cleaner transport. Their ability to drive fully electric also opens the possibility of zero local emission operation by turning off the internal combustion engine. However, prolonged periods with the engine turned off result in a cooldown of the aftertreatment system resulting in increased emissions when the engine is restarted. To remedy this problem, an emission management strategy that, based on pre-heating of the aftertreatment system, aims to reduce the impact of a prolonged engine-off event on NO x emissions is developed. The method works by locating each engine-off event and then handling each event separately using an optimization scheme that combines pre-heating and a causal heuristic emission management strategy. The individual events are linked using an equivalence factor that describes the decided trade-off between fuel and NO x . The equivalence factor can be chosen heuristically or iteratively to give the desired result in terms of NO x reduction and fuel consumption. The strategy is evaluated using simulations of a drayage drive cycle with multiple engine-off events. The results from the simulations show that for engine-off times below 0.5 h the strategy can reduce NO x compared to the baseline strategy while using the same amount of fuel. If the strategy is allowed more fuel, significant reductions in NO x can be seen for engine-off times up to 1.5 h, after which an exponential decay in the effectivity of the strategy is observed. It is also shown that the reduction in NO x is fairly linear in the equivalence factor, which gives the procedure of choosing it a predictable behavior.

1. Introduction

The temperature of the aftertreatment system is highly important for its ability to reduce emissions, and prolonged engine-off events can therefore increase emissions. This is true for all powertrains with a combustion engine and aftertreatment system; however, hybrid electric vehicles that are capable of full-electric drive can be expected to have more and longer engine-off events, making this a bigger problem. At the same time, the use of geofencing to create so-called green zones is considered a possible way to reduce pollution in vulnerable areas. However, while green zones have the benefit of zero emissions within the zone, turning off the combustion engine for long periods of time can result in higher emissions when it is restarted due to reduced aftertreatment system temperatures.
In the open literature, control of hybrid electric vehicles is mainly dedicated towards fuel-optimal control, and the impact on pollutant emissions is not actively dealt with, see [1] for a summary of typical approaches. One of the most common approaches is the Equivalent Consumption Minimization Strategy (ECMS), first proposed in [2,3], where an equivalence factor between fuel power and electrochemical power is used to decide how the torque is split between the combustion engine and the electric machine. Another common approach is the more general Model Predictive Control (MPC) approach, see [4] for a review of this approach. There are also more fundamental studies on energy flows, such as [5].
Emission management for hybrid vehicles is a less well-studied topic and only a limited number of publications can be found, see [6] for a short summary. When it comes to emission management, the temperature of the aftertreatment system is the dominating factor and a common strategy is to extend the ECMS with a costate related to this temperature, such as in [7]. However, this costate is not constant over time and must be chosen carefully for reliable behavior. It is also important to consider that measures taken by the emission management system, for example heating the aftertreatment system, usually not only affect the instantaneous emissions, but also future ones. For this reason, predictive methods such as MPC are attractive solutions, and there exist a few successful implementations [6,8,9].
When it comes to green zone-related research, a focus on fuel consumption is again seen, see, e.g., [10,11]. However, a few related studies can be found. In [12] the cold-start behavior of a parallel hybrid electric powertrain consisting of a gasoline engine followed by a three-way catalyst on an FTP urban cycle is investigated. In [13], an integrated energy and emission management approach is followed for a hybrid electric vehicle with an SCR system, and the powertrain behavior during a city cycle, characterized by short engine-off events, is studied. In summary, a detailed study and methodology for emission management strategies for improved emission behavior around green zones is still missing.
In [14], a strategy for pre-heating of the aftertreatment system before the engine is turned off is presented, showing promising results. However, that strategy only handles isolated events and cannot be considered a complete emission management strategy. Starting from these results, this paper presents an emission management strategy based on pre-heating that address the problem of prolonged engine-off events in a general setting. It is thus contributing to energy management of the thermal energy in the SCR catalyst and the entire aftertreatment system.
The main contribution is an emission management strategy, based on pre-heating, for hybrid electric vehicles that reduce the impact prolonged engine-off events have on NO x emissions. Also included are contributions concerning the general behavior and benefits of pre-heating.

2. Modeling

The model used in this paper is developed and validated in [15] and what follows is a short summary.

2.1. Engine Model

The engine model is map-based and the fuel consumption and gas conditions after the turbine are determined based on the engine speed, N; engine torque, M; and engine mode u. The output from the engine model are the gas conditions after the turbine (temperature, T a t ; exhaust mass flow, W e x h ; concentrations of NO , NO 2 , and O 2 ) and fuel consumption.

2.1.1. Engine Modes

Three different sets of maps are used in the model, corresponding to the three modes of the engine: modes 1, 2, and 3. Mode 1 is the least efficient mode and is used mainly for cold-starts, mode 2 is slightly more efficient and is mainly used in scenarios where the aftertreatment system risk becoming too cold, and mode 3 is the most efficient mode. In practice, each mode corresponds to a number of parameters and set points for actuators in the engine, and changing the mode affects all outputs of the engine. Since this work focus on pre-heating, the engine out temperature and exhaust mass flow are most important and the full details of the modes are out of scope. However, how the engine out concentrations are affected is also included in the model, particularly important is that the two less efficient modes produce less NO x .

2.1.2. Turbine Thermal Inertia

The studied engine is turbocharged and has a turbo compound unit. It, therefore, has two turbines, and to account for the thermal masses of these a state corresponding to their lumped thermal inertia is included in the model. The dynamics of this state are based on the energy balance of the turbine where the exhaust mass flow, W e x h ; engine out temperature, T e o ; and turbine efficiency η t are used to calculate the energy losses and temperature after the turbine, T a t .

2.2. Aftertreatment System Model

The aftertreatment system model is composed of the following components:
  • Engine down pipe (EDP);
  • Diesel oxidation catalyst (DOC);
  • Diesel particulate filter (DPF);
  • Urea decomposition pipe (UDP);
  • SCR catalyst (SCR);
  • Ammonia slip catalyst (ASC).
In Figure 1 an illustration of how the components are connected can be seen. The models are based on physical principles in the form of partial differential equations describing the catalysts and the reactions listed in Appendix A. The partial differential equations are solved by discretizing the catalysts into smaller segments creating a set of ordinary differential equations. More information about the catalyst models can be found in [16] and in [17] the details of the DPF model can be found. To describe the cooling of the aftertreatment well the models are extended with the results from [18], where a two-dimensional thermal model was developed, and it was found that conduction both in the axial and radial dimensions is important to describe the cooling.

2.2.1. DOC and DPF

Since this work focuses on NO x emissions, the most important reaction in the DOC and DPF is redox of NO / NO 2
2 NO + O 2 2 NO 2

2.2.2. SCR Catalyst

In the SCR catalyst, a state for the amount of ammonia stored in the catalyst, Θ , is included in the model, which is governed by the adsorption and desorption of NH 3
NH 3 NH 3 *
where * denotes that the species is adsorbed on the surface of the catalyst. The two most important NO x reducing reactions are the standard SCR reaction
4 NH 3 * + 4 NO + O 2 4 N 2 + 6 H 2 O
and the fast SCR reaction
2 NH 3 * + NO + NO 2 2 N 2 + 3 H 2 O
out of which the fast SCR reaction is faster. However, as can be seen, the fast reaction requires both NO and NO 2 , and since diesel exhaust often contains a high proportion of NO the standard reaction is in many cases the dominating reaction and converts the most NO x .

2.2.3. Ammonia Dosing Controller

In the SCR catalyst, the stored ammonia is used to convert NO x and its efficiency is highly dependent on the amount of stored ammonia, Θ . Because of this, high ammonia storage is desirable. However, as the ammonia storage increases, so does the ammonia slip (ammonia leaving the catalyst unaffected), which is limited by legislation.
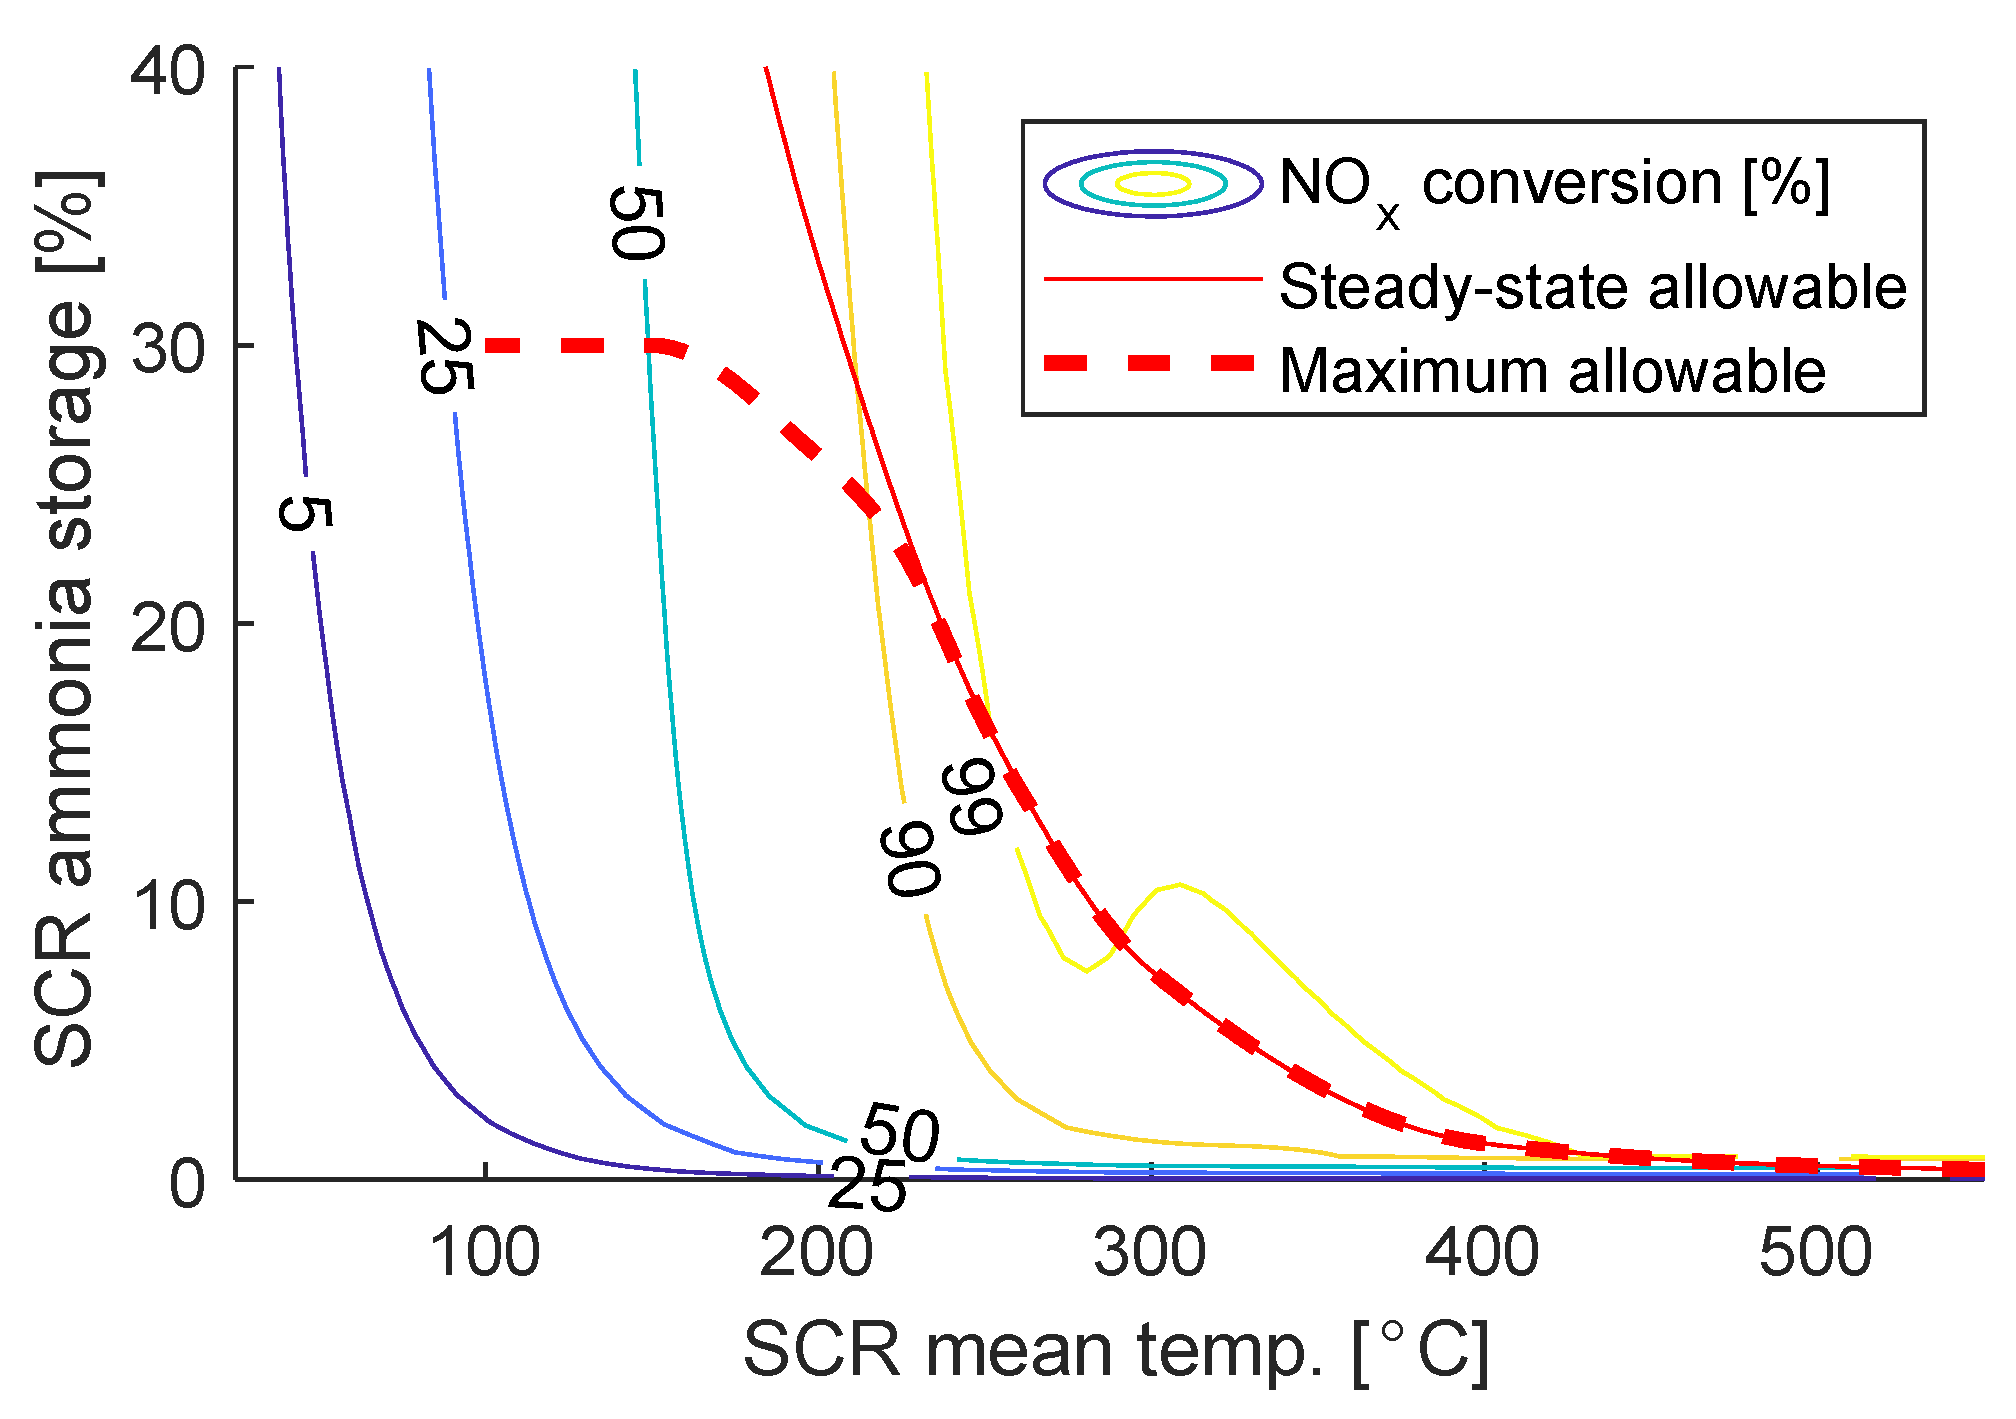
To determine the appropriate amount of ammonia storage reference level, Θ r e f , which depends on the mean SCR temperature, T S C R , is used. This reference can be seen in Figure 2 where the solid red line shows the maximum ammonia storage level that is possible during steady-state operation without exceeding the limit of 25 PPM of ammonia slip. During transient operation, however, this line cannot be used since if the SCR temperature increases and the stored ammonia is not used quickly enough the stored ammonia will end up above the allowable limit. Some margin is therefore needed and therefore the dotted red line is instead used as a reference. The dotted line has been calibrated as the maximum allowable storage on the WHTC test cycle.
The dosing of urea is controlled to track the ammonia storage reference level using the following controller
W D E F = 1 X NH 3 M NH 3 M NO η S C R W NO x K p W e x h Θ r e f ( T S C R ) Θ
where X NH 3 is the ammonia to water ratio in the diesel exhaust fluid, M NO is the molar mass of NO , M NH 3 is the molar mass of NH 3 , W NO x is the NO x flow, η S C R is the current NO x conversion efficiency, and K p is the proportional gain, which is a tuning parameter. The controller can be seen as a proportional controller with feed-forward, where the first term
M NH 3 M NO η S C R W NO x
is the feed-forward used to account for the ammonia currently consumed in the catalyst, and the promotional term
K p W e x h Θ r e f ( T S C R ) Θ
is used to track the reference.
Injecting urea when the catalyst is cold can lead to crystallization which is harmful to the catalyst, therefore, dosing is only allowed when the first 5 cm of the SCR catalyst has a temperature above 180 C. This is implemented by looking at the corresponding first segments in the discretization used by the model.

2.3. Simulation Setup

To simulate the model, the Adams–Bashforth method developed in [15] is used. It uses the fundamental step size of 0.1 s, which is chosen since it is the smallest step size that can represent the tested drive cycles well. The method is a variable-step, variable-order method, meaning it dynamically chooses the order and step size of the method for the best performance. During transient operation, the method typically uses forward Euler with a fundamental step size of 0.1 s. This is because the rapid changes in the input limit the step size that is possible to use without losing accuracy, making the extra computational cost of higher-order methods unnecessary. During more stable operations, for example, idling or engine-off events, the method makes use of higher-order methods and takes larger steps.

2.4. Validation

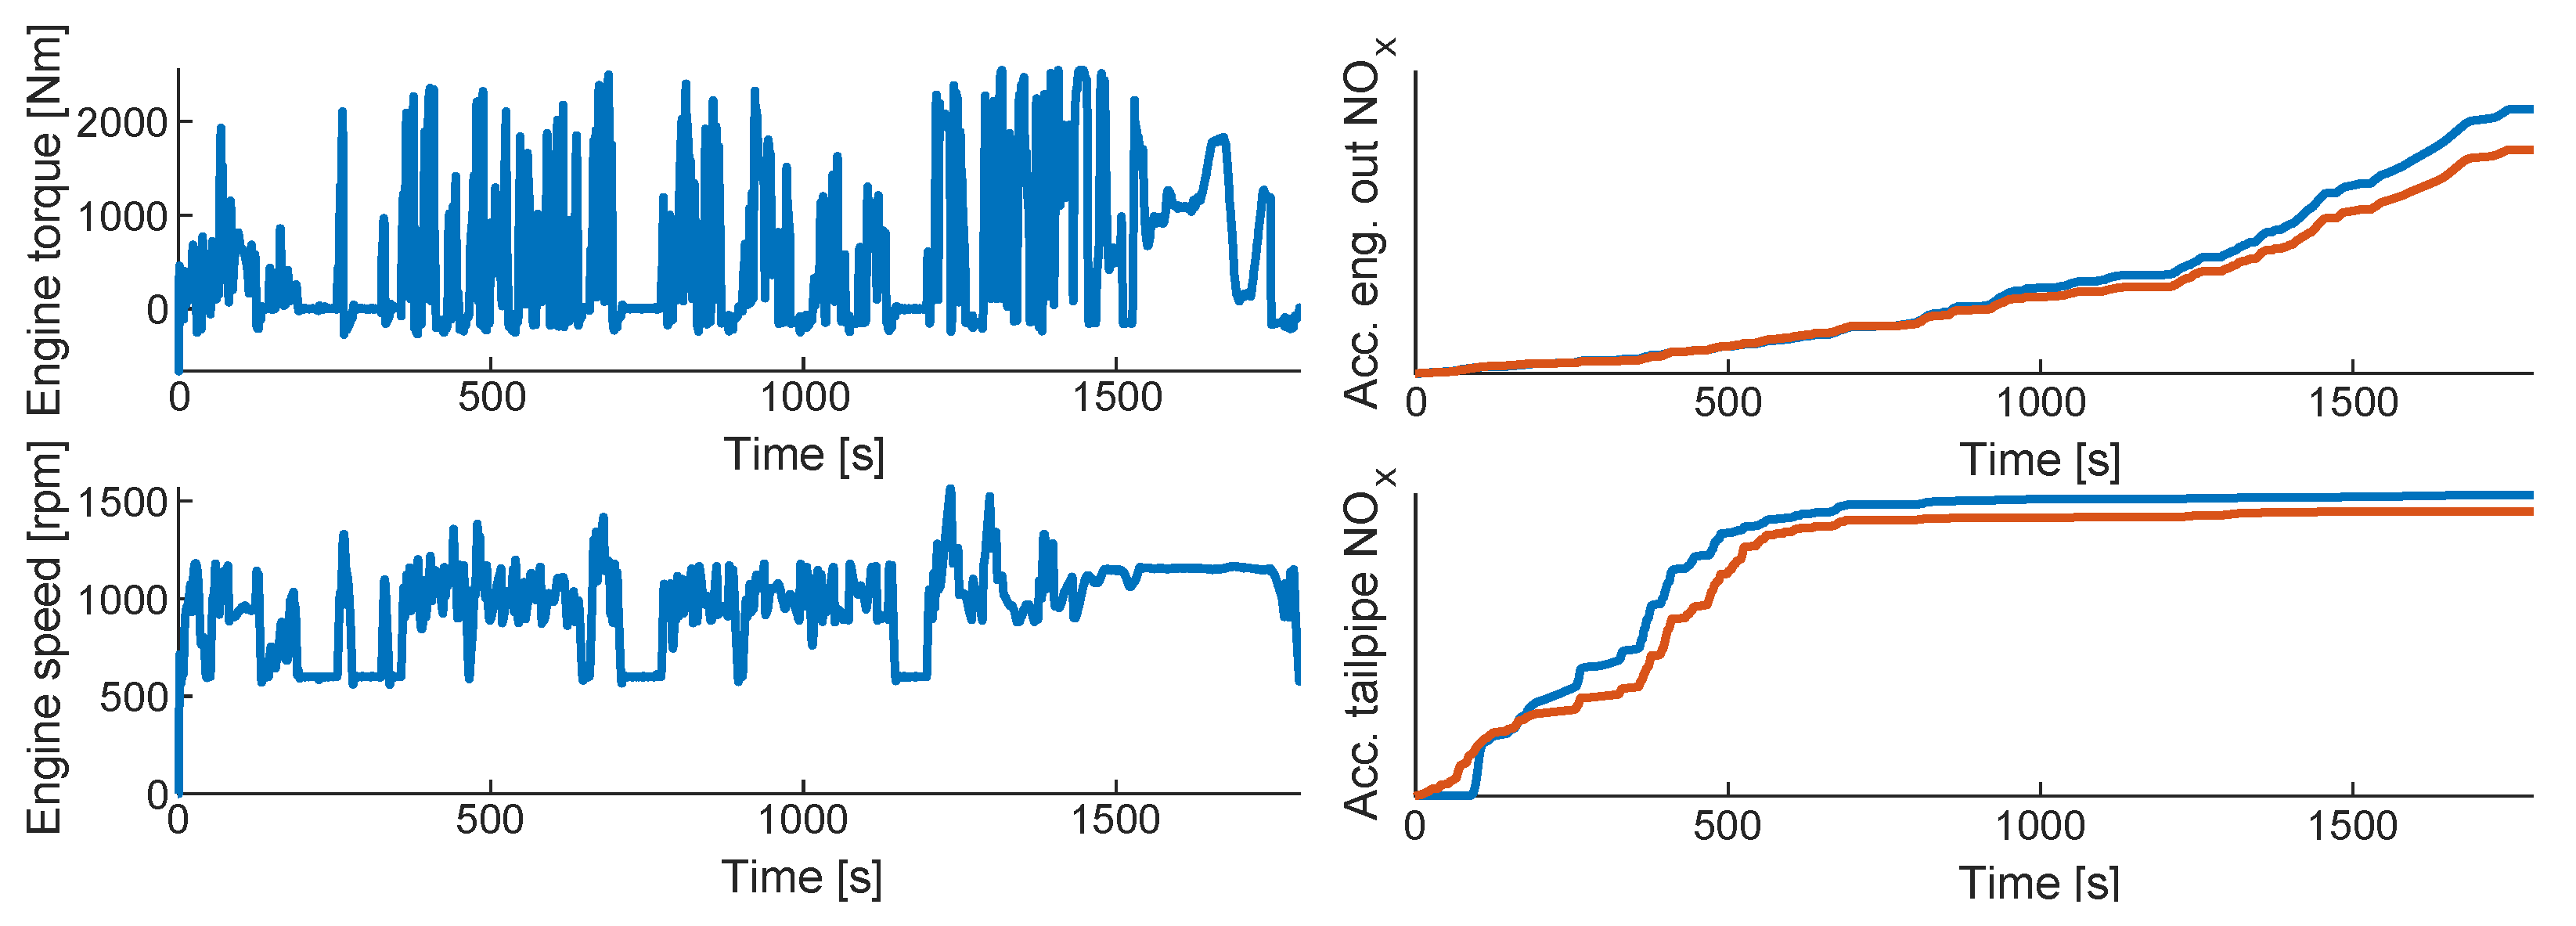
The validation of the model is done using measurements from a WHTC test cycle and the results can be seen in Figure 3. As can be seen, the simulated engine out and tailpipe NO x follows the measurements well and the model seems to capture the cold start behavior of the system well. During the first 100 s, the measured tailpipe NO x is zero. This is probably due to the adsorption of NO x in the SCR catalyst, something that is not included in the model. However, after this 100 s, the trends are very similar.

3. Emission Management Strategy

Based on the pre-heating strategy proposed in [14], the aim is to develop a control strategy for predictive emission management in a more general setting. The strategy in [14] assumes that the time window for when pre-heating is possible and how much extra fuel should be used are known. The main challenges are, therefore, to find the events where pre-heating is possible and to decide how much fuel should be used. The remainder of this section describes how these two problems are solved.

3.1. Causal Emission Management Strategy

As a baseline, a causal emission management strategy is used. The causal strategy is a simple rule-based strategy that, based on the temperature of the SCR catalyst, decides one of the three engine modes. When the first 5 cm of the SCR is colder than 180 C, ammonia dosing is not allowed and, therefore, the least efficient mode is used in this case, and to introduce some margin the least efficient mode is always used when the front of the SCR is colder than 190 C. When the SCR becomes colder than around 240 C its efficiency starts to go down and, therefore, mode 2 is used for some extra heat in this case. In Figure 4 an example where the strategy is applied to the WHTC is shown.

3.2. Equivalence Factor

To handle the trade-off between fuel and NO x emissions, an equivalence factor, λ NO x , between them is used. The equivalence factor tells how much extra fuel, Δ m f , e v e n t , that it is accepted to be used by the strategy for a reduction in NO x of Δ m NO x . Mathematically this is formulated as
λ NO x Δ m f , e v e n t Δ m NO x
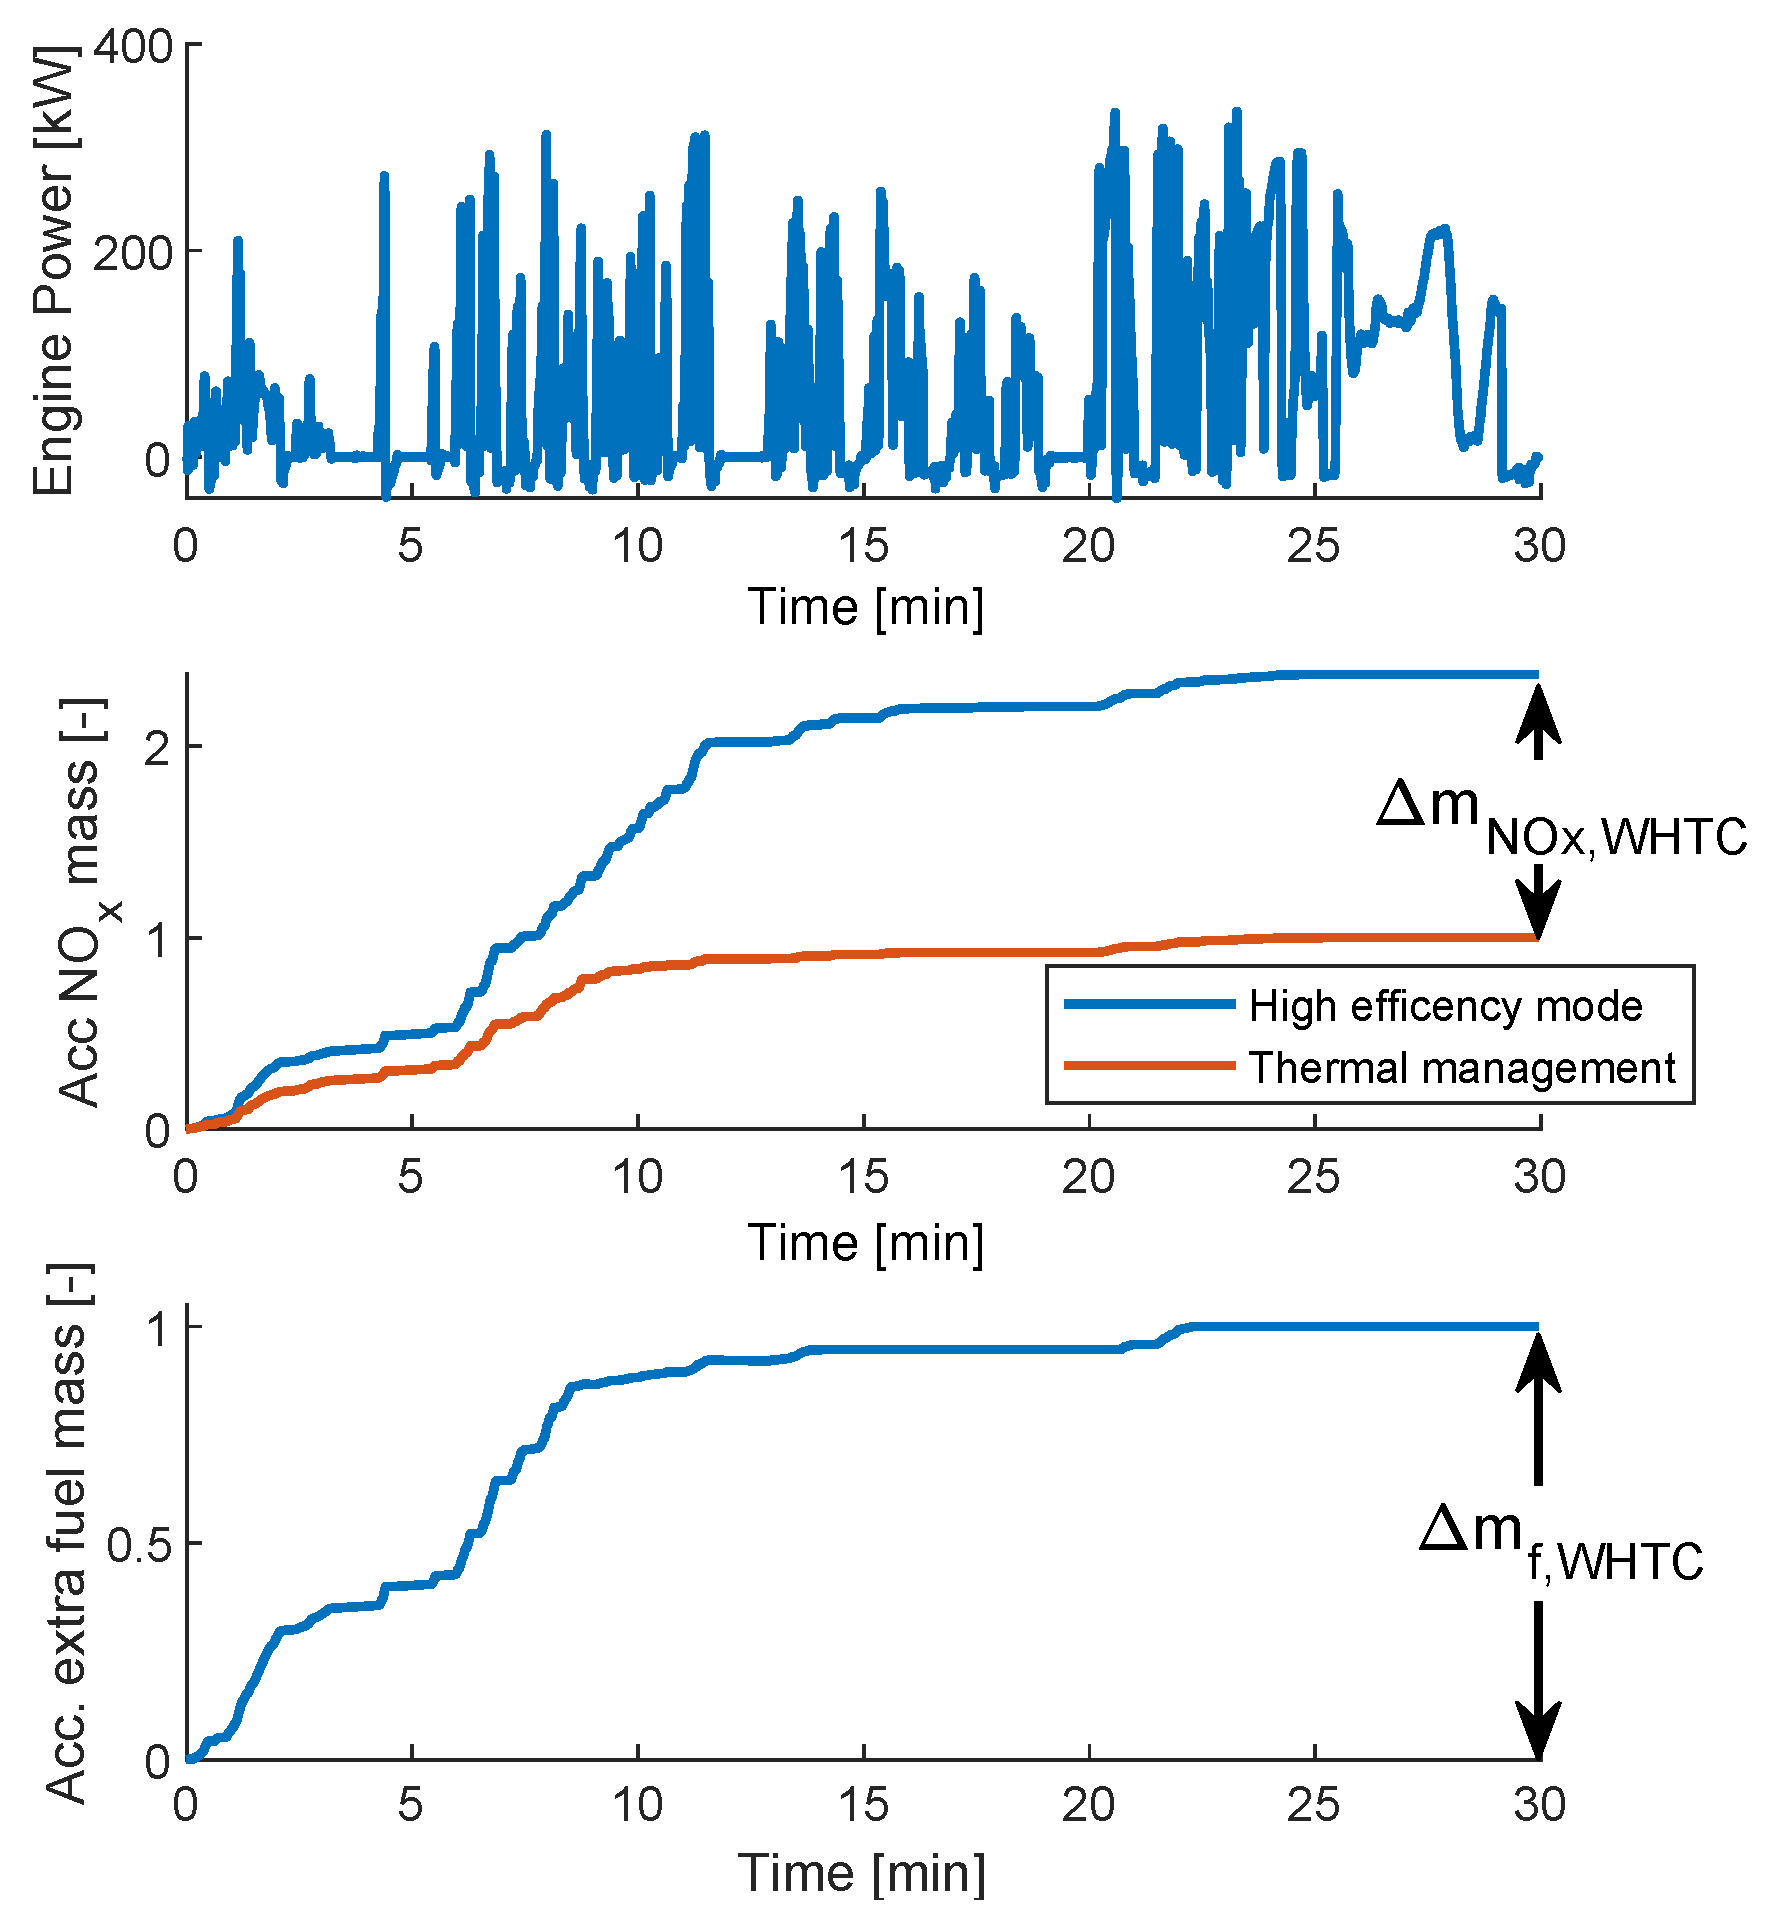
In Figure 5 an illustration of the masses used in the equivalence factor condition is shown.

3.2.1. Normalized Units

Figure 5 also defines the normalized units NFU and NNU for fuel and NO x , respectively. One NFU corresponds to the amount of extra fuel used, compared to using the most efficient engine mode, that the baseline controller use on a cold start on the WHTC, and one NNU is defined as the corresponding reduction in NO x .

3.2.2. Interpreting the Equivalence Factor

Using the normalized units λ N O x 1 and λ N O x = 1 directly relates to the well-known WHTC, making it a good reference. It can also be noted that λ N O x < 1 corresponds to fuel being used more efficiently to reduce NO x compared to the baseline strategy. In the same way, λ N O x < 1 corresponds to less efficient use of the fuel, which may still be desirable if a greater reduction in NO x than the baseline controller can give is wanted. For this reason, these units are used throughout the whole paper.
For very large λ N O x , the only possible solution to (8) is Δ m f , e v e n t , to denote such a value we use the notation λ N O x = (implicitly using the convention 0 · = 0 ). This means that no pre-heating is used, resulting in the baseline strategy.

3.3. Event Localization

An event is defined to consist of two parts: a pre-heating phase where pre-heating is done and a pollution phase where the emissions are to be minimized. A drive cycle can include many events, and they are found in sequence starting with the earliest one.
An event is localized by first finding the pollution phase, and for this, the baseline emission management strategy is used. A pollution phase starts when the baseline strategy changes engine mode to heat the aftertreatment system and ends when it changes back to the efficient engine mode. The next pollution phase is, therefore, easily found by simulating the system, using the baseline strategy, from the end of the last pollution phase until the next time a less efficient engine mode is used, this is the start of the next pollution phase, denoted t p u , s . The simulation then continues until the strategy switches back to the most efficient engine mode, marking the end of the pollution phase, denoted t p u , e .
After the pollution phase is found, the pre-heating phase can be determined. The pre-heating phase ends where the pollution phase begins and what is left is to determine its start, t p r e , s . To determine t p r e , s , the accumulated amount of tailpipe NO x from the end of the last event to the end of the pollution phase of the current event, if the most efficient engine mode is used, is first determined by simulating the model. This is the maximum amount of NO x that can be emitted from this phase and is denoted m NO x , m a x . Using this value and the desired equivalence ratio λ NO x , the maximum amount of extra fuel that can be used in the event can be calculated as
Δ m f , m a x = m NO x λ NO x .
Using this, the length of the pre-heating phase is defined as the length which would result in an extra amount of fuel of exactly Δ m f , m a x if the least efficient engine mode is used throughout the whole phase.
For small λ NO x , the size of the pre-heating phase can become unnecessary large; since it takes around 10–20 min to heat the aftertreatment system, a phase longer than that can be considered too large. To reduce the calculation time it is therefore of interest to limit the size of the phase. However, limiting the size in time is not straightforward since the time constants of the aftertreatment system depend on the exhaust mass flow in the way that operating points with low mass flow require a much longer time to settle compared to operating points with high mass flow, and a limit that covers both would again result in unnecessary large windows. Therefore, the limit is instead based on the total exhaust mass from the phase such that the length of the phase is limited so that the total exhaust mass is smaller than a specific value.
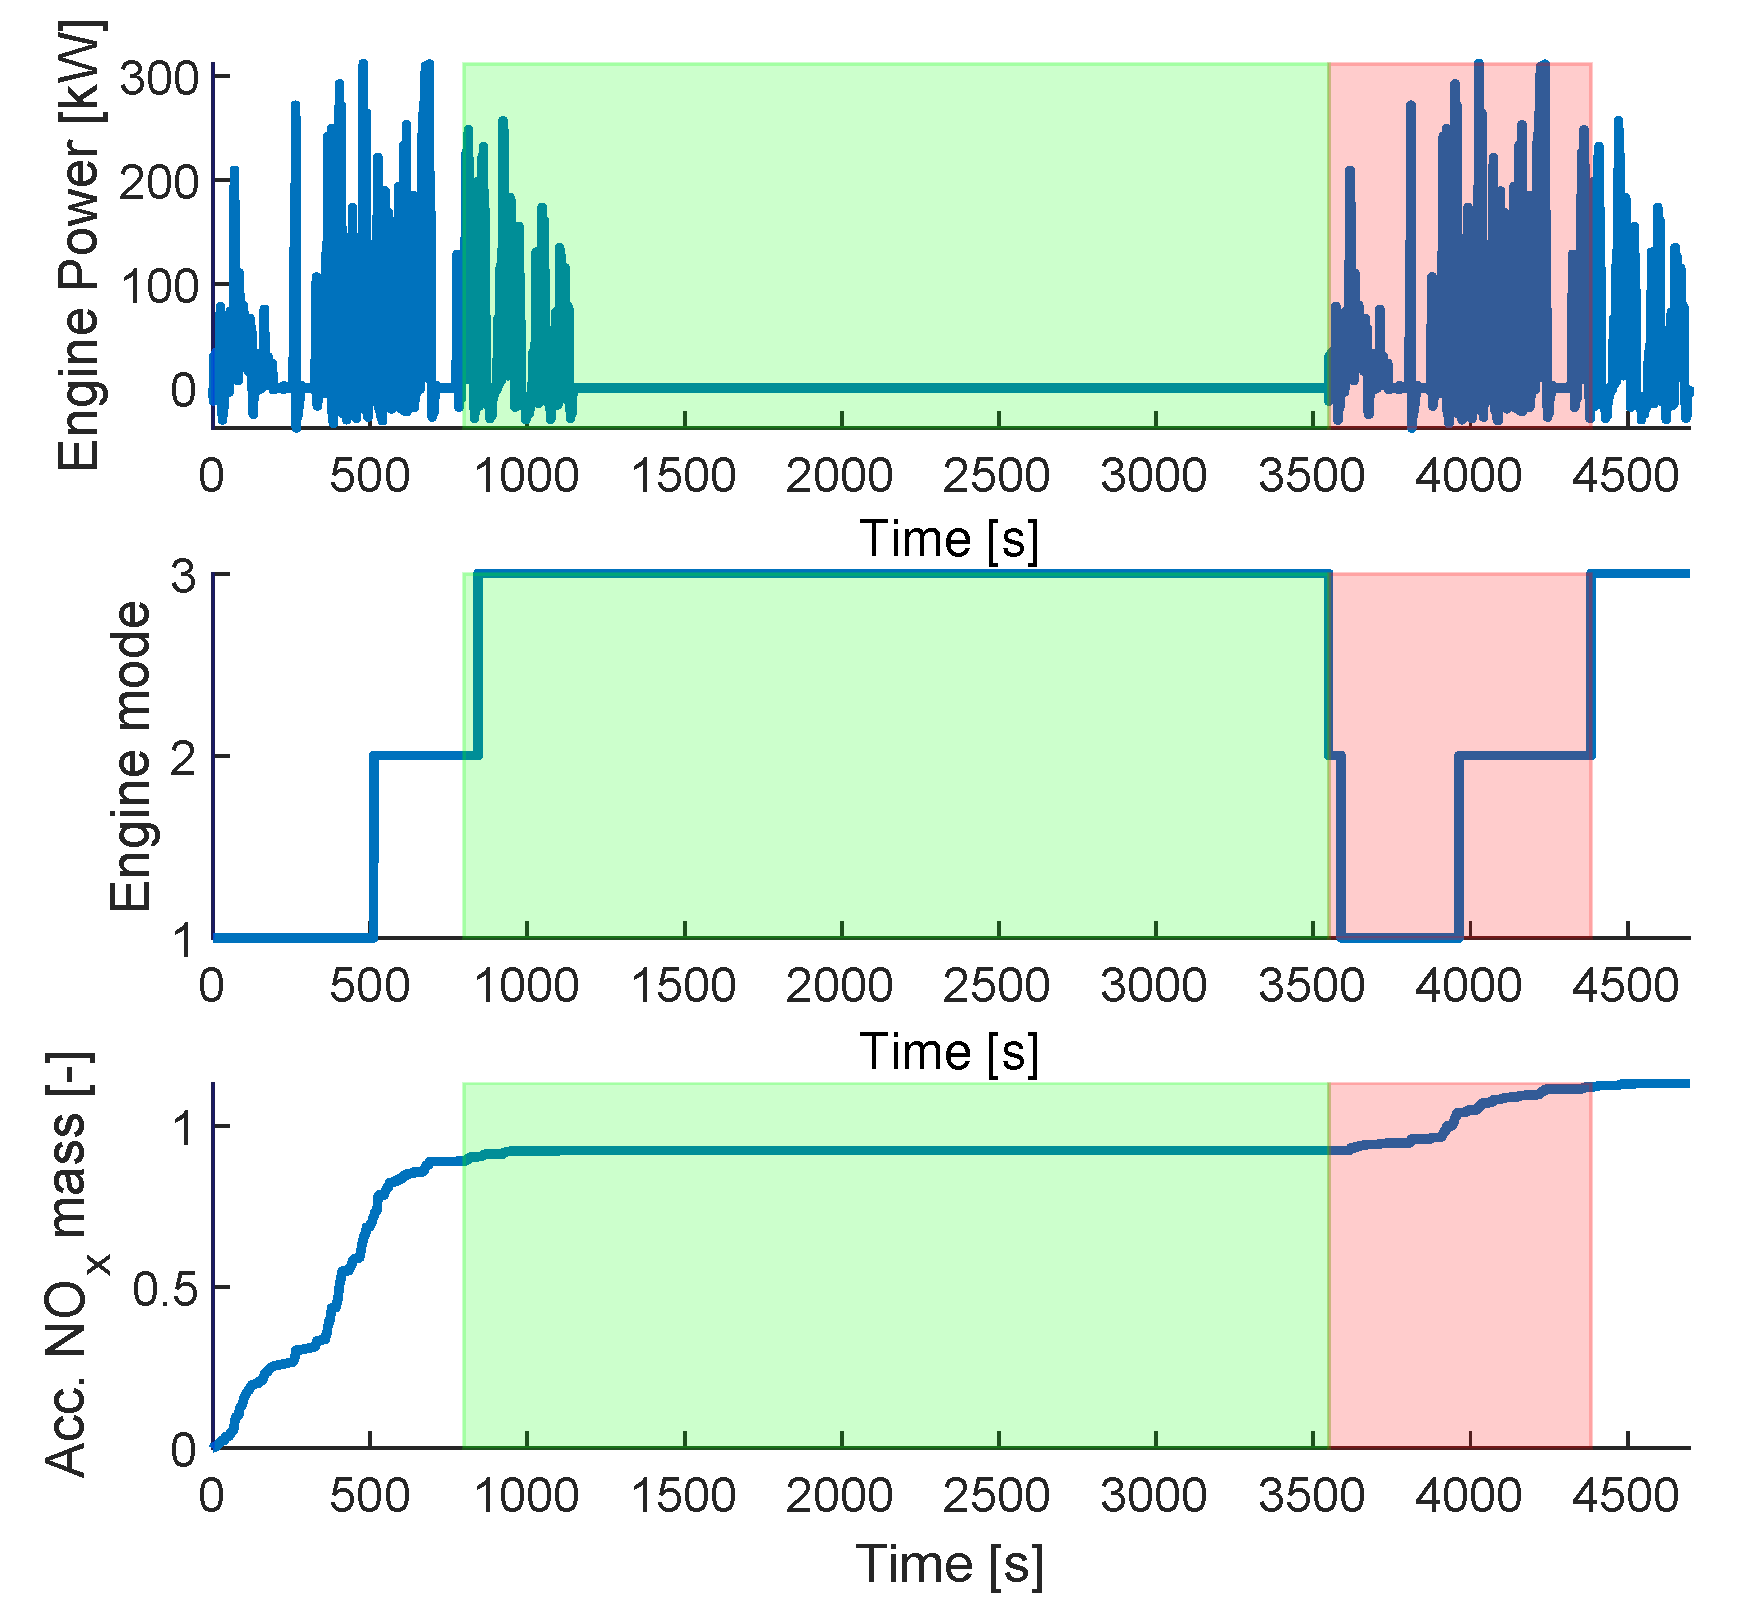
An illustration of the phases can be seen in Figure 6. This simulation starts with a cold start; therefore, the first part is not considered by the strategy when looking for a pollution phase. However, the pre-heating phase starts before the cold start ends. In a large part of the pre-heating phase, the engine is turned off, and any actual heating cannot be done, but as described above this is considered when determining the length of the phase. Here it can also be seen that the definition of the pollution phase correlates well with where the majority of the emissions are emitted (not including the cold start).

3.4. Event Optimization

The core of the strategy is to sequentially minimize the NO x in each individual event, starting with the first one, using pre-heating. While doing so, the fuel– NO x equivalence condition based on a common equivalence factor λ NO x should be respected, which also links the individual events with each other. The motivation for this is that the reduction in NO x typically is a superlinear function of the fuel used for heating (i.e., to double the reduction of NO x the amount of fuel must more than double), and since λ NO x can be interpreted as the efficiency of which the fuel is used to convert NO x it makes sense to aim for the same λ NO x in all events.
The pre-heating is done using the least efficient engine mode, starts at a time t s within the pre-heating phase, and ends when the pollution phase begins. The reason for this is that it was shown in [14] that this is most often the optimal way, and it reduces the space to be searched. The problem can now be formulated as the optimal control problem
minimize t s [ t p r e , s , t p u , s ] m NO x , e v e n t subject to λ N O x Δ m f , e v e n t Δ m NO x , e v e n t u m o d e = 3 , t < t s 1 , t s t < t p u , s from baseline strategy , t t p u , s
based on a simulation of the model over the specific event. For each event, the initial condition is taken from a simulation of the drive cycle up to the start of the current event, with the optimized pre-heating of all previous events included in the simulation.
The amount of extra fuel used for pre-heating, Δ m f , p r e , (note that this is not the same as the total amount of fuel used in the whole event, Δ m f , e v e n t ) is a monotonically decreasing function of t s , but not strictly monotonically. This means that a one-to-one relationship between Δ m f , p r e and t s does not exist. However, in time windows where Δ m f , p r e ( t s ) is flat, for example, where the engine is turned off, the effect of starting the pre-heating would be the same for all times within the window. This means that Δ m f , p r e can be used as an optimization parameter instead of t s , and it will give a better correlation with the NO x by removing parts of the search space that do not affect the NO x .
To solve the problem, the cost function
J ( Δ m f , p r e ) = m NO x , e v e n t , λ N O x Δ m f , e v e n t Δ m NO x , e v e n t , λ N O x Δ m f , e v e n t > Δ m NO x , e v e n t
is defined. J ( t s ) is far from being convex, even without the equivalence factor, and, therefore, a grid search is done as a first step in the optimization. The grid search is done over
{ 0 , Δ m f , r e s , 2 Δ m f , r e s , , Δ m f , m a x }
where Δ m f , r e s is the resolution of the grid search. After the grid search, a golden-section search is done around the point with the lowest value of J.

4. Results

In this section, the proposed strategy is evaluated on a drive cycle containing a single engine-off event, followed by a drayage drive cycle with multiple engine-off events. Simulations with different λ NO x are used to evaluate the strategy. A special case is λ NO x = , which results in the baseline (BL) strategy since no extra fuel is allowed for pre-heating and, therefore, serves as a reference for comparison. Simulations using only the mode with the highest efficiency (HE) are also used for comparison. In all simulations, an ambient temperature of 20 C is used.

4.1. Single Event

Since the proposed strategy handles all engine-off events of a drive cycle individually, the overall performance of the strategy can be seen as the sum of the performance of each engine-off event. This means that the performance of a single event is important and is, therefore, evaluated here. To do this, drive cycles based on two copies of the first 17 min of the WHTC, separated by an engine-off event of varying length, are used. These cycles are used because this part of the WHTC represents the low-power operation of the engine which results in challenging, low-temperature, operation of the aftertreatment system. This is where pre-heating is expected to be most effective, and also the most likely scenario where it will be used since green zones are most likely located inside urban or industrial areas.

4.1.1. Example Simulations

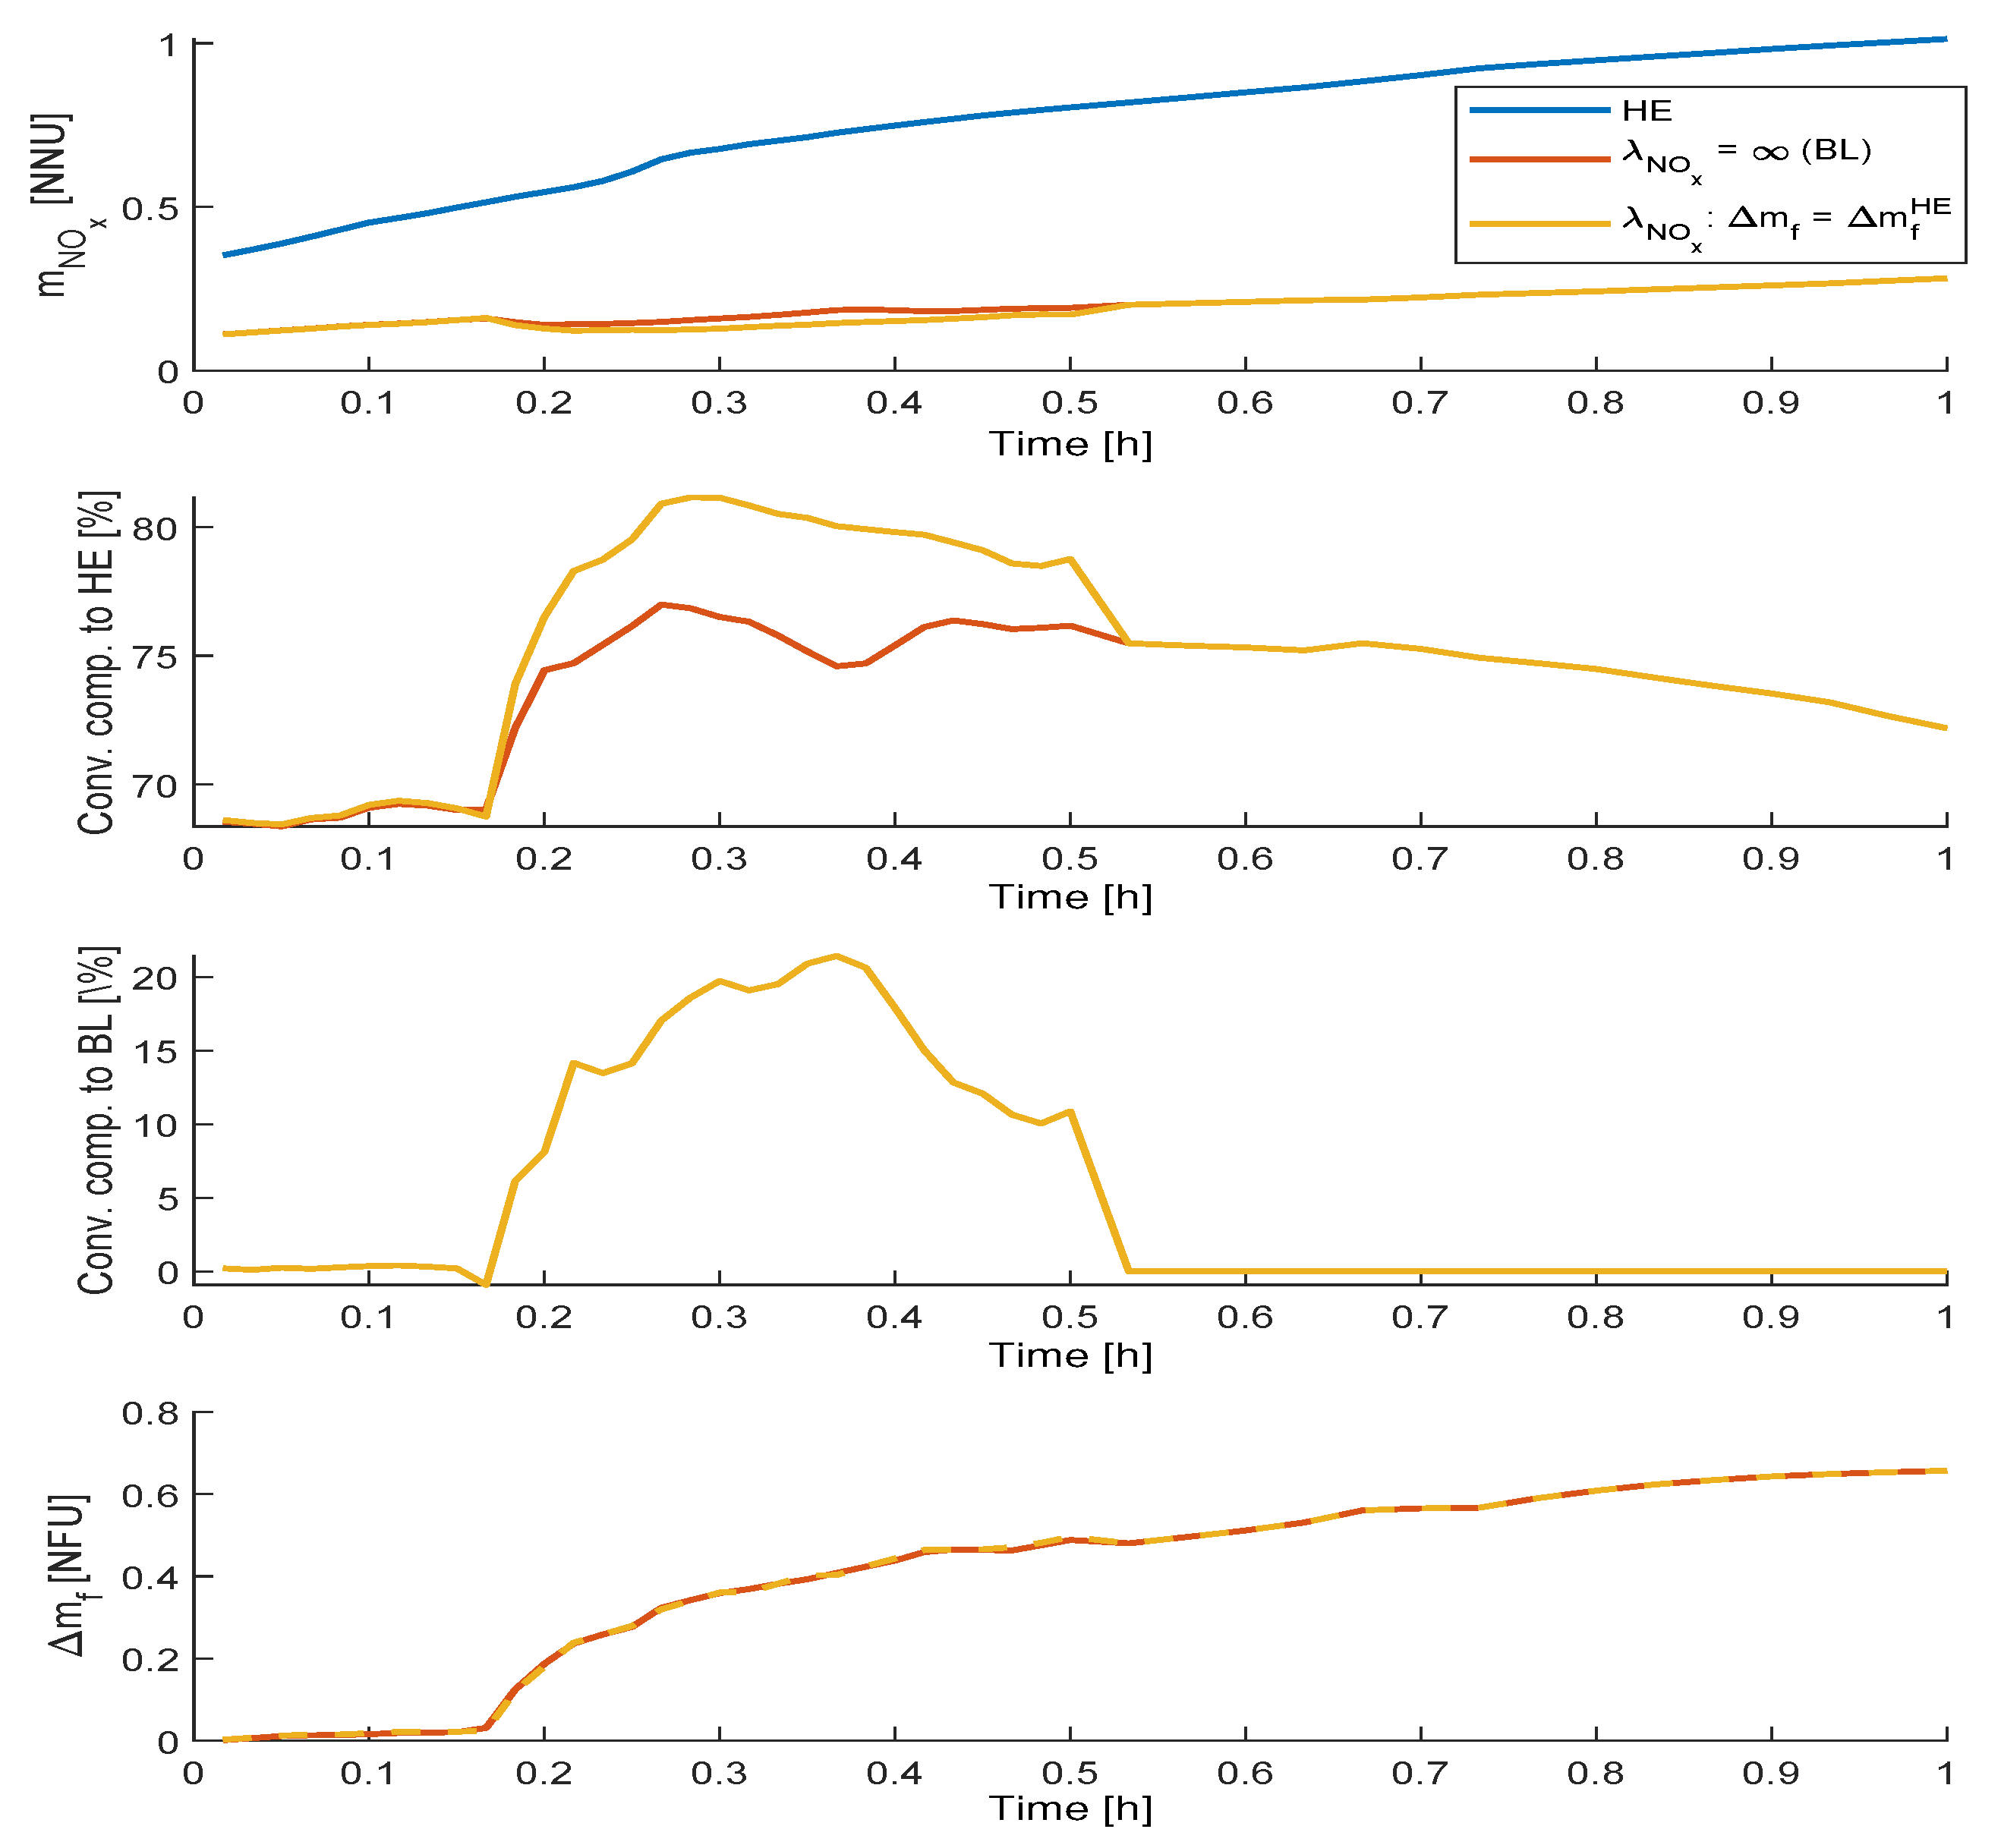
In Figure 7, simulations using different λ NO x are shown. As can be seen, using λ NO x = 0.85 results in lower NO x using the same amount of fuel compared to the baseline strategy ( λ NO x = ). Using λ NO x = 0.47 the NO x is further reduced, but the amount of extra fuel increases. The figure also shows that even though a significant improvement in NO x compared to the baseline strategy can be achieved, when compared to using no emission management (using only the high-efficiency mode) the difference between the proposed strategy and the baseline is less significant. To further investigate the trade-off between fuel and NO x , Figure 8 and Figure 9 are used. In these figures the same cycle, but with varying lengths of the engine-off event, is used. The proposed strategy is compared with the baseline strategy and the case of no emission management.

4.1.2. Comparison with Baseline Strategy

In Figure 8, λ NO x has been chosen such that the fuel consumption is the same as for the baseline strategy. Here it can be seen that the reduction in NO x , compared to no emission management, is increased from around 75% to around 80% for engine-off events of lengths around 10 to 30 min. As can also be seen, this corresponds to an improvement of around 20% compared to the baseline strategy. The start of this time window, an off-time of around 10 min, correlates well with where ammonia dosing is no longer allowed when the engine is restarted, and a significant amount of fuel must be used to quickly heat up the aftertreatment system. By instead using this fuel for pre-heating the amount of time the engine can be turned off before dosing is not allowed when it is restarted can be extended, resulting in a reduction of NO x . The end of the time window, an off-time of around 30 min, corresponds to when pre-heating can no longer extend the time the engine can be turned off before dosing is not allowed when it is restarted, using the given amount of fuel.
Figure 9 is based on the same simulations as Figure 8, but here λ NO x has been chosen such that the fuel consumption is double that of the baseline strategy. In this case, an increase in reduction of around 30% compared to the baseline strategy is achieved for off times up to around 1.5 h. As before, a major factor in the improvement is that pre-heating reduces the time until ammonia dosing is allowed after the engine is restarted. After 1.5 h, the improvements go down exponentially with a similar time constant as the cool-down dynamics of the aftertreatment system.

4.2. Optimality of the Distribution of Fuel between Events

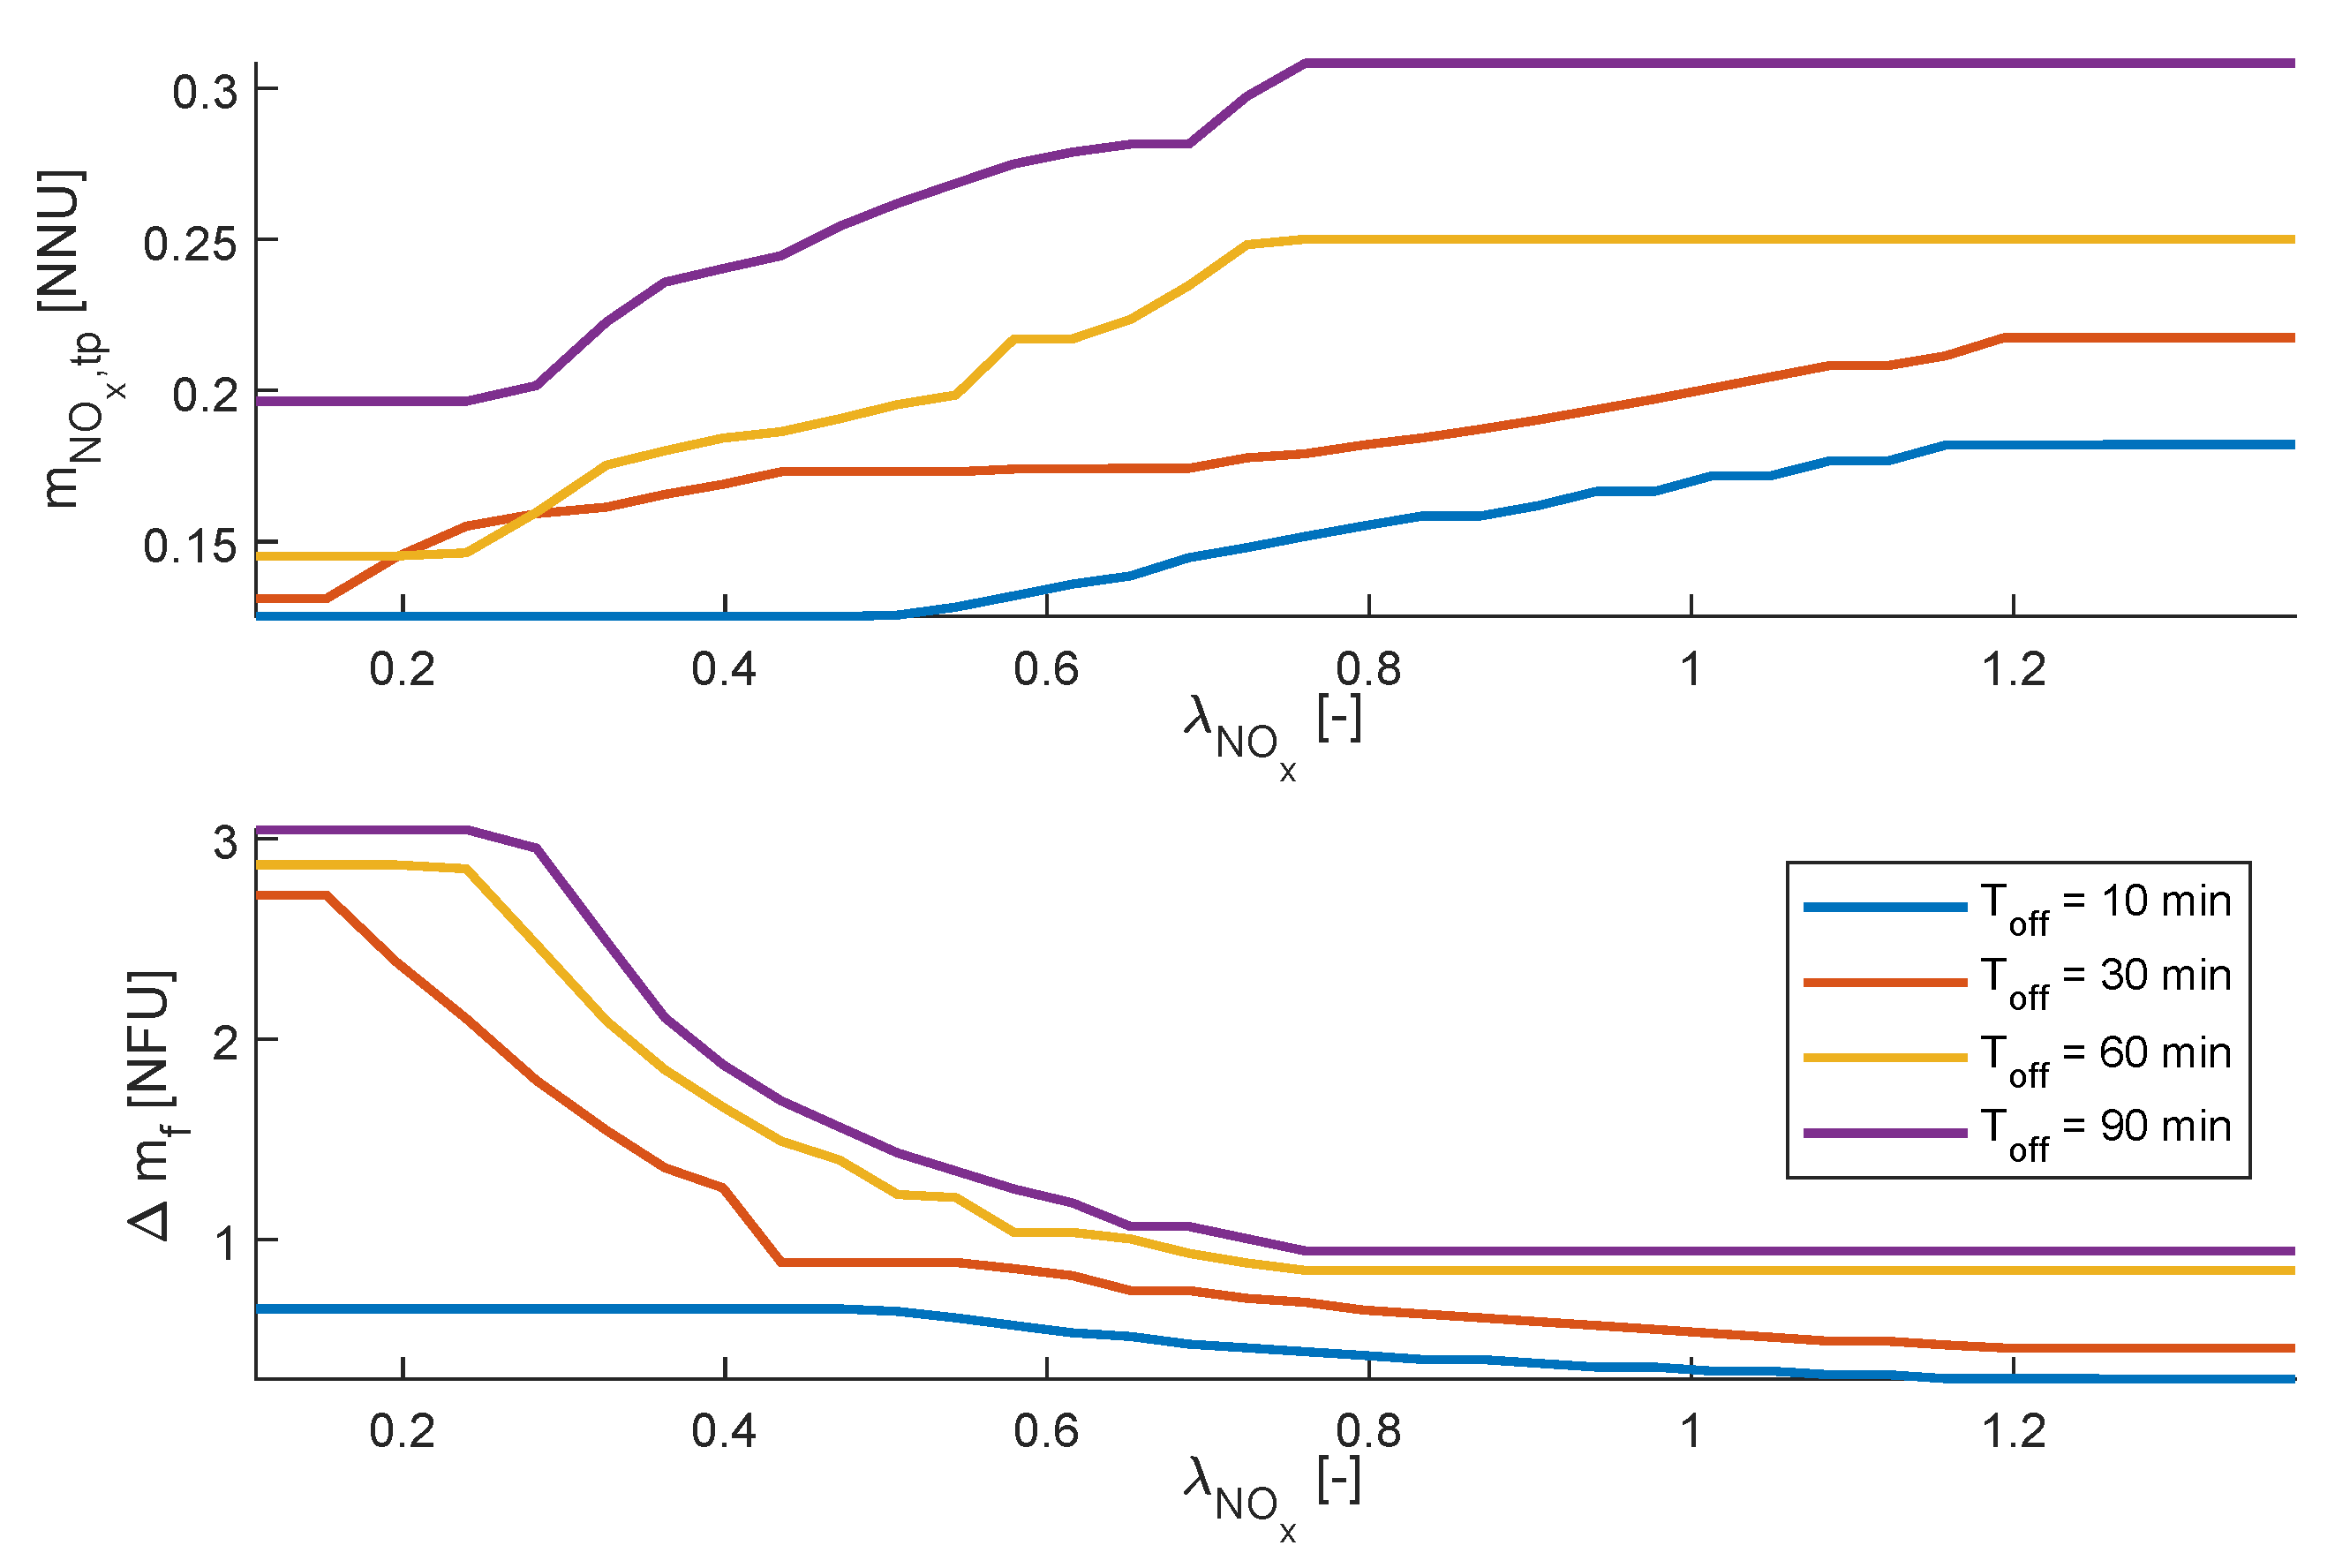
To investigate how close to optimal the strategy distributes fuel between events, simulations of the singe-event drive cycle for different λ NO x and engine-off times are used. The data from the simulations are shown in Figure 10, and as can be seen, the trends are similar for all off times.
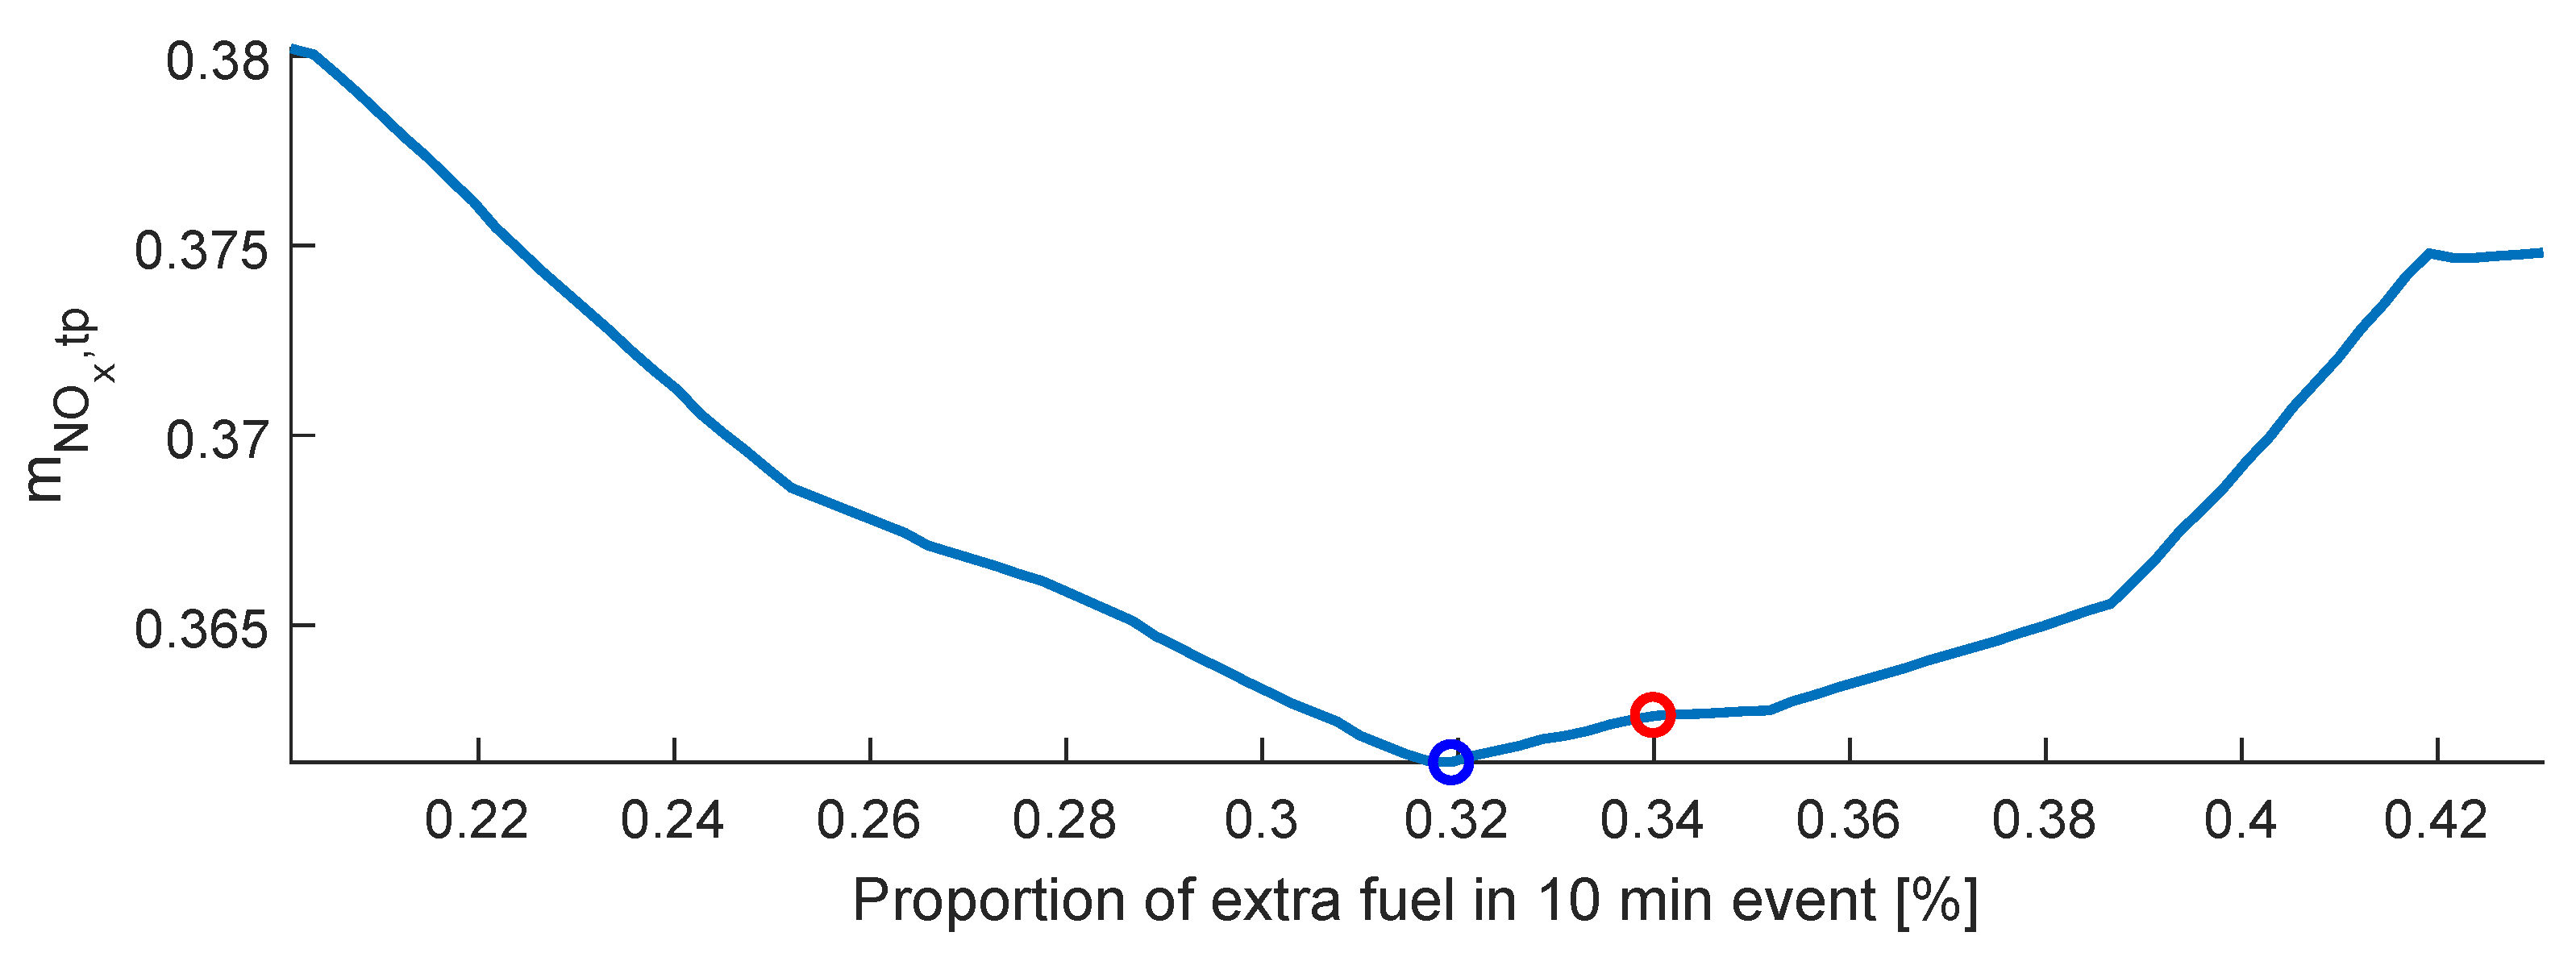
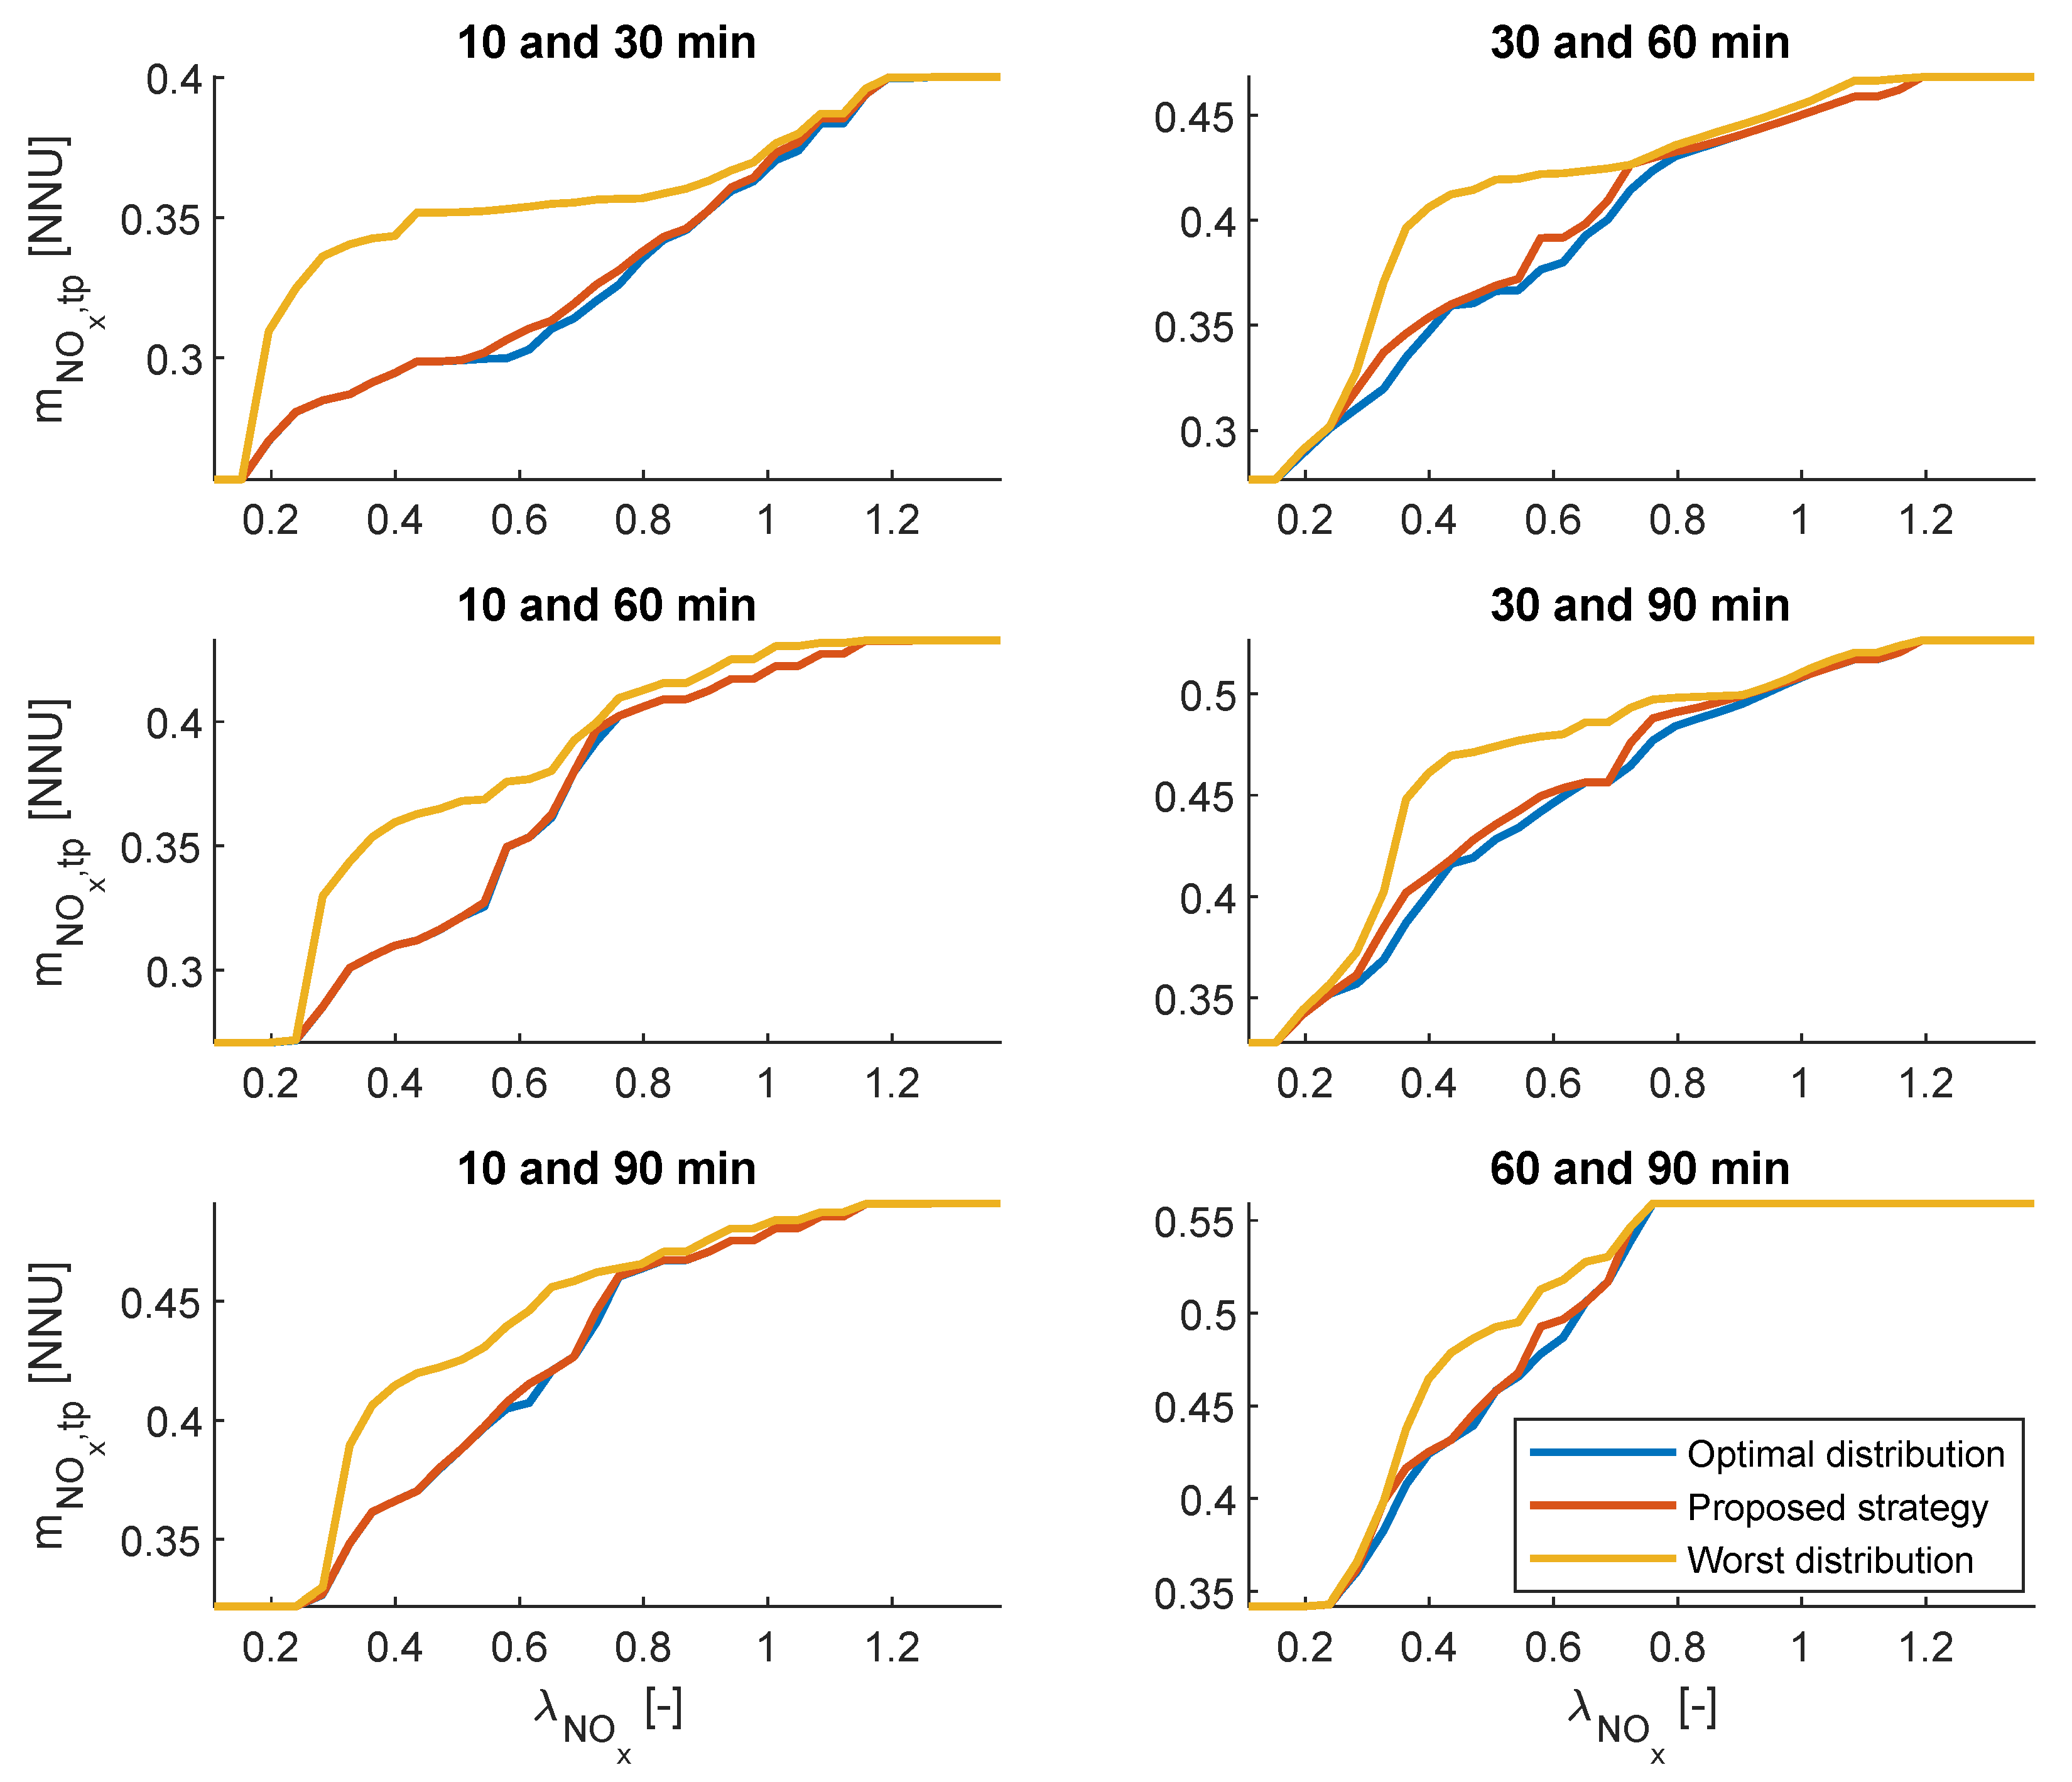
By adding the results from two of the simulations with different engine-off times, but with the same λ NO x , the result of applying the strategy on a cycle including both of the engine-off events can be predicted. By redistributing how much fuel is used in each event, but keeping their sum constant, the optimal distribution of fuel can be found and compared to that of the proposed strategy, see Figure 11 for an example. In Figure 12 the results from doing this for all λ NO x and combinations of off-times is shown. As can be seen, the strategy results in a distribution that is quite close to the optimal one.

4.3. Drayage Cycle

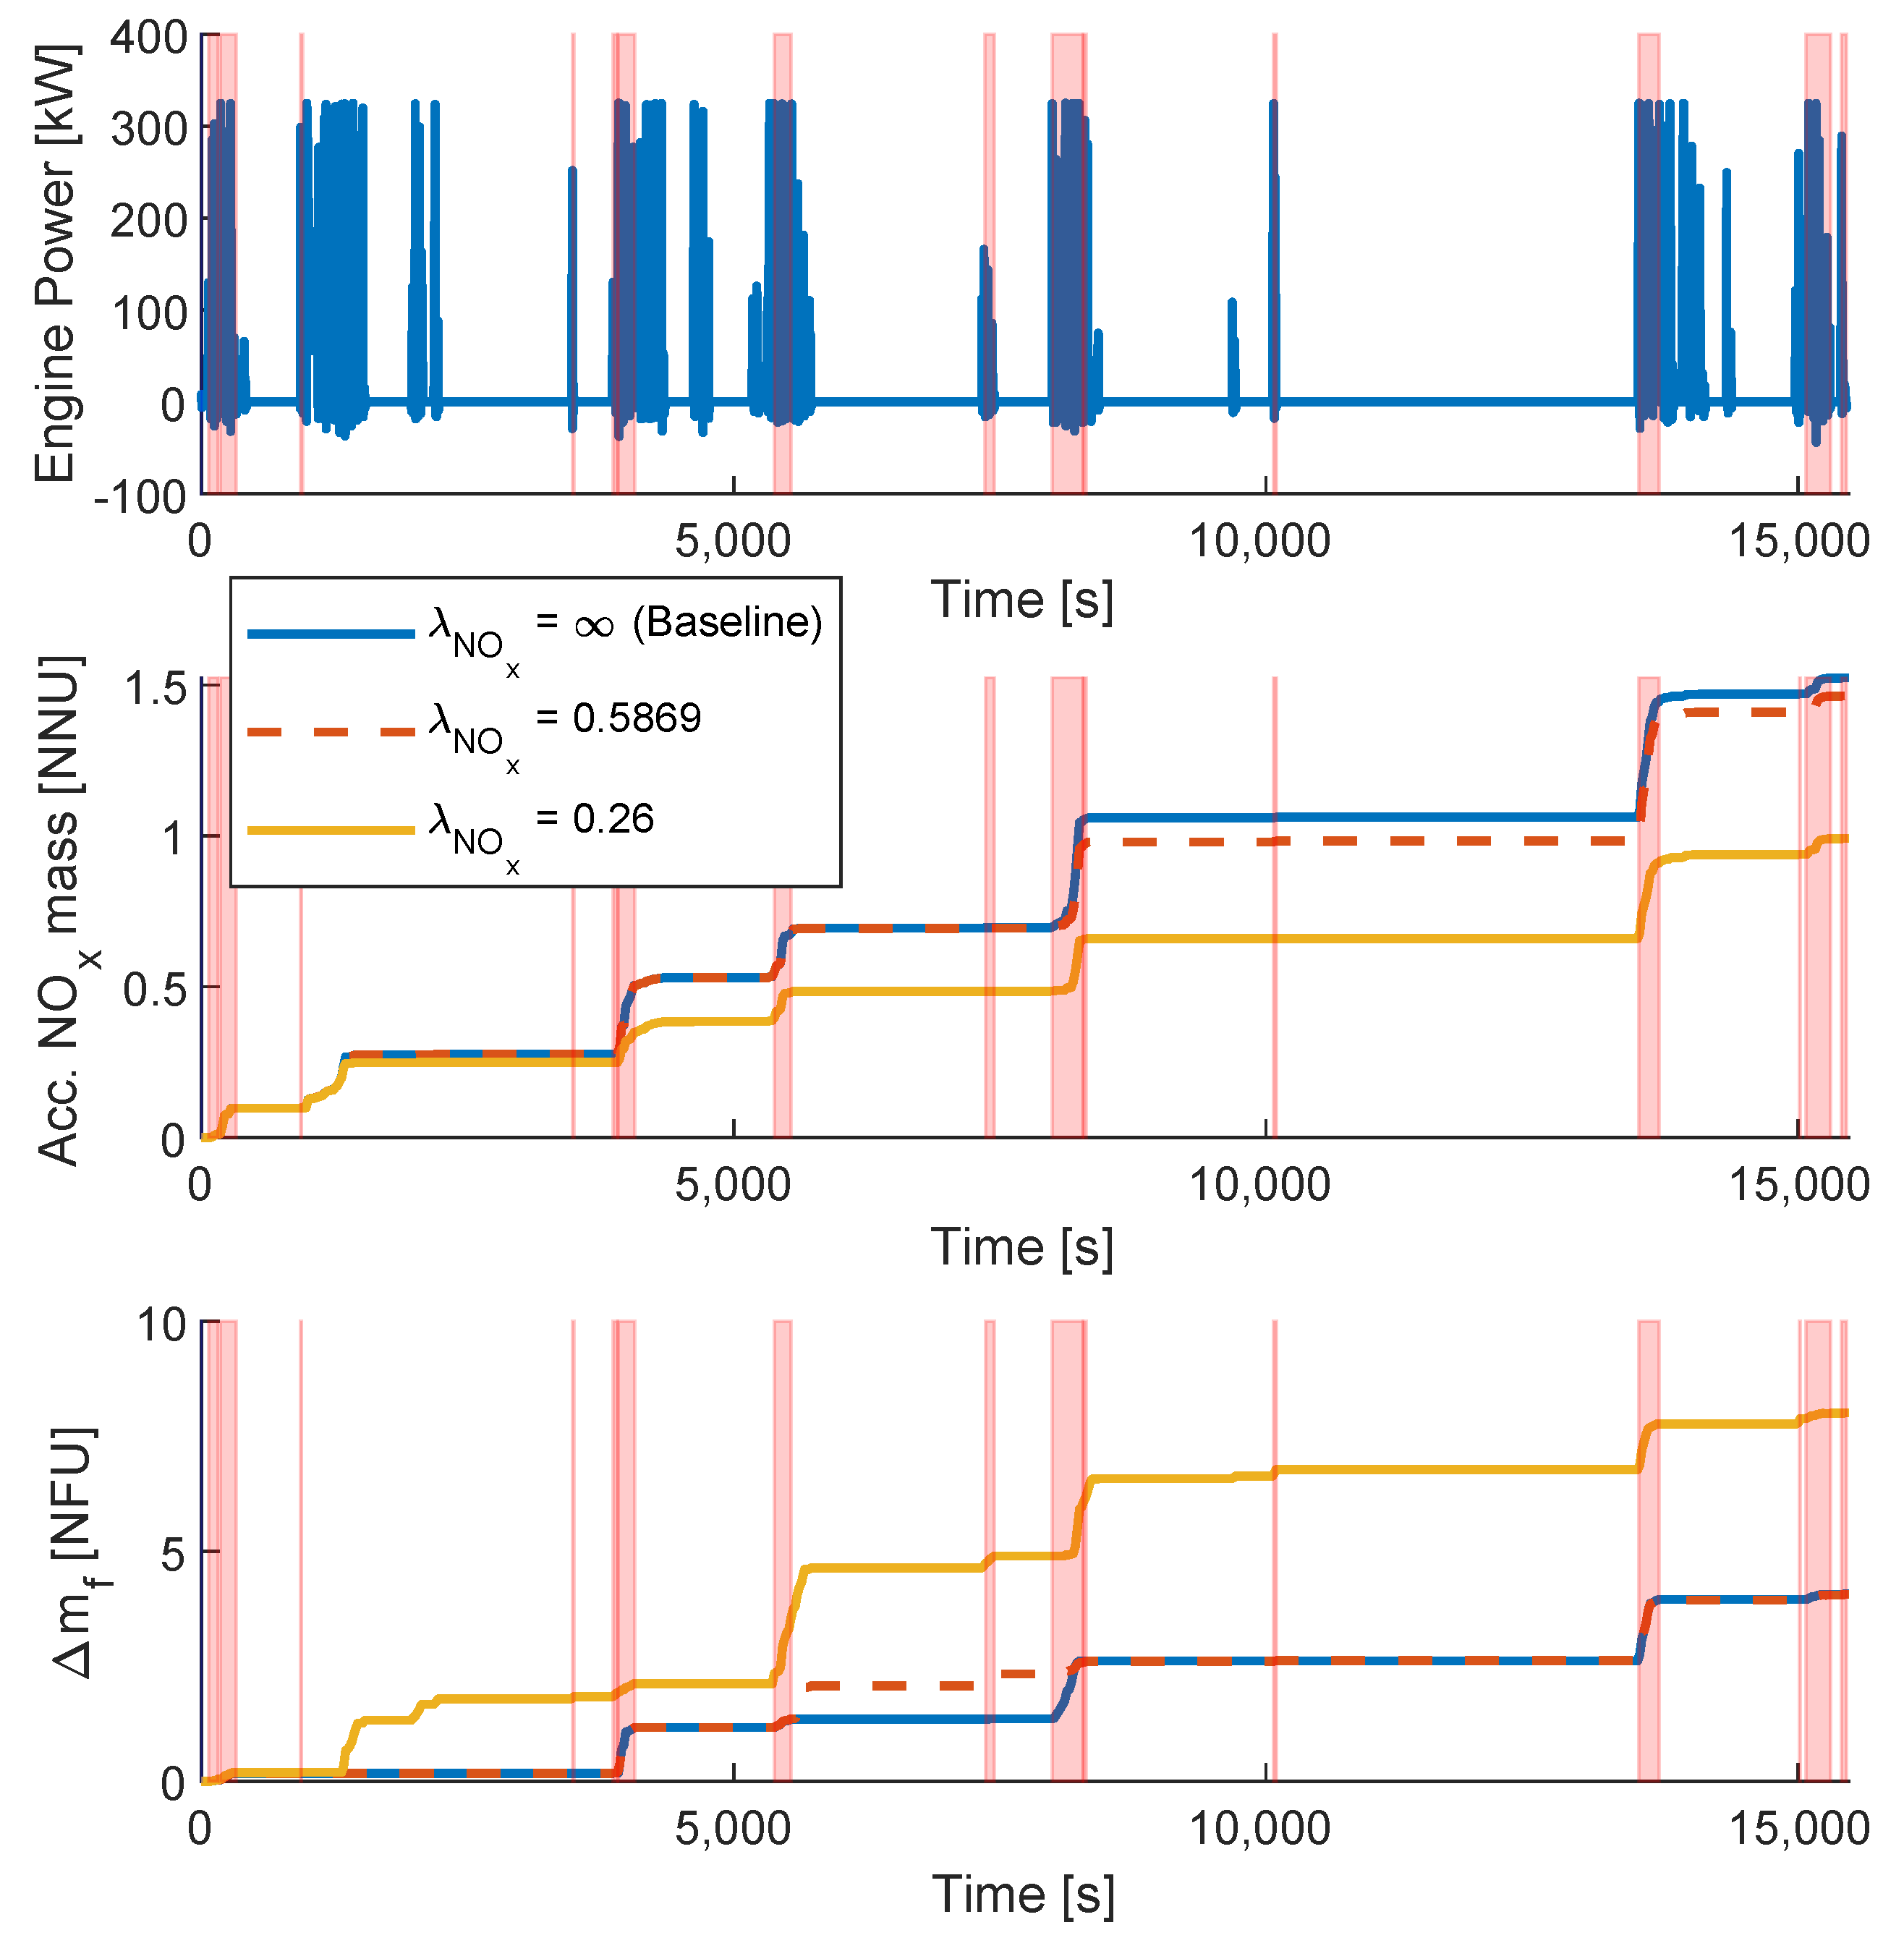
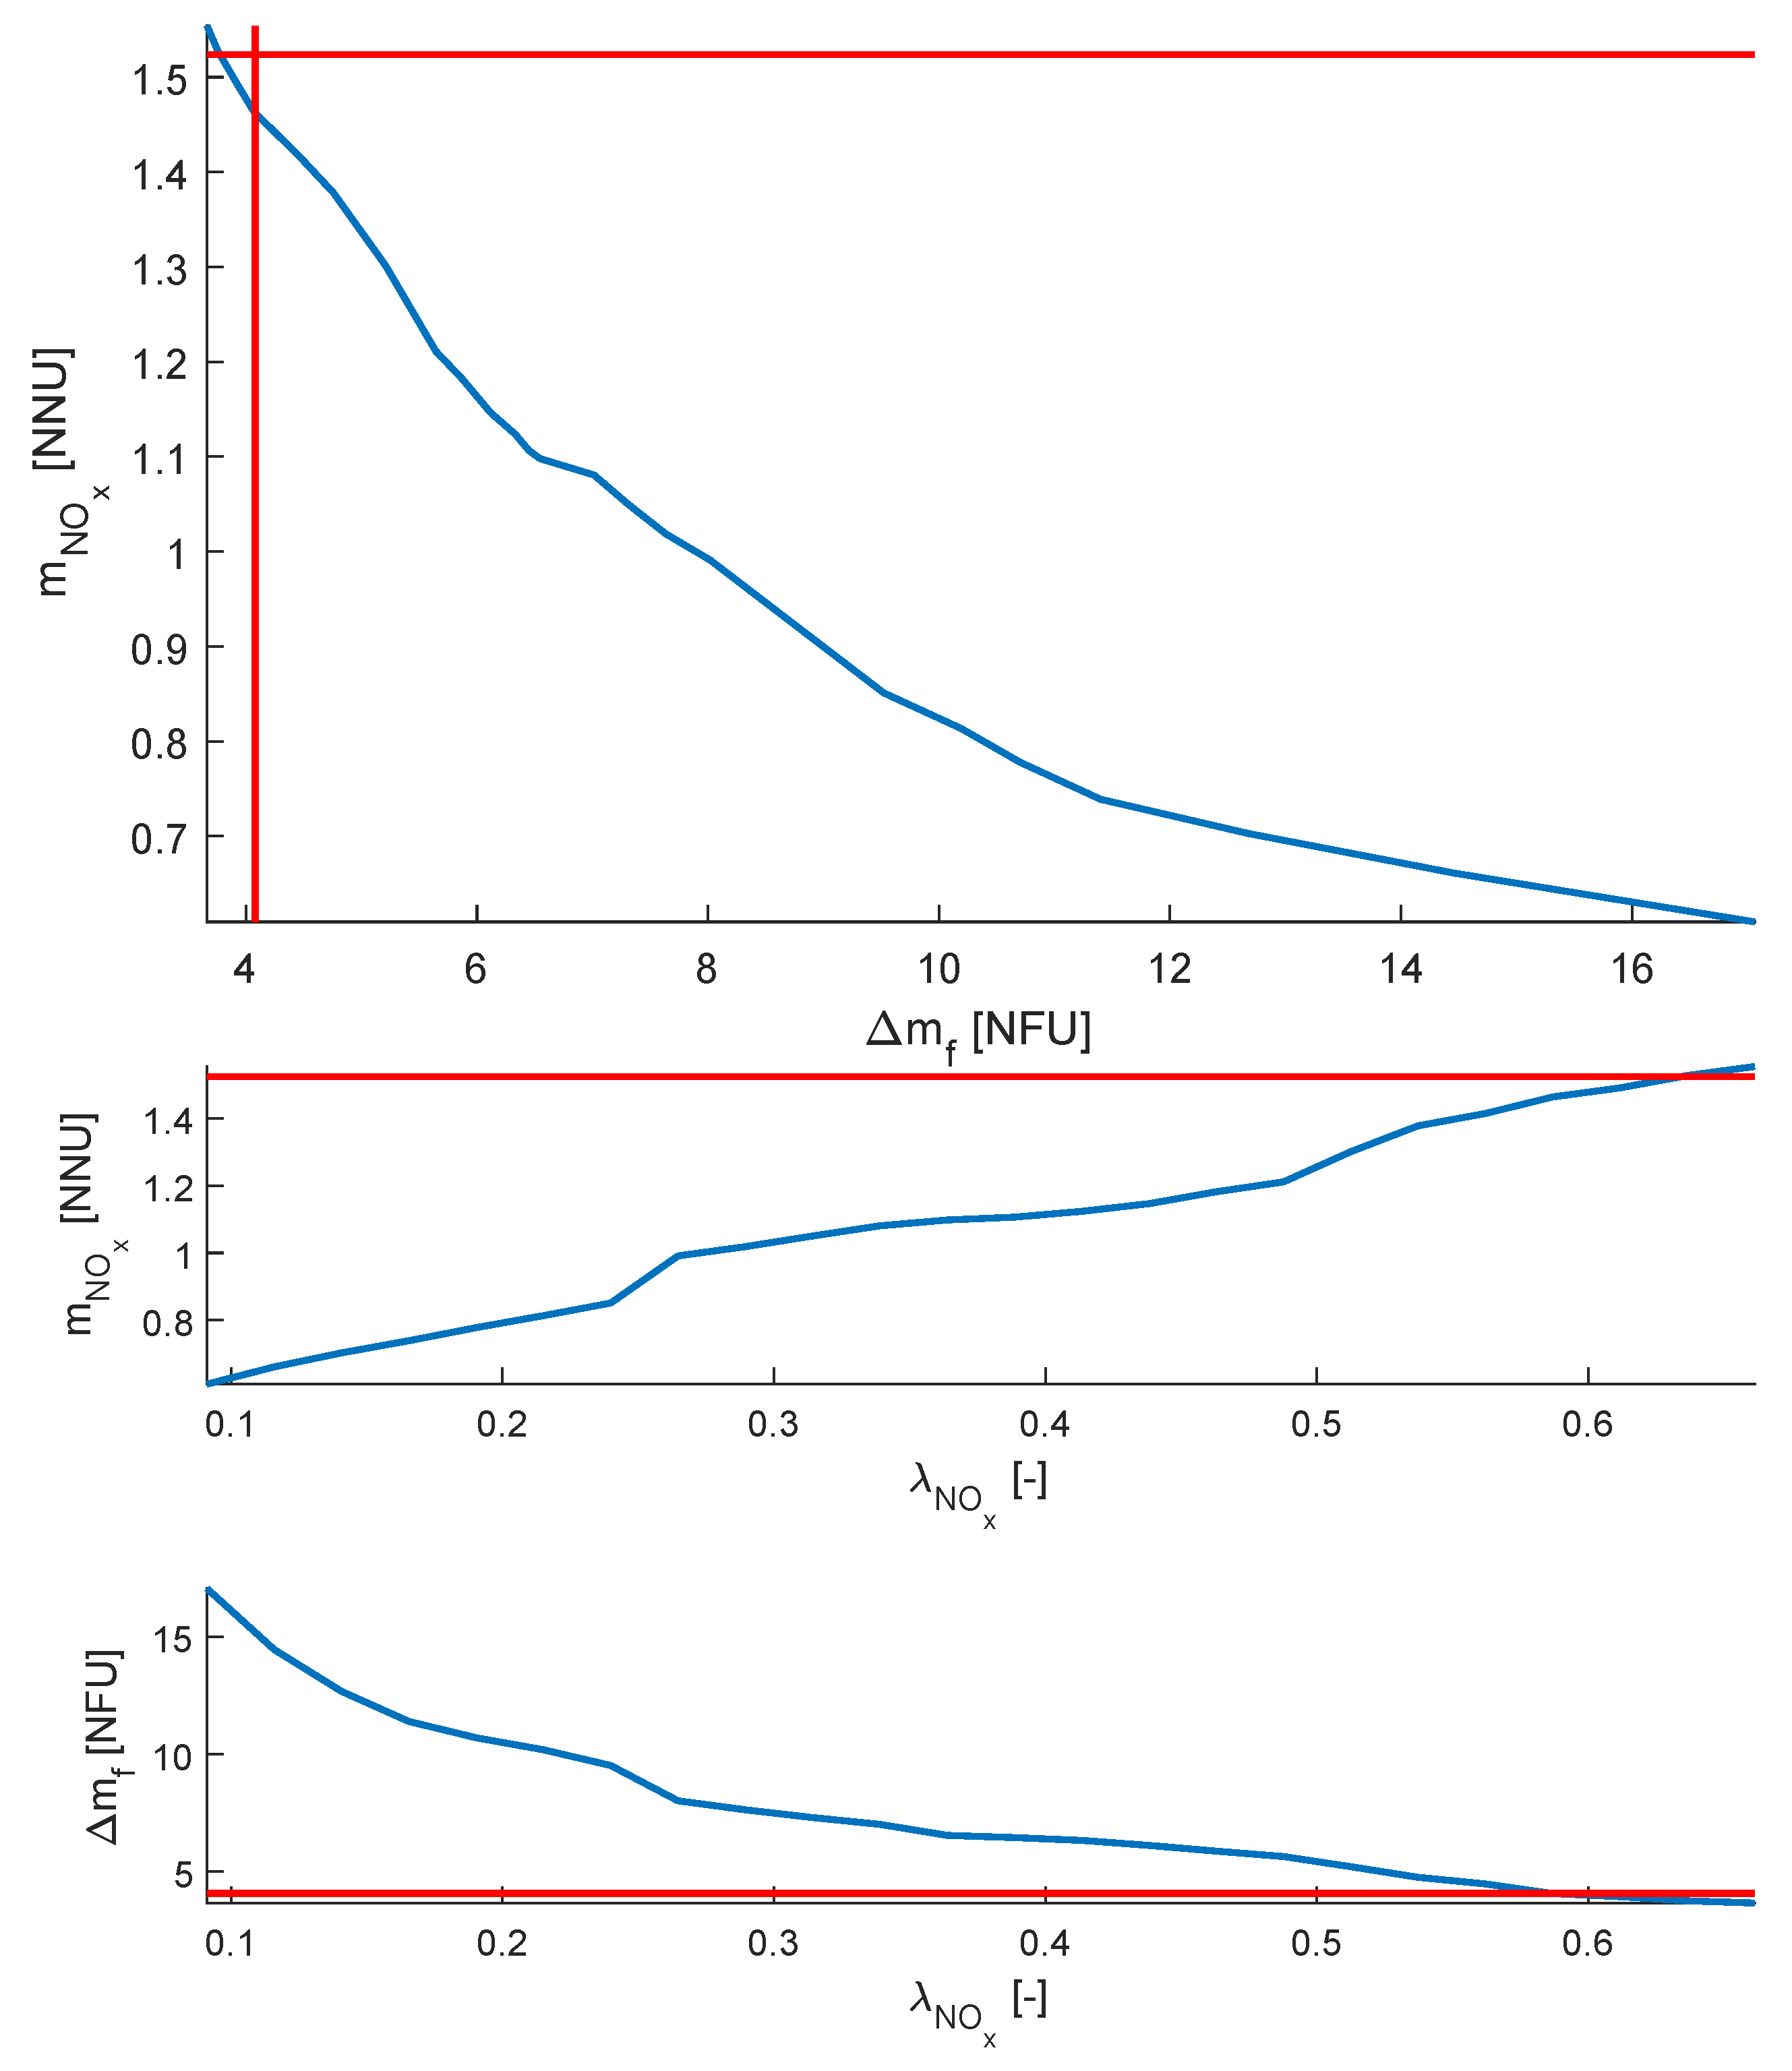
To evaluate the performance in a scenario based on a real-world example, a drayage drive cycle from [19] is used. The drive cycle contains multiple engine-off events and can be seen in Figure 13 along with some simulations using different λ NO x . The λ NO x are chosen in the same way as before, one using the same amount of extra fuel as the baseline strategy, and the other using double that amount. As can be seen, the strategy works as intended by localizing the pollution phases, which also correlates well with where NO x is emitted and distributes fuel to reduce NO x . The trend is the same as that of the singe-event case, showing a reduction in NO x using the same amount of fuel and a significantly larger reduction by doubling the amount of extra fuel. In Figure 14, the trade-off between fuel and NO x , and how λ NO x affects the result are shown. Here it can be seen that the strategy can reduce the amount of NO x efficiently for fuel budgets up to around three times as large as that of the baseline strategy, but after that further improvements become expensive. The figure also shows that the reduction in NO x is fairly linear in λ NO x , which simplifies the process of choosing a λ NO x to achieve a specific reduction in NO x . In Table 1 the results are summarized.

4.4. Calculation Time

The calculation time of the proposed strategy is the sum of the calculation time for each engine-off event and, therefore, depends on the number of events. The calculation time of each event also varies depending on the size of the event, which mainly depends on λ NO x . Because of this, it is difficult to say anything general about the calculation time. However, in the simulations presented above the calculation time for a single event varied between 10 s and 3 min on a standard modern laptop.

5. Conclusions

An emission management strategy for prolonged engine-off events based on pre-heating before the events is proposed and evaluated. The strategy finds and handles each engine off event separately, but links them using a common equivalence factor describing the desired relation between fuel and NO x . The equivalence factor can either be chosen heuristically or can be seen as a free variable that should be chosen to give the desired result. In each event the NO x is minimized using an optimization scheme where pre-heating is combined with a causal heuristic strategy.
The performance is evaluated using simulations where the proposed strategy is applied to two drive cycles. The first drive cycle is a cycle with a single engine-off event of varying lengths. The results from applying the strategy in this cycle are summarized as:
  • For engine-off periods of 10–30 min a reduction in NO x of 10–20% compared to the baseline strategy, using the same amount of fuel, is observed.
  • When twice as much fuel is allowed compared to the baseline strategy, a reduction of around 30% is achieved for off-times up to 1.5 h. After 1.5 h the efficiency of the pre-heating goes down exponentially and after 4 h it is around 5%.
The second cycle is a drayage cycle with multiple engine-off events, and the conclusions from this cycle are:
  • The proposed strategy can handle scenarios with multiple engine-off and significantly reduce the NO x .
  • Using the same amount of fuel as the baseline strategy, the NO x is reduced by 4%
  • The same amount of NO x as the baseline is achieved using 8% less extra fuel, corresponding to a reduction in total fuel consumption of 0.1%.
  • The reduction in NO x is shown to be fairly linear in the equivalence factor, which gives the strategy a predictable behavior.

Author Contributions

Investigation, O.H. and L.E.; Methodology, O.H. and L.E.; Supervision, L.E.; Writing—original draft, O.H.; Writing—review & editing, L.E. All authors have read and agreed to the published version of the manuscript.

Funding

This work is funded by the Swedish Electromobility Center.

Data Availability Statement

Not applicable.

Conflicts of Interest

The authors declare no conflict of interest. The funders had no role in the design of the study; in the collection, analyses, or interpretation of data; in the writing of the manuscript, or in the decision to publish the results.

Appendix A

Table A1. Modeled reactions in the aftertreatment system.
DOC [20,21,22]
Oxidation and redox of NO/NO2 6 NO + 3 O 2 6 NO 2
DPF [21,23,24]
Oxidation and redox of NO/NO2 6 NO + 3 O 2 6 NO 2
SCR [20,21,22,25,26]
Ammonia adsorption and desorption NH 3 NH 3 *
Standard SCR 4 NH 3 * + 4 NO + O 2 4 N 2 + 6 H 2 O
Fast SCR 2 N H 3 * + N O + N O 2 N 2 + 3 H 2 O
Slow SCR 8 N H 3 * + 6 N O 2 7 N 2 + 12 H 2 O
Ammonia oxidation 4 N H 3 + 3 O 2 2 N 2 + 6 H 2 O
HNCO hydrolysis HNCO + H 2 O N H 3 + C O 2
ASC [21,27,28]
N H 3 adsorption and desorption N H 3 N H 3 *
N O adsorption and desorption N O N O *
O 2 adsorption and desorption O 2 O 2 *
N O formation 4 N H 3 * + 5 O 2 4 N O * + 6 H 2 O
Standard SCR 4 N H 3 * + 4 N O * + O 2 4 N 2 + 6 H 2 O
N 2 O formation 4 N H 3 * + 4 N O · + 3 O 2 4 N 2 O + 6 H 2 O
Direct SCO/ N H 3 activation 4 N H 3 * + 3 O 2 2 N 2 + 6 H 2 O

References

  1. Sciarretta, A.; Guzzella, L. Control of hybrid electric vehicles. IEEE Control. Syst. Mag. 2007, 27, 60–70. [Google Scholar]
  2. Brahma, A.; Guezennec, Y.; Rizzoni, G. Optimal energy management in series hybrid electric vehicles. In Proceedings of the 2000 American Control Conference, Chicago, IL, USA, 28–30 June 2000; IEEE: Piscataway, NJ, USA, 2000; Volume 1. [Google Scholar]
  3. Paganelli, G.; Guerra, T.; Delprat, S.; Santin, J.; Delhom, M.; Combes, E. Simulation and assessment of power control strategies for a parallel hybrid car. Proc. Inst. Mech. Eng. Part D J. Automob. Eng. 2000, 214, 705–717. [Google Scholar]
  4. Huang, Y.; Wang, H.; Khajepour, A.; He, H.; Ji, J. Model predictive control power management strategies for HEVs: A review. J. Power Sources 2017, 341, 91–106. [Google Scholar] [CrossRef]
  5. Feng, R.; Chen, K.; Sun, Z.; Hu, X.; Li, G.; Wang, S.; Deng, B.; Sun, W. A comparative study on the energy flow of a hybrid heavy truck between AMT and MT shift mode under local driving test cycle. Energy Convers. Manag. 2022, 256, 115359. [Google Scholar] [CrossRef]
  6. Ritzmann, J.; Lins, G.; Onder, C. Optimization Method for the Energy and Emissions Management of a Hybrid Electric Vehicle with an Exhaust Aftertreatment System. IFAC-PapersOnLine 2020, 53, 13797–13804. [Google Scholar] [CrossRef]
  7. Kessels, J.; Willems, F.; Schoot, W.; Van Den Bosch, P. Integrated energy & emission management for hybrid electric truck with SCR aftertreatment. In Proceedings of the 2010 IEEE Vehicle Power and Propulsion Conference, Lille, France, 1–3 September 2010; IEEE: Piscataway, NJ, USA, 2010; pp. 1–6. [Google Scholar]
  8. Kuchly, J.; Nelson-Gruel, D.; Charlet, A.; Chamaillard, Y.; Nouillant, C. Projected Gradient and Model Predictive Control: Optimal Energy and Pollutants Management for Hybrid Electric Vehicle. IFAC-PapersOnLine 2019, 52, 121–127. [Google Scholar] [CrossRef]
  9. Zhao, J.; Wang, J. Model predictive control of integrated hybrid electric powertrains coupled with aftertreatment systems. In Proceedings of the Dynamic Systems and Control Conference, San Antonio, TX, USA, 22–24 October 2014; American Society of Mechanical Engineers: New York, NY, USA, 2014; Volume 46193, p. V002T36A004. [Google Scholar]
  10. Biswas, D.; Ghosh, S.; Sengupta, S.; Mukhopadhyay, S. A Predictive Supervisory Controller for an HEV Operating in a Zero Emission Zone. In Proceedings of the 2019 IEEE Transportation Electrification Conference and Expo (ITEC), Novi, MI, USA, 21 June 2019; IEEE: Piscataway, NJ, USA, 2019; pp. 1–6. [Google Scholar]
  11. Soldo, J.; Skugor, B.; Deur, J. Optimal Energy Management Control of a Parallel Plug-In Hybrid Electric Vehicle in the Presence of Low Emission Zones; SAE Technical Paper 2019-01-1215; SAE: Warrendale, PA, USA, 2019. [Google Scholar]
  12. Kum, D.; Peng, H.; Bucknor, N.K. Supervisory control of parallel hybrid electric vehicles for fuel and emission reduction. J. Dyn. Syst. Meas. Control 2011, 133, 061010. [Google Scholar] [CrossRef]
  13. Willems, F.; Spronkmans, S.; Kessels, J. Integrated powertrain control to meet low CO2 emissions for a hybrid distribution truck with SCR-DeNOx system. In Proceedings of the ASME 2011 Dynamic Systems and Control Conference and Bath/ASME Symposium on Fluid Power and Motion Control, American Society of Mechanical Engineers Digital Collection, Arlington, VA, USA, 31 October–2 November 2011; pp. 907–912. [Google Scholar]
  14. Holmer, O.; Willems, F.; Blomgren, F.; Eriksson, L. Optimal aftertreatment pre-heat strategy for minimum tailpipe NOx around green zones. In Proceedings of the 2020 WCX SAE World Congress Experience, Detroit, MI, USA, 21–23 April 2020; SAE International: Warrendale, PA, USA, 2020. [Google Scholar]
  15. Holmer, O.; Eriksson, L. Modeling and Simulation of a Heavy-Duty Hybrid Electric Powertrain. 2022; Unpublished manuscript. [Google Scholar]
  16. Holmer, O.; Eriksson, L. Selective Catalytic Reduction Catalyst Modeling for Control Purposes. Energies 2022, 15, 8182. [Google Scholar] [CrossRef]
  17. Holmer, O.; Eriksson, L. A Simplified Diesel Particulate Filter Model. Technical Report. 2022; Unpublished manuscript. [Google Scholar]
  18. Holmer, O.; Blomgren, F.; Eriksson, L. Modeling of Engine Aftertreatment System Cooling for Hybrid Vehicles; SAE Technical Paper 2019-01-0989; SAE: Piscataway, NJ, USA, 2019. [Google Scholar]
  19. Amar, P.; Desai, P.; Kailas, A.; Gallo, J.B. Development of a Duty Cycle for the Design and Optimization of Advanced, Heavy-Duty Port Drayage Trucks. Transp. Res. Rec. 2017, 2609, 19–27. [Google Scholar] [CrossRef]
  20. Chatterjee, D.; Burkhardt, T.; Rappe, T.; Güthenke, A.; Weibel, M. Numerical simulation of DOC+ DPF+ SCR systems: DOC influence on SCR performance. SAE Int. J. Fuels Lubr. 2008, 1, 440–451. [Google Scholar] [CrossRef]
  21. Cloudt, R.; Saenen, J.; van den Eijnden, E.; Rojer, C. Virtual Exhaust Line for Model-Based Diesel Aftertreatment Development; SAE Technical Paper 2010-01-0888; SAE: Piscataway, NJ, USA, 2010. [Google Scholar]
  22. Koebel, M.; Elsener, M.; Kleemann, M. Urea-SCR: A promising technique to reduce NOx emissions from automotive diesel engines. Catal. Today 2000, 59, 335–345. [Google Scholar] [CrossRef]
  23. Konstandopoulos, A.G.; Kostoglou, M.; Skaperdas, E.; Papaioannou, E.; Zarvalis, D.; Kladopoulou, E. Fundamental Studies of Diesel Particulate Filters: Transient Loading, Regeneration and Aging; SAE Technical Paper 2000-01-1016; SAE: Piscataway, NJ, USA, 2000. [Google Scholar]
  24. Kandylas, I.P.; Haralampous, O.A.; Koltsakis, G.C. Diesel soot oxidation with NO2: Engine experiments and simulations. Ind. Eng. Chem. Res. 2002, 41, 5372–5384. [Google Scholar] [CrossRef]
  25. van den Eijnden, E.; Cloudt, R.; Willems, F.; van der Heijden, P. Automated Model Fit Tool for SCR Control and OBD Development; SAE: Piscataway, NJ, USA, 2009. [Google Scholar]
  26. Winkler, C.; Flörchinger, P.; Patil, M.; Gieshoff, J.; Spurk, P.; Pfeifer, M. Modeling of SCR-DeNOx Catalyst-Looking at the Impact of Substrate Attributes; SAE Technical Paper 2003-01-0845; SAE: Piscataway, NJ, USA, 2003. [Google Scholar]
  27. Scheuer, A.; Votsmeier, M.; Schuler, A.; Gieshoff, J.; Drochner, A.; Vogel, H. NH3-slip catalysts: Experiments versus mechanistic modelling. Top. Catal. 2009, 52, 1847. [Google Scholar] [CrossRef]
  28. Kraehnert, R.; Baerns, M. Kinetics of ammonia oxidation over Pt foil studied in a micro-structured quartz-reactor. Chem. Eng. J. 2008, 137, 361–375. [Google Scholar] [CrossRef] [Green Version]
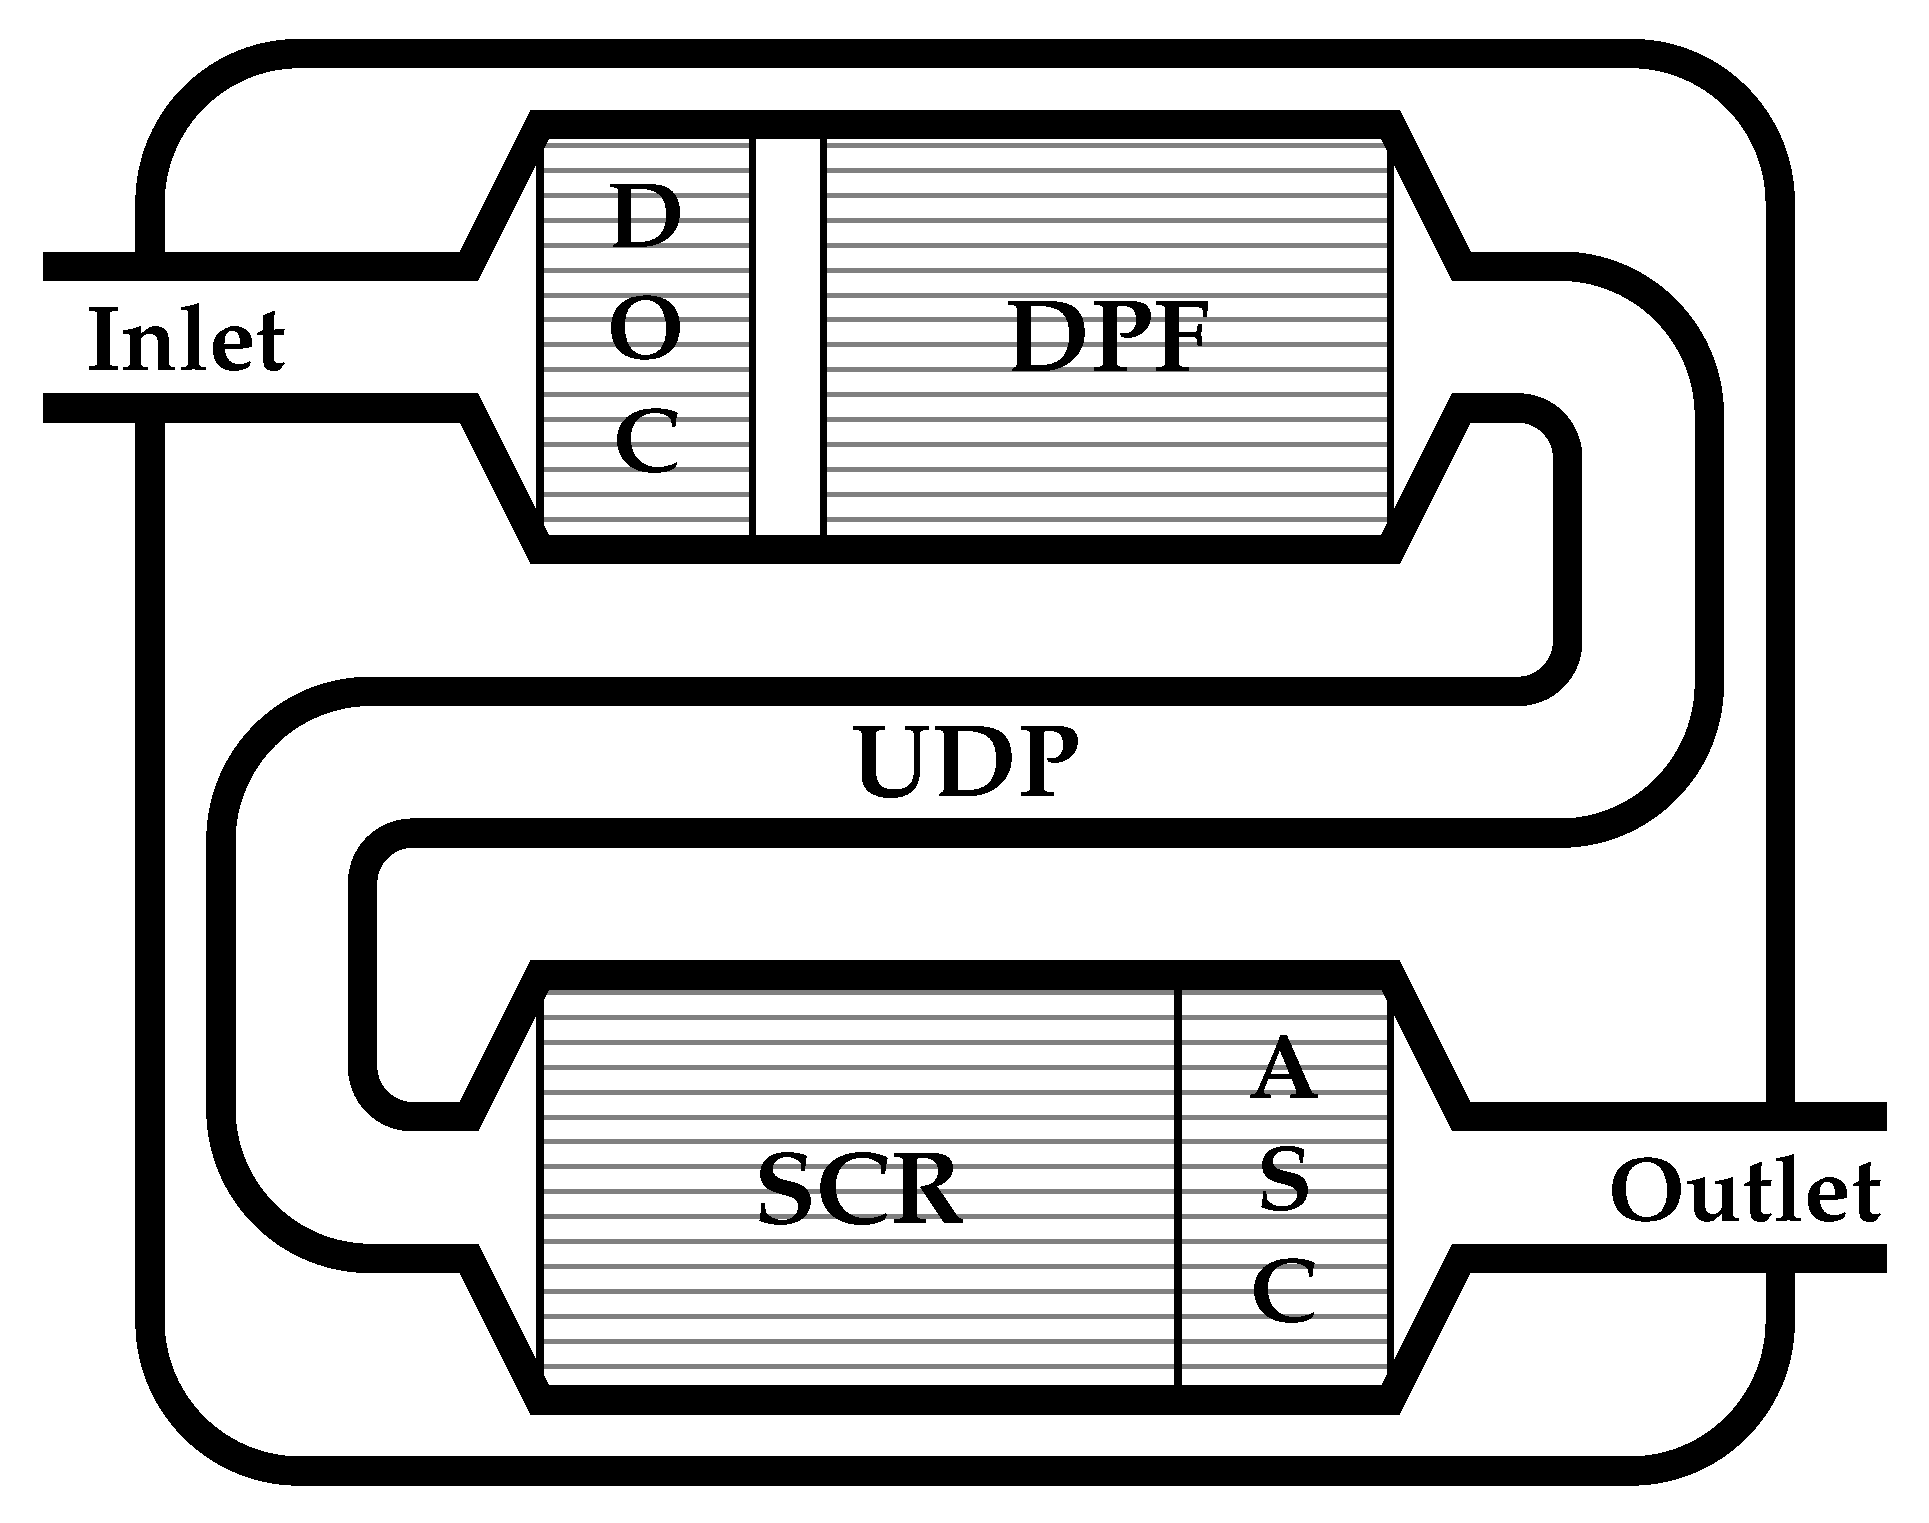
Figure 1. Schematic of the aftertreatment system.
Energies 15 08232 g001
Figure 2. Ammonia storage reference as a function of temperature. The level curves also show NO x conversion at steady-state for the exhaust mass flow 0.15 kg/s, and engine out concentrations of 1800 PPM and 200 PPM for NO and NO 2 , respectively.
Energies 15 08232 g002
Figure 3. Validation of the model using the WHTC. Inputs are shown on the left and outputs are on the right. The blue lines are data from experiments and the red lines are simulated values.
Energies 15 08232 g003
Figure 4. The baseline thermal management strategy applied to the WHTC. The behavior is very typical for the strategy: first, the least efficient mode (mode 1) is used until the front of the catalyst is hot enough, and after that, the middle mode is used until the mean temperature of the catalyst is hot enough. The middle mode is also used again after some time when the SCR becomes too cold.
Energies 15 08232 g004
Figure 5. Illustration of the masses used in the equivalence relation between fuel and NO x . The data are from a simulation of the WHTC using the baseline strategy. The units for fuel and NO x are normalized so that the extra fuel mass and accumulated NO x mass when using the baseline strategy both end at one. The normalized units are called the normalized fuel unit (NFU) and normalized NO x unit (NNU).
Energies 15 08232 g005
Figure 6. Illustration of the phases in an event. The pre-heating phase is marked with green and the pollution phase is marked with red. The engine mode and accumulated NO x mass is that of the baseline controller.
Energies 15 08232 g006
Figure 7. Results from simulations of the single-event cycle for different λ NO x . Included in the figure is also the result from using the high-efficiency (HE) mode after the cold start is over, this simulation is used as a reference when calculating Δ m f .
Energies 15 08232 g007
Figure 8. Results from simulations of the single-event cycle with varying length of engine-off event. The figure includes results from the high-efficiency (HE) mode, the baseline strategy ( λ NO x = ), and simulations where λ NO x has been chosen such that the fuel consumption is the same as for the baseline strategy.
Energies 15 08232 g008
Figure 9. The same as Figure 8, but here λ NO x has been chosen such that the fuel consumption is double that of the baseline strategy.
Energies 15 08232 g009
Figure 10. Results from simulations of the single-event cycle for different λ NO x and engine-off times of 10, 30, 60, and 90 min. Note that all lines are flat for small and large λ NO x . For large λ NO x , the lines are flat because pre-heating cannot be done with the specified equivalence factor. For small λ NO x , the lines are flat because the maximum reduction in NOx is already achieved, and using more fuel does not improve the results.
Energies 15 08232 g010
Figure 11. Redistribution of fuel between engine-off times 10 and 60 min and λ NO x = 0.58 in Figure 10. The blue circle marks the optimal distribution (minimum NO x ) and the red the distribution from the proposed strategy.
Energies 15 08232 g011
Figure 12. Pairwise sum of the NO x from the simulations in Figure 10. The figure includes the direct sum, adding simulations with the same λ NO x , as well as the optimal and worst redistribution of the corresponding amount of fuel.
Energies 15 08232 g012
Figure 13. Results from simulations where the strategy is applied on the drayage cycle. The pollution phases are marked with red.
Energies 15 08232 g013
Figure 14. Results from simulations of the drayage cycle for a range of λ NO x (blue lines). Red lines mark the result from the baseline strategy ( λ NO x = ).
Energies 15 08232 g014
Table 1. Summary of the results in Figure 14. m f , t o t H E corresponds to the total fuel mass when the high-efficiency mode is used the whole cycle, i.e., the minimum amount of total fuel. The intersections with the baseline strategy are marked gray.
Extra FuelTailpipe NO x Mass
λ NO x Absolute (NFU)Relative to BaselineRelative to m f , tot HE Absolute (NNU)Relative to Baseline
0.63653.892%1.2%1.53100%
0.5874.1100%1.3%1.4696%
0.2658.2200%2.6%0.9965%
0.14112.3300%4.1%0.747%
Publisher’s Note: MDPI stays neutral with regard to jurisdictional claims in published maps and institutional affiliations.