1. Introduction
Currently, materialism and human activities that require a lot of energy are increasing harmful gases emissions. This has two adverse consequences: it causes detrimental changes in the environment and simultaneously quickly reduces fossil fuel reserves. Furthermore, air, water, and soil contamination significantly harm public health. Wind, solar photovoltaic, thermal, tidal, geothermal, and biomass energy sources can be utilized to address global and domestic environmental concerns. PV panels are growing more popular because of their commercial acceptability, technological maturity, ease of installation, minimal equipment, negligible operational and maintenance costs, and distributive nature. In addition, power can be generated when sunlight and solar panels are available [
1,
2].
Solar panels are expected to be beneficial in Saudi Arabia due to the country’s high levels of global solar radiation and lengthy periods of daily sunlight throughout the year. Here, the average solar radiation ranges between 4.5 kWh/m
2 in Tabuk and 7.0 kWh/m
2 in Bisha, Saudi Arabia [
3]. It is anticipated that Saudi Arabia will invest over USD 50 billion in order to achieve its goal of producing more than 40 GW of solar energy by 2032 [
4]. The contribution of solar cells, as currently envisioned, is 16 GW [
4]. It is anticipated that 57 percent of the total cost of the PV system will be accounted for by the cost of the PV panels [
5]. To maintain the effectiveness of the PV panels, Saudi Arabia has two significant challenges: high ambient temperatures and prevailing dust storms in the desert region, as shown in
Figure 1. These factors reduce PV panel production and thus must be kept below specific levels [
6,
7]. Considering the adverse effect of dust accumulation on PV panels, there have been significant efforts to discover ways and means to clean the PV panels without ruining their surface [
8,
9,
10].
The dust build-up on the surface of solar panels limits their ability to receive solar energy and lowers their efficiency. Therefore, the performance of the PV panels declines by up to 40% [
12]. The frequent occurrence of dust storms, combined with humidity, makes manual cleaning of the panels very costly and time-consuming [
13]. Nowadays, available cleaning approaches require skilled personnel to operate the equipment intelligently while ensuring that the surfaces of the panels are not damaged. In addition, cleaning large PV farms may significantly impact the employees’ health if they work in harsh weather conditions [
14].
Most currently available solar PV panel cleaning technologies in desert settings, such as Saudi Arabia, rely on water, which is scarce and expensive. Moreover, solar panels must be cleaned periodically, depending on the quantity of dust cover. This consumes a large amount of water and ultimately increases the cost. Modern systems rely on autonomous robots, which are slow and require water to clean the surfaces, making them unsuitable for large-scale PV plants in Saudi Arabia and other locations with similar climates. The proposed technique of cleaning solar PV panels with the downward thrust of a drone does not require water and robots. While flying above the panels, a drone can remove dust from the panel surface and improve its efficiency. The drone path and schedule for cleaning the solar PV panels are proposed in this research based on experimental findings. Drone-based panel surface cleaning saves money, time, and water. However, it is associated with a high initial investment and short battery life. Since this topic is still in its early stages of development, few research papers are available in the literature [
15], and it is expected to become more efficient with time. This study aims to analyze the efficacy of drone-based PV panel cleaning and the best method for cleaning the panels’ surfaces.
2. Current Technologies for PV Panel Cleaning
The necessity and frequency of PV panel cleaning depend on the type of soiling and the mounting position of the solar panels. In Perth, Western Australia, a study suggested that the cleaning cost was higher than the energy loss caused by dust accumulation [
16]. Such a system relies on natural cleaning by wind and heavy rains [
17]. However, infrequent rainfalls and desert climatic conditions significantly decrease PV panel efficiency due to dust accumulation [
18]. PV panel cleaning is critical in these scenarios to preserve power harvesting efficiency. Several cleaning methods and procedures that are used in different parts of the world are described in this section.
2.1. Manual Cleaning
The typical cleaning method entails manually cleaning the panels with essential cleaning materials and equipment such as brushes, soap, and water, along with human labor [
19], as shown in
Figure 2. To avoid damaging solar panels, skilled professionals should conduct the cleaning process. This strategy is ineffective when solar panels are positioned as high as 20 feet or more above the ground. Furthermore, a lot of water is consumed with this form of cleaning. Finally, the required time to clean the panels and the cleaner’s safety make this method less attractive, especially in harsh desert environments.
2.2. Robotic Cleaning
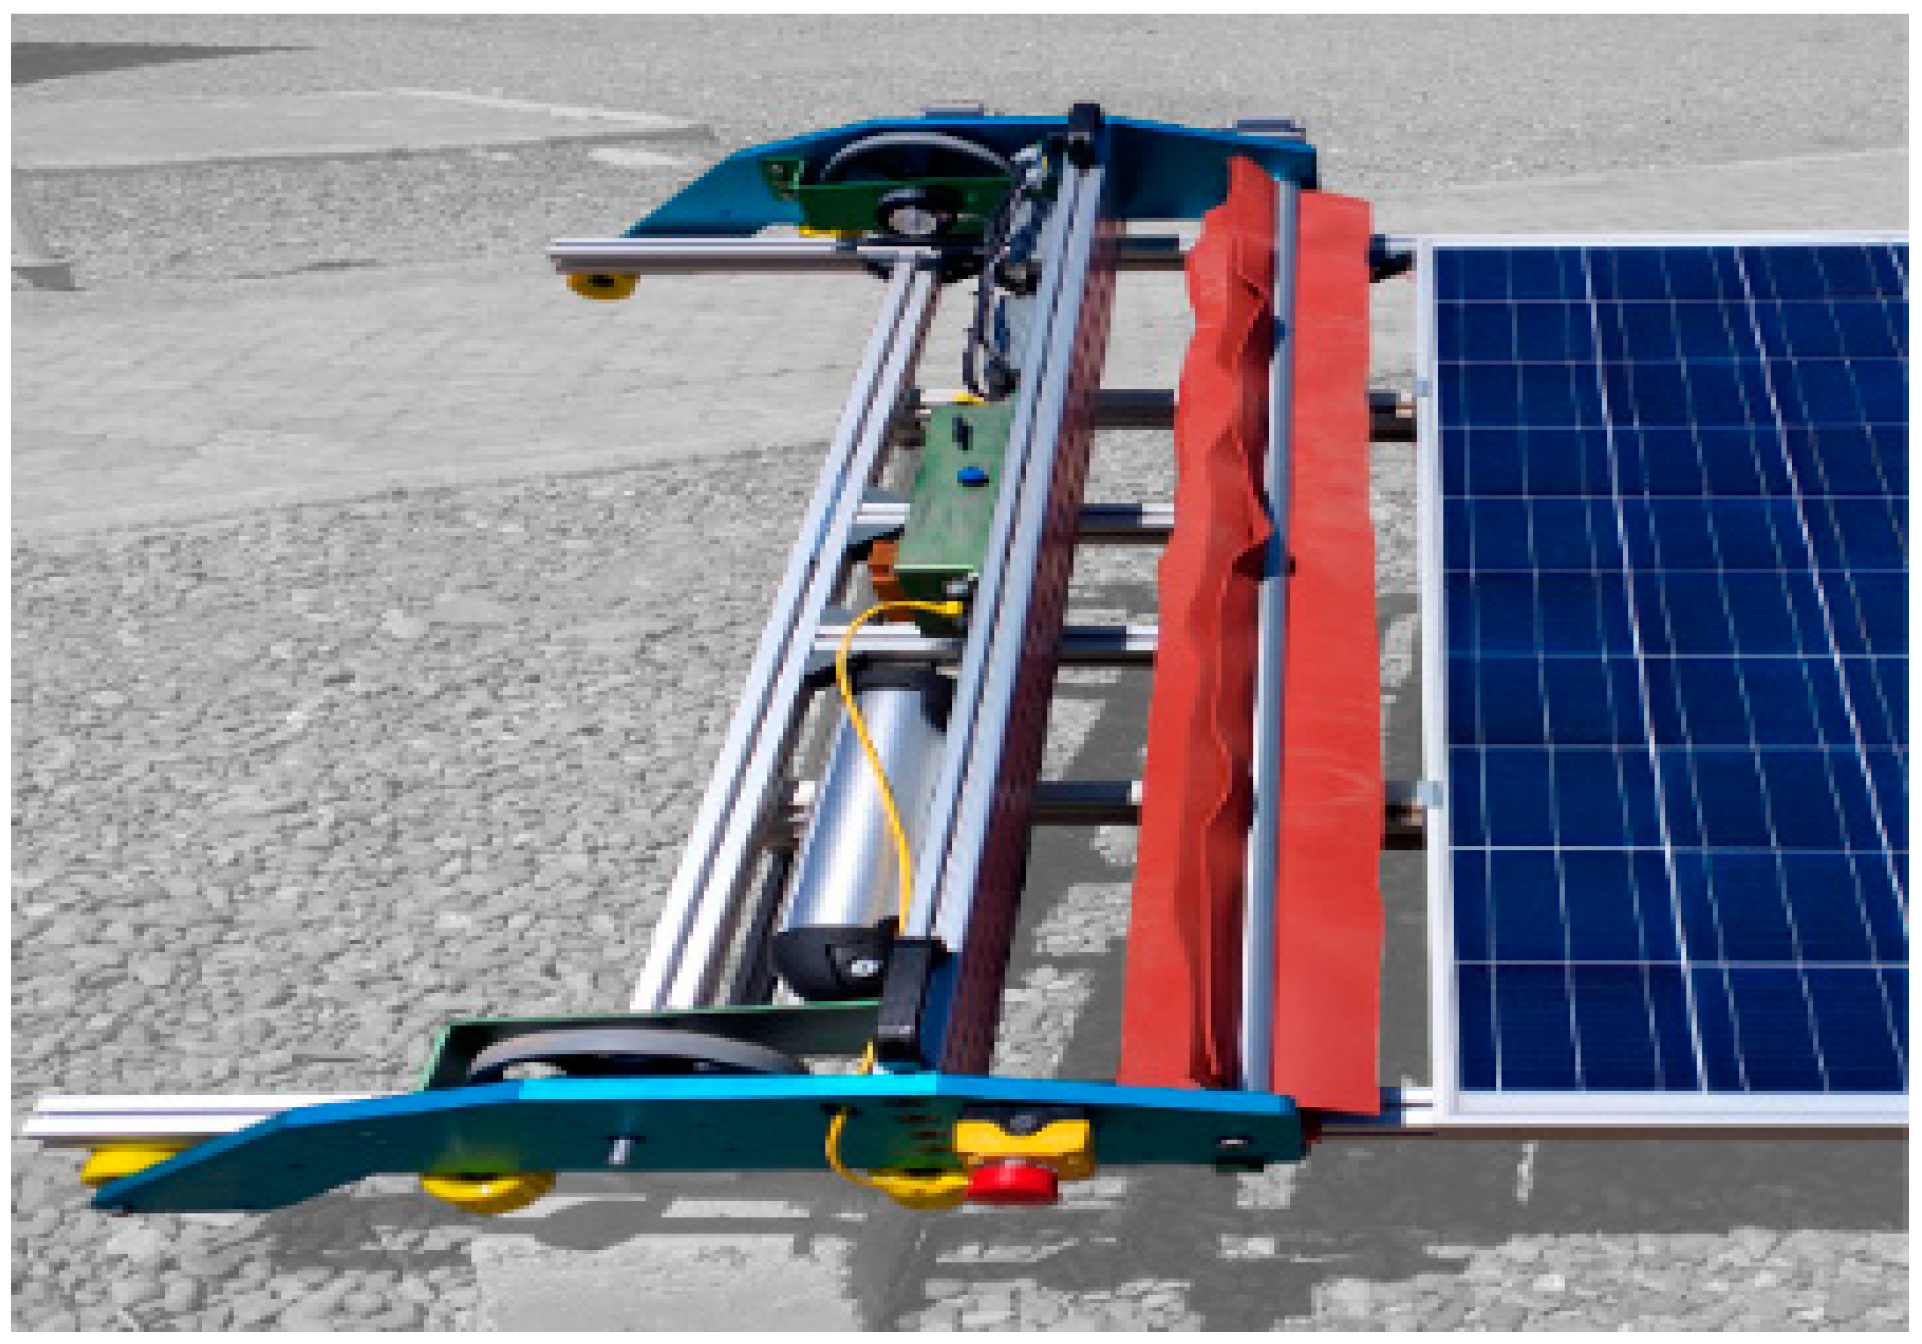
The robotic cleaning approach employs sensors and a precise controlling system. However, similar to the manual approach, this procedure usually requires water to clean the surfaces. The downside of this technology is that the gadget’s dead weight and movement might harm the PV panel’s surface. Aside from that, its power usage is greater than the manual technique.
Recently, many robotic-based cleaning systems have been used to clean solar panels, as shown in
Figure 3 [
20]. However, such a system’s initial and ongoing expenditures are substantially high, and the system’s capacity to withstand extreme weather conditions is dubious.
There are different methods used to clean PV panels using robots. Jaradat et al. [
21] proposed employing a single robot mounted on an automated carrier to clear the dust. As depicted in
Figure 4, the robot can go from panel to panel with the help of the carrier and a vehicle that runs along a rail platform. This system’s architecture allows it to be scaled up or down.
Sheibo et al. [
22] formulated another robot design. The robot was made to work with panels measuring 800 mm by 900 mm. The robot’s cleaning component was a rolling brush with a dust vacuum cleaner attached behind it.
Figure 5 shows the design of the robot proposed in [
22]. To clean the solar panels, several robot designs employ brushes. In addition, some models have additional cleaning features to ensure a spotless PV panel. For example, Hassan et al. [
23] showed a cleaning robot with a brush, a fan to keep it sliding, and an air blower to clear the dust. This design can clean panels that are slanted up to 25 degrees, as shown in
Figure 6.
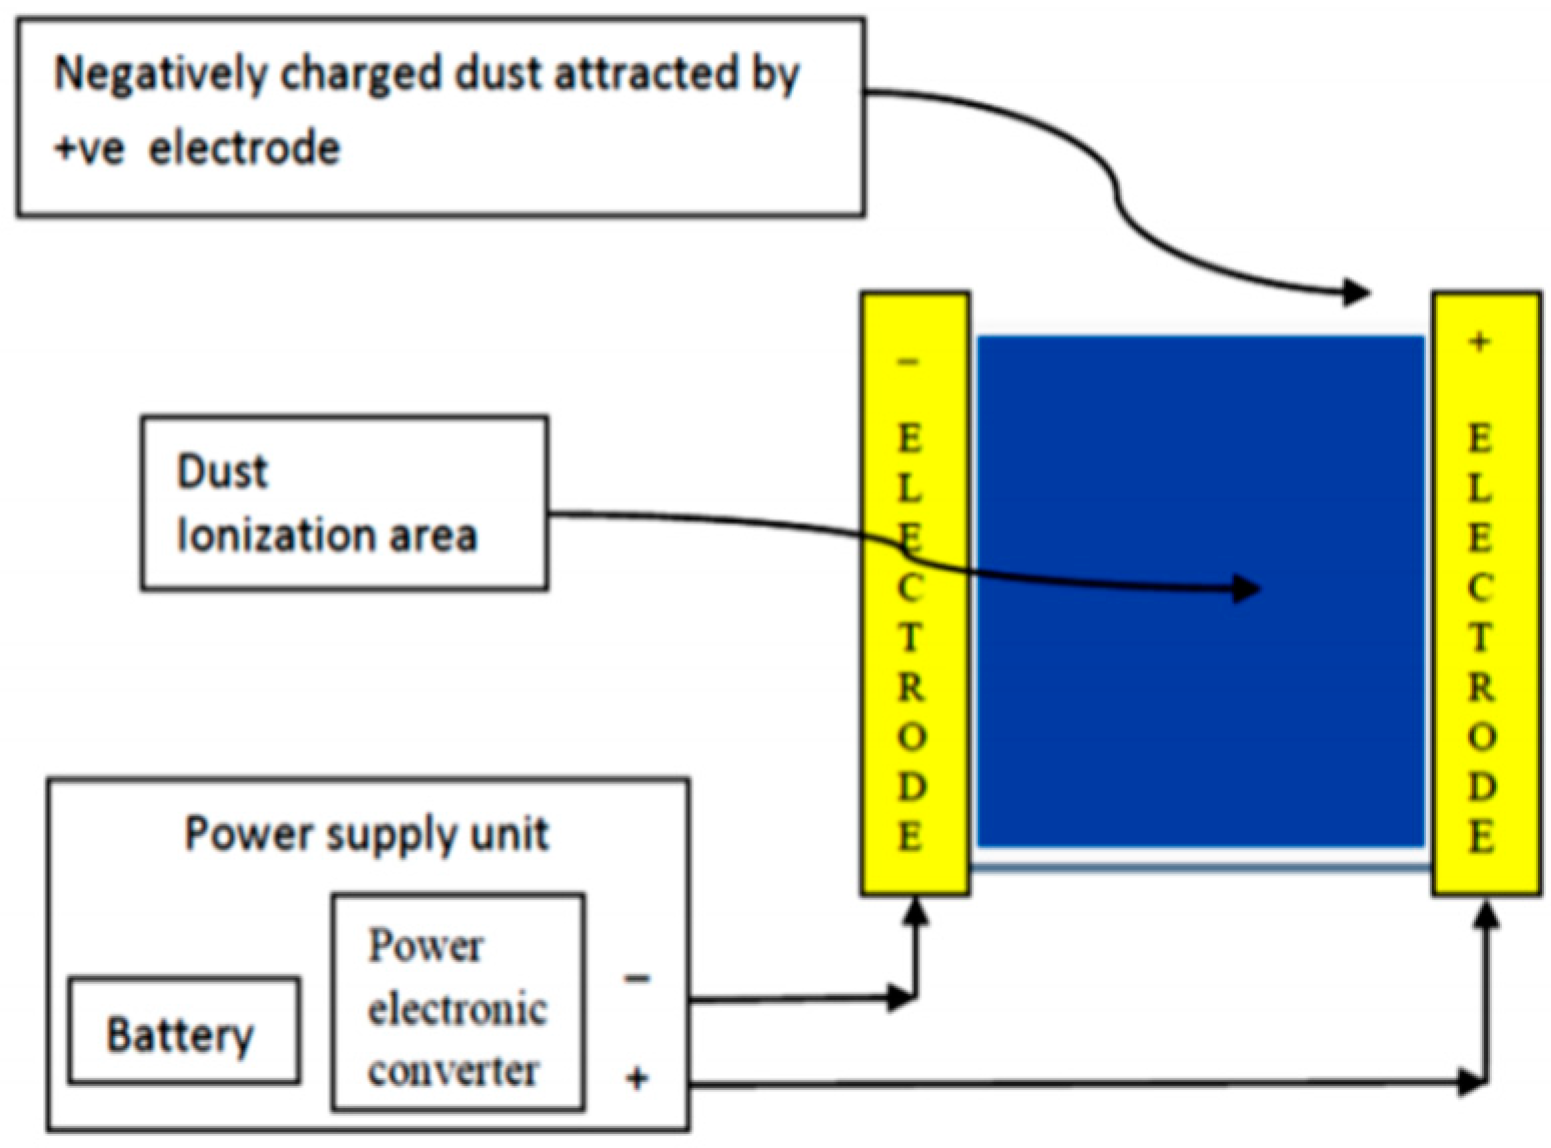
2.3. Electrostatic Precipitator
An electrostatic precipitator is a type of filter that removes dust particles from the surface of PV panels using an induced electrostatic charge. This model ensures that dry dust is removed continuously and automatically without water. A microcontroller (Arduino) signal activates charged electrodes when the weight on the panels’ surface exceeds a threshold due to dust build-up. Negative charges on the dust particles are created by negative electrodes, which aggregate at the positive electrodes due to charge attraction [
24]. As illustrated in
Figure 7, this successfully eliminates dust from the panels, enhancing efficiency almost effortlessly and automatically. However, the technology’s requirement for high voltage to generate an electric field is a significant disadvantage.
2.4. Drone-Based Cleaning System
The surfaces of PV panels can be cleaned with drone propellers that provide downward thrust. This is by far the quickest and safest method. It does not come into contact with the panels and does not require any human intervention. Cleaning solar panels with drones has been proven to enhance efficiency by up to 35% and reduce maintenance expenses by up to 60% [
25]. Furthermore, the time required to clean the panels is shorter than the manual cleaning method, and one drone can clean many panels depending on the battery capacity of the drone. In addition, the drone may be programmed to clean the panels autonomously and regularly without human intervention. In the results section, a cost and time analysis is presented. Each PV cleaning procedure has benefits and drawbacks.
Table 1 highlights the main benefits and drawbacks of each described cleaning procedure.
3. Methodology and Experimental Setup
Since drone usage in civilian applications and its accessibility to people has become common, the drone business has proliferated [
26]. The present experimental study used a miniature drone with speed and height that are more adjustable than previous versions. In addition, drones can examine the surfaces of PV panels, instead of human visual examination, for dust collection and other defects if suitable cameras are installed.
Drones have many advantages over other classical methods. For example, robotic cleaning systems are heavyweight and oversized, and need water to clean the panels. The weight of multi-rotor drones ranges from a few hundred grams to hundreds of kilograms [
26]. As a proof of concept, this study used a DJI Inspire 1 drone (model T600), as shown in
Figure 8. This model weighs 3.06 kg, has a top speed of 79 km/h, and can fly up to 2500 m in height. It can operate safely in the ambient temperature range of −10–40 °C [
27]. The drone’s upgraded system includes the primary camera, vision positioning system, 3D sensing system, dual-band GPS, and high-precision inertial measurement unit. It has an 18 min maximum flight time, which is sufficient for the current proof-of-concept application.
The drone was programmed to fly various paths, including horizontal, vertical, and diagonal, to examine the effectiveness of the drone movement path on the cleaning efficiency of the solar panels using downward airflow from the propellers.
Figure 9 demonstrates the horizontal drone route on top of a panel. The effect of removing dust on PV panel efficiency was measured for each pattern. A comparison of the proposed method with manual panel cleaning was conducted. Finally, a recommendation is provided for the most successful scheme for utilization in real solar PV power plants.
Experimental Procedure
The experiment was carried out with a 60-watt solar PV panel. The experimental setup is depicted in
Figure 10; the electrical characteristics of this panel were studied to identify the influence of dust on power output. Moreover, in use, cleaning using a drone would be performed according to a preset schedule or after sand storms, with the intention of minimizing the shading interruption and hence minimizing the power loss.
The experiment comprised three stages. The purpose of the first stage was to quantify the reduction in output power as a function of dust collection. In the second stage, the power of the panel’s output before and after cleaning the surface by the drone using all flying patterns was evaluated.
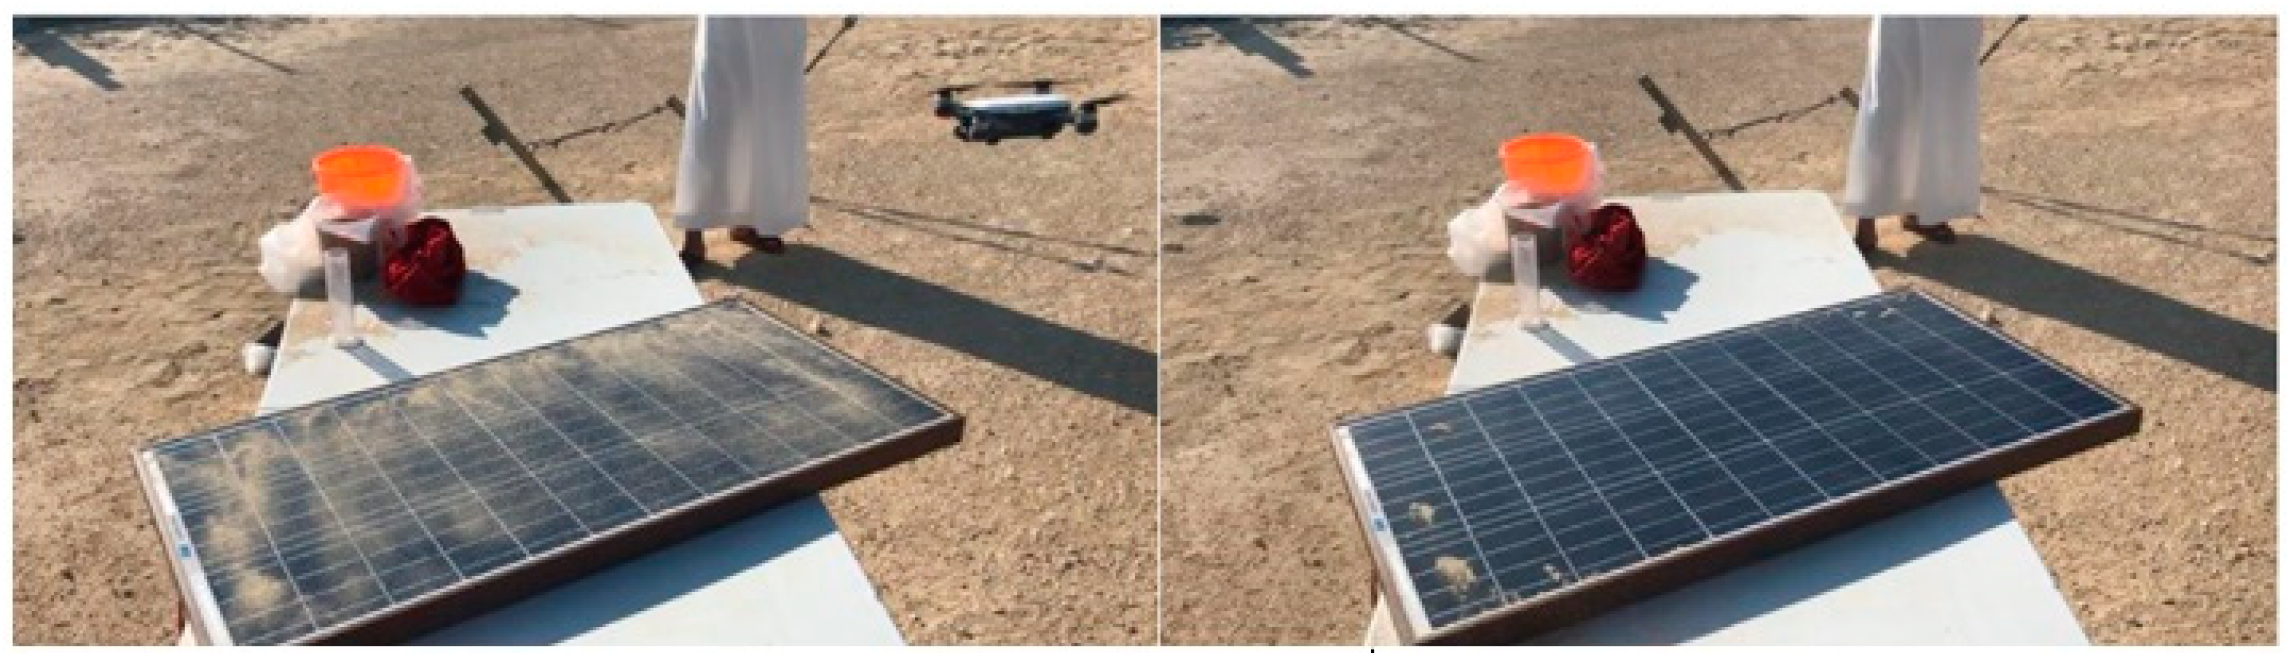
Figure 11 shows a solar panel system at King Fahd University of Petroleum and Minerals (KFUPM) beach that had not been cleaned for more than six months.
Figure 12 depicts images of the drone as it cleaned the solar panel. In stage three, the drone’s distinct flight patterns over the panels were used to calculate the amount of dust that had been removed and to assess the effectiveness of the drone path on dust removal. To carry out the experiment, a progressed graduated cylinder was used to manually spread the quantity of dust on the panel surface. The quantity of dust was measured using the graduated cylinder/tube by manually collecting the residual dust on the panel surface after the drone flight. This exercise was performed for each experiment. Next, the drone was flown above the PV panel surface, utilizing all flight patterns, and the residual dust was measured after each flight to calculate the percentage of dust reduction. Finally, a graph depicting the power output decrease over 5 weeks is presented.
The solar panel’s output power (
P) was calculated using Equation (1):
where
V is the output voltage, and
I is the output current. In this particular panel, the voltage value remained at 20.5 V at all times. The reference power
Po means the value of
P when there is no dust. Thus, the power decrease in percentage was calculated as follows:
When the panel was covered with dust, the amount of current was measured to calculate the power,
PD, as follows:
where
ID is the dusty panel’s output current and
V is the output voltage. After the drone passed over the panel surface, the power,
PC, was measured using the following equation:
where
IC denotes the output current after the drone’s flight above the panel. As a result, the percentage increase in power,
Pi, was calculated as follows:
Additionally, the dust reduction percentage was calculated as follows:
where
Di represents the initial dust volume on the panel and
Dr is the amount of dust left on the panel after the drone flight.
4. Results and Analysis
4.1. Effect of Dust on Solar Panel Power Output
The overall impact of various levels of dust deposition on the panel’s surface is summarized in
Table 2. It is evident that, as the dust volume on the panel surface increased, the output current, and hence the power output, decreased. For example, the power was 29.93 W when there was no dust on the panel surface, while it reduced to 22.75 W with a dust accumulation of 20 CC. So, one can observe that the power decreased by 65% when the dust quantity became 100 CC. A progressive decrement in the output power with increasing dust quantity on the panel surface is shown in
Figure 13.
The effect of the drone’s propellers due to different flight patterns on the amount of power output (efficiency) is shown in
Table 3,
Table 4 and
Table 5 for dust levels of 20 CC, 50 CC, and 100 CC, respectively.
Figure 14 shows the effect of drone based cleaning of the panel for 20 CC dust spread. der all circumstances.
Table 3 demonstrates that, for 20 CC dust, the diagonal drone flight mode did not perform well compared to the horizontal and vertical patterns in terms of power efficiency, which was 19.15%. However, in this case, horizontal drone movement performed the best, regaining a power efficiency of 31.90%.
Table 4 demonstrates that the increase in power efficiency for 50 CC dust spread was almost similar for the three drone movements. For 100 CC dust accumulation (
Table 5), the horizontal flight method was found to be the most effective among the three methods, with an output power efficiency of 69.40%. On the other hand, the vertical movement of the drone resulted in the worst performance in terms of output power efficiency of 23.73%.
Further investigation was carried out to measure the dust reduction with respect to the drone flight patterns and initial dust spread. The results are summarized in
Table 6. After the horizontal drone movement, in the case of 20 CC of initial dust spread on the PV panel surface, the remaining dust was measured to be 4.29 CC (i.e., a reduction of 78.60%). For vertical movement, the dust removal was seen to be 57.7%, while for diagonal movement, it was 68.45%. Similarly, for 50 CC and 100 CC initial dust spread experiments, horizontal drone movement was able to remove the maximum amount of dust, while the diagonal pattern was second best in terms of dust removal efficiency. However, the vertical movement reduced the least amount of dust from the panel surface.
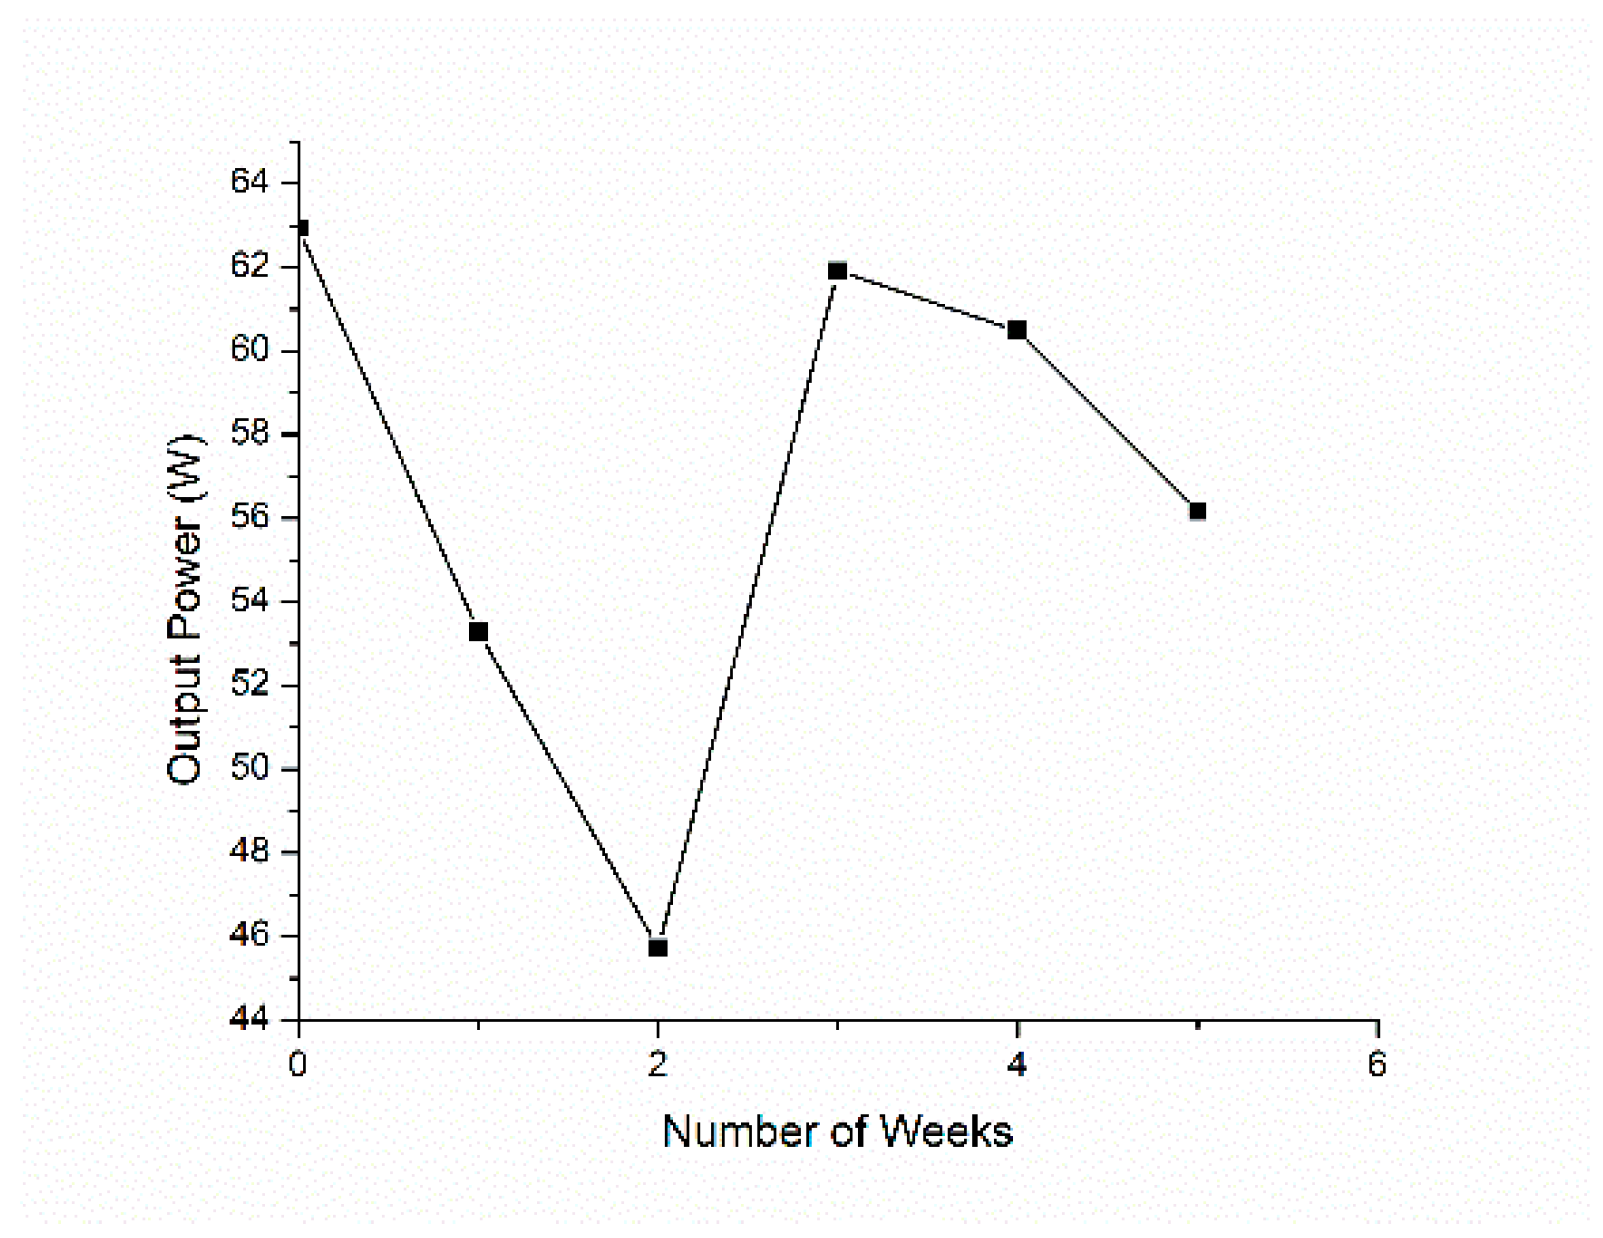
In order to study the performance of the PV panel output over a long period, the output current was measured weekly (
Table 7 and
Figure 15). At the start of week 1, when the panel was cleaned, the power was more than 62 W and reduced to 53.3 W by the end of the first week, and further reduced to 45.72 W by the second week. The power regained the original output of around 62 W at the end of the third week because the panel surface was cleaned by heavy rain during that week. The power again decreased over time in the 4th and 5th weeks, as shown in
Figure 15.
Many factors affect the accuracy of the measurements. First, strong wind makes the drone unstable, especially in our case, where the drone used was tiny and light. Second, the wind can blow some dust away before the drone reaches its destination. The third source is that the generated current changes as the sun moves. Finally, dust leaking occurs while measuring the remaining dust on the panel.
4.2. Cost Analysis
This section estimates the approximate cost of cleaning the panels using different flight patterns. The time taken by the drone to fly across the panel surface was measured for each method, and the data are recorded in
Table 8. The drone’s average power consumption (
P) can be calculated as follows:
where
E is the full battery charge in Wh and TM is the total flight time on a single charge in seconds. The factor 3600 is used to convert from hours to seconds. For our experiment, the used drone’s battery capacity was 16.87 Wh and may last for 18 min on a single charge. From the battery data given and using Equation (7), the drone’s average power consumption was
For industries in Saudi Arabia, the energy cost is 0.20 SAR/kWh. Therefore, the cost of cleaning one panel with a drone can be calculated as follows.
where
T is the flight time above the panel in seconds. To assess the performance of different flight patterns, we defined the figure of merit as the ratio between the output power increase and the required cleaning energy per panel as:
Table 8 shows that the horizontal drone path is the most efficient with the highest figure of merit. It is worth noting that the price of panel surface cleaning was low because the drone used limited power, and we used one panel in our proof-of-concept demonstration. Therefore, the cost is expected to be higher for real solar farms with millions of panels. However, the figure of merit will provide the same comparison results. In any case, it is believed that drone cleaning costs are lower than conventional cleaning methods.
5. Conclusions
It was concluded from this research that the formation of multiple layers of dust on the surface of solar panels diminishes efficiency exponentially up to a saturation point. As a result, the proposed innovative cleaning approach is critical for solar energy harvesting. Furthermore, the investigation demonstrated that, as the amount of dust increased, the solar panel’s power dropped exponentially, reaching a saturation point at roughly 100 CC of dust. By reducing the dust volume to 50 CC, it was found that output power increased by over 70% for all drone trajectories. All paths performed similarly below 50 mL, with 31.9%, 27.1%, and 19.15% for horizontal, vertical, and diagonal cleaning paths, respectively. At 100 CC dust, the horizontal and diagonal cleaning paths reigned supreme with 69.4% and 57.63%, respectively, while the vertical path failed, with 23.73%. Therefore, these results are comparable at low and medium quantities of dust, but at large volumes, vertical path losses increase. Dust reduction follows suit, with the horizontal pattern being the most effective.
Overall, horizontal movement is the best scheme because it achieves the highest efficiency in all cases with maximum dust reduction, and should be chosen for practical applications.
The study also estimated the cost of cleaning one million panels, which came out to be about SAR 10 for a one-time cleaning. In contrast, the manual cleaning method costs millions of SAR, assuming dust is light and not sticking to the surface. From a technical point of view, this theoretical analysis showed that the drone-based cleaning system is essential to improve the performance of solar panels. However, other classical methods may occasionally be needed when dust sticks to the panels. It should be noted that the drone may also be equipped with cameras to inspect the solar panels for any damage or defects.
Author Contributions
Conceptualization, A.A.-S. and L.M.A.; methodology, M.A.M. and S.R.; software, S.R. and A.E.H.; validation, M.A.M., S.R. and A.E.H.; formal analysis, A.E.H.; investigation, S.R.; resources, M.A.M., L.M.A. and A.A.-S.; data curation, A.E.H. and S.R.; writing—original draft preparation, S.R., M.A.M. and A.E.H.; writing—review and editing, S.R., M.A.M. and A.E.H.; project administration, M.A.M. and L.M.A.; funding acquisition, M.A.M., L.M.A. and A.A.-S. All authors have read and agreed to the published version of the manuscript.
Funding
This research was funded by the Deanship of Research Oversight and Coordination at KFUPM, grant number DF191024.
Data Availability Statement
Not applicable.
Acknowledgments
The authors would like to acknowledge the support of the Deanship of Research Oversight and Coordination at KFUPM under contract DF191024. In addition, the authors would like to acknowledge the help of U. Johar, W. Suliman, F. Bin Hussein, A. Aljohani, A. Almusharaf, and M. Alsalman.
Conflicts of Interest
The authors declare no conflict of interest. The funders had no role in the design of the study; in the collection, analyses, or interpretation of data; in the writing of the manuscript; or in the decision to publish the results.
References
- Bakić, V.V.; Pezo, M.L.; Stojković, S.M. Technical and economic analysis of grid-connected PV/Wind energy stations in the Republic of Serbia under varying climatic conditions. FME Trans. 2016, 44, 71–82. [Google Scholar] [CrossRef]
- Rehman, S.; Aliyu, K.N.; Alhems, L.M.; Mohandes, M.A.; Himri, Y.; Allouhi, A.; Mahbub, A. A comprehensive global review of building integrated photovoltaic systems. FME Trans. 2021, 49, 253–268. [Google Scholar] [CrossRef]
- Almasoud, A.; Gandayh, H.M. Future of solar energy in Saudi Arabia. J. King Saud Univ.-Eng. Sci. 2015, 27, 153–157. [Google Scholar] [CrossRef]
- Barhoumi, E.M.; Okonkwo, P.C.; Zghaibeh, M.; Ben Belgacem, I.; Alkanhal, T.A.; Abo-Khalil, A.G.; Tlili, I. Renewable energy resources and workforce case study Saudi Arabia: Review and recommendations. J. Therm. Anal. 2019, 141, 221–230. [Google Scholar] [CrossRef]
- Barhoumi, E.M.; Farhani, S.; Okonkwo, P.C.; Zghaibeh, M.; Al Housni, F.K.; Bacha, F. Economic Analysis and Comparison of Stand alone and Grid Connected Roof Top Photovoltaic Systems. In Proceedings of the 2021 6th International Conference on Renewable Energy: Generation and Applications (ICREGA), Al Ain, United Arab Emirates, 2–4 February 2021; pp. 223–228. [Google Scholar] [CrossRef]
- Ghazi, S.; Sayigh, A.; Ip, K. Dust effect on flat surfaces—A review paper. Renew. Sustain. Energy Rev. 2014, 33, 742–751. [Google Scholar] [CrossRef]
- Olivares, D.; Ferrada, P.; Bijman, J.; Rodríguez, S.; Trigo-González, M.; Marzo, A.; Rabanal-Arabach, J.; Alonso-Montesinos, J.; Batlles, F.J.; Fuentealba, E. Determination of the Soiling Impact on Photovoltaic Modules at the Coastal Area of the Atacama Desert. Energies 2020, 13, 3819. [Google Scholar] [CrossRef]
- Costa, S.C.; Diniz, A.S.A.; Kazmerski, L.L. Solar energy dust and soiling R&D progress: Literature review update for 2016. Renew. Sustain. Energy Rev. 2017, 82, 2504–2536. [Google Scholar] [CrossRef]
- King, M.; Li, D.; Dooner, M.; Ghosh, S.; Roy, J.; Chakraborty, C.; Wang, J. Mathematical Modelling of a System for Solar PV Efficiency Improvement Using Compressed Air for Panel Cleaning and Cooling. Energies 2021, 14, 4072. [Google Scholar] [CrossRef]
- Aljdaeh, E.; Kamwa, I.; Hammad, W.; Abuashour, M.I.; Sweidan, T.; Khalid, H.M.; Muyeen, S.M. Performance Enhancement of Self-Cleaning Hydrophobic Nanocoated Photovoltaic Panels in a Dusty Environment. Energies 2021, 14, 6800. [Google Scholar] [CrossRef]
- UNEP, WMO, and UNCCD, Global Assessment of Sand and Dust Storms. 2016. Available online: http://www.un.org/Depts/Cartographic/english/htmain.htm (accessed on 20 June 2022).
- Hussain, A.; Batra, A.; Pachauri, R. An experimental study on effect of dust on power loss in solar photovoltaic module. Renew. Wind. Water Sol. 2017, 4, 9. [Google Scholar] [CrossRef]
- Ferretti, N. PV Module Cleaning—Market Overview and Basics; PI Photovoltaic-Institute Berlin AG: Berlin, Germany, 2016. [Google Scholar]
- Thomas, S.K.; Joseph, S.; Sarrop, T.; Bin Haris, S.; Roopak, R. Solar Panel Automated Cleaning (SPAC) System. In Proceedings of the 2018 International Conference on Emerging Trends and Innovations in Engineering and Technological Research (ICETIETR), Ernakulam, India, 11–13 July 2018; pp. 1–3. [Google Scholar] [CrossRef]
- Al-Housani, M.; Bicer, Y.; Koç, M. Experimental investigations on PV cleaning of large-scale solar power plants in desert climates: Comparison of cleaning techniques for drone retrofitting. Energy Convers. Manag. 2019, 185, 800–815. [Google Scholar] [CrossRef]
- Tanesab, J.; Parlevliet, D.; Whale, J.; Urmee, T. Dust Effect and its Economic Analysis on PV Modules Deployed in a Temperate Climate Zone. Energy Procedia 2016, 100, 65–68. [Google Scholar] [CrossRef]
- Abu-Naser, M. Solar Panels Cleaning Frequency for Maximum Financial Profit. Open J. Energy Effic. 2017, 06, 80–86. [Google Scholar] [CrossRef]
- Karmouch, R.; El Hor, H. Solar Cells Performance Reduction under the Effect of Dust in Jazan Region. J. Fundam. Renew. Energy Appl. 2017, 7, 7. [Google Scholar] [CrossRef]
- Solar Panel Maintenance: Taking Care of Your Panels—TheGreenAge. Available online: https://www.thegreenage.co.uk/solar-panel-maintenance/ (accessed on 14 September 2022).
- Parrott, B.; Zanini, P.C.; Shehri, A.; Kotsovos, K.; Gereige, I. Automated, robotic dry-cleaning of solar panels in Thuwal, Saudi Arabia using a silicone rubber brush. Sol. Energy 2018, 171, 526–533. [Google Scholar] [CrossRef]
- Jaradat, M.A.; Tauseef, M.; Altaf, Y.; Saab, R.; Adel, H.; Yousuf, N.; Zurigat, Y.H. A fully portable robot system for cleaning solar panels. In Proceedings of the 2015 10th International Symposium on Mechatronics and Its Applications (ISMA), Sharjah, United Arab Emirates, 8–10 December 2015; pp. 1–6. [Google Scholar] [CrossRef]
- Cai, S.; Bao, G.; Ma, X.; Wu, W.; Bian, G.-B.; Rodrigues, J.J.; de Albuquerque, V.H.C. Parameters optimization of the dust absorbing structure for photovoltaic panel cleaning robot based on orthogonal experiment method. J. Clean. Prod. 2019, 217, 724–731. [Google Scholar] [CrossRef]
- Hassan, M.U.; Nawaz, M.I.; Iqbal, J. Towards autonomous cleaning of photovoltaic modules: Design and realization of a robotic cleaner. In Proceedings of the 2017 First International Conference on Latest trends in Electrical Engineering and Computing Technologies (INTELLECT), Karachi, Pakistan, 15–16 November 2017; pp. 1–6. [Google Scholar] [CrossRef]
- Hudedmani, M.G.; Joshi, G.; Umayal, R.M.; Revankar, A. A Comparative Study of Dust Cleaning Methods for the Solar PV Panels. Adv. J. Grad. Res. 2017, 1, 24–29. [Google Scholar] [CrossRef]
- Patented Drone Cleaning—Autonomous Airflow Cleaning with Unmanned Aerial Vehicles for Solar, Roofs, and More. Available online: https://www.aerialpower.com/ (accessed on 14 September 2022).
- Vergouw, B.; Nagel, H.; Bondt, G.; Custers, B. Drone technology: Types, payloads, applications, frequency spectrum issues and future developments. In The Future of Drone Use; TMC Asser Press: The Hague, The Netherlands, 2016; Volume 27, pp. 21–45. [Google Scholar] [CrossRef]
- Inspire 1—DJI. Available online: https://www.dji.com/inspire-1 (accessed on 14 September 2022).
| Publisher’s Note: MDPI stays neutral with regard to jurisdictional claims in published maps and institutional affiliations. |
© 2022 by the authors. Licensee MDPI, Basel, Switzerland. This article is an open access article distributed under the terms and conditions of the Creative Commons Attribution (CC BY) license (https://creativecommons.org/licenses/by/4.0/).


