Abstract
We present a data prepossessing method for parameter identification based on clustering and hypothesis testing in a power distribution network to successfully achieve a more accurate result. This method considers the similarities of data in both spatial relationship and statistical theory, then builds a sophisticated data processing method to improve the performance of dynamic model-based parameter identification models, i.e., Markov chain Monte Carlo and sequential model-based global optimization. We applied this data processing method to the actual feeder data with no adjustment of the other condition. The experiment shows that our method achieves a 4.8% improvement in accuracy at most.
1. Introduction
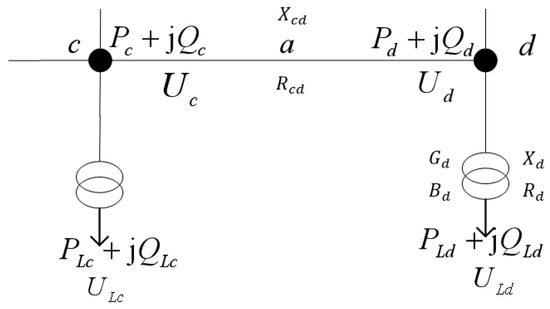
In a power distribution network (PDN), to ensure system security and stability, parameter values in the line and transformer, such as the line resistance, line reactance, transformer resistance, transformer reactance, transformer conductance, and transformer electrical susceptance, should be recorded as accurately as possible. There are many research studies about this, such as the full-scale approach [1], normalized Lagrange multiplier test [2], finite-time algorithm [3], Lagrange multiplier method [4], and deep learning [5]. However, considering the lack of real-time measuring equipment, all methods mentioned above are not suitable to current conditions. To solve this problem, research on parameter identification based on node equations have been proposed recently. To simplify the computation, a power-flow calculation circuit model is built and shown in Figure 1.

Figure 1.
Power-flow calculation circuit model.
In Figure 1, , , and are signed as the active power, reaction power, and voltage on the high-voltage side, respectively. These parameters can be obtained directly by real-time measurement, and they are the inputs of the node equations. Other parameters, such as transformer electrical , transformer resistance , transformer conductance , transformer electrical susceptance , line resistance , and line reactance are hard to detect. Node equations provide a solution to achieve parameter identification. The basic schedule is shown in Figure 2.

Figure 2.
Schedule of parameter identification based on node equations.
Obeying this schedule, some solutions such as the least squares (LS) method [6], Markov chain Monte Carlo (MCMC) [7], and sequential model-based global optimization (SMBO) [8], are proposed to solve node equations. These solutions work only based on the limited real-time measurement raw data, including active power, reactive power, and voltage on the high-voltage side of the transformer, which can be collected easily from the end layer of the power grid. According to the above description, all methods focus on the parameter identification algorithm. Among them, the methods based on node equations can complete the parameter identification of the entire PDN and only need a small amount of easily measured raw data. However, there is no research about how to select the most appropriate raw data to make the identified parameters more accurate.
Most of the time, these methods based on node equations are appropriate for ideal environments in a PDN and assume that the parameters in the line and transformers are stable and unchangeable during a long period. However, it is inevitable to avoid some impacts to the parameters such as heat, troughs, and peaks in electricity consumption, unstable conditions, and grounding resistance. As a result, the actual parameter values in the line and transformers are not stable and irreversible changes may occur. Considering that the sample frequency of the measurement raw data is very low, even if in sequential raw data samples, there may be differences, resulting in a large variance between the parameter identification results and the real value. Thus, it is necessary to do some processing of the measurement raw data to reduce the variance; however currently, there is no research about it.
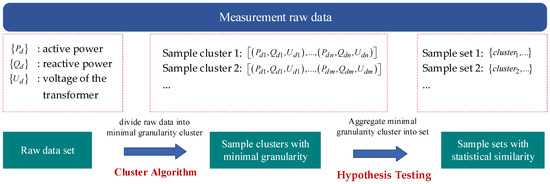
In this study, we make a reasonable assumption that the parameters to be identified are similar under the conditions of a three-phase balance and high similarity of input parameters. Based on this assumption, we propose a measurement raw data processing method based on clustering and hypothesis testing to achieve a more accurate parameter identification result. The whole schedule is shown in Figure 3. The cluster process is to obtain different subsets with the strongest similarity. Meanwhile, considering the computation will grow greatly with more raw data, the hypothesis testing is introduced to aggregate the sets, and guarantee the results follow statistical theory.

Figure 3.
Schedule of measurement raw data preprocessing.
To achieve more accurate identification results with smaller variance, firstly, the measurement raw data is divided into minimal granularity by cluster algorithm, then clusters with statistical similarity are aggregated into a set by hypothesis testing. Finally, each set is the input of the node equation instead of the whole measurement raw data. According to these processes, higher identification’s accuracy is obtained.
2. Materials and Methods
2.1. Node Equations
As Figure 1 shows, to simplify the computation, the three phases are assumed to be balanced as the premise for calculating the power flow in this paper. All three input parameters (active power , reaction power , and reaction voltage on the high-voltage side) and six identified parameters (transformer electrical , transformer resistance , transformer conductance , transformer electrical susceptance , line resistance , and line reactance ) satisfy the following Equations (1)–(3),
and in Equation (3) are the longitudinal and transverse components of the transformer impedance voltage drop at bus , and can be expressed by Equations (4) and (5), respectively.
The equation of bus can be expressed as Equations (6)–(8), whereas the final equation is calculated by Equation (9):
The parameters in the line and transformer can be calculated based on Equations (1)–(9) with the measured data of power and voltage.
2.2. Dimension Processing
The measurement data is made up of , , and , and the dimension is three. To guarantee the cluster algorithm has the ability to explore the association better among all samples of measurement raw data, it is necessary to expand the dimensions with additional information. In this study, the time stamp of each sample is selected and the following information is extracted: peak/trough of electricity consumption, month, holiday/workday. This is because the extra information is an all category feature and can be encoded as a multidimensional vector. Thus, the measurement raw data with three dimensions can be converted to a new data set with more dimensions.
2.3. Cluster Processing
There is a problem that the encoded category feature is sparse in each dimension, but the measurement raw data is dense; in other words, the density distribution of data is uneven, which would cause traditional cluster algorithms, such as k-means and DBSCAN [9], to work ineffectively. One idea to overcome this problem is to run an algorithm which produces a special order of the database with respect to its density-based clustering structure containing the information about every clustering level of the data set. In this study, we improved the DBSCAN algorithm and redefine the core distance as following:
where x is a sample and ; stands for radius of neighborhood; is the min-points parameter where ; represents the i’th neighbor to x in the data set .
If , the reachability distance of y with respect to x is defined as following:
In particular, when x is core point and
2.4. Hypothesis Testing
Through clustering processing, a series of sample clusters in a scale of minimum granularity were obtained. Then, the hypothesis testing is applied to extract the relationship among these sample clusters, and the clusters having a statistical similarity to a sample set are gathered. Thus, sample sets with significant differences were obtained.
2.5. Identification Algorithms
The latest research about parameter identification include MCMC [7] and SMBO [8]. The principle of these two algorithms are building a model with a posteriori probability to optimize an objective function using the existing samples in parameter identification tasks. In this model, samplings are regarded as being from one of the distributions such as the Gaussian distribution or the compound Gaussian distribution. Thus, the model can be represented easily and the dimensions of the model are lower than most of the machine learning and deep learning models. In this paper, these two algorithms are applied to verify the effect of our data prepossessing method.
3. Experiments
3.1. Clustering Processing Results
Silhouette Coefficient is an evaluation method of clustering effect and it can be represented as Equation (13),
where a(i) represents the cohesion of the sample point, and it is as Equation (14),
where j represents other sample points in the same class as sample i, and distance represents the distance between i and j. Therefore, the smaller a(i) is, the closer the cluster is. If the value of S approaches 1, the more obvious the contour, and the better the clustering effect.
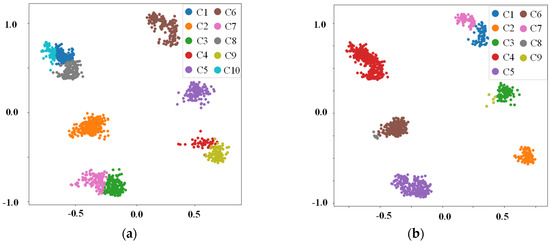
The results of the clustering process are shown in Figure 4 and Table 1, in detail. In addition, to exhibit the clustering results better, the scale of raw data is normalized to (−1, 1), and then the PCA algorithm is applied to reduce the dimensions to two. Thus, the x and y axes in Figure 4 have no label information.

Figure 4.
Results after clustering and aggregation: (a) DBSCAN [9]; (b) our method.

Table 1.
Metrics of the processing results.
3.2. Experiment Results
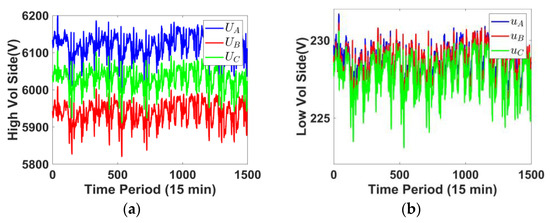
A total of 1499 samples in the raw dataset were collected in a standard 10 kV feeder with the sampling period of 15 min [10]. It is clear that the voltage is closed to the three-phase balance as shown in Figure 5, and it satisfied the requirements of node equations. Thus, our method can be applied.

Figure 5.
Three-phase voltage: (a) high side, (b) low side.
To make comparisons between with and without clustering processing, two related parameter identification methods, MCMC and SMBO, are introduced. We mainly measure the identification results by checking the errors of the voltage in high-voltage side between the measurement value and calculation value. The error distribution is introduced to weigh the error level [11,12,13,14,15,16]. The experiment results are exhibited in Figure 6.


Figure 6.
Experiment results with two identification algorithms: (a) calculation results based on MCMC and ; (b) calculation error distribution based on MCMC and , (c) calculation results based on SMBO and ; (d) calculation error distribution based on SMBO and .
In Figure 6, is the target voltage value; and stand for the results of MCMC and SMBO; and and represent the results with our processing, respectively.
From Figure 6b,d, after processing by our method, the identification parameters obtained by and all achieve better error distribution than MCMC and SMBO. From Table 2, improves about 4.8 and 2.2% on MAE and RMSE, respectively; while improves about 3.6 and 3.0%, respectively. The experiment results indicate that our method can prompt the parameter identification in a PDN.

Table 2.
Experiment results.
4. Conclusions
Parameter identification plays a key role in PDN calculation and analysis; however, current research pays more attention to the residuals between the true values and calculating values of voltage, but there is a lack of analysis and reprocessing. In this paper, the relationships of high dimension space among the raw feeder data are mined by an improved clustering algorithm, and the theory of statistics, such as hypothesis testing, is applied to guarantee processing results are reasonable. From the experiments, and all achieve better error distribution and metrics value (MAE and RMSE) than MCMC and SMBO, which indicates that our method can prompt the parameter identification in a PDN.
Although this method can achieve a higher accurate identification of results, it is limited to the serial computing mode, the application faces efficiency problems. In future work, parallel and dynamic methods will be considered to achieve a more efficient search mode among all similarity subsets.
Funding
This work is supported by Nanjing Institute of Technology Scientific Research Start-up Fund for High-level Introduced Talents (YKJ202046) and State Grid Jiangsu Electric Power Co., Ltd. (J2020097).
Data Availability Statement
Restrictions apply to the availability of these data. Data was obtained from State Grid Jiangsu Electric Power Co. Ltd. and are available from the corresponding author with the permission of State Grid Jiangsu Electric Power Co. Ltd.
Conflicts of Interest
The authors declare no conflict of interest.
References
- Lave, M.; Reno, M.J.; Peppanen, J. Distribution System Parameter and Topology Estimation Applied to Resolve Low-Voltage Circuits on Three Real Distribution Feeders. IEEE Trans. Sustain. Energy 2019, 10, 1585–1592. [Google Scholar] [CrossRef]
- Lin, Y.; Abur, A. Strategic Use of Synchronized Phasor Measurements to Improve Network Parameter Error Detection. IEEE Trans. Smart Grid 2018, 9, 5281–5290. [Google Scholar] [CrossRef]
- Arnaldo, A.; Soriano–Rangel, C.A.; Mancilla–David, F.; Ortega, R.; Strunz, K. Finite–time identification of the Thévenin equivalent parameters in power grids. Int. J. Electr. Power Energy Syst. 2020, 116, 105534. [Google Scholar]
- Venkata Krishna, B.; Padma Srinivasu, N. A Direct Approach for Distribution System Load Flow Solutions. Int. J. Eng. Adv. Technol. 2019, 8, 63. [Google Scholar]
- Mahmud, M.; Kaiser, M.S.; Hussain, A.; Vassanelli, S. Applications of Deep Learning and Reinforcement Learning to Biological Data. IEEE Trans. Neural Netw. Learn. Syst. 2018, 29, 2063–2079. [Google Scholar] [CrossRef] [PubMed]
- Yuan, K.; Wei, Z. Power line parameter identification based on multi-innovation least square algorithm. Electr. Power Eng. Technol. 2020, 39, 55–160. (In Chinese) [Google Scholar]
- Wang, H.; Jiao, H.; Chen, J.; Liu, W. Parameter Identification for a Power Distribution Network Based on MCMC Algorithm. IEEE Access 2021, 9, 104154–104161. [Google Scholar] [CrossRef]
- Li, B.; Ma, J.Y.; Hu, K.; Xu, S.H.; Jiao, H.; Chen, J.M.; Liu, W. A Method for Parameter Identification of Distribution Network Equipment Based on Sequential Model-Based Optimization. Int. Trans. Electr. Energy Syst. 2022, 14, 9880284. [Google Scholar] [CrossRef]
- Liu, S.; Song, W.; Ying, M.; Sun, W.; Wang, R.; Niu, R. Seismic facies analysis for angle gathers based on DBSCAN waveform clustering. Geophys. Prospect. Pet. 2022, 58, 773–782. [Google Scholar]
- Ma, Z.; Zhang, S.; Li, J.; Cai, Y.C. A Single-phase Grounding Fault Section Location Method for Power Distribution Network Based on Parameter Identification. Guangdong Electr. Power 2019, 32, 65–71. [Google Scholar]
- Song, J.; Dall’Anese, E.; Simonetto, A.; Zhu, H. Dynamic Distribution State Estimation Using Synchrophasor Data. IEEE Trans. Smart Grid 2020, 11, 821–831. [Google Scholar] [CrossRef]
- Anderson, P.M. Analysis of Faulted Power Systems; Wiley-IEEE Press: Hoboken, NJ, USA, 1995. [Google Scholar]
- Zhang, S. Power system state estimation based on particle swarm optimization algorithm. Power Syst. Prot. Control 2010, 38, 86–89+95. (In Chinese) [Google Scholar]
- Carquex, C.; Rosenberg, C.; Bhattacharya, K. State Estimation in Power Distribution Systems Based on Ensemble Kalman Filtering. IEEE Trans. Power Syst. 2018, 33, 6600–6610. [Google Scholar] [CrossRef]
- do Nascimento Sepulchro, W.; Encarnacao, L.F.; Brunoro, M. Harmonic Distortion and Power Flow State Estimation for Distribution Systems Based on Evolutionary Strategies. IEEE Lat. Am. Trans. 2015, 13, 3066–3071. [Google Scholar] [CrossRef]
- Weakliem, D.L. A Critique of the Bayesian Information Criterion for Model Selection. Sociol. Methods Res. 1999, 27, 359–397. [Google Scholar] [CrossRef]
Publisher’s Note: MDPI stays neutral with regard to jurisdictional claims in published maps and institutional affiliations. |
© 2022 by the authors. Licensee MDPI, Basel, Switzerland. This article is an open access article distributed under the terms and conditions of the Creative Commons Attribution (CC BY) license (https://creativecommons.org/licenses/by/4.0/).