Article

Evaluating and Enhancing the Energy Efficiency of Representative Residential Buildings by Applying National and International Standards Using BIM

1
Department of Civil Engineering, Faculty of Engineering, Al-Hussein Bin Talal University, Ma’an 71111, Jordan
2
Department of Mechanical Engineering, Faculty of Engineering, Al-Hussein Bin Talal University, Ma’an 71111, Jordan
3
Department of Electrical Engineering, Faculty of Engineering, Al-Hussein Bin Talal University, Ma’an 71111, Jordan
*
Author to whom correspondence should be addressed.
Energies 2022, 15(20), 7763; https://doi.org/10.3390/en15207763
Submission received: 27 August 2022 / Revised: 25 September 2022 / Accepted: 12 October 2022 / Published: 20 October 2022
(This article belongs to the Topic Energy Saving and Energy Efficiency Technologies)

Abstract

:
Due to the chronic shortage of energy-related analytical data and disintegration of building energy regulations, numerous existing residential buildings in Petra (Jordan) and many cities worldwide suffer from poor building energy design. This paper aims at investigating the potential of applying energy-saving standards in order to improve the whole-building energy consumption of low-rise residential buildings in mild and dry climate zones. Representative buildings were selected based on a field survey. Proposed strategies focused on applicable solutions such as envelope components, and energy-related systems were set. The models were created using Autodesk Revit, and then the results were generated by the EnergyPlus engine. The findings showed that the application of building energy standards greatly impacts the overall energy end-use, where up to 30% reduction can be achieved by applying the Jordanian code, and up to 45% by applying the American standard. This work provides guidance for the residential building industry and policymakers in Jordan and many other countries with similar building characteristics and climate zones.

1. Introduction

The present global energy resource balance is significantly dependent on oil, coal, and natural gas; these resources emit greenhouse gases and are non-renewable [1,2]. Energy supply is the focus of government initiatives [3]. Energy policy greatly impacts the social wellbeing, economic development, and stability of a society [4,5]. Globally, buildings are responsible for around 76% of electricity end-use and 40% of main energy use [1]. Residential buildings account for more than 25% of this consumption [6]. The residential sector offers great potential for saving energy [6,7]. Luckily, the energy consumption of residential buildings could be decreased by up to 70% percent [8,9]. For this reason, enhancing energy efficiency is an essential part of governments’ long-term strategies. Therefore, highly efficient residential buildings have a tremendous potential to cut energy usage extensively, by employing advanced technologies and building energy standards [10,11]. In Jordan, residential buildings are the second-highest users of energy. Figure 1 shows that energy consumption has been steadily increasing in the residential sector over the last decade, according to the Ministry of Energy and Mineral Resources (various annual reports) [12,13].
Existing buildings account for most of the residential industry and, hence, have a great potential for improving buildings’ energy efficiency in the coming years. Existing buildings are hampered by an aging envelope, poor systems performance, obsolete equipment, and a shortage of operating resources [14,15]. Economically, upgrading existing buildings is better than constructing new efficient buildings [16,17]. Most existing buildings in Jordan do not meet the country’s energy code, even though the national building energy regulations came into effect and were made obligatory in 2009 [18,19]. Moreover, there are no representative energy modeling inputs or reference buildings that serve as a benchmark to establish differences and percentages of energy savings when designing or renovating residential buildings in the country. The existing residential buildings account for 89% (20,673 buildings out of 23,229) of the region’s residential buildings. The types of existing residential buildings in the region vary, including houses (DAR or one-story buildings), villas, and apartment units. DAR is the most prevalent type of dwelling, accounting for 77% (17,886 out of 23,229 residential buildings) [20].
Building energy modeling and building information modeling (BIM) play a significant role in reducing energy usage in buildings [21]. Using an energy simulation approach can help make decisive decisions, where architects and engineers may drastically influence the trajectory of building energy use by utilizing such technology [22]. Such an approach also helps in finding the primary energy users for a given building, where identifying the principal end users allows the energy design experts to concentrate on how to diminish the most significant users [23]. The national and international building energy-saving standards provide minimum energy efficiency requirements for the design and construction of new systems and components in new and old buildings [24]. Specifically, the requirements are applicable to building expansions, new systems, and equipment. The scope covers the design of building envelopes, daylight/lighting, HVAC (heating, ventilation, and air conditioning), service water heating, and other energy-consuming equipment systems [18,25]. The national and international standards also define realistic design techniques and technology to reduce energy usage without jeopardizing thermal comfort or productivity. The codes cover the requirements for a wide range of building types, climate zones, and a variety of site conditions [25]. However, energy-use intensity (EUI) is a critical building performance index. It is the driving force behind numerous choices and design criteria throughout the project delivery process and the construction phase, realizing that various building types have varying energy consumption demands [26,27,28].
Based on the above discussion, all of the preceding evidence highlights the critical need for promoting energy efficiency in existing buildings. Reducing the environmental and economic harms of excessive energy use is the main aim of building energy standards. This goal can be achieved by selecting representative reference buildings and then investigating the potential of employing national and international building energy regulations to mimic the current and improved scenarios in an applicable and practical way. Complying with energy codes could lead to improved energy performance in the residential building sector in Jordan and many other countries. This study contributes to bridging the gap in this research field. Thus, it is divided into four parts: Section one presents the literature review and discusses the study problem and objectives. Section two illustrates the research methodology, which is divided into six subsections. Section three analyzes the results and specifies the energy end-use as well as EUI in different scenarios, for a variety of representative low-rise buildings. Section four discusses the study’s results, as well as their implications and limitations.

Literature Review

In terms of global research, several studies have been carried out to estimate and improve energy end-use in residential buildings, such as [29,30,31]. These studies focused on specific energy-related systems and components, including envelope components and/or HVAC systems. The findings showed that envelope improvement and/or HVAC efficiency enhancement are very effective ways to achieve high energy efficiency in existing residential buildings. However, these studies did not cover other factors and systems such as solar heat gains, visual lighting transmittances, HVAC efficiency, seasonal energy efficiency ratio (SEER), lighting/daylighting systems, and water heating systems. For example, Rakhshan [30] used design strategies focused on the feasibility of the installation of wall insulation and air-conditioning systems (coefficient of performance (COP)) in Dubai (hot–humid climate zone). The findings showed that enhancing wall insulation to a U-value (i.e., thermal transmittance) of 0.3 W/m2 K and upgrading the air-conditioning system to a COP of 2.78 were both financially feasible. Other studies, such as [29,30,31], focused on the highest energy target (i.e., zero-energy buildings). This target does not seem applicable to most buildings in many countries and regions, which do not even meet the building energy codes. Other papers [29,30,31,32,33,34] chose more representative case studies through extensive criteria of choice related to building and climate characteristics. Nonetheless, Attia’s work [35] developed representative building energy datasets and benchmark simulation models for the Egyptian residential sector. His study reports the results of a recent field survey for existing residential apartment buildings in Egypt. Two building energy models were developed, each of which represented the average energy end-use of air-conditioned residential units in different cities. The study created two energy models defining the energy usage profiles for HVAC, daylight/light, service water heating, and plug loads in relation to building layout and construction. Nevertheless, the study did not cover the potential of improving the developed models in a practical and standardized way. Some other papers, such as [32,36], used ASHRAE thermal comfort standards and practical energy-saving strategies to optimize thermal comfort in residential buildings of Cairo (Egypt) and energy performance in China’s existing residential buildings. The findings showed that in terms of increasing energy efficiency and thermal comfort, energy-efficient rehabilitation was worth carrying out to enhance existing residential buildings. However, these findings are only applicable to certain types of buildings (i.e., heritage-listed buildings) and specific climate zones (hot–dry and cold). Tahmasebinia [33,34] used BIM technology to create and validate a case study model, and Monte Carlo simulation data were also used to validate the model, which was able to cope with the improvement in energy consumption in the validated models.
In terms of local research, on the one hand, numerous studies have been conducted to investigate energy consumption for both new and existing residential buildings in Jordan, such as [18,37,38,39,40,41,42,43,44,45]. However, most of these studies focused on improving indoor comfort levels and increasing the energy efficiency in residential buildings. The studies discussed the effectiveness of different passive design strategies, such as insulation, window–wall ratio, thermal mass, and daylighting. They also showed how passive techniques could have a significant impact on reducing energy use in different climates. On the other hand, the authors found no standardized studies that investigated the effects of employing national and international regulations to improve energy efficiency in buildings. Furthermore, none of the above studies investigated the overall energy use of residential buildings in regions that lack data on energy modeling inputs, such as weather files and building characteristics.
The preceding discussion demonstrates a significant gap in integrating building energy regulations, building characteristics, and the chronic shortage of energy-related analytical data. The residential building sector in Jordan, as in many other countries where most of the buildings do not meet energy regulations, lacks such comprehensive study. Applying retrofitting strategies requires an in-depth analysis of the climate zone and current building energy analysis inputs. Therefore, there is a need to investigate residential buildings’ current energy performance and provide updated energy analysis inputs. However, to enhance the energy efficiency of residential buildings in a mild–dry climate, we aimed at evaluating the potential of applying applicable energy standards to enhance energy efficiency in the selected representative models based on national and international standards. Accordingly, the following queries were raised
-
What are the building characteristics and energy-related systems regarding energy efficiency in the region?
-
To what extent can applicable building energy codes improve the overall energy consumption of residential buildings in mild–dry climate zone?
In order to obtain answers to these queries and hypotheses, we introduced a conceptual framework, which is depicted in Section 2. This study not only adds value by helping to improve retrofitting strategies in non-compliant buildings and updating building energy codes that lack such efforts, but also enables policymakers and engineers to set acceptable and achievable energy efficiency targets when designing and implementing building modifications.

2. Materials and Methods

This study used a survey-based methodology to choose representative case studies, considering that surveys offer a high level of general ability in representing a large number of buildings and predicting their energy analytics data. A comparable method was used in [32,35,46]. Since experimental work in the existing buildings is limited primarily due to economic constraints, simulation software was used to evaluate and improve energy use in residential buildings in a mild–dry climate zone. A similar method was used in [29,30,31,32,33,34,35,36,46,47]. However, this work is based on six main aspects, which were derived from various building energy standards: envelope components, building area features, HVAC systems, service water heating systems, lighting systems, and plug loads. Information on systems and components was collected through a field survey. The collected data were used in choosing the representative buildings which served as reference models for the region and for investigating the effects of employing national and international building energy standards on energy consumption in residential buildings. The detailed methodology of this research is summarized in Figure 2, which breaks the process down into seven parts, starting with the selection of representative case studies and ending with the evaluation and enhancement of the reference models. The procedures are described in more detail in the following subsections.

2.1. Representative Buildings and Criteria of Choice

2.1.1. Built Area and Envelope Components

Heating, cooling, and lighting systems play an important role in compensating for envelope deficiencies. While a building envelope cannot meet all of the heating, cooling, and lighting demands of a building, a well-designed envelope may significantly reduce the building’s energy use [48,49]. The measures in this subsection were prioritized and employed as extensively as possible to choose reference buildings that represent most of the existing residential buildings in the study region. A survey-based study was conducted, where more than 1012 out of 17,886 households participated in the study. Table 1 shows the results of the survey of the residential buildings in the region in terms of built area features and envelope characteristics. It is noteworthy that the boundaries of the buildings’ area were based on Jordan’s Department of Statistics and Erik Johansson’s work [48,49].

2.1.2. Building Energy System Characteristics

An accurate estimation of the heating and cooling, lighting, and service water heating systems is necessary when creating an energy model and establishing load reduction strategies. This necessitates precise input of the size and part-load performance of the building’s air-conditioning equipment [50,51]. Nevertheless, the residents’ behavior in terms of energy consumption usually varies from one house to another. A survey-based field study was conducted to understand the residents’ behavior in relation to energy consumption (Table 2). The study revealed that 56% of households have an average space of 20 m2 of fully heated and cooled space (usually rooms) and that the vast majority use split HVAC systems for heating and cooling purposes. Such units were installed relatively recently, i.e., after 2009, so they meet or exceed the Jordanian energy code, with (A) or above SEER and SCOP energy labels (Table 2). Moreover, 49% of surveyed residents spend around JOD 400 on annual electricity bills. It is also noteworthy that the average price of 1 kWh of electricity is around JOD 0.075 JD and that family members gather together in the heated/air-conditioned space of 15–25 m2 in winter to get warm and in summer to stay cool. The detailed characteristics of the energy-related systems and the residents’ behavior are described below.

2.2. Description and Creation of Representative Models

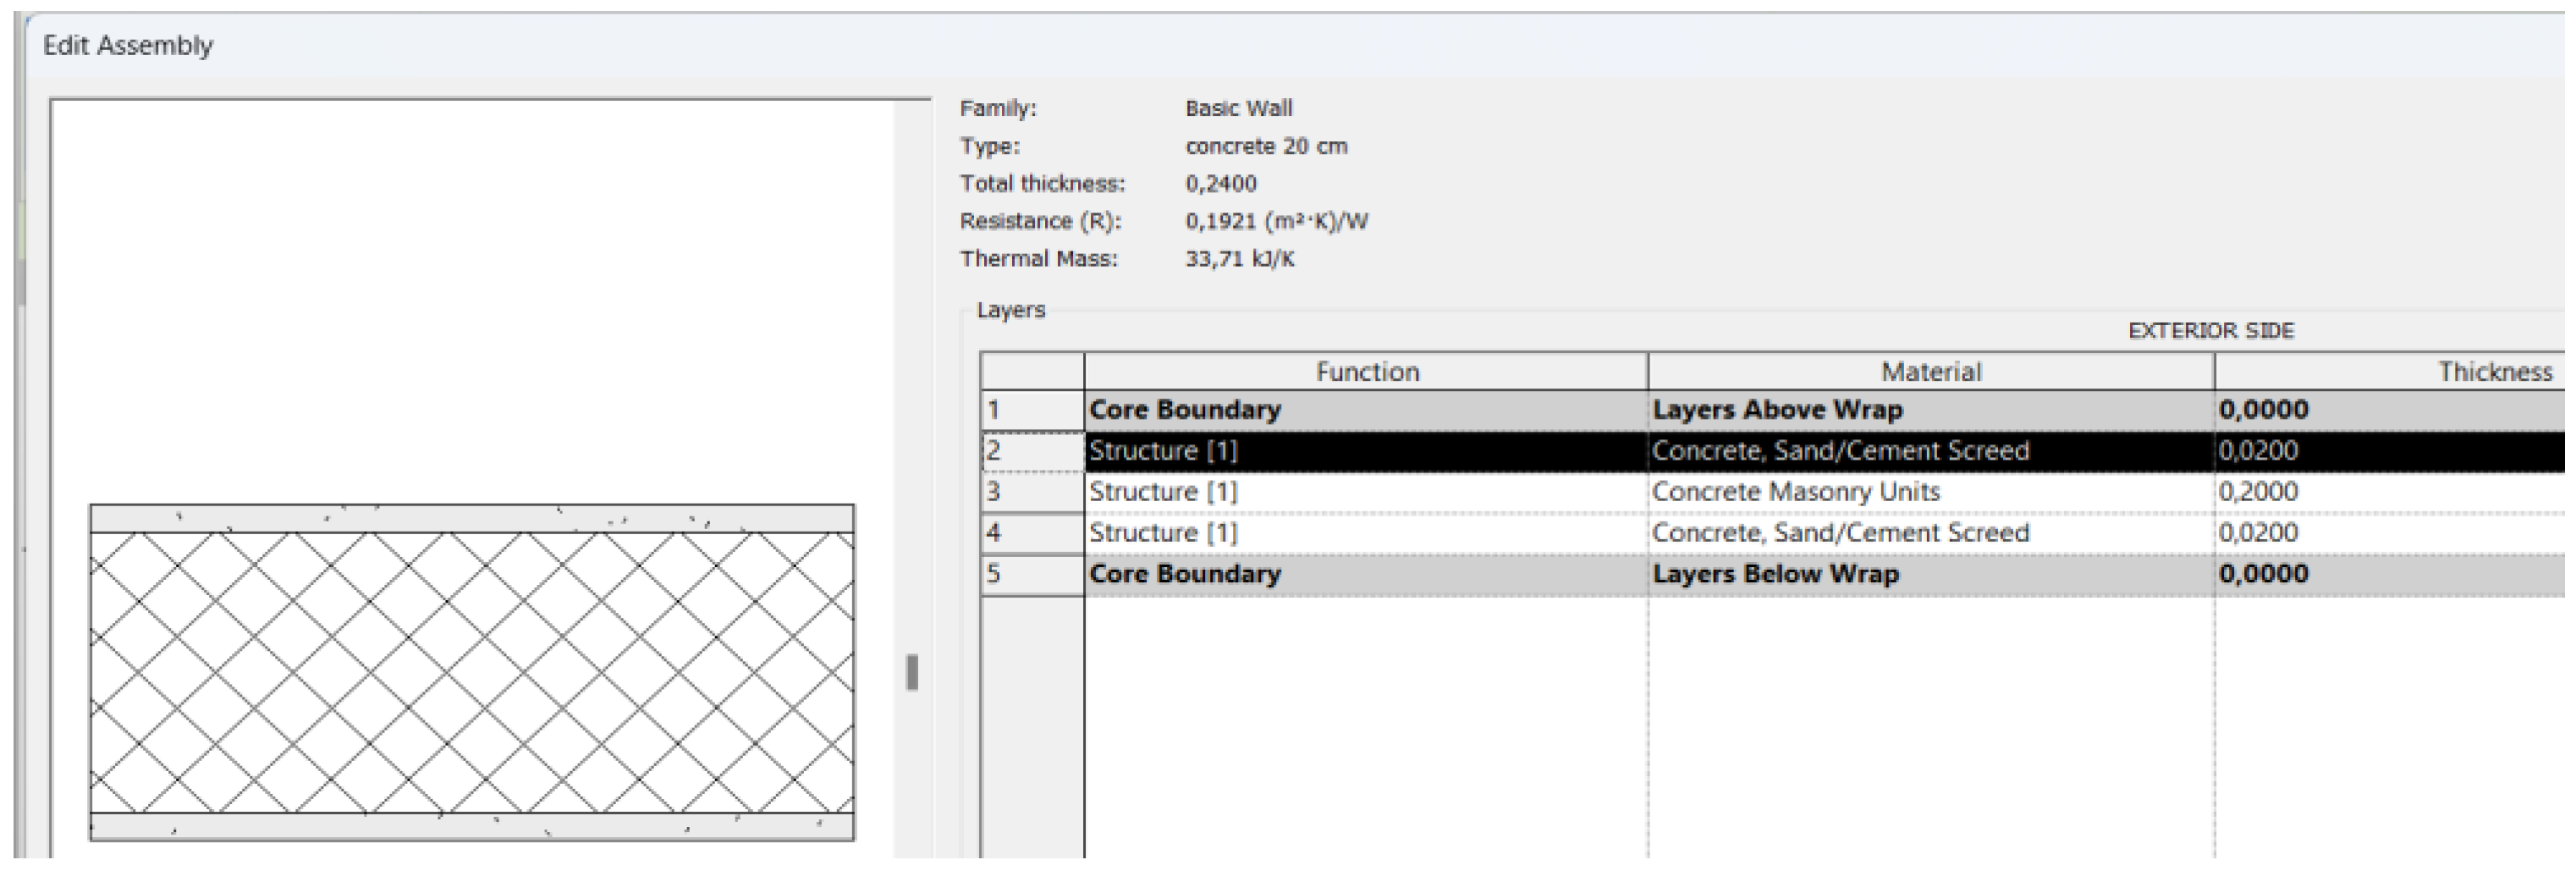
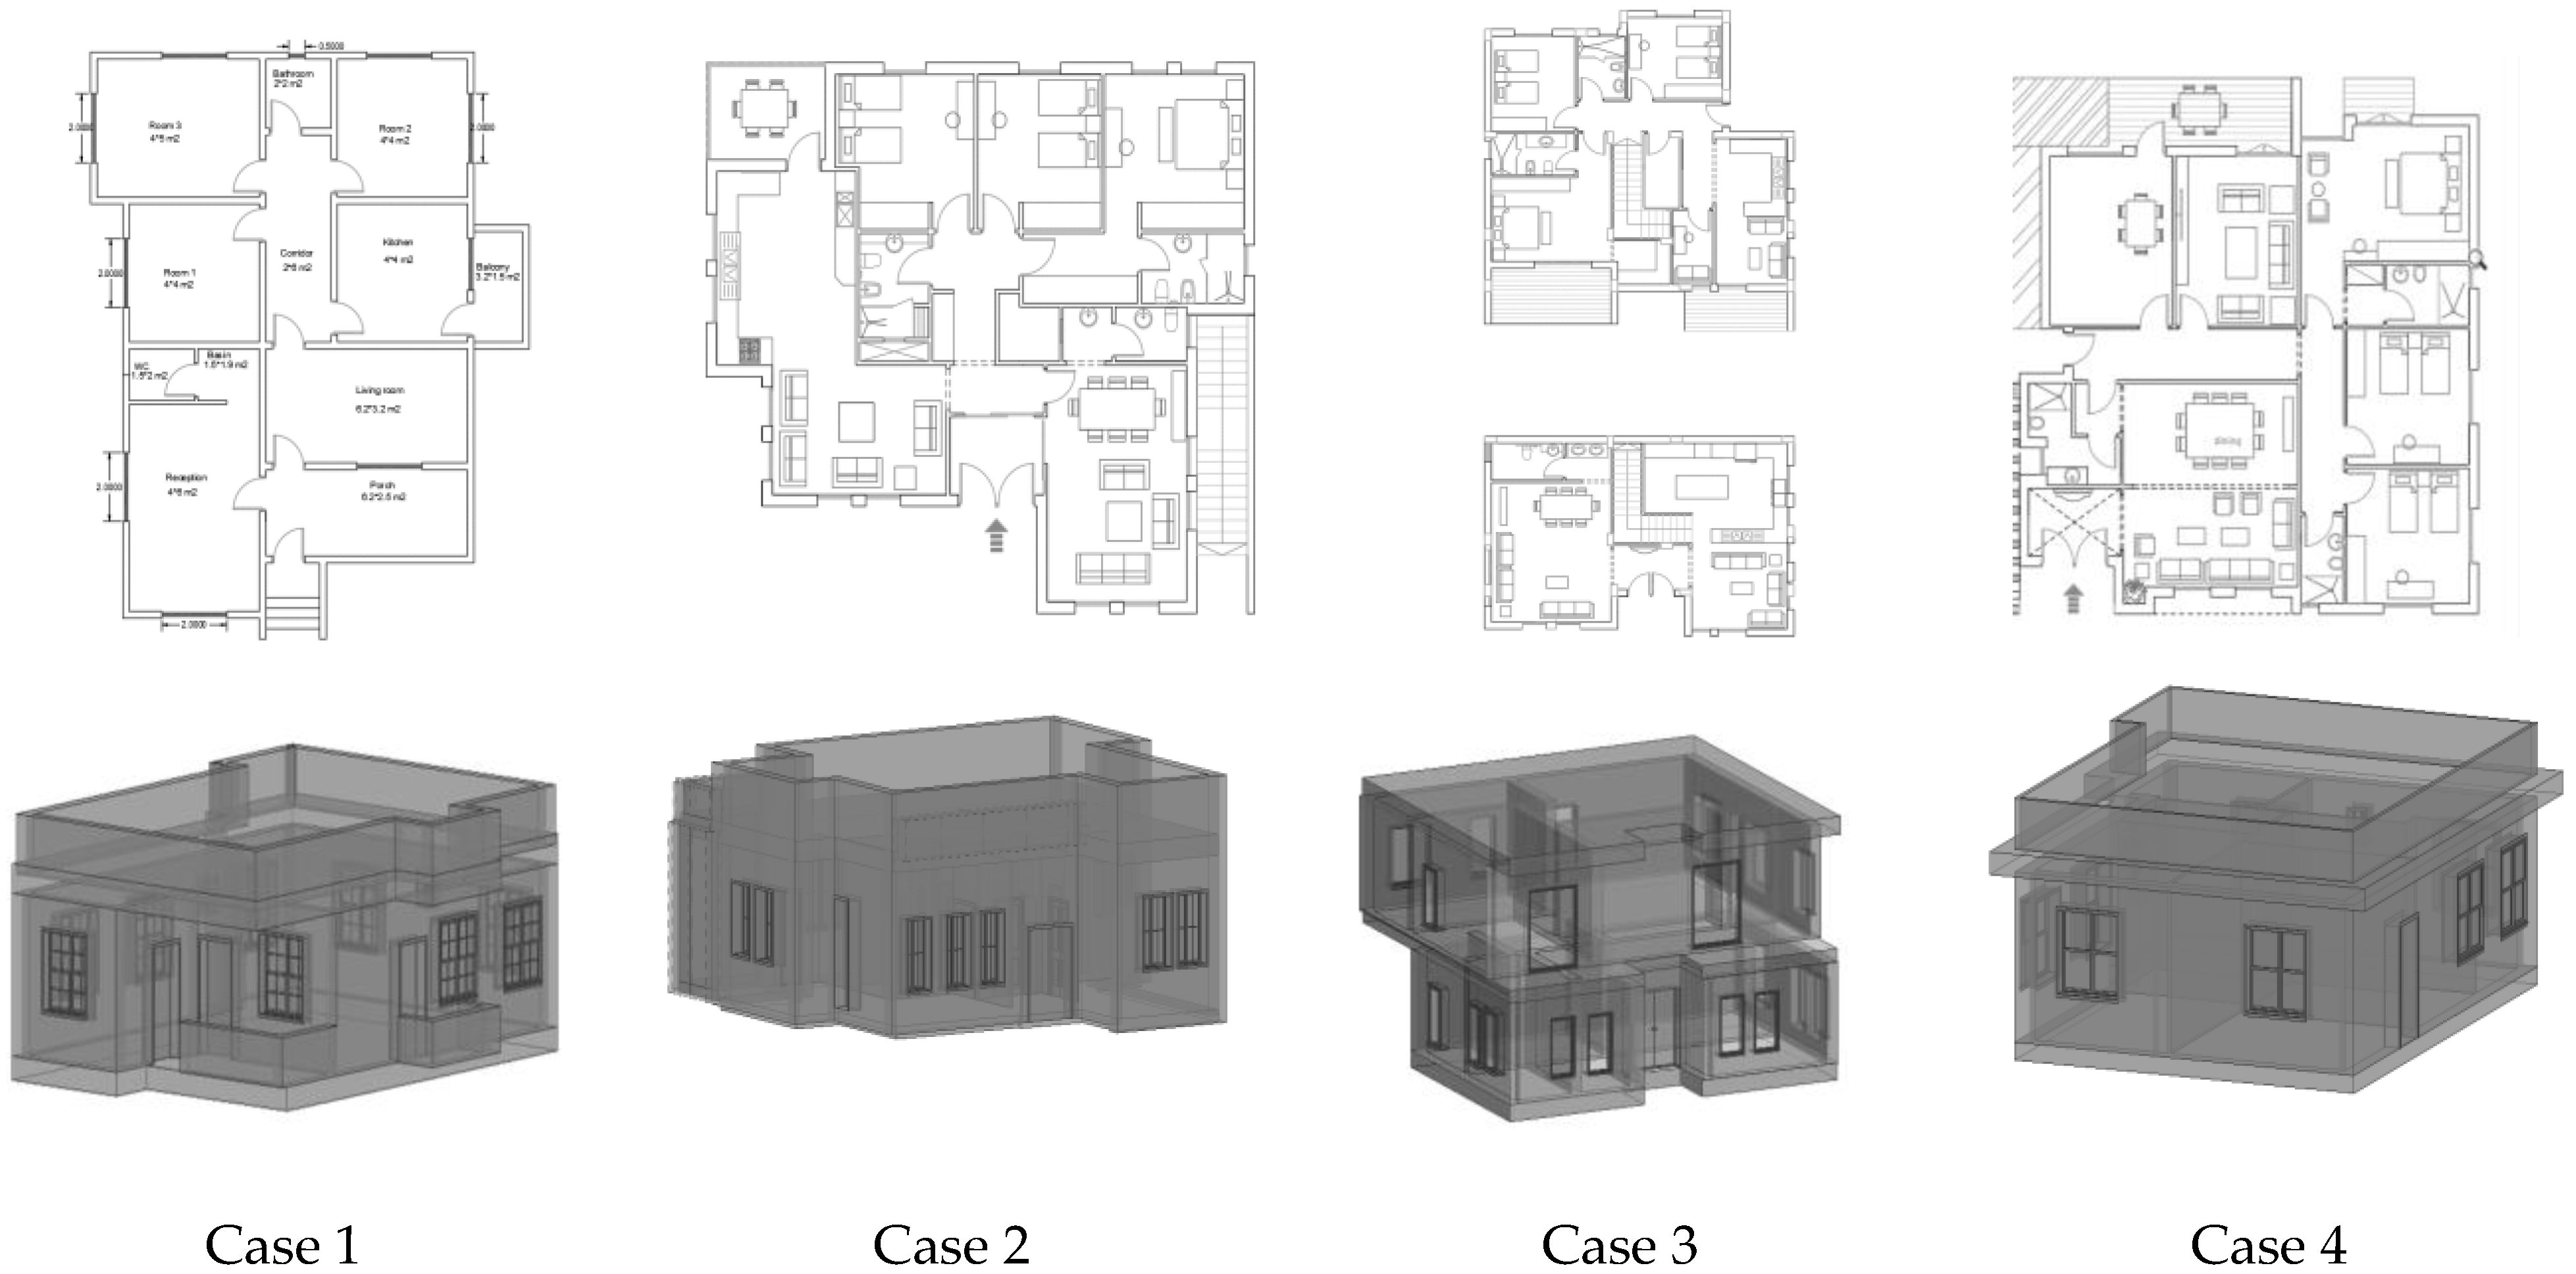
Based on the above information, four representative low-rise residential buildings that are typically built by the vast majority of the locals in the study region were selected and modeled by the authors. The design of the selected dwellings usually starts with an entrance that leads to the reception and living room, and then to a corridor that leads to the bedrooms. Moreover, the number of external doors is usually two, one of them near the kitchen balcony in addition to the main entrance. Figure 3 shows the four energy models of the representative buildings, where the architectural plans were used to create the reference models via building information modeling technology. It is also noteworthy that Case 1 as can be seen in Appendix A represents a typically built house that is made of hollow concrete walls with a thickness of 20 cm and with 2 cm plaster on each side, in addition to clear single-glazed aluminum windows and doors of steel. Moreover, Case 3 represents the rarest case that meets the Jordanian energy code, with 5 cm of local stone, 7 cm of normal concrete, 5 cm of extruded polystyrene, 15 cm hollow concrete blocks, and 2 cm of plaster on each side. More details are provided in Table 3, Table 4, Table 5, Table 6 and Table 7.

2.3. The Climate of Jordan and Petra

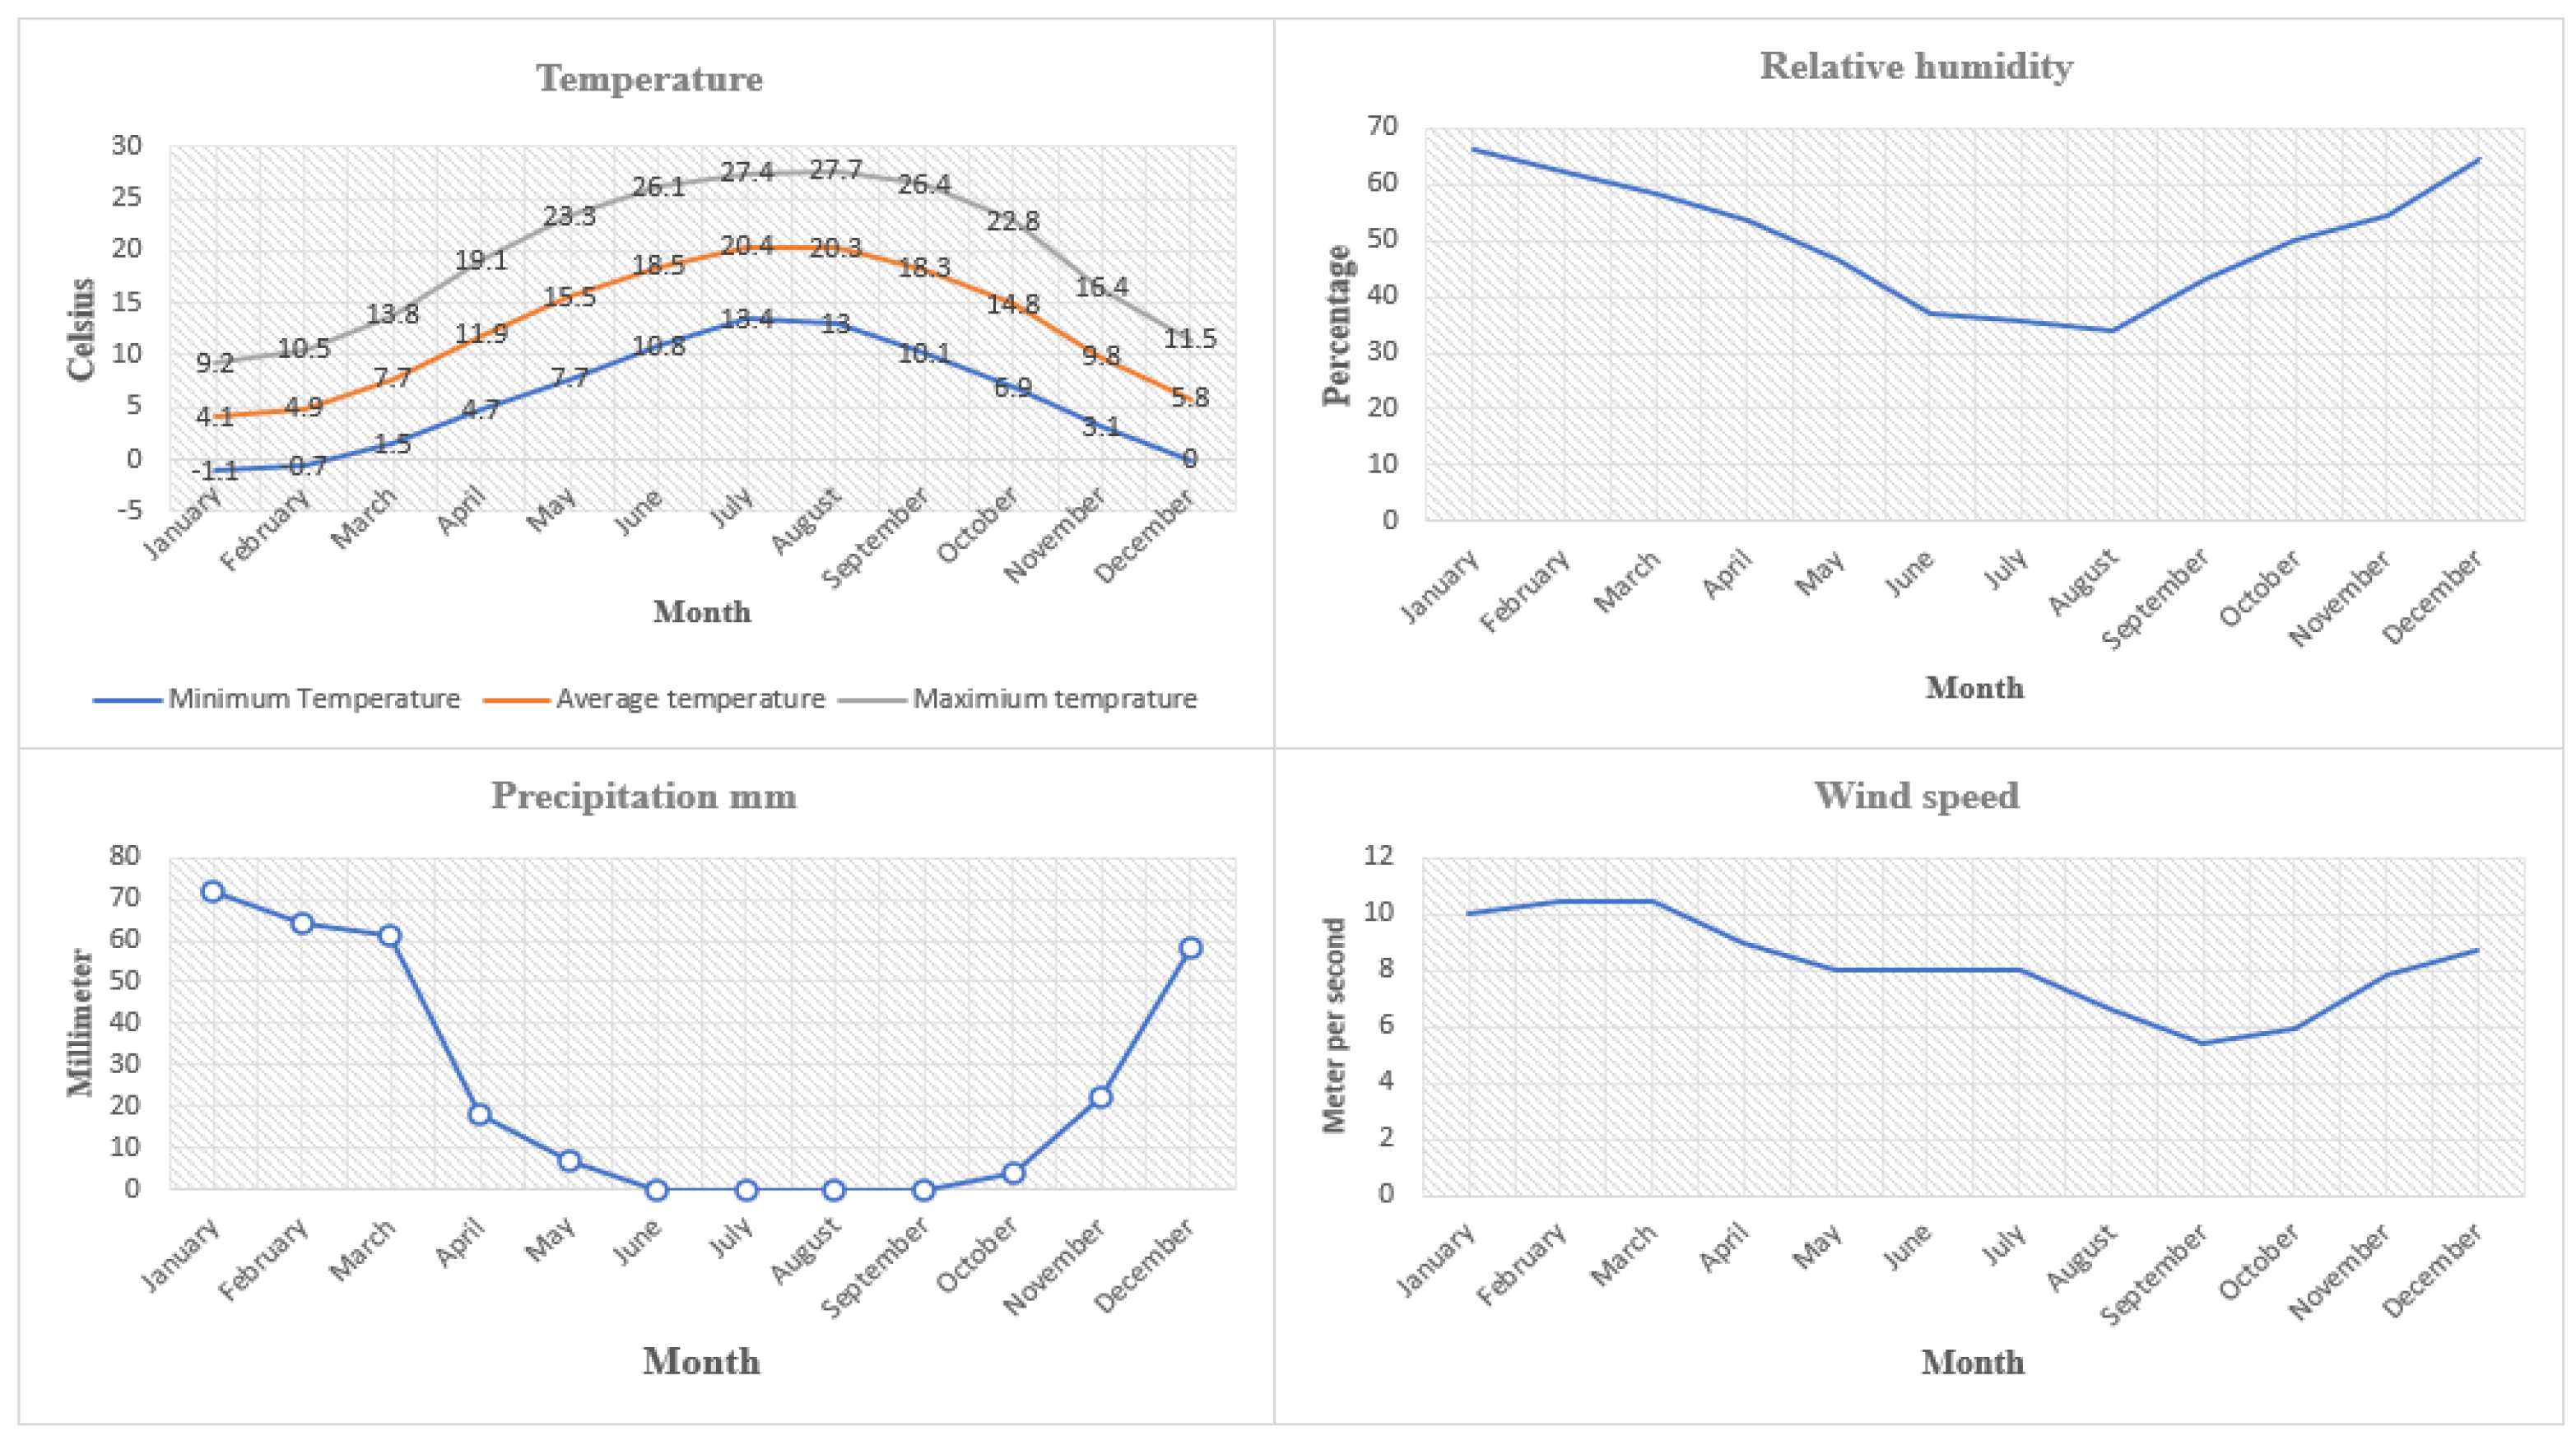
The best weather file is not always the nearest weather file. The microclimate is influenced by mountains, canyons, bodies of water, and urbanization, and it is also critical to understand the location’s usual weather, rather than the severe weather days that may be utilized to size equipment [50]. We reviewed the available weather information to determine whether the weather file was appropriately representative of the actual site conditions. Nonetheless, Jordan’s climate varies from more Mediterranean to hot–dry; the country is normally extremely dry. Winter temperatures in the southern and northern highlands range from 4 to 13 °C, while temperatures in the desert range from 19 to 22 °C. In the Jordan Valley, summer temperatures vary between 38 and 39 °C, whereas desert temperatures range between 26 and 29 °C, and nearly 75% of precipitation falls during the winter. The dry Sirocco winds impact Jordan’s climate, which can result in high temperatures; the winds blow from the north and northeast and cause high daytime temperatures [52]. Petra is situated at an elevation of 1365 m above sea level; its minimum temperature is recorded in January at −1.1 °C, while its highest average temperature is in August at 27.7 °C. The maximum average wind speed is around 11 m/s in March, while the lowest average wind speed is 5 m/s in August. The relative humidity also varies from 33% in August to 68% in January. The average precipitation in winter is 54 mm, while in summer there is almost no rain, as shown in Figure 4, which presents the climate data of Petra, Jordan [53].
The authors found that the climate zone in Petra is (4B) according to ASHRAE Standard 169-2020 (Section A3: climate zone definitions) [54]. The thermal climate zone 0–8 using heating and cooling degree days for the location was determined first, and then the moisture zone (marine, dry, or humid) was assigned as the monthly average of the available temperature and precipitation data. Additionally, the following data were used to determine the climate zone numbers and letters.
-
Heating degree days (HDD) = 2285 h
-
Cooling degree days (CDD) = 1494 h
-
(CDD 10 °C) = 1494 < 3500, and 2000 < ((HDD 18 °C) = 2285) ≤ 3000
If 30% or less of the precipitation (P) occurs during the high Sun period, then the dry/humid threshold is p < 20 × T (1), where p = annual precipitation in (mm), T = annual mean temperature (°C), and high Sun lasts from April through September in the northern high-Sun hemisphere) [54].

2.4. Boundary Conditions

This study is concerned with how to establish representative reference cases and improve whole-building energy consumption in residential buildings in a mild–dry climate. Thus, the observed findings may not be applicable to all other climate zones or buildings. More importantly, five building energy systems were considered in this study: building envelope, HVAC, daylight/lighting, service water heating, and plug load systems. Presently, solar heat gains, visual lighting transmittances, HVAC efficiency (SEER and SCOP) ratios, and thermal conductivities are assumed to be variables. Nonetheless, since the residential buildings in the region are existing buildings, and most of their installed lighting and service water heating systems meet the minimum energy standards, the mentioned systems were assigned as constant values that could be studied in future works with a higher level of energy efficiency. Due to the chronic lack of measurements of plug loads in the study area (Petra, Jordan), the plug loads were assumed to be a constant value. Moreover, window-wall ratios (WWRs) were also assumed to be constant, as the selected cases met the standard percentages in the specified climate zone. Finally, building orientation in existing buildings (as in these cases) was assigned as a constant value. Accordingly, only the current orientations of the reference buildings were included.

2.5. Simulation and Validation

The simulation engine for the analysis of energy consumption in buildings (EnergyPlus 22.2.0 plugin to Revit 2023) was used in this work to simulate results that mimic the actual buildings, based on the collected information from surveys and measurements. The simulation engine offers calculation algorithms for the modeled building components; it also has jurisdictional approval and the ability to explicitly simulate all of the following: 8760 h per year, occupancy changes on an hourly basis, lighting power, miscellaneous equipment power, thermostat set points, HVAC system operation, thermal mass effects, 10 or more thermal zones, part-load performance curves for mechanical equipment, capacity, and efficiency correction curves for mechanical heating and cooling equipment, as required by the ANSI/ASHRAE/IES Standard 90.1-2016 [55,56]. The engine also can perform the simulation using hourly values of climatic data, such as temperature and humidity from representative climatic data, for the city in which the proposed design is located. Afterward, the generated models of the real buildings were validated using manual calibration. A similar approach was used in previous works [29,32,36,57,58].

Validation and Calibration

The process of the validation was divided into two parts: hourly building energy modeling calibration, and annual calibration. By using hourly calibration, the authors compared the average measurements for air temperature for one week in July 2022 in the living rooms of reference buildings 1–4 with the simulated indoor air temperatures. The living rooms were unconditioned spaces, because the vast majority of the existing buildings in the region use only one conditioned bedroom, including the reference buildings (see Section 2.1.2). A similar approach and monitoring time were used in previous works [32,59].
Manual calibration was performed according to ASHRAE Standard 14 for the calibration of the building simulation model. We also considered two statistical indices: the normalized mean bias error (NMBE), and the coefficient of variation (CV) of the root-mean-square error (RMSE). The NMBE was used to compute the discrepancies between values anticipated by the models and the actual data, while the CV(RMSE) was used to assess the margin of error for the outcomes and whether the model could perform like the actual buildings [33,52] The NMBE and CV(RMSE) were computed using the following two equations:
NMBE = i = 1 Np . Mi Si i = 1 Np . Mi   ( % )
CV RMSE = 1 M i = 1 Np . Mi Si 2 Np 2   ( % )
where Mi and Si are the observed and simulated data at a certain point in time, respectively, while Np and i are the total numbers of data values that were utilized in the computations. According to ASHRAE Standard 14, the simulation models are deemed to be calibrated if hourly readings do not surpass 10% and 30% and monthly values do not exceed 5% and 15% for NMBE and CV(RMSE), respectively.
The approach of comparing the annual results of the simulated representative reference cases against actual collected data to validate the energy simulation models is preferred by numerous members of the construction sector when a building’s actual yearly energy end-use is compared to that simulated by a whole-building energy simulation engine, with no intention to remove the sources of the disparity [60]. In this work, two scenarios were considered: firstly, the average surveyed EUI against the simulated EUI for the reference buildings, and secondly, the average billed EUI for the reference buildings against the simulated EUI for the reference buildings. The annual calibration was inspired by Tahmasebinia, F [36].

2.6. The National and International Building Energy Standards

Jordan’s energy efficiency code was created in response to current energy issues. The standard was meant to make use of several local, regional, and worldwide resources. It combines architectural factors, mechanical aspects, and electrical systems, which were integrated into Jordan’s energy-efficient building code [18]. The ASHRAE standards and guidelines are designed to aid the industry and the wider public by providing a standardized way of testing for rating purposes, as well as other information that may help steer the industry. ASHRAE Standard 90.2 2018 offers a new leading standard that strives to achieve at least 50% energy reduction in low-rise residential buildings in comparison to the energy efficiency requirements defined by the International Energy Conservation Code 2006 [25,61]. The intention of the ASHRAE Standard is to provide a reliable, resilient, performance-based tool that allows users to be innovative in meeting performance targets. However, Table 8 shows the applicable Jordanian and American building energy measures that could assist in reducing energy consumption in mild–dry climate zones [18,25].

3. Results

3.1. Energy Simulation Models’ Validation

The simulation models were calibrated using the measured air temperatures. Parameters including infiltration, lighting efficiency, and plug load were modified to calibrate the energy models and check the accuracy of the simulated models. Moreover, the NMBE and CV(RMSE) equations were applied, considering the previously specified permitted boundaries in Section 2.5. Figure 5 compares the average actual and simulated indoor air temperatures across the monitored time for the four buildings. The NMBE of the calibrated models was −1%, and the CV(RMSE) was 2.3%. These variations are less than the suggested acceptable limits stated in ASHRAE Guideline 14. Accordingly, the simulation models were calibrated using hourly data.
The billed and surveyed results of EUI were also used to validate the simulation models for a whole year. The second scenario (i.e., actual billed results) showed high accuracy with less than 4% discrepancy when compared to the simulated results, as shown in Figure 5. In the first scenario, the margin of error was less than 12% in comparison to the simulated results, which was very much expected due to the accuracy of a questionnaire asking ordinary residents to describe their energy usage, energy-related systems, and the conditioned area. However, the variation was less than 15% (the recommended percentage by ASHRAE Guideline 14 for monthly calibration).

3.2. Energy End-Use for the Reference Cases

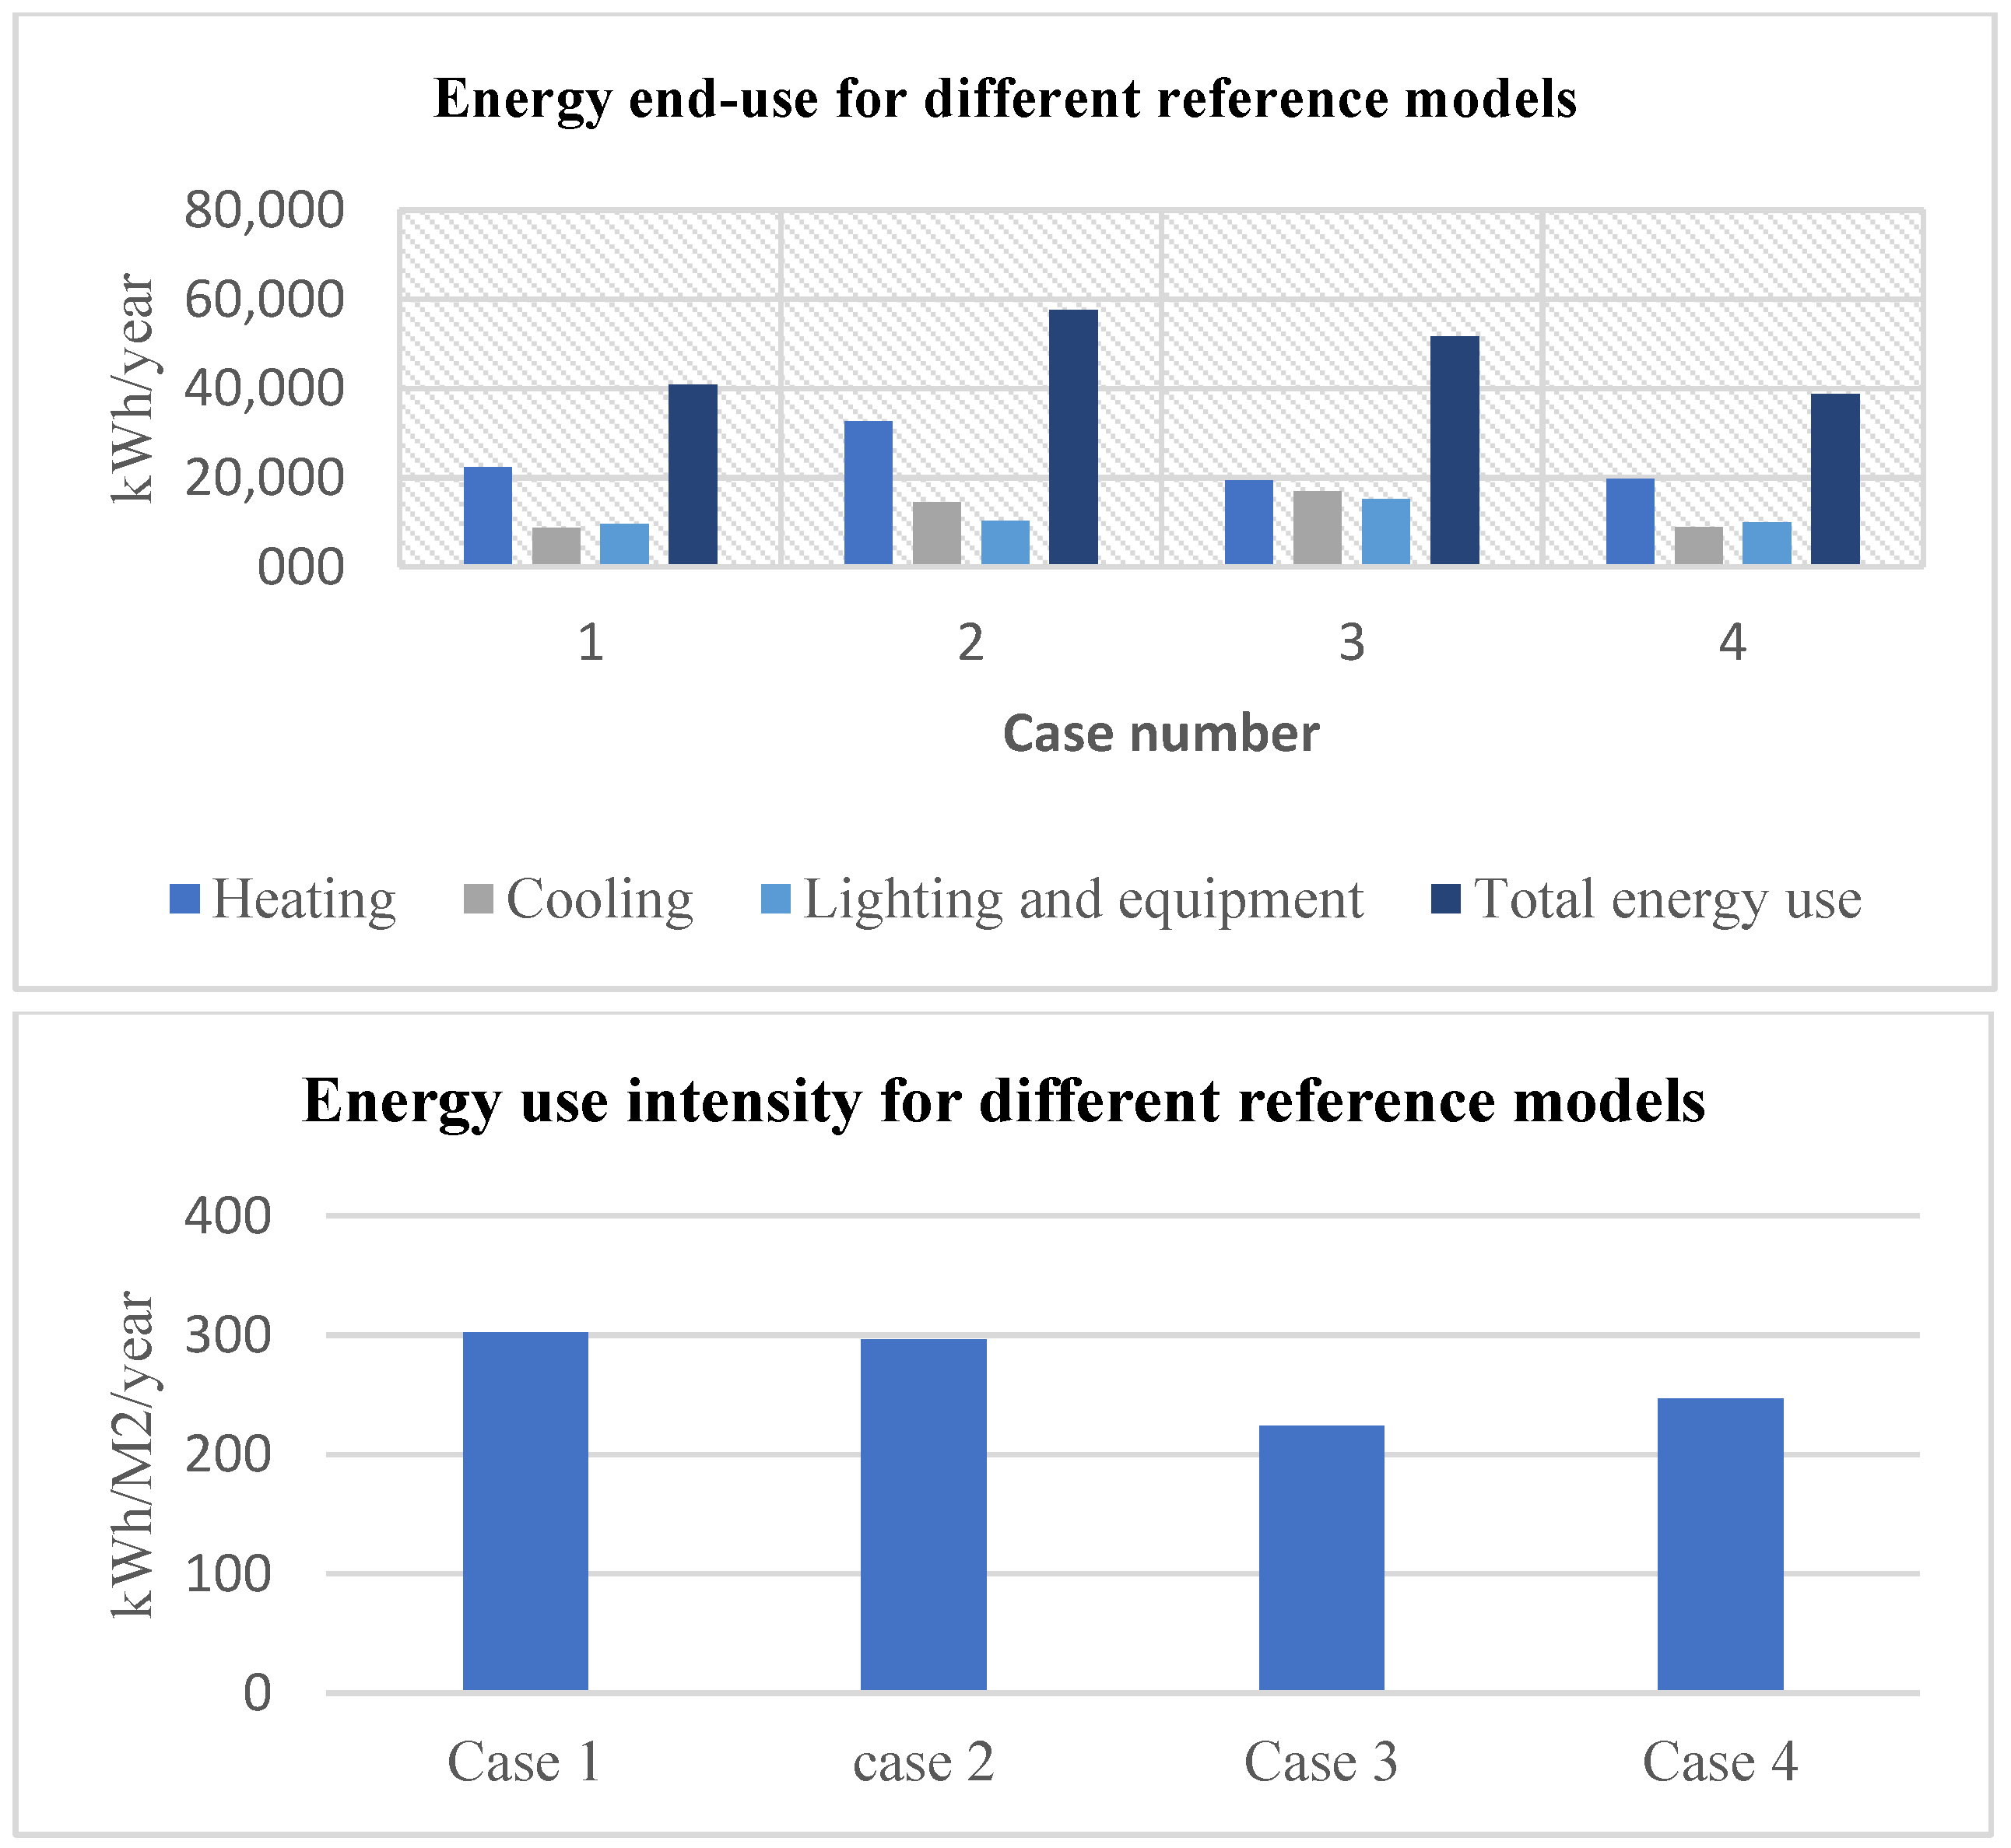
The results of simulated energy consumption and energy-use intensity in the representative reference buildings can be found in Figure 6. Nonetheless, it should be noted that the building envelope components and other energy-related systems meet the Jordanian energy standard in Case 3. Accordingly, the heating load for Case 3 achieved the lowest percentage in comparison to other cases, mainly due to wall insulation and a larger window–wall ratio. The cooling loads also increased by an average of 10% in comparison to the other cases. The total energy usage and energy-use intensities were as follows: (40,799, 57,622, 51,736, and 38,833) kWh/year and (302, 296, 224, and 247) kWh/m2/year; the values are in order from Cases 1 to 4.

3.3. Effects of Applying the Jordanian Building Energy Standard

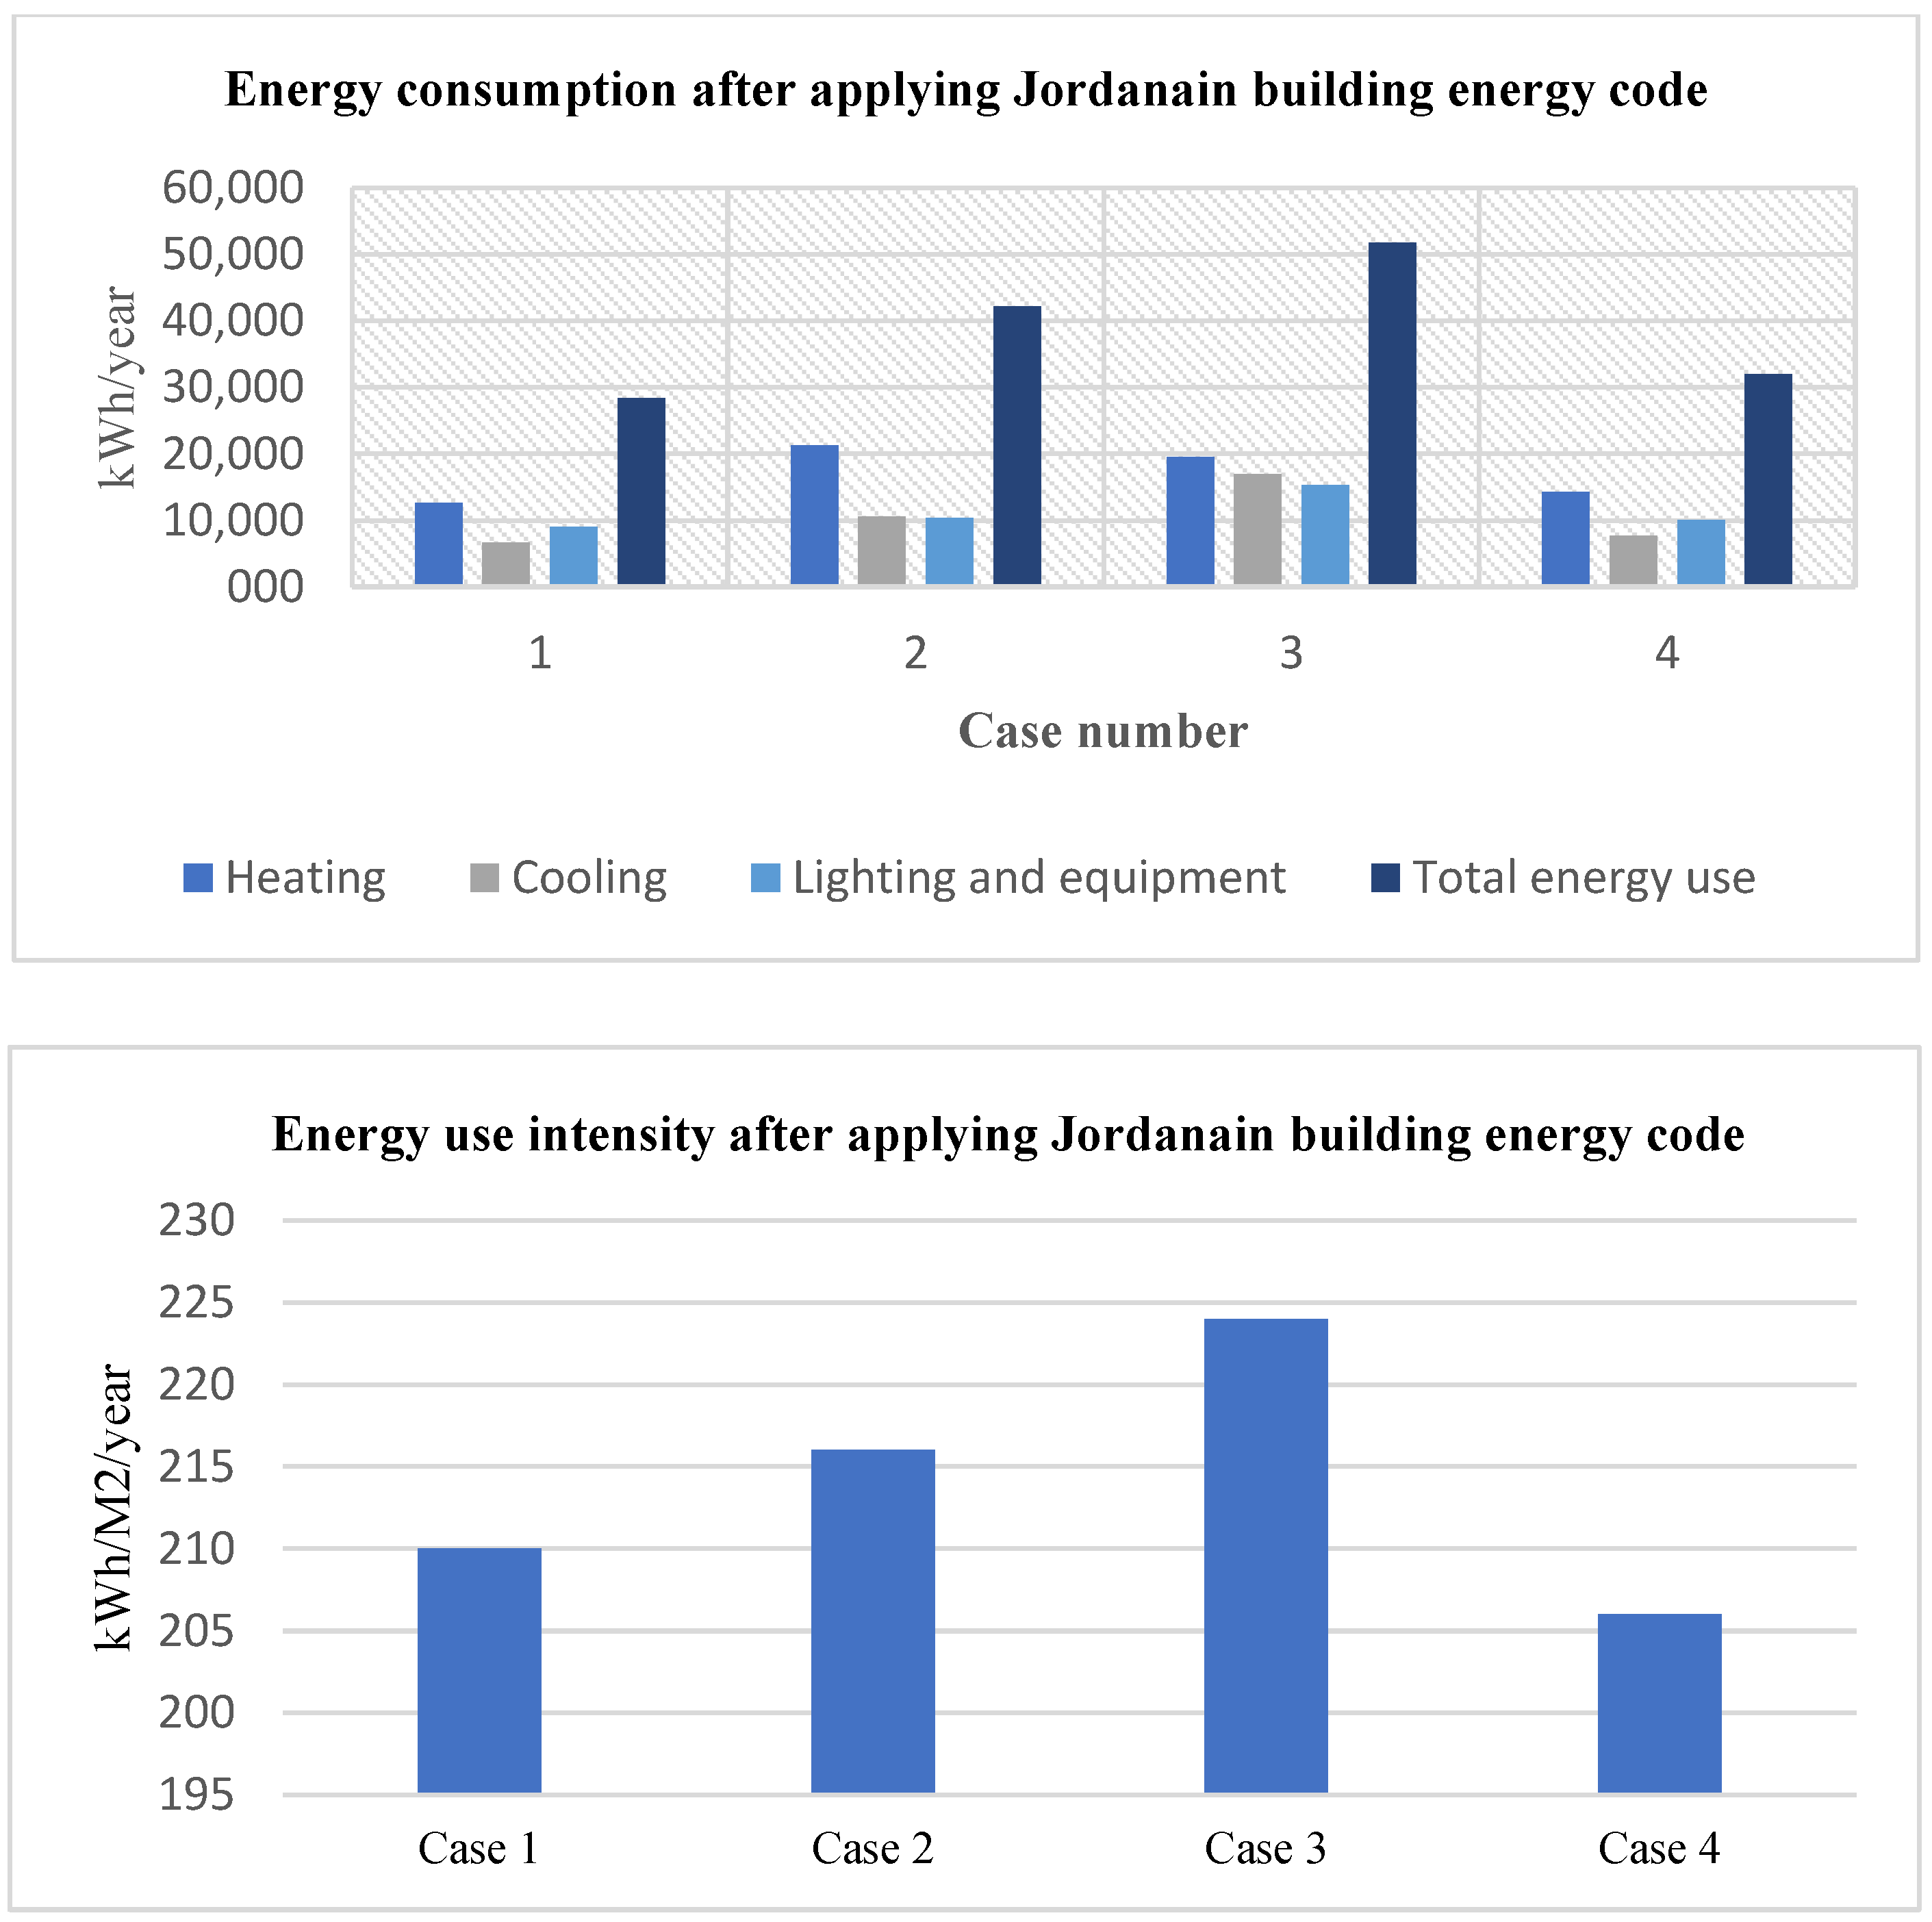
The results of simulated energy end-use and energy-use intensity in the representative reference cases after employing the Jordanian building energy code can be found in Figure 7. Nonetheless, it should be noted that the overall energy consumption in the selected models improved by 30%, 27%, 0%, and 18%, respectively.

3.4. Effects of Applying ASHRAE Standard 90.2

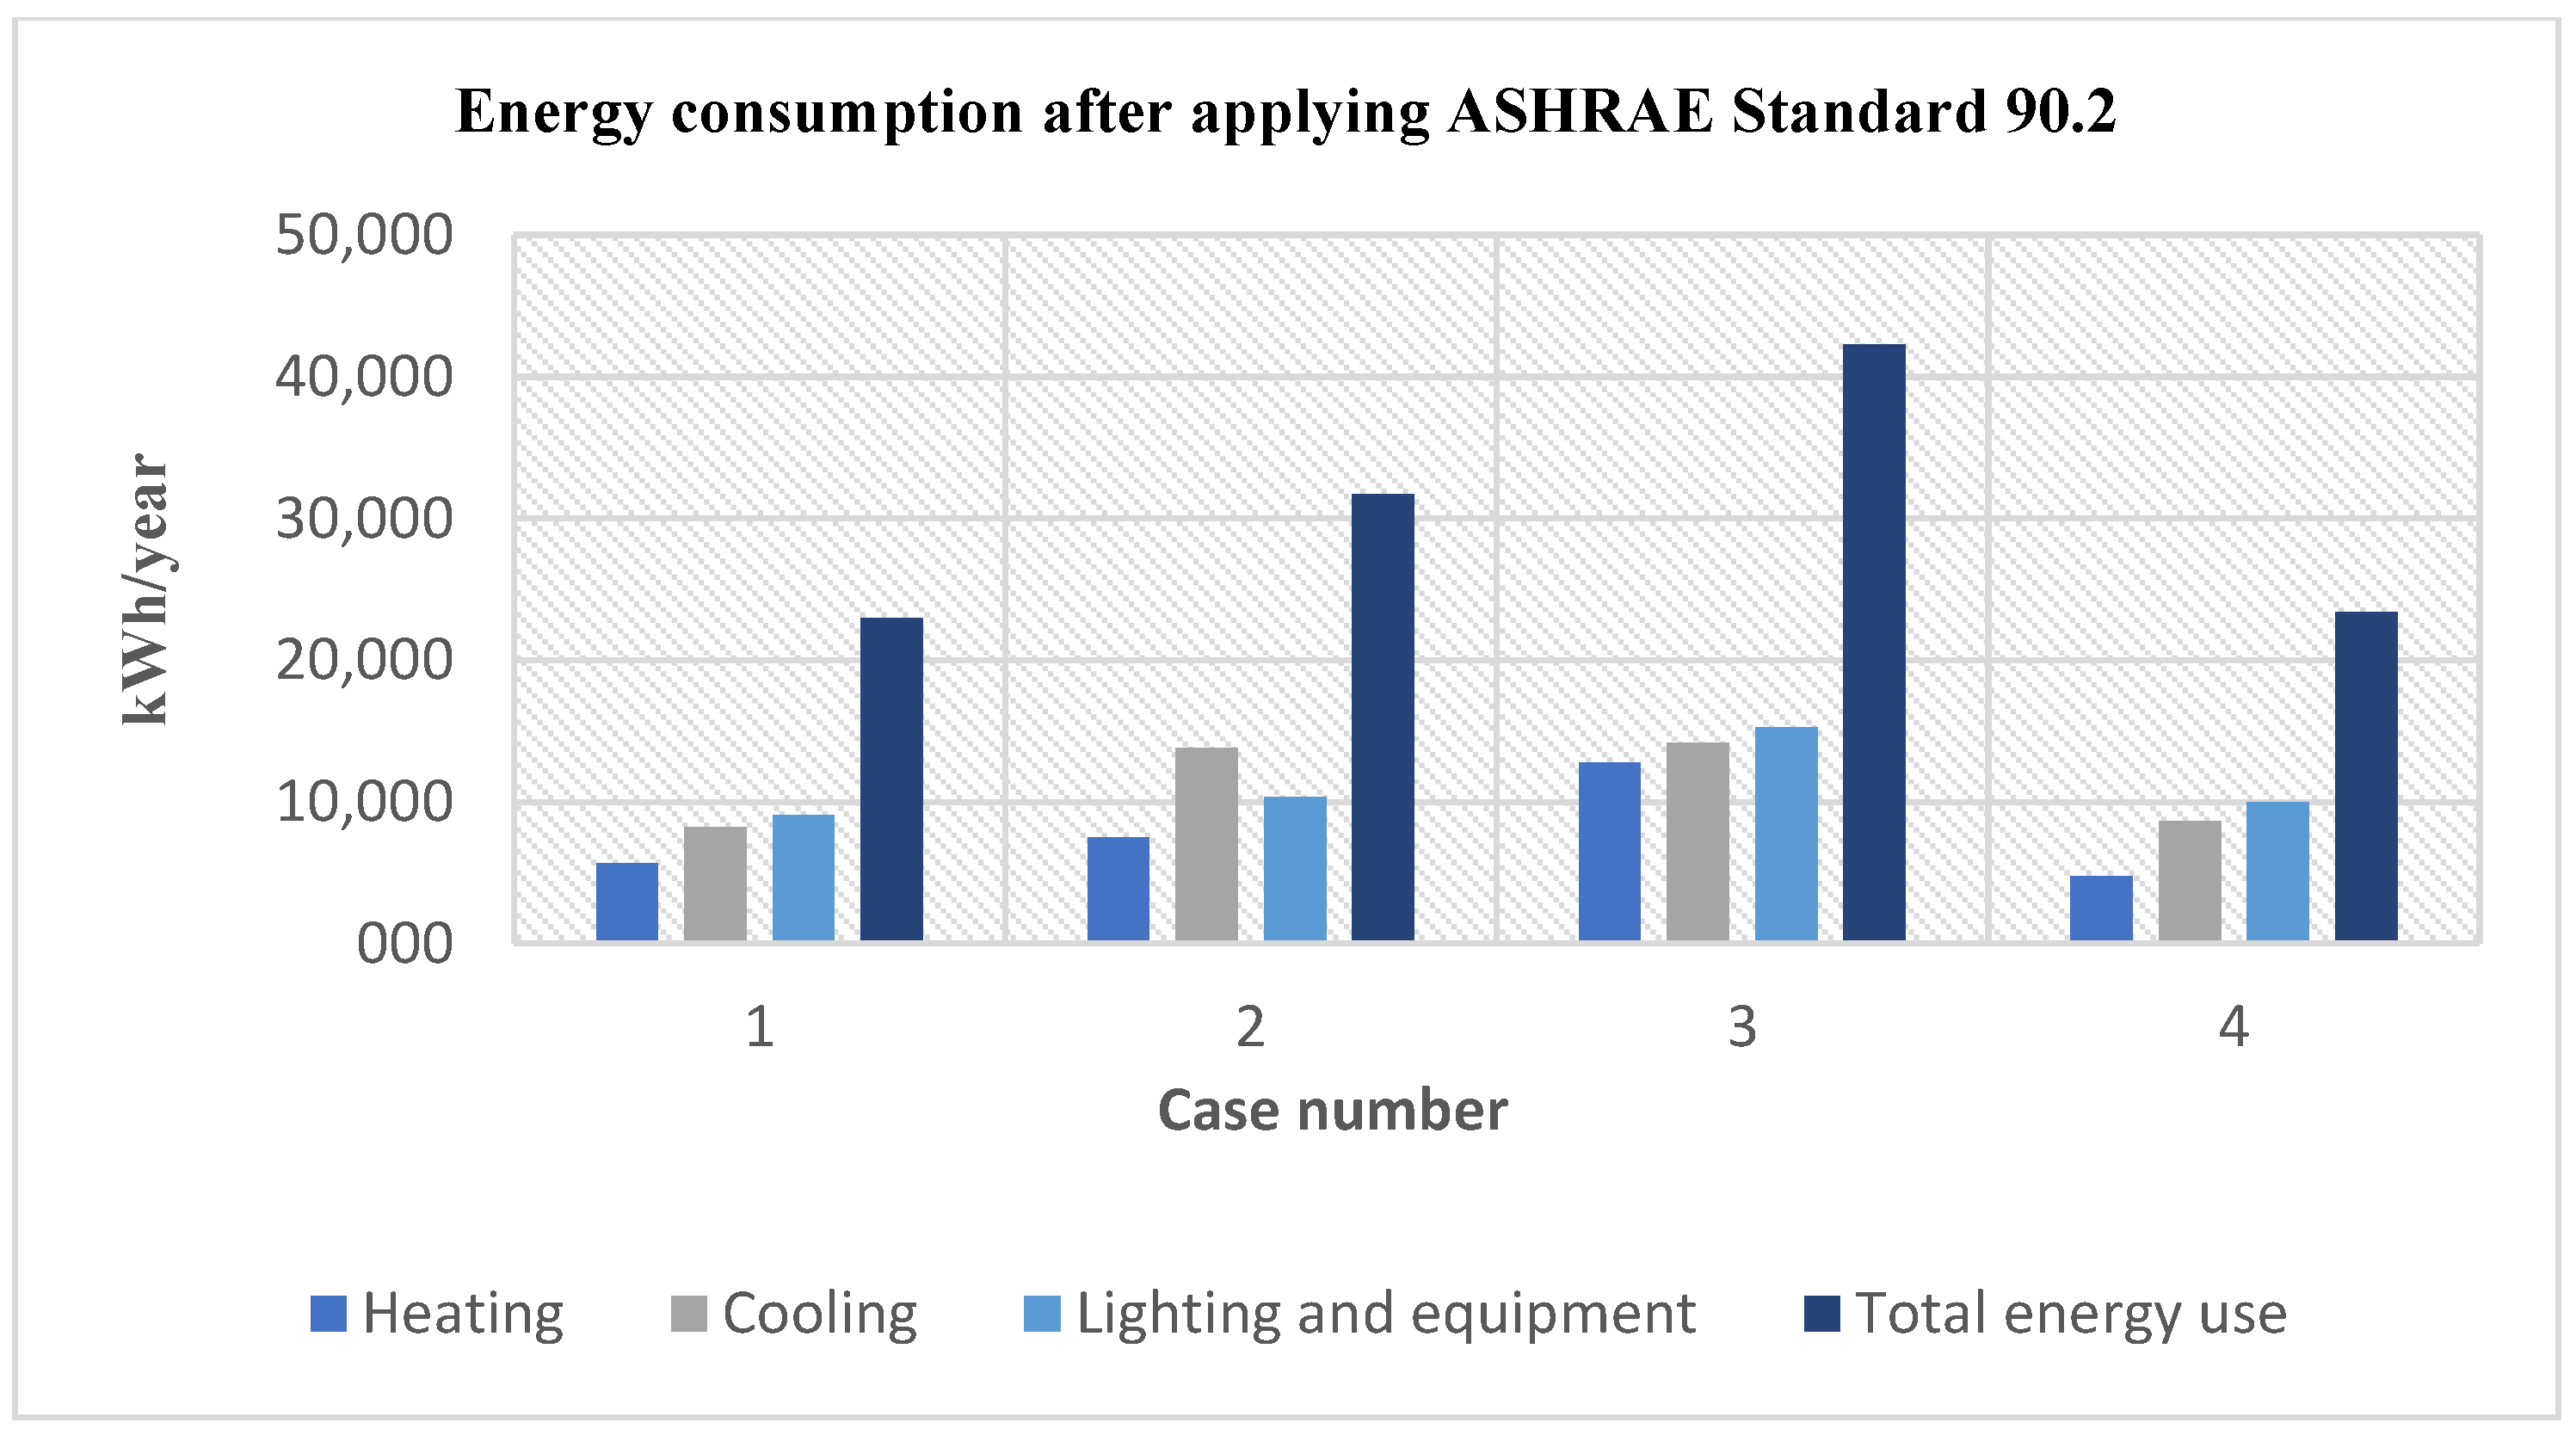
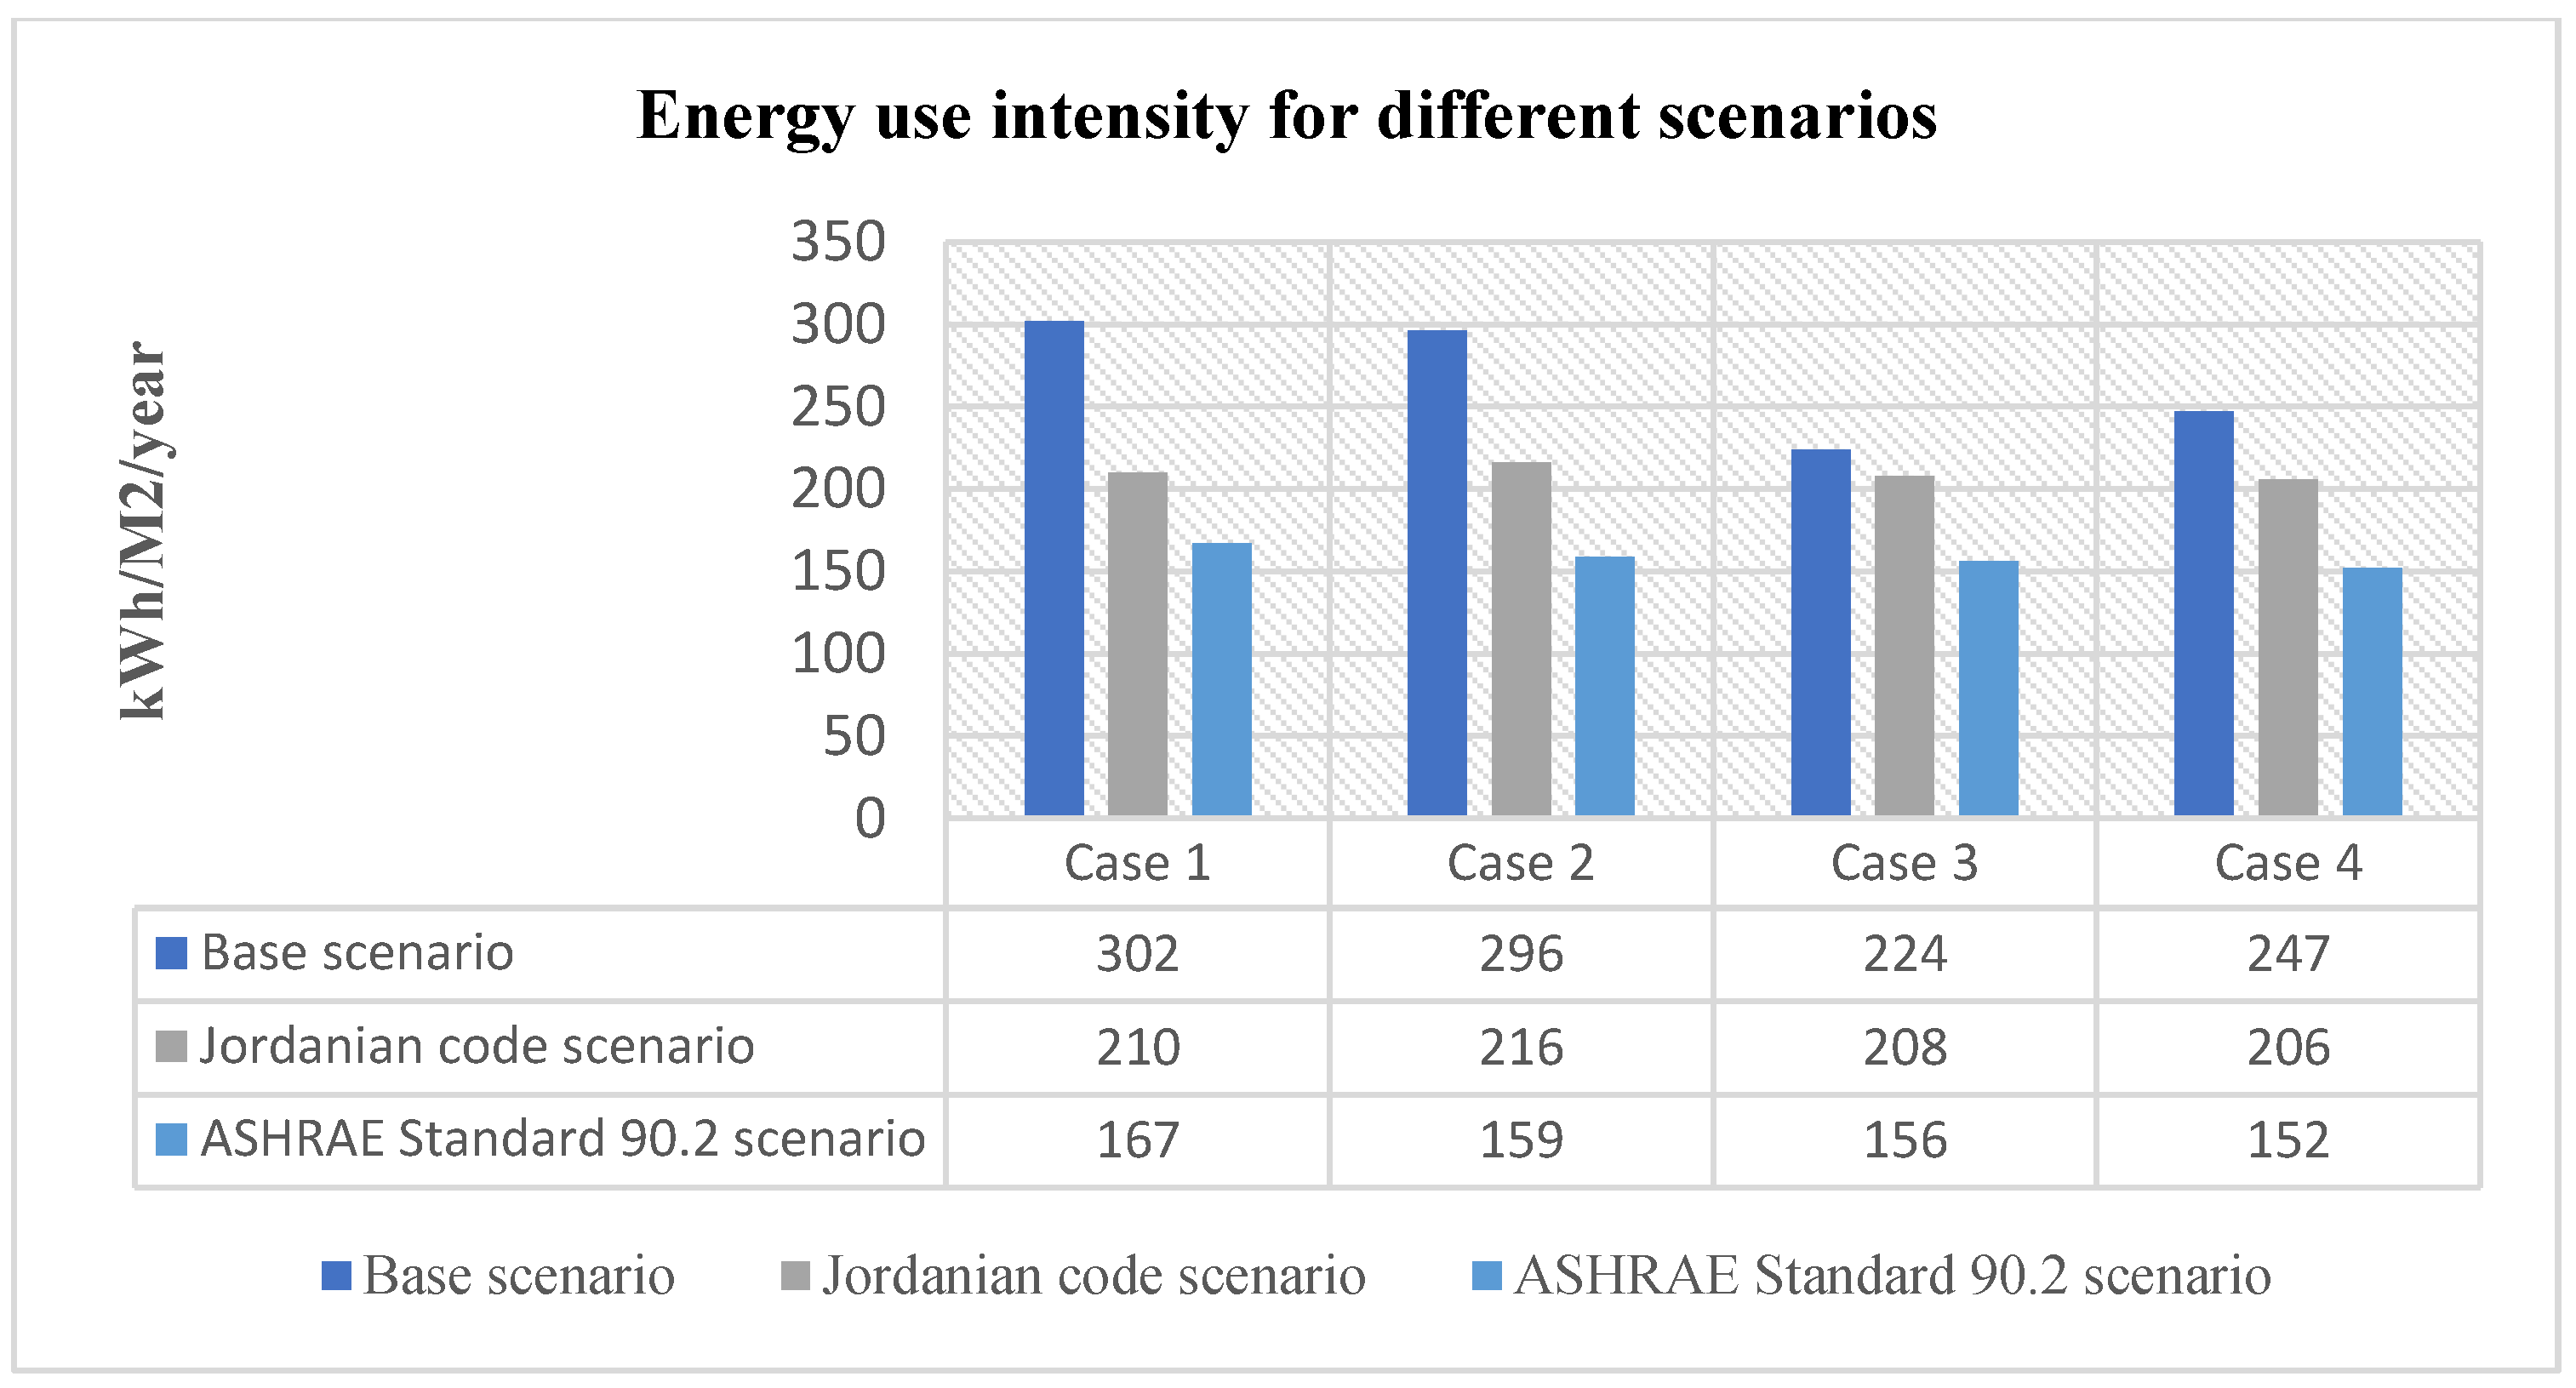
The results of simulated energy consumption and energy-use intensity for all scenarios in the representative reference cases after employing ASHRAE Standard 90.2.2018 can be found in Figure 8. This figure presents the annual total energy consumption in the reference models after applying the regulations of the American building energy code in low-rise residential buildings. Nevertheless, it should be noted that the total energy consumption of the models improved by 45%, 46%, 18%, and 43%, respectively and that Case 3 already met the Jordanian energy code.

3.5. Average Energy-Use Intensity in Modeled and Worldwide Reported Cases

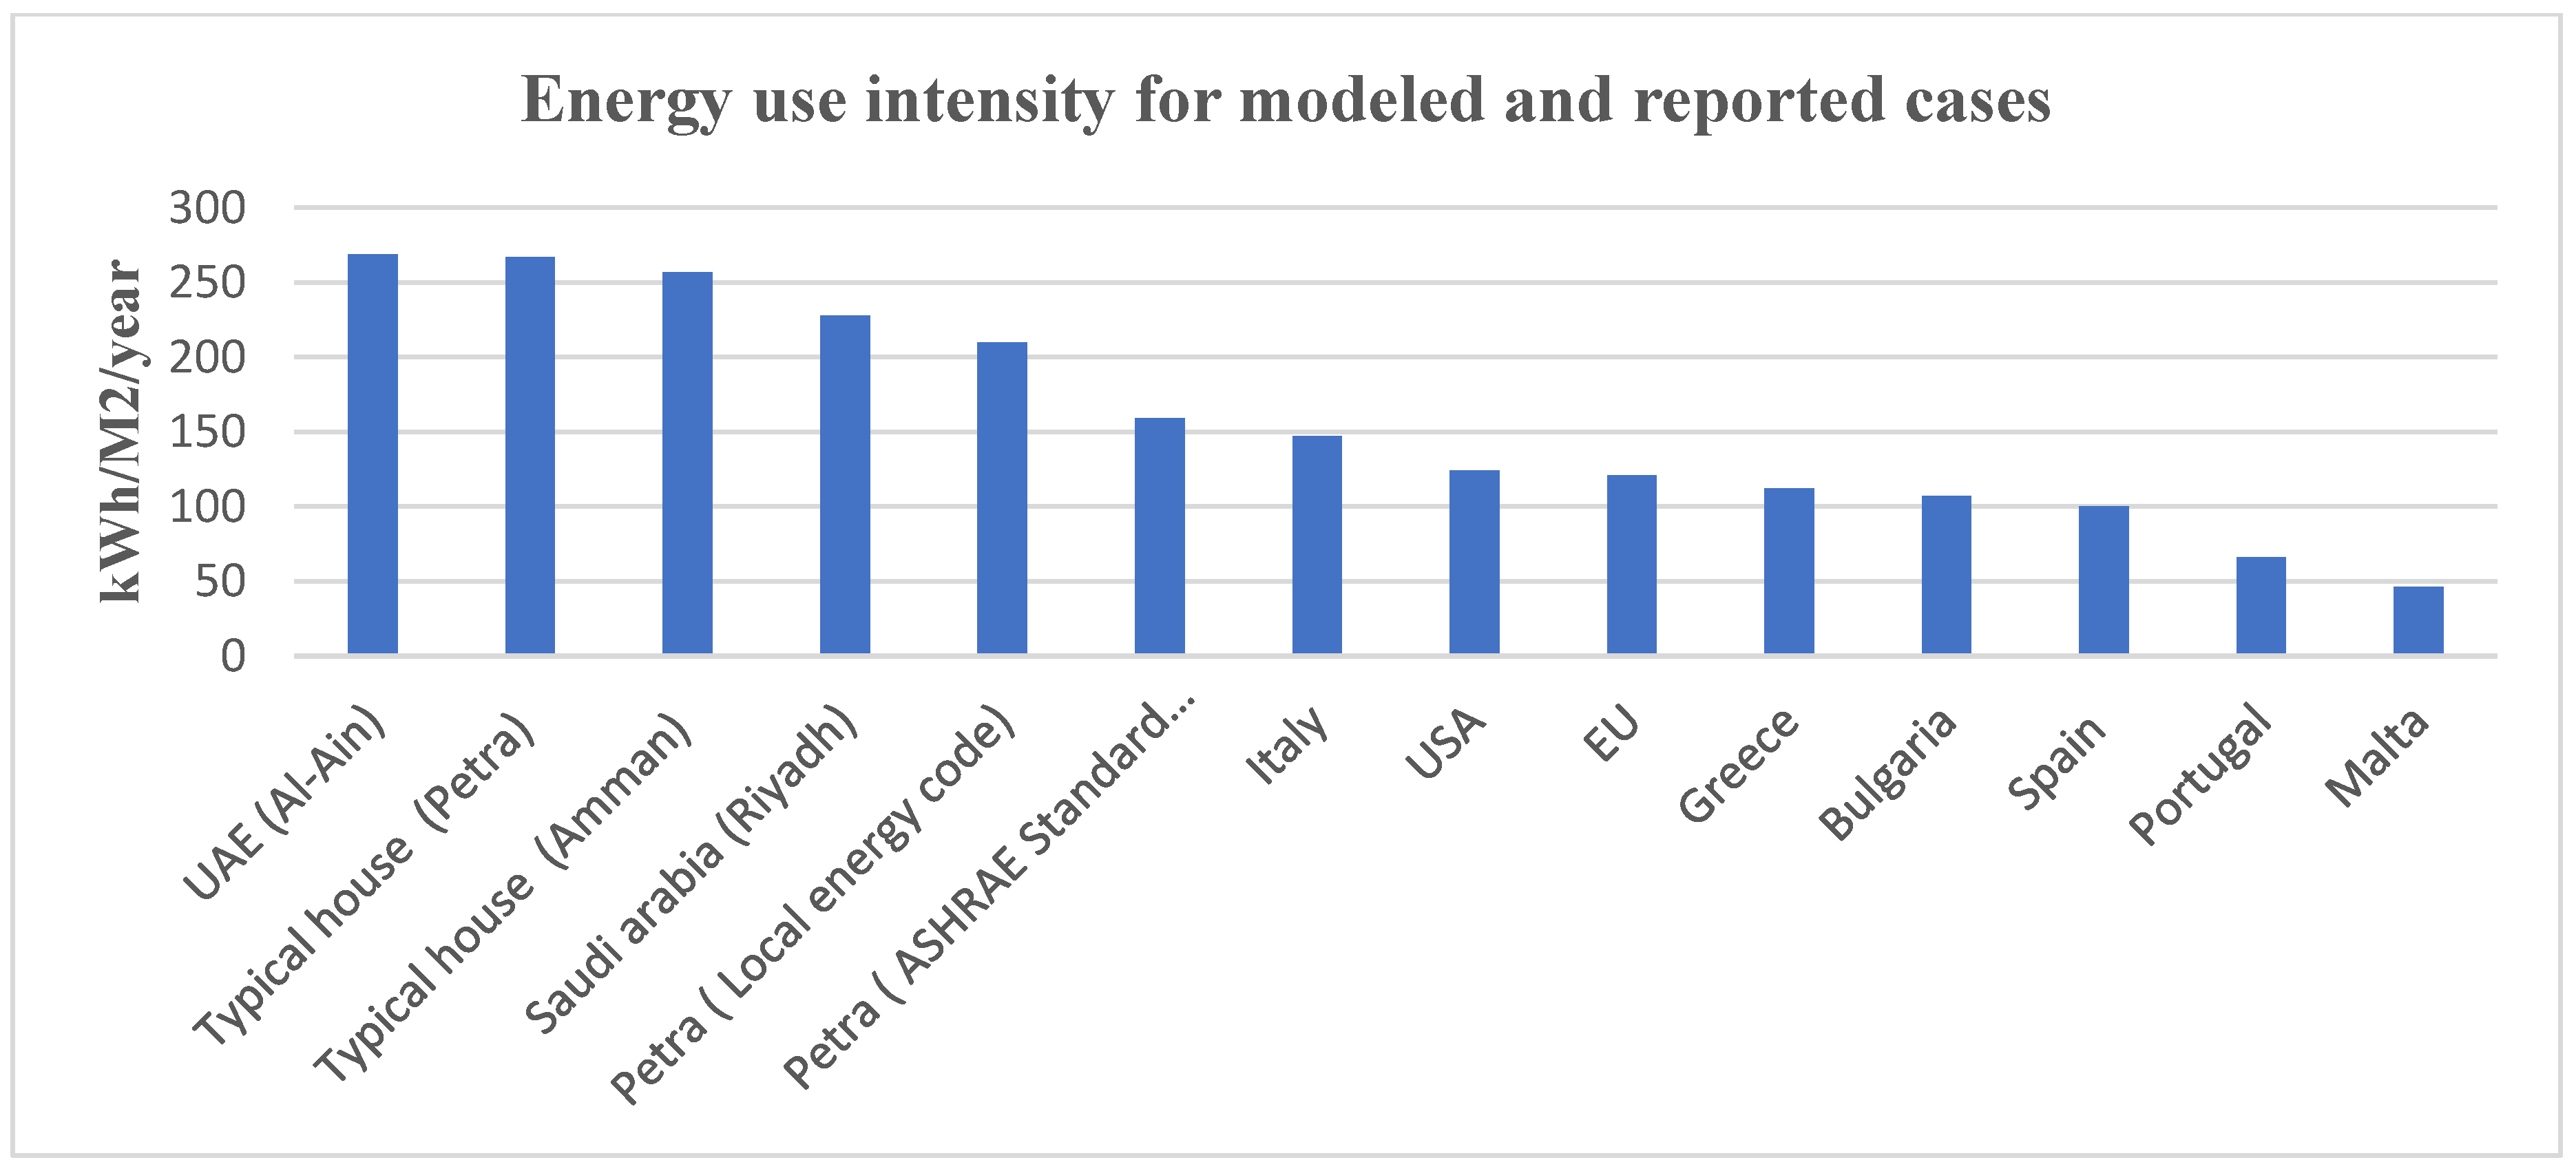
EUI is a very valuable metric for establishing benchmarks and targets for energy use. The EUI often fluctuates greatly depending on the energy simulation tool, climate, and building footprint [27]. Figure 9 shows a comparison of EUI in different countries, where the average energy consumption per meter square was recorded as low as 46 kWh/m2 in Malta and as high as 267 kWh/m2 in the selected models of Petra, which scored the highest energy consumption per square meter after the UAE (Al-Ain) case. However, the United States (US) and European Union (EU) were almost identical, at 124 and 121 kWh/m2, as shown in (Figure 9) below [38,62,63,64].

4. Discussion

The results of this study are divided into three parts: main findings and recommendations, strengths and limitations, and research implications and future work.

4.1. Main Findings and Recommendations

The main findings of this study, which are listed below, show the selection of case studies that represent most of the existing residential buildings in the study region; these were chosen by conducting descriptive and field studies, where more than 1012 out of 17,886 households participated in the study. The results of the surveys were used to choose reference buildings that represent as many building characteristics as possible. The focus was placed on building area, building envelope components, and HVAC system characteristics, because most of the lighting systems and other equipment are newly installed (after 2009—the year when the building energy code became compulsory) and meet the energy regulations of the chosen standards.
The paper also revealed the potential of applying national and international energy standards to the reference buildings in a mild–dry climate zone. The reference models were created via building information modeling technology, and then the energy results were simulated by the EnergyPlus engine. The results showed that the reference cases have a very poor energy performance, with an annual energy-use intensity of 302, 296, 224, and 247 kWh/m2/year for Cases 1, 2, 3, and 4, respectively. In all of the representative models, heating loads consumed the highest energy end-use, accounting for 55%, 54%, 41%, and 52% of the total consumed energy in the reference buildings. Moreover, cooling loads consumed 21%, 25%, 33%, and 23%, while lighting and equipment loads accounted for 21%, 21, 26%, 25% of the total consumed energy, respectively. However, according to the above results of the reference buildings, more than 98% of existing residential buildings in Petra, Jordan suffer from poor energy design; as a result, locally and globally applicable energy standards were applied, and strategies were proposed. The proposed strategies focused on applicable solutions, including building envelope components and HVAC systems.
By applying Jordan’s building energy code, we found that the reference buildings’ total energy consumption was greatly decreased in all models except Case 3, which already met the above code. However, the reduction was by 30%, 27%, 0%, and 18% of the total consumed energy respectively. Additionally, heating loads diminished by 44%, 35%, 0%, and 28% and cooling loads diminished by 24%, 0%, 28%, and 15%, respectively, compared to the representative reference buildings with a rough additional cost of 9% (estimated cost calculation was based on) [39].
By applying ASHRAE Standard 90.2, we found that the energy consumption was reduced even further by (45%, 45%, 18%, and 40%), heating (75%, 77%, 34%, and 76%), and cooling (6%, 3%, 16%, and 4%) in comparison to the reference buildings. Moreover, up to 18% improvement in energy efficiency could be achieved by applying ASHRAE Standard 90.2 to Case 3. This case saw no improvement after applying the Jordanian building energy regulations, as it was already in compliance with it. Additionally, the above energy standard improved the energy end-use by 15%, 18%, 18, and 22%, respectively, in comparison with the Jordanian figures, with a rough additional cost of 17% [39]. The subtle fluctuations in energy-use intensity after meeting the aforementioned standards were mainly due to the actual building orientation, window–wall ratio, and building shape. The results were very close to one another, with the highest average variation between the different models being around 4.7%. Last but not least, there were no tangible impacts on the lighting and equipment loads after applying the aforementioned standards.
To emphasize the benefits of the proposed scenarios, we list some recommendations below:
  • The application of Jordan’s building energy regulations improves the total energy consumption by up to 30% in the typical house in the context of Petra, Jordan;
  • The application of the American building energy regulations improves the total energy consumption by up to 45% in the typical house in the context of Petra, Jordan;
  • The application of the American building energy regulations improves the total energy consumption by 18% to 22% in comparison with the Jordanian energy code scenario;
  • In all of the representative reference buildings, heating loads are the prime energy user, accounting for 55%, 54%, 41%, and 52% in Cases 1–4, respectively;
  • The application of both mentioned standards has no significant impact on lighting and equipment loads, as all of the selected representative buildings’ wall–window ratios (12–18%) and their windows’ virtual lighting transmittances (40–60%) are in compliance with the building energy-saving regulations. Other factors, such as operation time and the number of occupants, were assigned as constant values (by building type and building area).
  • Eventually, in order to achieve further energy-efficiency improvement in mild–dry climates, we recommend an in-depth investigation of the application of 30%, 50%, and zero-energy design guides. Moreover, another in-depth investigation is needed for different building types in various climate zones.

4.2. Strengths and Limitations of the Work

The strengths of this study lie in selecting representative reference buildings for a disadvantaged region where energy-related information is rare and reputable published works are non-existent. The established inputs and reference models can be used in future studies to perform accurate energy analysis and multi-objective optimization. Moreover, this work provides guidance for designers and policymakers and allows for the possible upgrading of the local building codes in regions with similar climates. Additionally, this work will pave the road toward higher building energy-saving targets in the region of Petra, Jordan. In this work, most of the energy strategies rely heavily on envelope components and HVAC. Therefore, there must be further investigations of the potential of relying strongly on lighting, water heating systems, and plug loads. Moreover, indoor environmental air quality was not taken into consideration in this study.

4.3. Study Implications and Recommendations for Future Research

This study addresses energy consumption in existing residential buildings as an essential step toward developing a comprehensive tool for making decisions. This work will help researchers, designers, building professionals, and policymakers to enhance overall energy use in residential buildings that are classified as low-rise existing buildings. Existing residential buildings in Petra, Jordan, acted as representative reference cases for expanding this concept to similar existing residential buildings in the Middle East and North Africa, with similar climate zones. However, future work could focus on updating the Jordanian building energy code to include improvements in the energy performance of existing buildings and detailed climate classifications. Moreover, the effectiveness of advanced energy guides—including but not limited to 30%, 50%, and, zero-energy guides—should be studied. Finally, the impact of applying thermal comfort and indoor air quality standards must be considered in future work.

5. Conclusions

In this paper, we aimed at selecting representative buildings to serve as reference cases, in addition to investigating the potential of applying building energy standards to improve the whole-building energy usage in existing residential buildings in a mild–dry climate. This work will pave the way toward higher energy-saving targets. Moreover, we aimed at identifying the retrofitting solutions in an applicable and practical way that is optimal in terms of potential energy conservation. The central questions raised were to what extent applicable energy-standard requirements can improve the energy use of existing residential buildings in mild–dry climates, and what potential scenarios can enhance energy use for such buildings while preserving their existing status and feasibility. Representative buildings in Petra, Jordan, were selected based on field and descriptive surveys that covered the following components and systems—envelope components, service water heating, HVAC, lighting, and plug load systems—to expand this concept to other buildings with similar building characteristics in mild–dry climates.
To find answers, we applied sets of standardized retrofitting strategies to the reference buildings. The proposed standards included the following: (1) the Jordanian building energy code, and (2) American building energy standard scenarios. The study’s main findings revealed that the annual energy-use intensity in the reference buildings (current scenario) was 210, 216, 224, and 206 kWh/m2/year for Cases 1, 2, 3, and 4, respectively, representing very high end-use. The application of energy-code-based scenarios greatly impacted the overall energy usage, offering further energy savings in mild–dry climates, where the application of the Jordanian code scenario provided up to 30% annual energy-use reductions. However, the application of the American building energy standard provided up to 45% annual energy-use reduction. The study’s results revealed many findings that could be useful for designers and policymakers to set future directions for the improvement of residential buildings located in mild climates. However, this study is limited by focusing on whole-building energy consumption in existing low-rise residential buildings in a mild–dry (4B) climate zone. It does not address the effectiveness of applying advanced energy design guides such as 30%, 50%, and zero-energy guides, which are intended to be studied in future works. This work paves the way toward applying such guides in disadvantaged regions where little or no energy-related information and climate files can be found. Finally, the authors also recommend that more studies be conducted on different building types with various climate zones and building energy design guides.

Author Contributions

Conceptualization, M.S.A. and F.A.; methodology, M.S.A.; software, M.S.A; validation, M.S.A; formal analysis, M.S.A; investigation, M.S.A; resources, M.S and A.A.S.; data curation, M.S.A. and A.A.S.; writing-review and editing, M.S.A., M.S. and F.A.; visualization, M.S.; supervision, M.S.A. and F.A; project administration, M.S.A and M.S, Funding acquisition, M.S.A., M.S. and A.A.S. All authors have read and agreed to the published version of the manuscript.

Funding

This research was funded by Al-Hussein Bin Talal (AHU) University (Project No. 2022/82). Project name (High-performance Energy and Water Design Guide for Residential Buildings in Southern Jordan).

Data Availability Statement

The data presented in this study are available on request from the corresponding author.

Conflicts of Interest

The authors declare no conflict of interest. The funders had no role in the study’s design; in the collection, analysis, or interpretation of the data; in the writing of the manuscript; or in the decision to publish the results.

Appendix A

Figure A1. Roof energy analytical properties (Case 1).
Energies 15 07763 g0a1
Figure A2. Wall energy analytical properties (Case 1).
Energies 15 07763 g0a2
Figure A3. Slab energy analytical properties (Case 1).
Energies 15 07763 g0a3
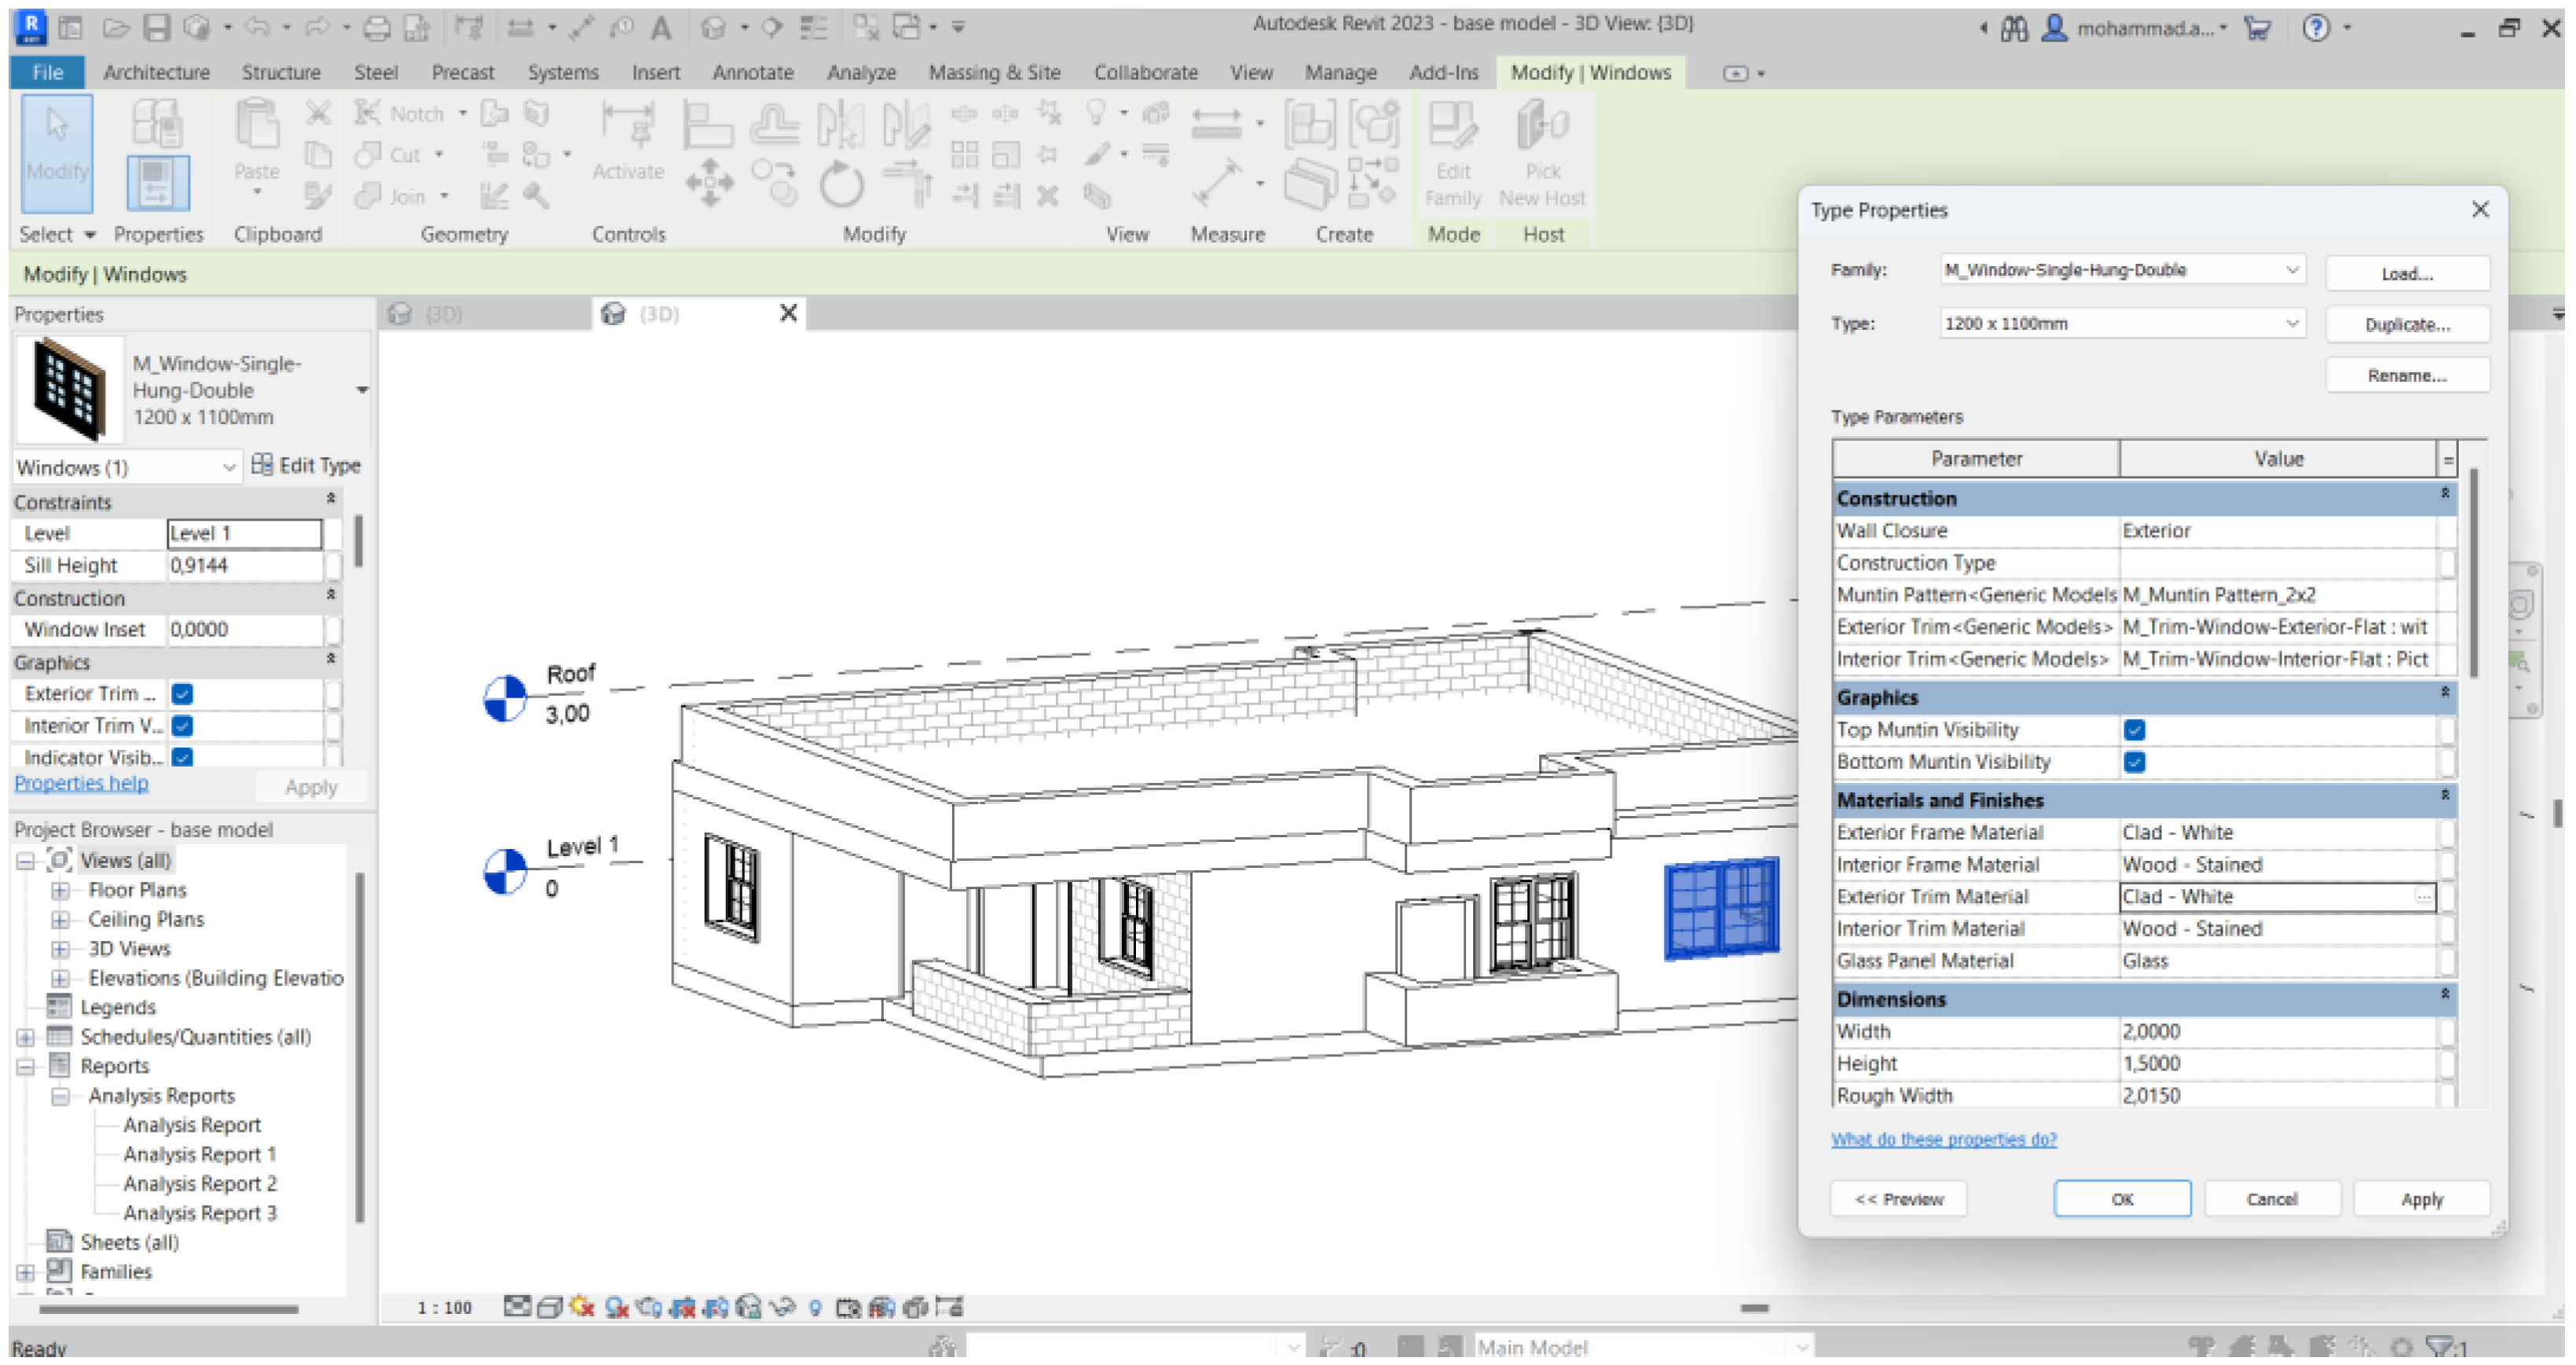
Figure A4. Windows’ energy analytical properties (Case 1).
Energies 15 07763 g0a4
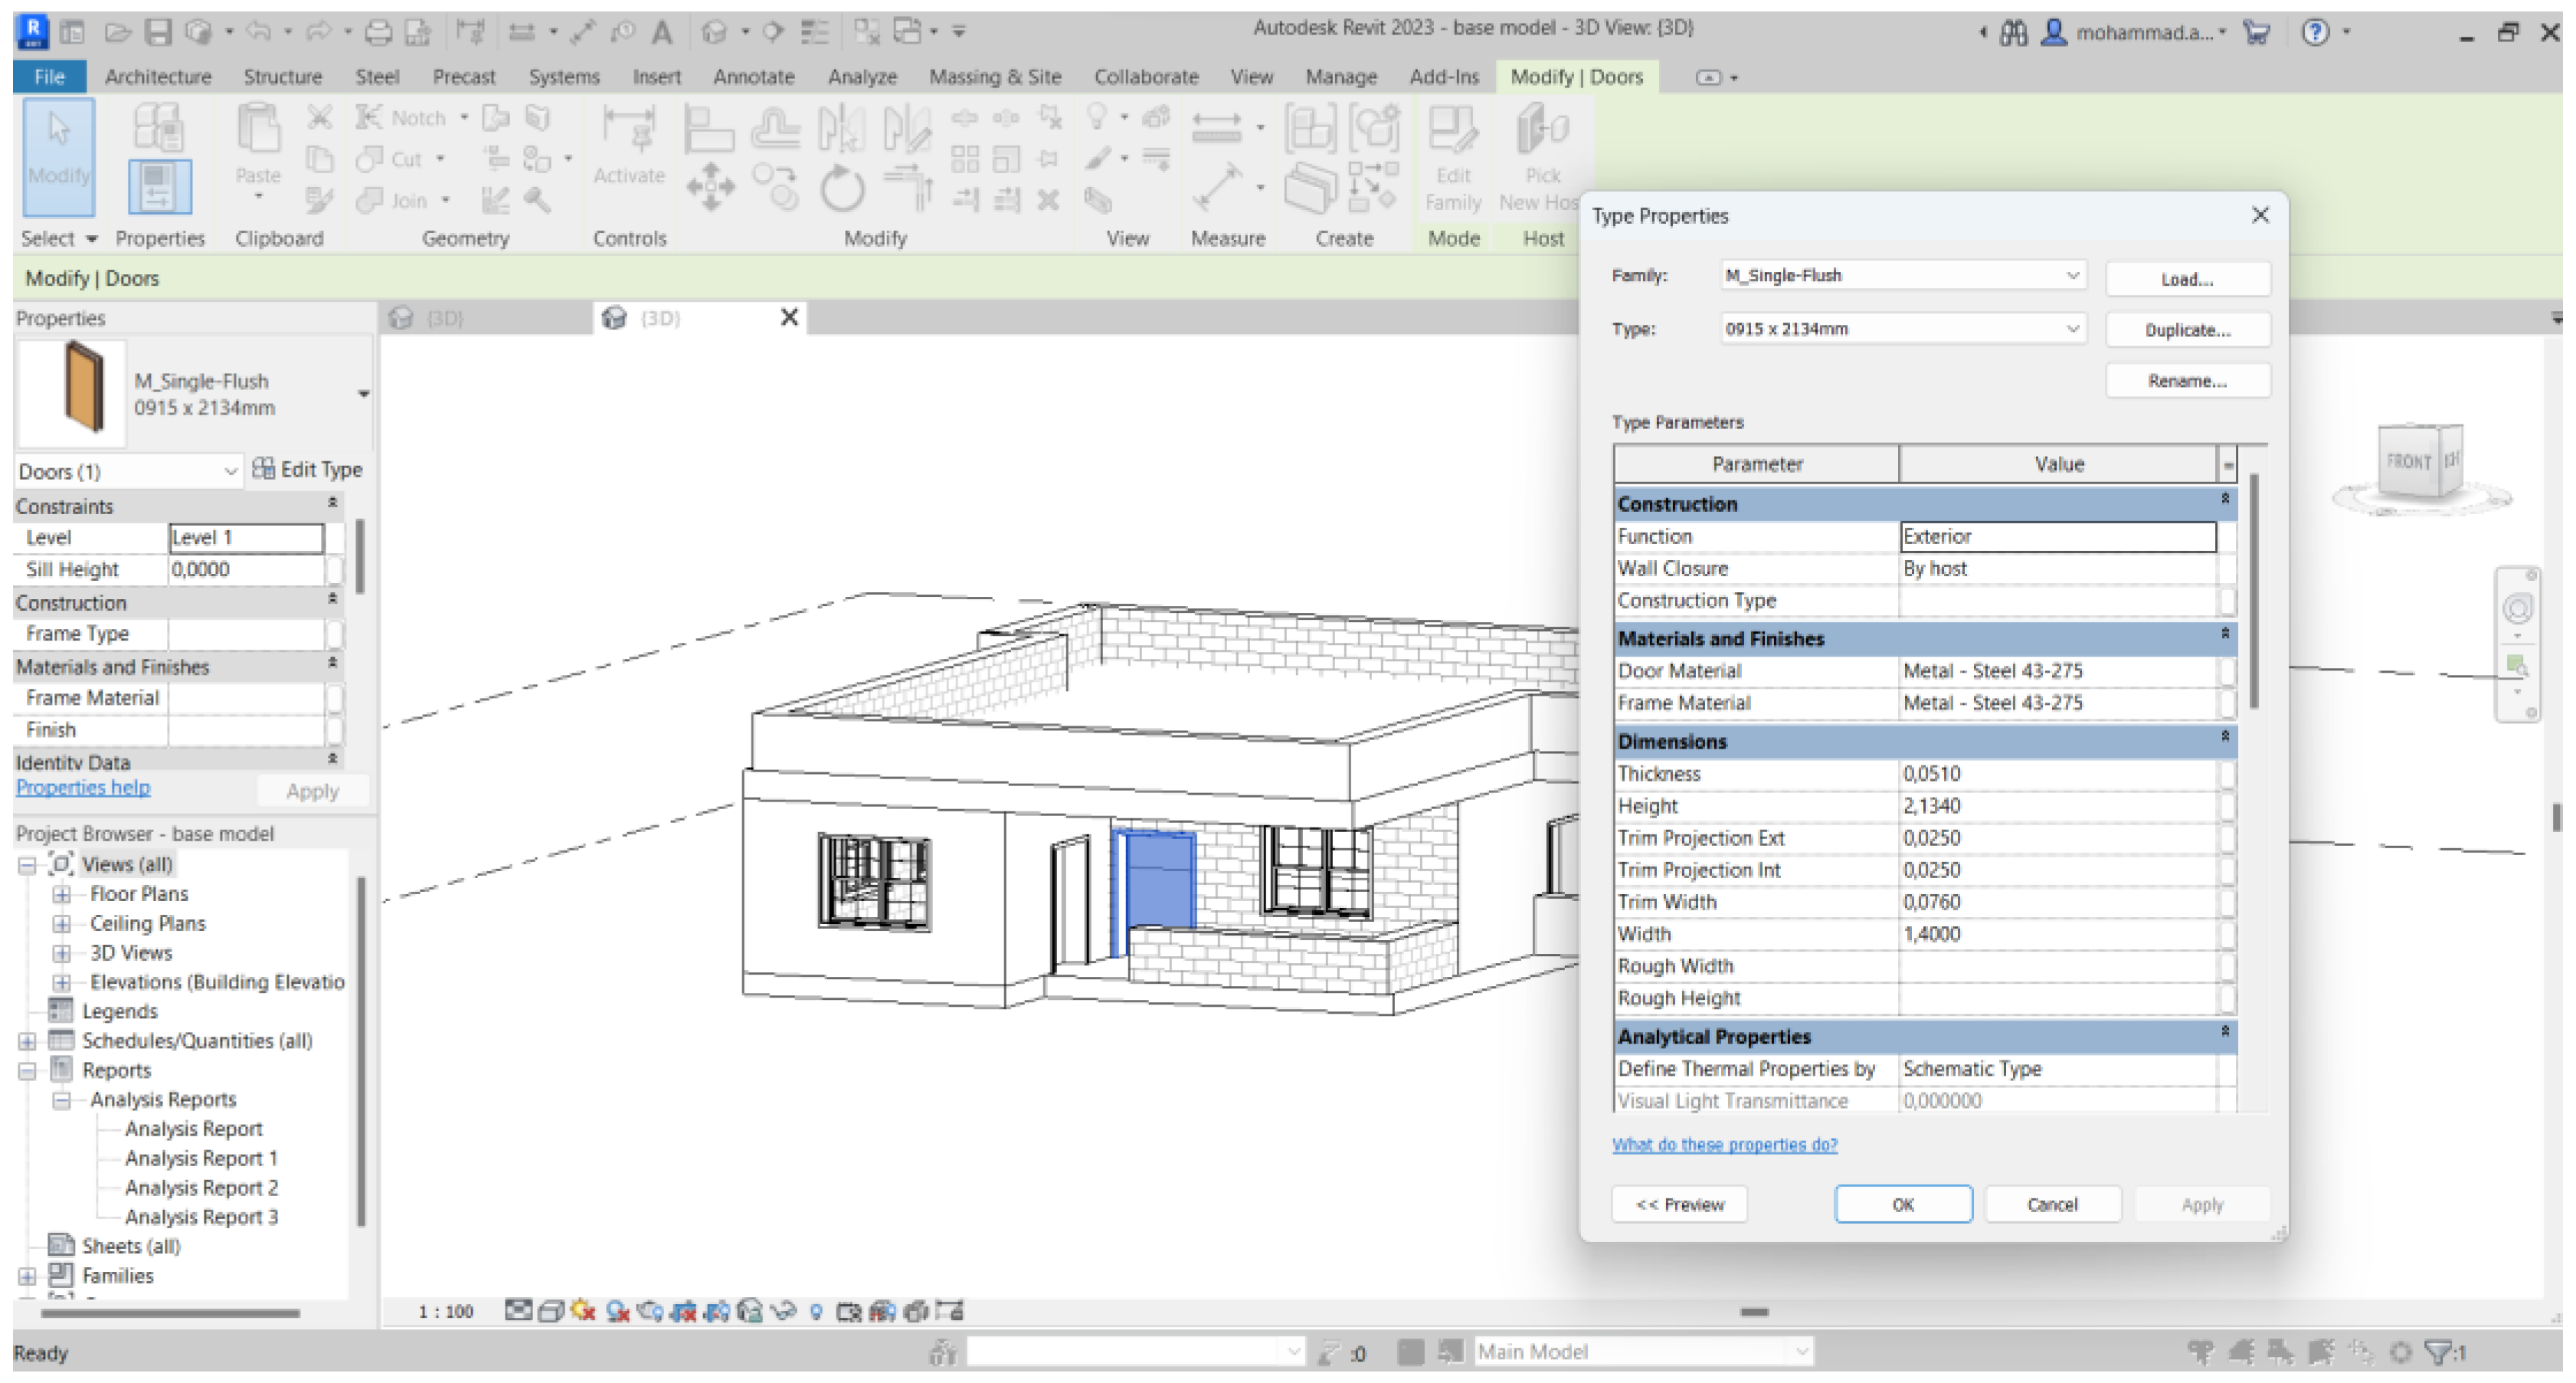
Figure A5. Doors’ energy analytical properties (Case 1).
Energies 15 07763 g0a5

References

  1. González-Torres, M.; Pérez-Lombard, L.; Coronel, J.F.; Maestre, I.R.; Yan, D. A review on Buildings Energy Information: Trends, end-uses, fuels and drivers. Energy Rep. 2022, 8, 626–637. [Google Scholar] [CrossRef]
  2. Höök, M.; Tang, X. Depletion of fossil fuels and anthropogenic climate change—A review. Energy Policy 2013, 52, 797–809. [Google Scholar] [CrossRef] [Green Version]
  3. Iacomelli, A. Renewable Energies for Central Asia Countries: Economic, Environmental and Social Impacts; Springer: Berlin/Heidelberg, Germany, 2005. [Google Scholar]
  4. World Health Organization. Economic and Social Impacts and Benefits of Health Systems. 2019. Available online: https://www.euro.who.int/en/publications/abstracts/economic-and-social-impacts-and-benefits-of-health-systems-2019 (accessed on 8 July 2022).
  5. Urge-Vorsatz, D.; Petrichenko, K.; Staniec, M.; Eom, J. Energy use in buildings in a long-term perspective. Curr. Opin. Environ. Sustain. 2013, 5, 141–151. [Google Scholar] [CrossRef]
  6. Pablo-Romero, M.; del Pozo-Barajas, R.; Yñiguez, R. Global changes in residential energy consumption. Energy Policy 2017, 101, 342–352. [Google Scholar] [CrossRef]
  7. MacNaughton, P.; Cao, X.; Buonocore, J.; Cedeno, M.; Spengler, J.; Bernstein, A.; Allen, J.G. Energy savings, emission reductions, and health co-benefits of the Green Building Movement. ISEE Conf. Abstr. 2018, 2018, 3. [Google Scholar] [CrossRef]
  8. Troi, A.; Bastian, Z. Energy Efficiency Solutions. In Energy Efficiency Solutions for Historic Buildings; Birkhäuser: Basel, Switzerland, 2015; pp. 120–195. Available online: https://doi.org/10.1515/9783038216506.120 (accessed on 2 July 2022).
  9. Đukić, M.; Zidar, M. Sustainability of investment projects with energy efficiency and Non-Energy efficiency costs: Case examples of public buildings. Sustainability 2021, 13, 5837. [Google Scholar] [CrossRef]
  10. Roth, A.; Reyna, J. Innovations in Building Energy Modeling: Research and Development Opportunities for Emerging Technologies; National Renewable Energy Lab. (NREL): Golden, CO, USA, 2020; Available online: https://doi.org/10.2172/1710155 (accessed on 5 August 2022).
  11. IEA. Accelerating Energy Efficiency: What Governments Can Do Now to Deliver Energy Savings—Analysis. Available online: https://www.iea.org/commentaries/accelerating-energy-efficiency-what-governments-can-do-now-to-deliver-energy-savings (accessed on 14 August 2022).
  12. Minister of Energy and Mineral Resources. Available online: https://www.memr.gov.jo/En/List/Studies_and_Statistics (accessed on 9 July 2022).
  13. Sandri, S.; Hussein, H.; Alshyab, N. Sustainability of the energy sector in Jordan: Challenges and opportunities. Sustainability 2020, 12, 10465. [Google Scholar] [CrossRef]
  14. García-Valldecabres, J.; Pellicer, E.; Jordan-Palomar, I. BIM scientific literature review for existing buildings and a theoretical method: Proposal for Heritage Data Management using HBIM. In Construction Research Congress 2016; ASCE: Reston, VA, USA, 2016; Available online: https://doi.org/10.1061/9780784479827.222 (accessed on 19 July 2022).
  15. European Environment Agency. Building Renovation: Where Circular Economy and Climate Meet. Available online: https://www.eea.europa.eu/publications/building-renovation-where-circular-economy (accessed on 9 July 2022).
  16. Streicher, K.N.; Mennel, S.; Chambers, J.; Parra, D.; Patel, M.K. Cost-effectiveness of large-scale deep energy retrofit packages for residential buildings under different economic assessment approaches. Energy Build. 2020, 215, 109870. [Google Scholar] [CrossRef]
  17. Miller, N.; Kok, N. Existing building retrofits. In Routledge Handbook of Sustainable Real Estate; Taylor & Francis Group: Abingdon, UK, 2018; pp. 114–131. Available online: https://doi.org/10.1201/9781315622750-8 (accessed on 9 July 2022).
  18. (PDF) Energy Efficient Building Code for Jordan—Researchgate. Available online: https://www.researchgate.net/publication/237548895_Energy_Efficient_Building_Code_for_Jordan (accessed on 14 August 2022).
  19. Dar-Mousa, R.N.; Makhamreh, Z. Analysis of the pattern of energy consumptions and its impact on urban environmental sustainability in Jordan: Amman City as a case study. Energy Sustain. Soc. 2019, 9, 15. [Google Scholar] [CrossRef] [Green Version]
  20. Home. Department of Statistics. Available online: http://dosweb.dos.gov.jo/products/construction2015/ (accessed on 9 July 2022).
  21. Tian, Z.; Zhang, X.; Jin, X.; Zhou, X.; Si, B.; Shi, X. Towards adoption of building energy simulation and optimization for Passive Building Design: A survey and a Review. Energy Build. 2018, 158, 1306–1316. [Google Scholar] [CrossRef]
  22. Wong, J.K.; Zhou, J. Enhancing environmental sustainability over building life cycles through Green Bim: A Review. Autom. Constr. 2015, 57, 156–165. [Google Scholar] [CrossRef]
  23. Kheiri, F. A review on optimization methods applied in energy-efficient building geometry and Envelope Design. Renew. Sustain. Energy Rev. 2018, 92, 897–920. [Google Scholar] [CrossRef]
  24. Gao, H.; Koch, C.; Wu, Y. Building Information Modelling Based Building Energy Modelling: A Review. Appl. Energy 2019, 238, 320–343. [Google Scholar] [CrossRef]
  25. ANSI/ASHRAE 90.2-2018. ANSI Webstore. Available online: https://webstore.ansi.org/Standards/ASHRAE/ANSIASHRAE902018?source=blog (accessed on 14 August 2022).
  26. Mahiwal, S.G.; Bhoi, M.K.; Bhatt, N. Evaluation of energy use intensity (EUI) and energy cost of commercial building in India using BIM Technology. Asian J. Civ. Eng. 2021, 22, 877–894. [Google Scholar] [CrossRef]
  27. Energy Use Intensity as a Driver for Building-Envelope Design—UMass. Available online: https://scholarworks.umass.edu/cgi/viewcontent.cgi?article=1044&context=btes (accessed on 8 August 2022).
  28. Samadi, M.; Fattahi, J. Energy use intensity disaggregation in institutional buildings—A data analytics approach. Energy Build. 2021, 235, 110730. [Google Scholar] [CrossRef]
  29. Fotopoulou, A.; Semprini, G.; Cattani, E.; Schihin, Y.; Weyer, J.; Gulli, R.; Ferrante, A. Deep renovation in existing residential buildings through façade additions: A case study in a typical residential building of the 70s. Energy Build. 2018, 166, 258–270. [Google Scholar] [CrossRef]
  30. Rakhshan, K.; Friess, W.A. Effectiveness and viability of residential building energy retrofits in Dubai. J. Build. Eng. 2017, 13, 116–126. [Google Scholar] [CrossRef]
  31. Ananwattanaporn, S.; Patcharoen, T.; Bunjongjit, S.; Ngaopitakkul, A. Retrofitted existing residential building design in energy and economic aspect according to Thailand Building Energy Code. Appl. Sci. 2021, 11, 1398. [Google Scholar] [CrossRef]
  32. Ibrahim, H.S.S.; Khan, A.Z.; Mahar, W.A.; Attia, S.; Serag, Y. Assessment of passive retrofitting scenarios in heritage residential buildings in hot, dry climates. Energies 2021, 14, 3359. [Google Scholar] [CrossRef]
  33. Fernández Bandera, C.; Muñoz Mardones, A.; Du, H.; Echevarría Trueba, J.; Ramos Ruiz, G. Exergy as a measure of sustainable retrofitting of Buildings. Energies 2018, 11, 3139. [Google Scholar] [CrossRef]
  34. Ouyang, J.; Wang, C.; Li, H.; Hokao, K. A methodology for energy-efficient renovation of existing residential buildings in China and case study. Energy Build. 2011, 43, 2203–2210. [Google Scholar] [CrossRef]
  35. Attia, S.; Evrard, A.; Gratia, E. Development of benchmark models for the Egyptian Residential Buildings Sector. Appl. Energy 2012, 94, 270–284. [Google Scholar] [CrossRef]
  36. Tahmasebinia, F.; Jiang, R.; Sepasgozar, S.; Wei, J.; Ding, Y.; Ma, H. Implementation of BIM energy analysis and Monte Carlo simulation for Estimating Building Energy Performance Based on Regression Approach: A case study. Buildings 2022, 12, 449. [Google Scholar] [CrossRef]
  37. Alawneh, R.; Ghazali, F.; Ali, H.; Sadullah, A.F. A novel framework for integrating United Nations Sustainable Development Goals into sustainable residential building assessment and management in Jordan. Sustain. Cities Soc. 2019, 49, 101612. [Google Scholar] [CrossRef]
  38. Bataineh, K.; Alrabee, A. Improving the energy efficiency of the residential buildings in Jordan. Buildings 2018, 8, 85. [Google Scholar] [CrossRef] [Green Version]
  39. Ali, H.H.; Al-Rub, F.A.; Shboul, B.; Moumani, H.A. Evaluation of near-net-zero-energy building strategies: A case study on residential buildings in Jordan. Int. J. Energy Econ. Policy 2020, 10, 325–336. [Google Scholar] [CrossRef]
  40. Alkubaisi, A.; Alnsour, M.A. Using AHP method for development of existing building Green Assessment System in Jordan. Asian J. Civ. Eng. 2022, 23, 1231–1250. [Google Scholar] [CrossRef]
  41. Bataineh, A.M.; Ali, H.H. Improving energy efficiency of multi-family apartment buildings case of Jordan. Int. J. Energy Econ. Policy 2021, 11, 244–254. [Google Scholar] [CrossRef]
  42. Alkhalidi, A.; Aljolani, O. Do green buildings provide benefits to the residential sector in Jordan? yes, but…. Int. J. Low-Carbon Technol. 2020, 15, 319–327. [Google Scholar] [CrossRef]
  43. Al Shawabkeh, R.K.; Alzouby, A.M.; Rjoub, A.; Alsmadi, M.; AlKhamaiseh, M.; Shboul, D.; Smadi, A.; Al-Bzour, A.; Al-Omari, R.; Alobaidat, E. Evaluating the satisfaction rate for affordable housing in non-gated residential area (NGR): The case of Al-Sharq Housing Project in zarqa-jordan. Int. J. Hous. Mark. Anal. 2020, 14, 192–217. [Google Scholar] [CrossRef]
  44. Shamout, S.; Boarin, P.; Melis, A. Energy retrofit of existing building stock in Amman: State of the art, obstacles and opportunities. In Advanced Studies in Energy Efficiency and Built Environment for Developing Countries; Springer: Berlin/Heidelberg, Germany, 2019; pp. 133–145. Available online: https://doi.org/10.1007/978-3-030-10856-4_14 (accessed on 12 August 2022).
  45. Albatayneh, A.; Juaidi, A.; Abdallah, R.; Manzano-Agugliaro, F. Influence of the advancement in the LED lighting technologies on the optimum windows-to-wall ratio of Jordanians residential buildings. Energies 2021, 14, 5446. [Google Scholar] [CrossRef]
  46. Osman, M.; Ouf, M. A comprehensive review of time use surveys in modelling occupant presence and behavior: Data, methods, and applications. Build. Environ. 2021, 196, 107785. [Google Scholar] [CrossRef]
  47. Albdour, M.S.; Baranyai, B. Numerical evaluation of outdoor thermal comfort and weather parameters in summertime at Széchenyi Square. Pollack Period. 2019, 14, 131–142. [Google Scholar] [CrossRef] [Green Version]
  48. Available online: https://www.researchgate.net/publication/308935636_ClimateConscious_Architecture_and_UrbanDesign_in_JordanTowardsenergyefficient_buildings_and_improved_urban_microclimate (accessed on 2 August 2022).
  49. Available online: http://www.dos.gov.jo/dos_home_a/main/population/census2015/HousingUnits/Housing_2.15.pdf (accessed on 2 August 2022).
  50. Korolija, I.; Marjanovic-Halburd, L.; Zhang, Y.; Hanby, V.I. Influence of building parameters and HVAC systems coupling on Building Energy Performance. Energy Build. 2011, 43, 1247–1253. [Google Scholar] [CrossRef]
  51. Lapinskiene, V.; Martinaitis, V. The framework of an optimization model for building envelope. Procedia Eng. 2013, 57, 670–677. [Google Scholar] [CrossRef] [Green Version]
  52. Al-Mofeez, I.A.; Numan, M.Y.; Alshaibani, K.A.; Al-Maziad, F.A. Review of typical vs. synthesized energy modeling weather files. J. Renew. Sustain. Energy 2012, 4, 012702. [Google Scholar] [CrossRef]
  53. World Bank Climate Change Knowledge Portal. Climatology|Climate Change Knowledge Portal. Available online: https://climateknowledgeportal.worldbank.org/country/jordan/climate-data-historical#:~:text=Jordan’s%20climate%20ranges%20between%20a,from%2019%2D22%C2%B0C (accessed on 9 July 2022).
  54. ANSI/ASHRAE Standard 169; Climatic Data for Building Design Standards. ASHRAE: Atlanta, GA, USA, 2020.
  55. ANSI/ASHRAE/IES Standard 90.1-2019; Standard 90.1 User’s Manual: Ansi/Ashrae/Ies Standard 90.1-2016: Energy Standard for Buildings except Low-Rise Residential Buildings: I-P Edition. ASHRAE: Atlanta, GA, USA, 2017.
  56. Albdour, M.S.; Baranyai, B.; Shalby, M.M. Overview of whole-building energy engines for investigating energy-related systems. Pollack Period. 2022. [Google Scholar] [CrossRef]
  57. Piselli, C.; Romanelli, J.; Di Grazia, M.; Gavagni, A.; Moretti, E.; Nicolini, A.; Cotana, F.; Strangis, F.; Witte, H.J.; Pisello, A.L. An integrated HBIM simulation approach for energy retrofit of historical buildings implemented in a case study of a medieval fortress in Italy. Energies 2020, 13, 2601. [Google Scholar] [CrossRef]
  58. Mahar, W.A.; Verbeeck, M.K.S.G.; Attia, S. An investigation of thermal comfort of houses in dry and semi-arid climates of quetta, pakistan. Sustainability 2019, 11, 5203. [Google Scholar] [CrossRef] [Green Version]
  59. Gutiérrez González, V.; Ramos Ruiz, G.; Fernández Bandera, C. Empirical and comparative validation for a building energy model calibration methodology. Sensors 2020, 20, 5003. [Google Scholar] [CrossRef]
  60. Judkoff, R.; Wortman, D.; O’Doherty, B.; Burch, J. Methodology for Validating Building Energy Analysis Simulation; National Renewable Energy Lab. (NREL): Golden, CO, USA, 2008; Available online: https://doi.org/10.2172/928259 (accessed on 5 August 2022).
  61. International Code Council. International Energy Conservation Code, 2006; International Code Council: Washington, DC, USA, 2008. [Google Scholar]
  62. Krarti, M. Evaluation of energy efficiency potential for the building sector in the Arab Region. Energies 2019, 12, 4279. [Google Scholar] [CrossRef]
  63. The Energy Performance of Buildings Directive—EC.EUROPA.EU. Available online: https://ec.europa.eu/energy/sites/default/files/documents/buildings_performance_factsheet.pdf (accessed on 10 July 2022).
  64. U.S. Energy Information Administration—EIA—Independent Statistics and Analysis. Available online: https://www.eia.gov/consumption/residential/data/2020/index.php?view=characteristics&src=%E2%80%B9+Consumption++++++Residential+Energy+Consumption+Survey+%28RECS%29-b1 (accessed on 12 July 2022).
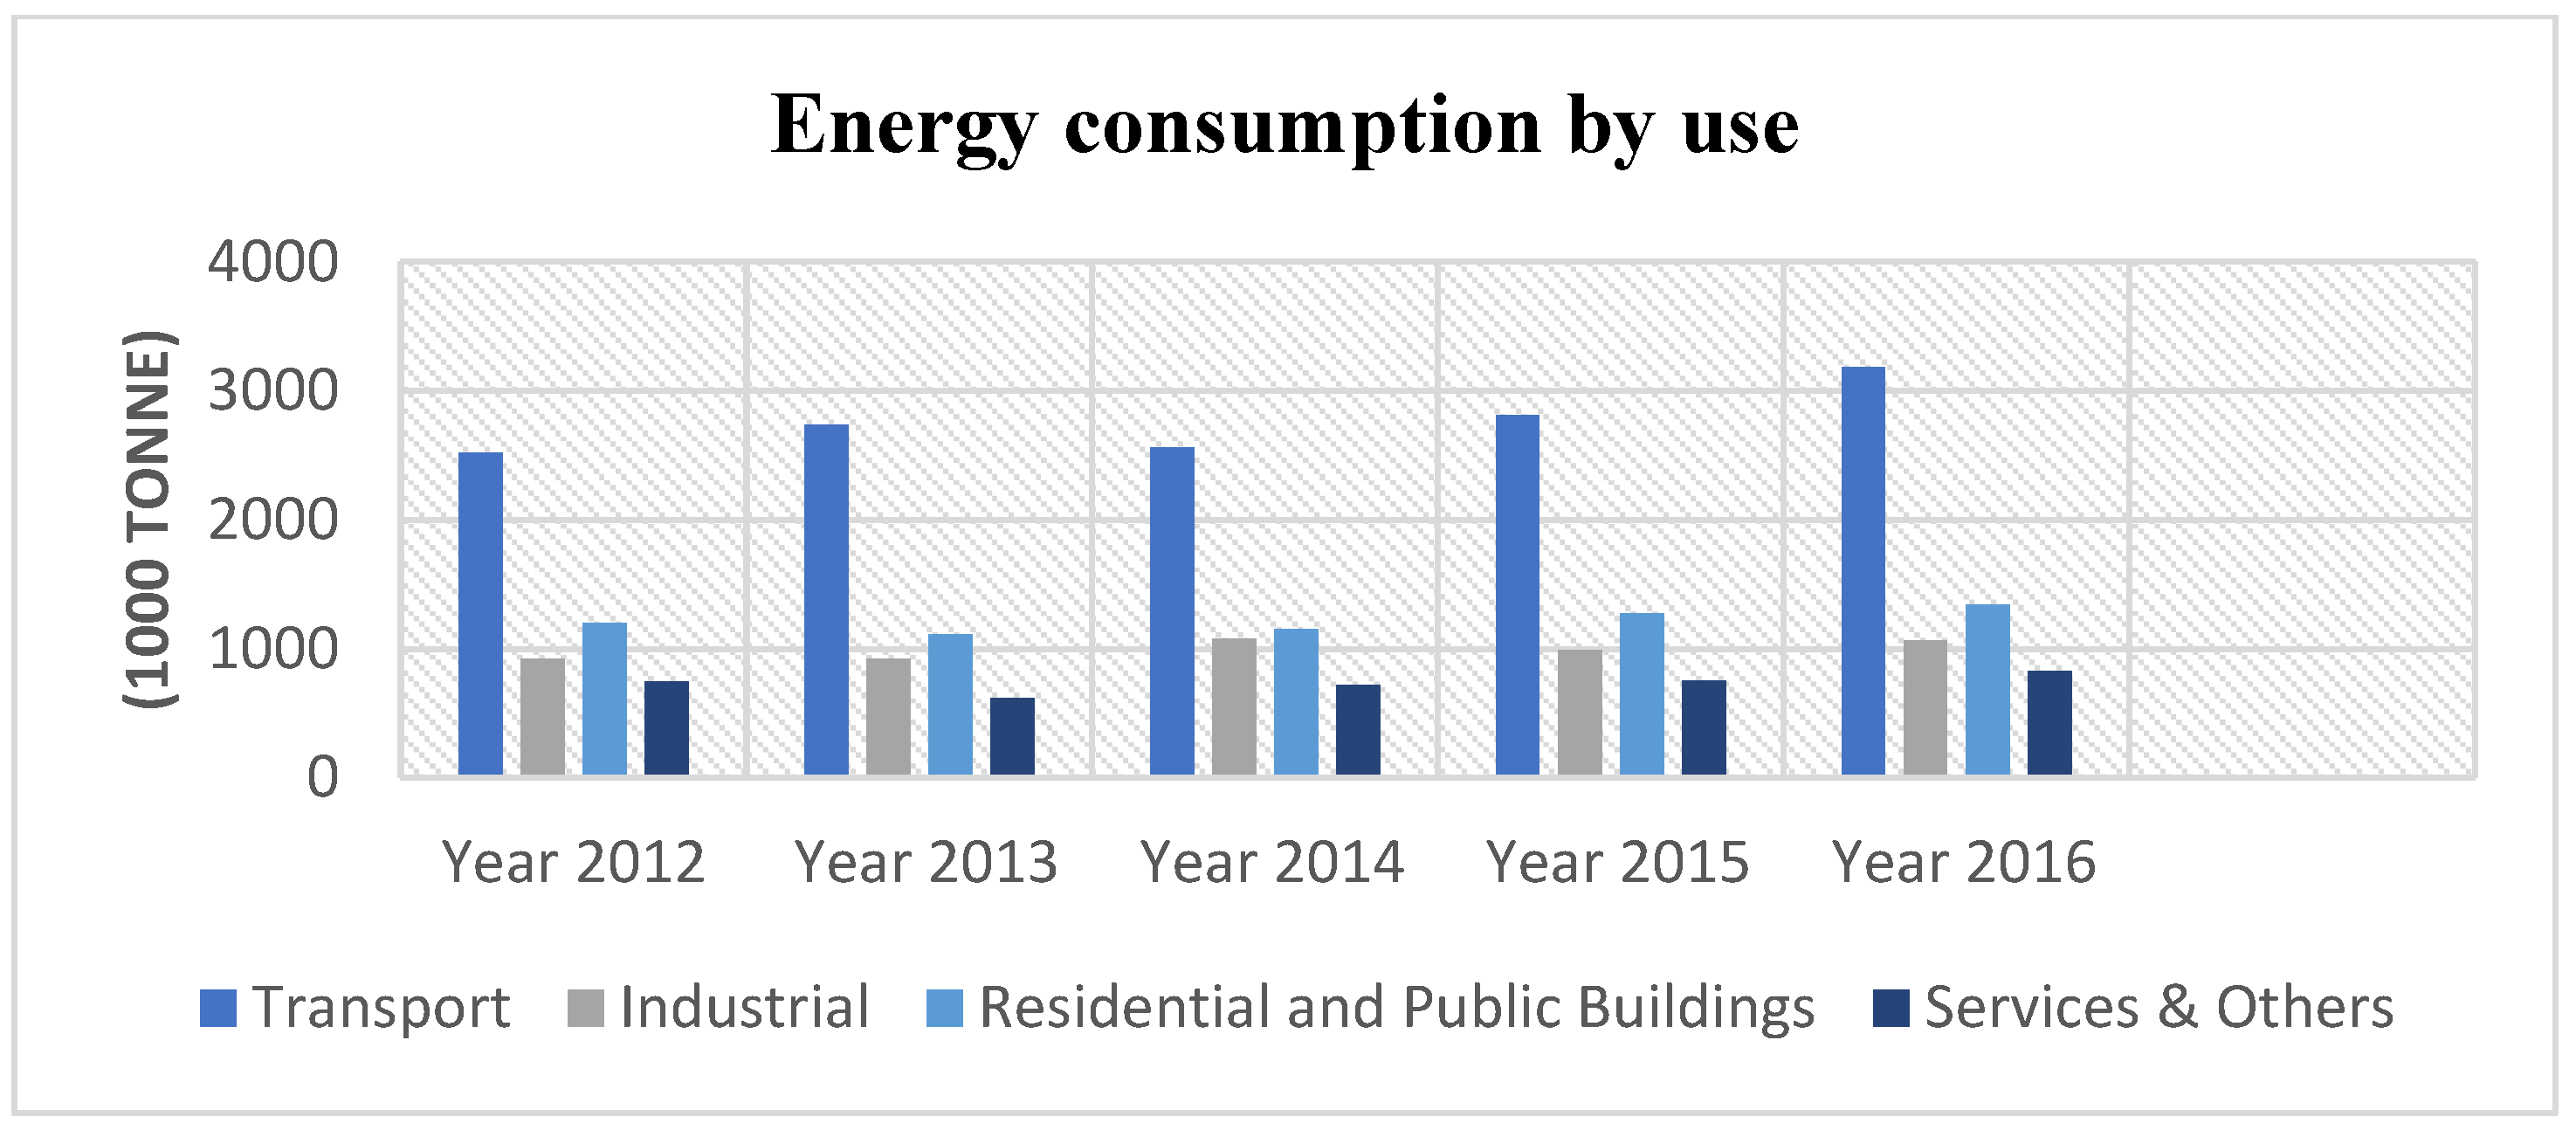
Figure 1. Final energy consumption by sector between 2012 and 2016 in Jordan.
Energies 15 07763 g001
Figure 2. Conceptual study framework.
Energies 15 07763 g002
Figure 3. The modeled representative reference cases and architectural plans (1–4).
Energies 15 07763 g003
Figure 4. Climate data for Petra, Jordan.
Energies 15 07763 g004
Figure 5. Validation of the calibration based on hourly and annual actual and simulated results.
Energies 15 07763 g005
Figure 6. A comparison of the energy end-use and energy-use intensity for different reference cases.
Energies 15 07763 g006
Figure 7. Energy end-use and energy-use intensity after applying Jordan’s building energy code.
Energies 15 07763 g007
Figure 8. Energy end-use and energy-use intensity after applying the American building energy standard.
Energies 15 07763 g008aEnergies 15 07763 g008b
Figure 9. Energy-use intensity in the residential sector for different reported cases and countries.
Energies 15 07763 g009
Table 1. Built area features and envelope characteristics.
Built Area Features in m2
Built area9% (100–130) or less
24% (130–150)
31% (150–170)
24% (170–200)
11% (200–220) or above
Number of stories74% one-story
16% two-story
7% three-story
3% more than three stories
Ceiling height98% 3–2.8 m
Building color98% white scheme colors
Envelope Components
Roofs97% 23–27 cm reinforced concrete with hollow blocks
2% 15 cm reinforced concrete
Less than 1% uninsulated roof tiles
Slabs68% 10–15 cm reinforced concrete + 3 cm gravel + 3 cm cement mortar + 2 cm tiles
28% 3 cm gravel + 3 cm cement mortar + 2 cm tiles
Window–wall ratios1% less than 10%
40% 10–15%
51% 15–20%
7% 20–25%
1% above 25
Exterior wall structures66% 20 cm hollow concrete blocks
20% 20 cm hollow concrete blocks + 5 cm air + 15 cm hollow concrete blocks
11% 5 cm local stone + 7 cm normal concrete + 15 cm hollow concrete blocks
2% 20 cm hollow concrete blocks + 5 cm Insulation + 15 cm hollow concrete blocks
1% 5 cm local stone + 5 cm insulation + 7 cm normal concrete + 15 cm hollow concrete blocks
Interior wall structures and finishes65% 15 cm hollow concrete blocks
35% 10 cm hollow concrete blocks
Window types87% clear single-glazed aluminum
7% clear double-glazed aluminum
6% others
Exterior door types and finishes84% uninsulated non-swinging steel
11% non-swinging wood
5% non-swinging single-glazed and others
Vestibules36% at one entrance
Exterior and interior Sun control14%, more than 99% drapes and curtains
Table 2. Buildings’ energy-related system characteristics.
Service Water Heating
Water heating systems61% electric storage heater s
35% solar heating systems
5% other, including gas heating systems
Storage volume 98% ≤ 210 L
HVAC System Characteristics
Heating systems78% diesel, gas, and electric stoves
19% split units
Less than 3% diesel boiler heating and central heating systems
Cooling systems67% electric fans
33% split units
Spilt-unit energy labels36% with (A++, A+++) SEER (seasonal energy efficiency ratio) and SCOP (8/4.5)
41% with (A, A+) or above SEER (seasonal energy efficiency ratio) and SCOP (5.5/4)
16% with (B) SEER (seasonal energy efficiency ratio) and SCOP (4.8/3.3)
Conditioned area m2Surveyed results
15–2556%
25–3027%
30–4010%
Above 507%
Air-conditioning usage
Heating30%
Cooling8%
Heating and cooling62%
Air-conditioner age
1–3 years46%
3–5 years26%
5–7 years17%
Other11%
Average electricity consumption in different conditioned households
Electricity consumption in JOD per year *Residents’ responses
300–45049%
450–65015%
650–85010%
Other26%
Daylighting/Lighting Systems
Lightbulb types95% LED; 5% others, including fluorescent
Interior finishes99% white scheme colors (interior surface average reflectance of more than 70%)
Plug Loads
Equipment86% ENERGY STAR or equivalent
Controls97% control with power-saving modes
* USD 1 = JOD 0.71.
Table 3. Input data used for creating the representative reference cases.
General
Location30.3216° N
35.4801° E climate zone (4B mild–dry)
Entrance orientationSE, NE, NW, N ***
Area (m2)135, 195, 230, 155
Number of stories1, 1, 2, 1
Number of occupants3, 5, 7, 4
Height (m)3
Heating and Cooling Systems
ItemHVAC system
Spilt units with natural ventilation6.5 SEER/3.6 SCOP *
Outside air (l/s person)20 *
Temperature set point (°C)Heating 21, cooling 23 *
Building infiltration classLoose, Case 1–3 medium, Case 4
Lighting Power Density (w/m2) **
Dining and living rooms17
Bedrooms14
Bathrooms and toilets9
Kitchen13
Building entrances and balconies13
Corridors8
TypeLED
Plug Loads
Average power density (w/m2)5 **
Service Water Heating
Electric storage water heaters ≤ 210 L≥2
* Natural ventilation was used throughout the validation process, and most of the model input values were cross-checked against the works of Bataineh (2018) and Ali (2020) [38,39]. ** Average power density was based on the study of Attia (2012) [35]. *** S, E, N, and W stand for south, east, north, and west, respectively.
Table 4. Envelope components’ analytical properties (Case 1).
ElementsTypeThicknessResistance (R) (m2·k)/wThermal Mass (kJ/k)U-Value W/(m2. k)SHGCVLT
WallHollow concrete blocks 20 cm0.240.192133.715.2056--
FloorSlap 15 cm20.3120.179221.245.5803--
RoofRoof 270 mm20.360.344250.542.9052--
Window1500 × 200 mm-0.1492-6.70180.860.9
WWR 13%
Door915 × 2134 mm0.0510.2701-3.7021--
Table 5. Envelope components’ analytical properties (Case 2).
ElementsTypeThickness mResistance (R) (m2·k)/wThermal Mass (kJ/k)U-Value W/(m2·K)SHGCVLT
Wall5 cm stone + 7 cm normal concrete + 15 cm hollow concrete blocks 0.270.192133.711.9--
FloorSlap 15 cm20.3120.179221.245.5803--
RoofRoof 27 cm20.360.344250.542.9052--
Window120 × 1600 mm-0.1492-6.70180.860.9
WWR 22%
Door1600 × 2134 mm0.0510.2701-3.7021--
Table 6. Envelope components’ analytical properties (Case 3).
ElementsTypeThickness mResistance (R) (m2·k)/wThermal Mass (kJ/k)U-Value W/(m2·K)SHGCVLT
Wall5 cm stone + 7 cm normal + 5 cm insulation + concrete + 15 cm hollow concrete blocks 0.320.192133.710.53--
FloorSlap 15 cm20.3120.179221.245.5803--
RoofRoof 27 cm20.360.344250.542.9052--
Window120 × 1600 mm-0.1492-3.70180.70.8
WWR 18%
Door1600 × 2134 mm0.0510.2701-3.7021--
Exterior Sun controlRoller shutters on all facades
Table 7. Envelope components’ analytical properties (Case 4).
ElementsTypeThickness mResistance (R) (m2·k)/wThermal Mass (kJ/k)U-Value W/(m2·K)SHGCVLT
Wall10 cm hollow concrete blocks + 5 cm air gap + 15 cm hollow concrete blocks 0.300.33133.710.53--
FloorSlap 15 cm20.3120.179221.245.5803--
RoofRoof 27 cm20.360.344250.542.9052--
Window1500 × 2000 mm-0.1492-6.70180.860.9
WWR 15%
Door1200 × 2134 mm0.0510.2701-3.7021--
Table 8. The requirements of the Jordanian code and ASHRAE Standard 90.2 2018 for building energy efficiency in mild–dry climate zones (4B).
ElementModel InputJordanian Energy CodeASHRAE Standard 90.2 2018
Climatic dataClimate zoneNo classification found4B (mild–dry)
EnvelopeWWR (window-to-wall ratio) %10–40.7 based on window type10–36
Roof (w/m2·k)U = 0.55U = 0.17
Walls, above-grade
mass (w/m2·k)
U = 0.57U = 0.56
Slab (w/m2·k)1.20.27
DoorNot specifyU-1.99
FenestrationDouble-glazed window
VLT not less than 0.45
SHGC is not more than 0.25
U-1.99
SHGC is not more than 0.4
Solar reflectance coefficient0.70.7
Air leakage L/S/M233
Air tightness (ac/h)2 (class medium)2 (class medium)
Exterior Sun controlNot specifyRecommended, south façade
Service water heatingElectric storage water heaters efficiency ≤ 210 L≥2 EF (energy factor)≥2 EF (energy factor)
HVAC systemSpilt unitsSEER ≥ 10 SCOP ≥ 2SEER ≥ 16, SCOP ≥ 3.81
Temperature set point (c)21 heating, 23 cooling21 heating, 23 cooling
Outside air (m3/h per person)2020
Lighting power density (w/m2)Dining and living rooms1717
Bedrooms1414
Bathrooms and toilets99
Kitchen1313
Building entrance and balconies1313
Plug loadsAverage installation power density55
ENERGY STAR equipmentNot specifyRecommended for all computers, equipment, and appliances
Power controlNot specifyControl with power saving modes and control off during unoccupied hours
ActivityMetabolism level1.2 (residential)1.2 (residential)
OccupancyBy building typeResidential buildingResidential building
Publisher’s Note: MDPI stays neutral with regard to jurisdictional claims in published maps and institutional affiliations.