Article

Research on the Characteristics and Influencing Factors of Chinese Urban Households’ Electricity Consumption Efficiency

1
School of Public Administration, Xi’an University of Architecture and Technology, Xi’an 710055, China
2
School of Public Administration, Central China Normal University, Wuhan 430079, China
*
Author to whom correspondence should be addressed.
Energies 2022, 15(20), 7748; https://doi.org/10.3390/en15207748
Submission received: 20 September 2022 / Revised: 17 October 2022 / Accepted: 18 October 2022 / Published: 20 October 2022

Abstract

:
Improving energy efficiency is a key global policy goal for climate protection. Residential energy consumption has also increased rapidly with the acceleration of China’s urbanization process, there is still a lack of studies that deeply explore the microscopic urban household energy efficiency and the main determinants in China, although urban household energy efficiency has attracted the attention of many scholars. We use a two-step method to analyze the electricity consumption efficiency of Chinese urban households in 2014 and 2016, the changing characteristics of household electricity efficiency who live in two-bedroom houses are measured with data envelopment analysis (DEA) method in the first step and the driving factors of changes are analyzed with Tobit model in the second step. The results show that household electricity efficiency gained a small but significant improvement between 2014 and 2016. Household income, age, and education level of the head of household, and housing type are the main drivers of inefficiency. We also adopt robustness tests, such as Bootstrap truncated regression to find this effect still exists. This information can be used in activities such as subsidized energy-saving equipment, energy audits, and information campaigns that aimed at improving household electricity efficiency, thereby increasing their cost-effectiveness and minimizing electricity consumption.

Graphical Abstract

1. Introduction

Climate change is related to the survival and development of human society, and China is the world’s second-largest economy and an important global leader. In order to reach the global emission reduction targets of the Paris Agreement, China is striving to peak its CO2 emissions by 2030 and working toward carbon neutrality by 2060 [1]. Accounting for 67% of total global energy consumption and 71% of total energy-related CO2 emissions, cities have become a major site for low-carbon development and energy transition [2]. Urban energy consumption and urbanization are closely linked; China’s urbanization rate reached 60.6% in 2019, and residential energy is estimated to account for 29% of total energy consumption in China [3]. From an academic perspective, it is still relatively focused on industrial energy efficiency in China today and exploring the relationship between economic growth, industrial structure, and other factors [4,5,6]. Although studies related to reducing residential consumption are gradually increasing, it is still scarce related to improving household energy efficiency [7,8]. From a practical perspective, it is especially important to guide energy-saving consumption patterns while China’s economic growth is changing from export-driven to domestic demand-driven. As the share of tertiary industry and per capita income is continuously rising, the share of residential consumption in urban energy consumption will undoubtedly increase rapidly and will determine urban energy consumption levels as a whole by influencing the product and service supply behavior of the industry. It is the key approach to achieving sustainable social development by reducing energy consumption at source by transforming people’s energy consumption motivation and behavior. An important step toward optimal reductions of energy consumption is the identification of the energy-saving potential in different sectors and the best strategies to improve efficiency. It can make a significant contribution to improving urban energy efficiency in the residential sector by reasonably anticipating, and therefore becomes one of the main objectives of energy policymakers.
The International Energy Agency (IEA) predicts that the residential sector could save approximately as much energy per year as the current annual electricity consumption of the United States and Japan combined in 2030. Both the U.S. and the EU attach great importance to research on consumer behavior, taking it as an important basis for energy-saving decisions and guiding green consumption by formulating government regulations. China’s energy intensity is much higher than that of Western countries, which is 1.5 times the global average and 2.12 times that of the United States [9]. On the other hand, China’s residential energy consumption is lower than the world average, and it is only one-third of the United States and one-half of the United Kingdom, which means it still has plenty of room for growth [10]. International experience shows that formulating an integrated policy framework with a combination of higher quality energy infrastructure, residential building energy efficiency, and public policies can bring significant environmental benefits to residential construction and rapid urbanization in the second two decades [11].
On the other hand, the task that has not yet been fully addressed is the provision of adequate energy efficiency indicators, as well as reliable and accurate data. Using inappropriate data or missing data can yield wrong information and create wrong policies [12]. Theoretical progress of energy efficiency in recent years has promoted the emergence of various more refined energy efficiency indicators, but the acquisition and arrangement of data have become one of the key factors restricting the reasonable measurement of energy efficiency [13]. Compared to developed countries, it is difficult to fully track information such as energy consumption and consumption costs in cities and across sectors for developing countries, and city governments are still unable to effectively conduct urban energy planning and complete sustainable urban energy consumption measurements and records. Until the beginning of the 21st century, residential energy-related data were still incomplete or missing in China. Most of the relevant studies used aggregate data and made the empirical analysis of urban residential energy-related issues very difficult, which makes the research on urban residential energy-related issues remain in the status quo description and meaningful discussion for many years. The lack of empirical research on residential energy efficiency is not conducive to the formation of a reasonable institutional framework for the improvement and implementation of residential energy efficiency standards in China, and it is also difficult to effectively confirm or refute the actual behavior and policy direction by lacking adequate comparative benchmarks and targets for studies on residential energy consumption.
The fact that quantitative estimates of household energy consumption efficiency are not yet available to policymakers is what creates a potential gap between the true efficiency level and the necessary assumed efficiency level used by policymakers in designing and implementing energy policies; therefore, this paper has the following contributions: (1) It is the first time to comprehensive measure of household electricity efficiency with national household microdata, which contains a sample of 3232 and covering 29 provinces. We provided detailed descriptions of household electricity efficiency, household socioeconomic, and housing characteristics. (2) It can be seen whether Chinese urban household electricity efficiency has improved over the sample period with changes in efficiency between 2014 and 2016, which makes the results more policy oriented. (3) The determinants of changes in household electricity efficiency are examined in terms of household socioeconomic characteristics, housing, and climate characteristics. This information can be used to target measures that are most likely to improve household electricity efficiency and ultimately reduce energy consumption, which in turn may lead to more cost-effective and energy-efficient policies.
By drawing on the framework of Becker’s (1965) household production function [14], we use a two-step method to measure urban household electricity efficiency and its determinants in China. Based on the concept of total factor productivity and combined with the DEA model, we measure household electricity efficiency in the first step and build a Tobit regression model to measure the direction and intensity effects of the main determinants on household electricity efficiency in the second step. The results show that urban households' electricity efficiency obtained a small but significant increase between 2014 and 2016, indicating that there is considerable potential for improving electricity efficiency. Household income, age, education level of the head of household, and housing type are the main factors for inefficient household electricity consumption. Overall, we provide empirical evidence to observe the changing trends of residential electricity efficiency and energy-saving paths in China during rapid urbanization and also provide a new perspective for understanding the environmental impacts of urban development in contemporary China.
The remainder of the paper is organized as follows: Section 2 provides the literature review; Section 3 explains the data, indicators, and models; Section 4 presents the empirical results; and Section 5 contains the conclusions and policy recommendations.

2. Literature Review

2.1. Household Energy Efficiency Measurements

Energy efficiency is the production of the same amounts of services or useful outputs with less energy, and the problem is how to define precisely the useful outputs and energy inputs [15]. In general, the theoretical basis for measuring residential energy efficiency is derived from Becker’s (1965) household production function, where residential energy consumption originates from the demand for energy services, which residents “produce” services by using various appliances and consuming energy, its meaning is that the use of energy is not its own end but the input that provides a service to meet people’s needs [16]. Therefore, the level of energy use should be measured by the services provided and not by the amount of energy consumed, e.g., lighting should be measured by the level of illumination in the room, not by the amount of electricity used. Since the output is not a specific quantity but a measure of service, it is difficult to measure directly, and in practice, they are generally represented by the number of appliances, housing area, etc. Residential energy intensity was used in the early literature to reflect trends of energy efficiency for specific services, and this indicator has received more criticism because it does not directly measure “true” energy efficiency [17,18]. Due to the long history of research on production and efficiency, this is achieved by production frontier analysis in practice, such as classical nonparametric data envelopment analysis (DEA) and parametric stochastic frontier analysis (SFA). Grösche P (2009) measured residential energy efficiency with the DEA approach for the first time and argued that this method could make the calculation of residential energy efficiency based on a more solid theoretical and without strict requirements on data [19]. Specifically, the DEA approach does not require separate energy intensity figures for each end-use, and the efficiency indicator can even be calculated from survey data [20,21].
Limited by the lack of microdata in the early stage, a class of literature focused on residential energy consumption characteristics using aggregate data under economic theory. BS Reddy (2003) argues that it can save significant amounts of money while improving environmental quality by improving household energy efficiency, and developing countries such as India have missed the opportunity to improve energy efficiency and focus on increasing energy production [22]. Ewing and Fang (2008) argue that urban form affects residential energy consumption through three main pathways, which are electric transmission and distribution losses, and indirectly through the housing stock and formation of urban heat islands [23]. Sun et al. (2016) found significant spatial autocorrelation of residential energy consumption in Chinese provinces, and most of them are spatially high-high and low-low agglomeration [24]. Hu et al. (2018) found that the carbon emissions of household energy consumption in Japan showed a cyclical change pattern during 1991–2011, and the share of carbon emissions from clean energy in the carbon emissions of household energy consumption gradually increased over time. The carbon emissions of household energy consumption per capita gradually increased with the increase in latitude, and the share of carbon emissions from household energy consumption in urban carbon emissions also gradually increased [25].
With the gradual enrichment of microdata in recent years, another strand of literature focuses on socioeconomic characteristics and behaviors of micro-family. Weyman-Jones et al. (2015) argue that it can be effective in reducing household electricity inefficiencies in Portugal if identifying priority areas and consumer intervals [26]. Broadstock et al. (2016) believe that it has great potential by expanding energy efficiency programs to reduce energy consumption and proving to be potentially the most efficient with the wealthiest urban households in China [27]. Orea et al. (2015) argue that most of the expected energy reductions from efficiency improvements may not be realized [28]. Alberini and Filippini (2018) found that it could save about 10% of total energy consumption if the U.S. residential sector could reduce persistent energy inefficiencies, and 17% of savings could be achieved if it eliminates temporary inefficiencies [29]. Boogen (2021) found that they could save about 20% of total electricity consumption if the domestic residential sector improved its electricity efficiency in Italy, Netherlands, and Switzerland. The figures are consistent with the results of the Swiss and U.S. residential sectors [30].
It can be seen that the measurement method of household energy efficiency has made great progress, from single-factor energy efficiency indicators such as energy intensity to total factor energy efficiency indicators, and the relevant data in developed countries can basically meet the requirements of DEA and SFA methods. The studies in developing countries are still relatively lacking, and the results using aggregate data are more likely to examine the regional differences between countries at the regional level. The changing characteristics of household energy efficiency in different countries can be characterized by the use of micro-household data simultaneously so that more targeted measures and instruments for inefficient households can be proposed.

2.2. Influencing Factors of Household Energy Efficiency

Most studies have concluded that household socio-demographic factors influence urban household electricity consumption, including household income, age, and education level of the household head, and housing characteristics, such as new and older houses and climate conditions also have important effects on residential electricity consumption, and we choose these factors to summarize.

2.2.1. Economic and Social Characteristics of Households

(1) Household income. Firoz A et al. (2008) believed that welfare effects could generate sustained demand for goods and services, and the supply of inputs, including energy, generates increased demand for these goods and services [31]. Ebrahimi M (2019) argued that higher-income households tend to live in houses that have larger floor areas, use more appliances, and require more energy consumption to meet demand [32]. Chen et al. (2019) found that high-level urbanization will lead to higher rural residential energy consumption intensities, and it can reduce the energy consumption of traditional biomass energy and non-biomass energy consumption intensity while increases in net income per capita [33]. Sun Y (2013) argues that household income reflects polarized differences in urban residents’ energy use behavior. Low-income households tend to choose to implement low-carbon energy use behavior due to economic reasons. On the other hand, high-income households pursue more quality, comfortable, and over-consumption life, and they are most likely to lack awareness of energy-saving [34]. MA Andor (2021) argues that income is the main driver of energy inefficiency and that the average efficiency values of low-income households in Germany are lower than wealthy households and homeowners. Low-income households should be targeted to improve residential energy efficiency [21]. Kalia P et al. (2021) believe GDP per capita does not directly affect the generation of e-waste. Higher Internet penetration in developing countries increases e-waste, while higher literacy in developed countries suppresses e-waste production [35]. Romero-Jordán, D. and del Río, P. (2022) argue that there is a negative correlation between household income and electricity consumption efficiency in Spain. Poor and non-poor households are less efficient in electricity consumption compared to very poor households [36]. Zia, A. et al. (2022) concluded that social influence and quality assurance are considered drivers of sustainable consumption in terms of energy, which leads to the formation of product purchase intention online. The effect of social influence and quality assurance on product purchase intention online was found to be positive [37].
(2) Age. Menz and Kühling (2001) believe that it will emit more SO2 in societies of OECD countries with a low proportion of young people and a high proportion of older people. A large proportion of individuals born before 1960 are positively associated with national SO2 emissions [38]. Pais-Magalhaes V et al. (2020) found that the member states in the EU with a larger percentage of an aging population are also the ones presenting the lowest households’ electricity consumption efficiency scores [39]. Tong et al. (2017) found that the per capita energy consumption of retired couples aged 65 living alone was 1.65 times higher than wage-earning households whose ages are between 35 and 64 and with 2 minors and 1.23 times higher than wage-earning households whose ages are 25 to 34 and without minors [40]. Mi et al. (2016) argued that there is a negative correlation between residents’ age and their energy use behavior. Older residents were less likely to implement energy-saving behaviors than younger, mainly because older residents lack the ability to accept new things and lack sufficient awareness of energy-saving and environmental knowledge, which makes them have a higher demand for energy [41].
(3) Education level. Dietz T (2009) argued that better-educated household heads have greater environmental awareness, and they have more patient and willing to make long-term investments that are beneficial to the environment [42]. Hu W et al. (2014) found that highly educated individuals in China have a greater willingness to accept low-carbon consumption [43]. Zhang et al. (2011) confirmed that a highly educated household significantly affects energy consumption behavior [44]. Zia, A. (2020) argues that the awareness and willingness to use energy-efficient gadgets is important to encourage families to adopt energy-saving behaviors during the COVID-19 pandemic, and higher education leads to the higher use of energy [45]. Wu et al. (2022) found that if there is a 1% increase in the number of years of education of the household head, the probability of using high-quality energy will increase by 3.3% [46].

2.2.2. Housing Characteristics

Fazeli et al. (2016) found it was significantly related to household energy consumption with the number of household rooms and the use of storm windows [47]. Zhang et al. (2021) found that residents of communities located in general urban areas had a high proportion of commercial housing purchases, the largest housing area, and the highest consumption of electricity, natural gas, and gasoline. Residents of communities located in urban areas prioritized for tourism and cultural development are more inclined toward an economic and environmental path [48]. Wei and Shen (2019) identified that they are the main factors driving the growth of residential energy consumption with the growth of building energy intensity and housing area [49]. Twerefou, D. K. and Abeney, J. O. (2020) found that compared to living in duplexes, households living in bungalows and apartments in Ghana are less efficient [50]. Romero-Jordán, D. and del Río, P. (2022) concluded that the number of rooms has a positive effect on household electricity efficiency in Spain, and households living in bungalows, detached houses, and apartments are less efficient than those living in duplexes [36].

2.2.3. Climate Characteristics

Mansur E. et al. (2007) found that residential energy consumption in warmer regions tends to use more electricity than other fuels, such as natural gas, and they also tend to use more energy. Climate change is likely to increase electricity consumption for cooling but reduce consumption of other fuels used for heating. Energy consumption in the U.S. is likely to increase as temperatures rise, which can damage overall welfare [51]. Yau, Y. H. and Hasbi, S. (2013) found that buildings will require more cooling and less heat load in areas where temperatures are expected to increase, so building energy consumption and carbon emissions are expected to rise during their operational phase. In addition, unstable weather trends can affect building efficiency and sustainability, indoor air quality, and thermal comfort [52]. Xie et al. (2019) concluded that topographic features, as well as average daily sunshine hours in summer, have a significant impact on energy consumption [53]. Du et al. (2020) found that climate change stimulates residential electricity consumption significantly more in hot weather than in cold weather [54].
In summary, studies on household residential energy consumption and efficiency have developed rapidly in recent years, and quantitative research on urban household energy efficiency and policy evaluation is increasing while most studies still focus on residential energy consumption rather than energy efficiency, and it can be seen that factors such as household income, age, and educational level of household head, housing characteristics, and climate have a significant impact on household energy efficiency. The current research is still dominated by developed countries such as the United States and EU, and there is still a lack of measurement of household residential energy efficiency in China from a micro perspective, which is not conducive to the introduction of policies related to improving urban residential energy efficiency by the Chinese government. This paper uses the 2014 and 2016 data from China Labor Force Dynamics Survey to capture the characteristics and changing trends of household electricity efficiency. We hope the results can reflect the actual situation of urban residential electricity consumption efficiency.

3. Data and Measurements

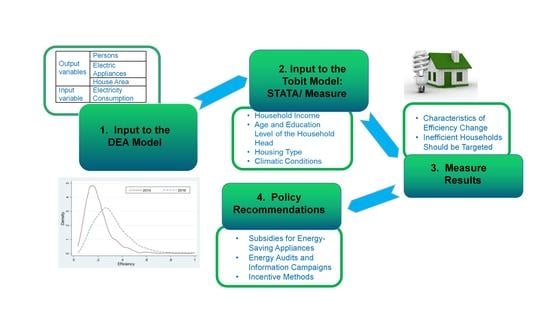
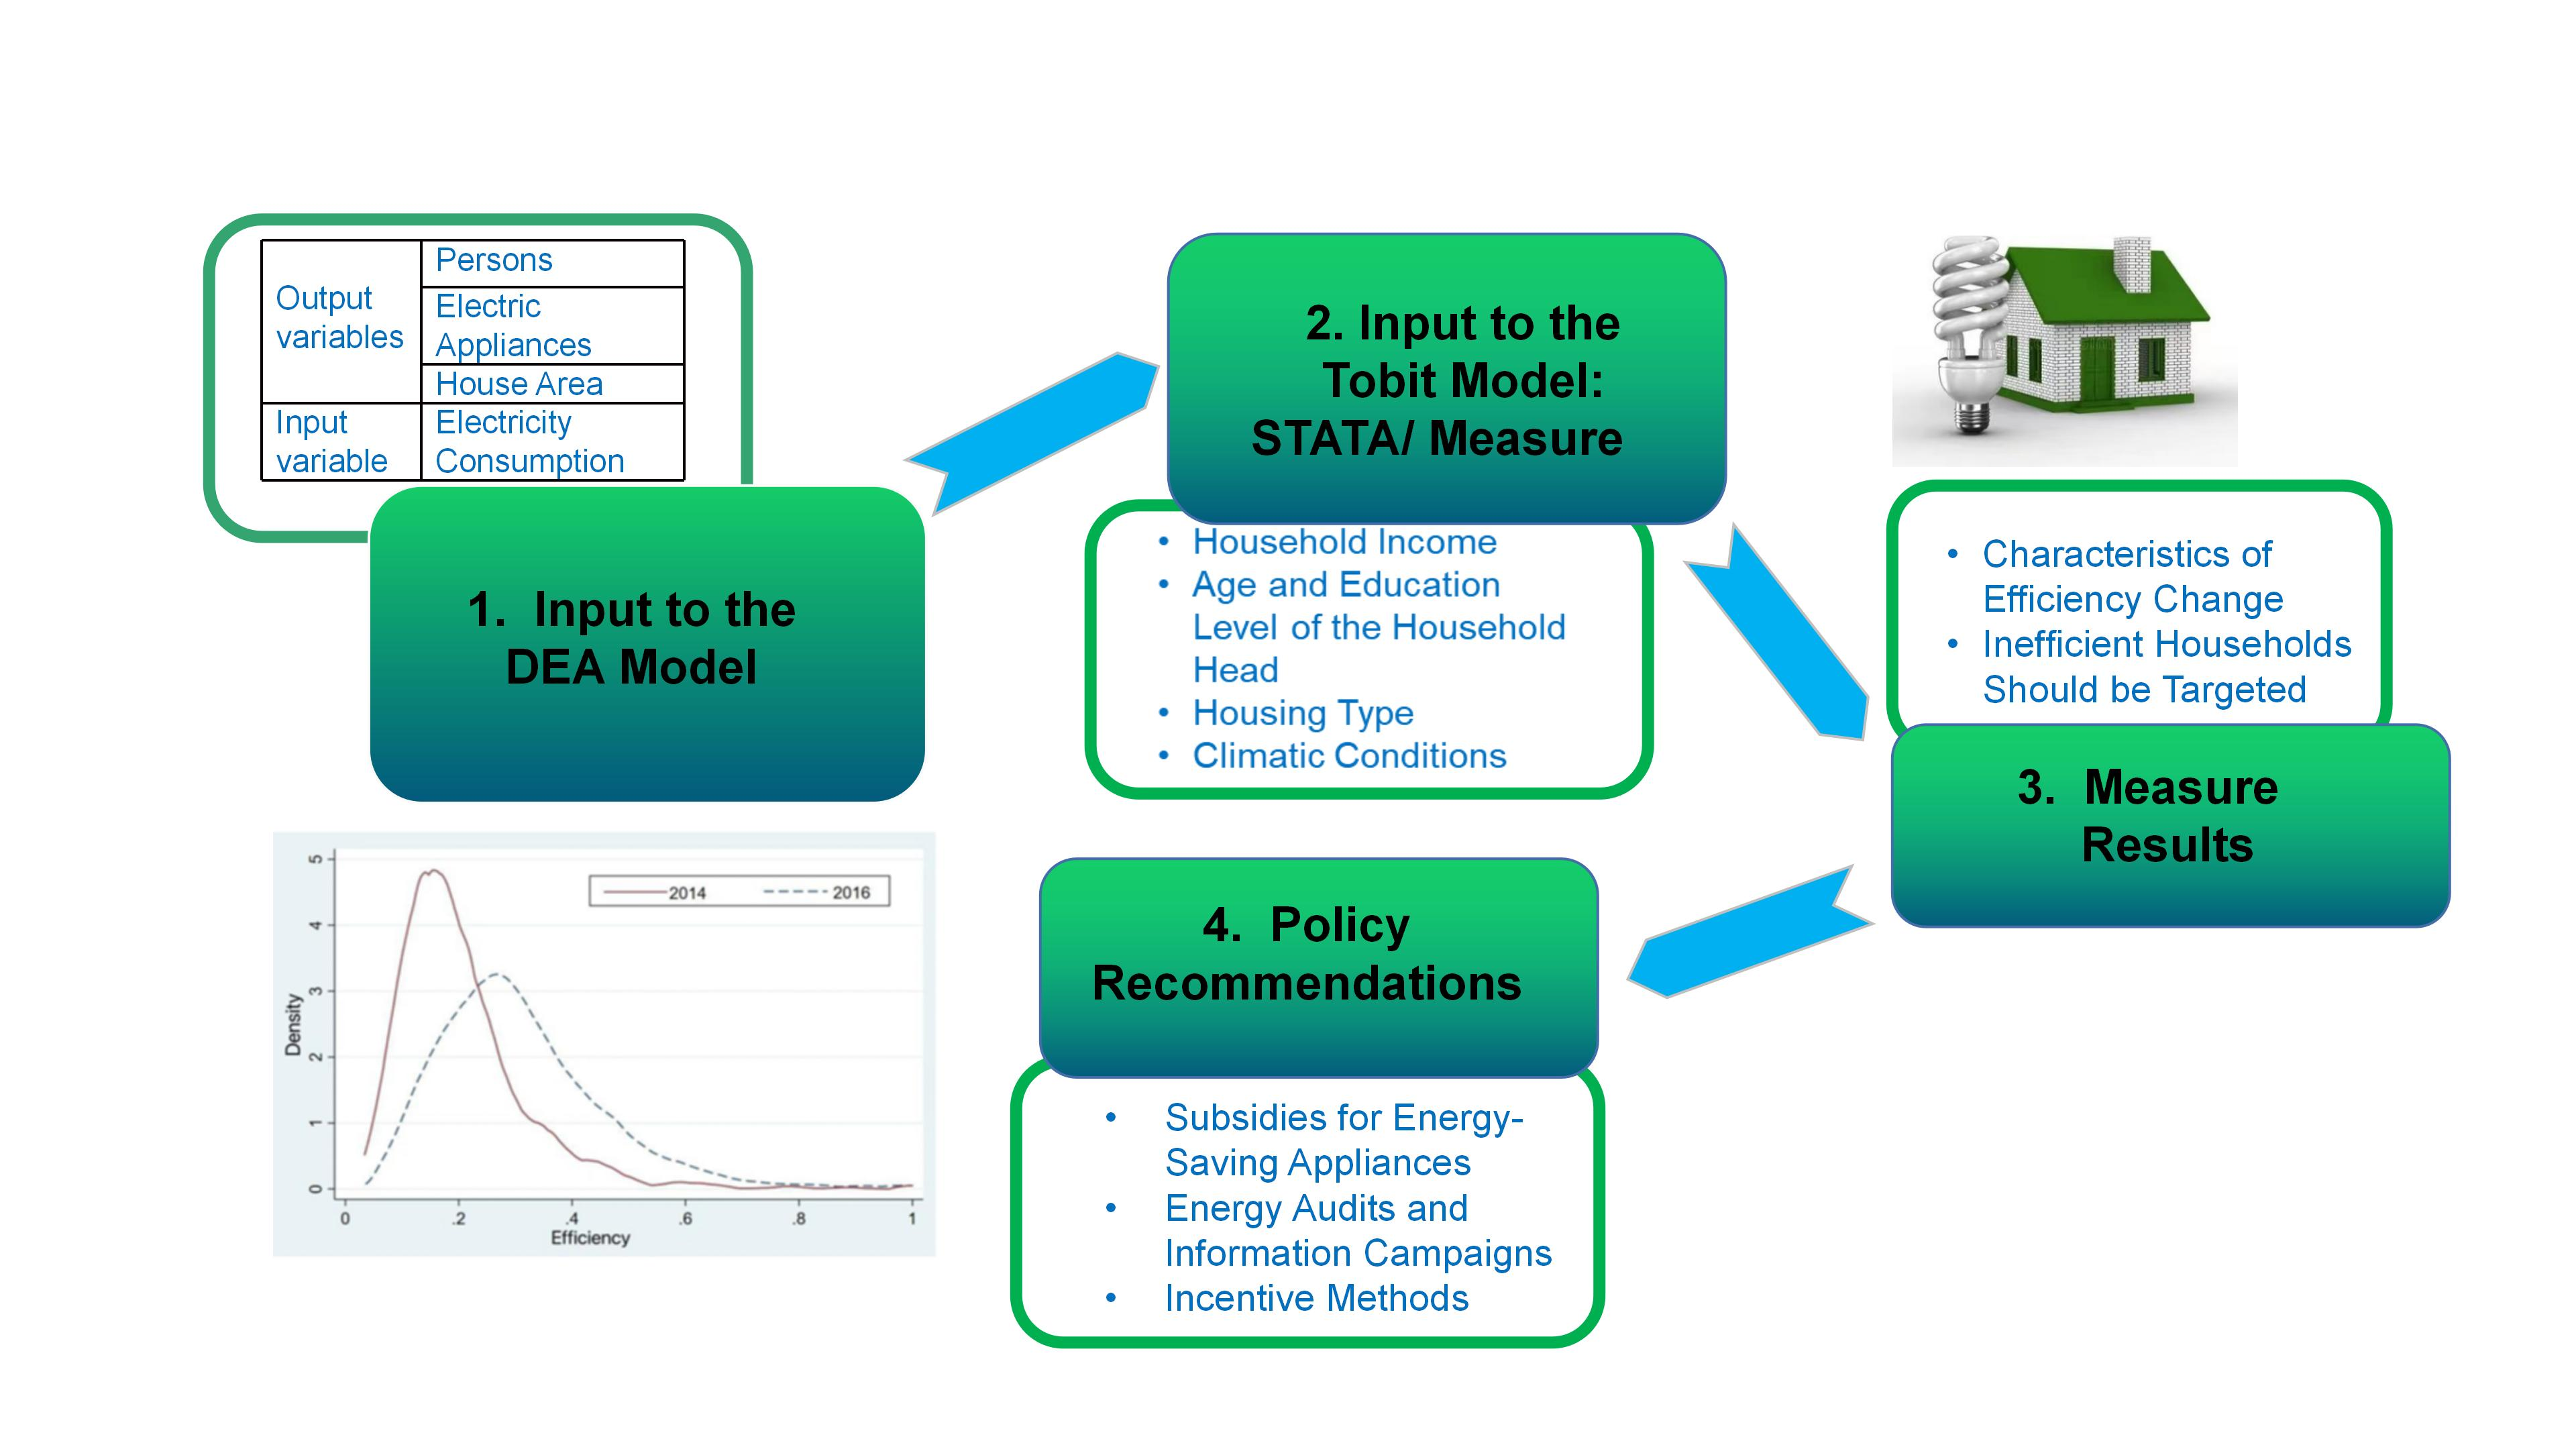
3.1. Household’s Energy Efficiency and DEA Methods

Farren (1957) first suggested that the production frontier could be estimated by constructing a nonparametric linear convex surface [55]. It was not until Charnes et al. (1978) developed a DEA model based on Constant Return to Scale (CRS) to study the technical efficiency of K factors required by N decision units to produce M outputs [56], which was followed by the DEA software developed by Coelli (1996) and attracted widespread attention [57]. Later, Banker, Chame, and Coopev (1984) extended the assumption of the Constant Return to Scale (CRS) model and proposed a DEA model based on Variable Returns to Scale (VRS) [58].
DEA analysis is a mathematical process that uses linear programming to evaluate the efficiency of the decision-making unit (DMU). The objective is to construct a nonparametric envelope front line with the efficient point on the production frontier and the inefficient point below the frontier. Assuming that there are N DMUs and each element uses K input to produce M outputs, the efficiency of the i-th DMU is solving linear programming problems with multiple inputs and multiple outputs in a fixed time period, which can be denoted as scalar Θ. According to Charnes et al. (1978) [56], the scalar Θ can be expressed according to the CRS model that takes the following general form.
m a x Θ = j u j s j j v k e k
The weights u and v are the weights of the output quantity sj (j = 1, …, J) and the input quantity ek (k = 1, …, K), respectively, indicating that each household can use all energy inputs e to produce at least one services.
If (Θ, u, v) is used to describe the optimal solution for the average household in Equation (1), then Θe is used to measure the amount of energy used by the average household to produce services, and energy use is efficient. Considering the input-based DEA model under the CRS assumptions as in Figure 1, Θ = 1 indicates the (technical) efficiency frontier, and if 0 < Θ < 1, the average household can reduce its energy consumption by (1 − Θ)% without reducing the household service level, that is to say reducing (1 − Θ)e units of consumption, it indicate that the same service level can be maintained by increasing energy efficiency, and the energy-saving potential corresponding to the distance from the average household to the best-practice frontier in Figure 1.

3.2. Tobit Regression Model

In order to understand the main determinants of household electricity efficiency, the two-step approach was derived based on DEA analysis [59]. The first step is to assess the efficiency value of the decision unit and then use the Tobit regression model to measure the influence degree of determinants in the second step. Since the efficiency value calculated by the DEA model does not have a value of 0, and the observed value of the explained variable can only be obtained within the range greater than 0, the Bootstrap truncated regression model can be used to avoid the problem of biased and inconsistent parameter estimates, although the Tobit model is a commonly used model [60]. We, therefore, provide the results of the Tobit model while using the Bootstrap truncated regression model as a robustness test. The specific model is as follows.
Θ h = β z h + ε ,   h = 1 , 2 , ,
Here Θ is the household electricity consumption efficiency, z are the explanatory variables, h is the household, ε is the disturbance term, and n is the sample size. In order to ensure the accuracy of the calculation results, the number of Bootstrap is set to 2000 iterations in practice.

3.3. Data Sources and Statistical Description

Based on the availability, we use the 2014 and 2016 China Labor Force Dynamics Survey data, which is organized by the Center for Social Survey of Sun Yat-sen University, China. The most important reason for choosing the dataset is that it can provide not only the electricity consumption of each household but also the demographic, social, and economic characteristics of the household and housing characteristics, such as household size, housing area, and the number of electrical appliances, which can be useful for conducting more accurate and economically meaningful statistical analysis. We also remove missing, incomplete data and rural data. Considering that the house layout has an impact on the electricity consumption efficiency, we only use data from households who live in a two-bedroom house, which is the layout of most sample families. All data have 3232 samples and cover 29 provinces, including 1952 samples in 2014 and 1280 samples in 2016. This also makes the limitation of this paper that our results can only reflect the energy efficiency characteristics and determinants of Chinese households in 2014 and 2016. We could make more realistic policy recommendations if we could use the latest Chinese general survey data and include a larger sample size, which is one of the future research directions.
We use the DEA method to measure household electricity consumption efficiency. Referring to Grösche P (2009), we choose annual household electricity consumption as the input variable and use household size, number of appliances, and housing area as the output variables [19]. Household size can be used as a proxy variable for energy demand in terms of hot water, cooking, etc. The housing area is used as a proxy variable for energy demand for cooling, heating, and lighting. Considering the energy consumption of different appliances, we aggregate the number of color TVs, air conditioners, washing machines, DVD players, VCD players, and computers as a proxy for the number of household appliances. It measures the electricity consumption efficiency with Deap2.1 software, and Table 1 shows the statistical description of all the input and output variables that are entered into the DEA model.
We use two years of data to obtain each household’s electricity consumption efficiency results Θ separately. If the electricity consumption efficiency improved during 2014–2016, it should be reflected in the empirical distribution of post-year trends with larger efficiency values, and household socioeconomic, housing, and climate characteristics are included in the second-step regressions. According to the sample distribution characteristics, we classify household income as low income (less than 10 ten thousand yuan), middle income (10–20 ten thousand yuan) and high income (more than 20 ten thousand yuan), and age of household heads is divided into young (20–40 years old), middle-aged (40–60 years old) and old (>60 years old). We also divided the education level of the household head into elementary school, junior high school, high school, university, and above. The housing type is divided as whether it is new housing (1 = yes, 0 = no). We choose heating degree days (HDD) and cooling degree days (CDD) as proxy variables for climatic conditions. Referring to Liu et al. (2022), 18 °C and 26 °C are equilibrium point temperatures for constructing CDD and HDD indicators [61], and the data come from China Meteorological Data Network (http://data.cma.cn/, accessed on 4 August 2022). We ran regressions using mixed data with 2014 and 2016 to obtain the effects of household socioeconomic, housing, and climate characteristics on household electricity efficiency, and then the above variables interacted with time dummy variables of 2016 so that the determinants of household electricity efficiency improvement in 2016 could be obtained. In general, all estimated coefficients should be positive if efficiency is improved.

4. Results

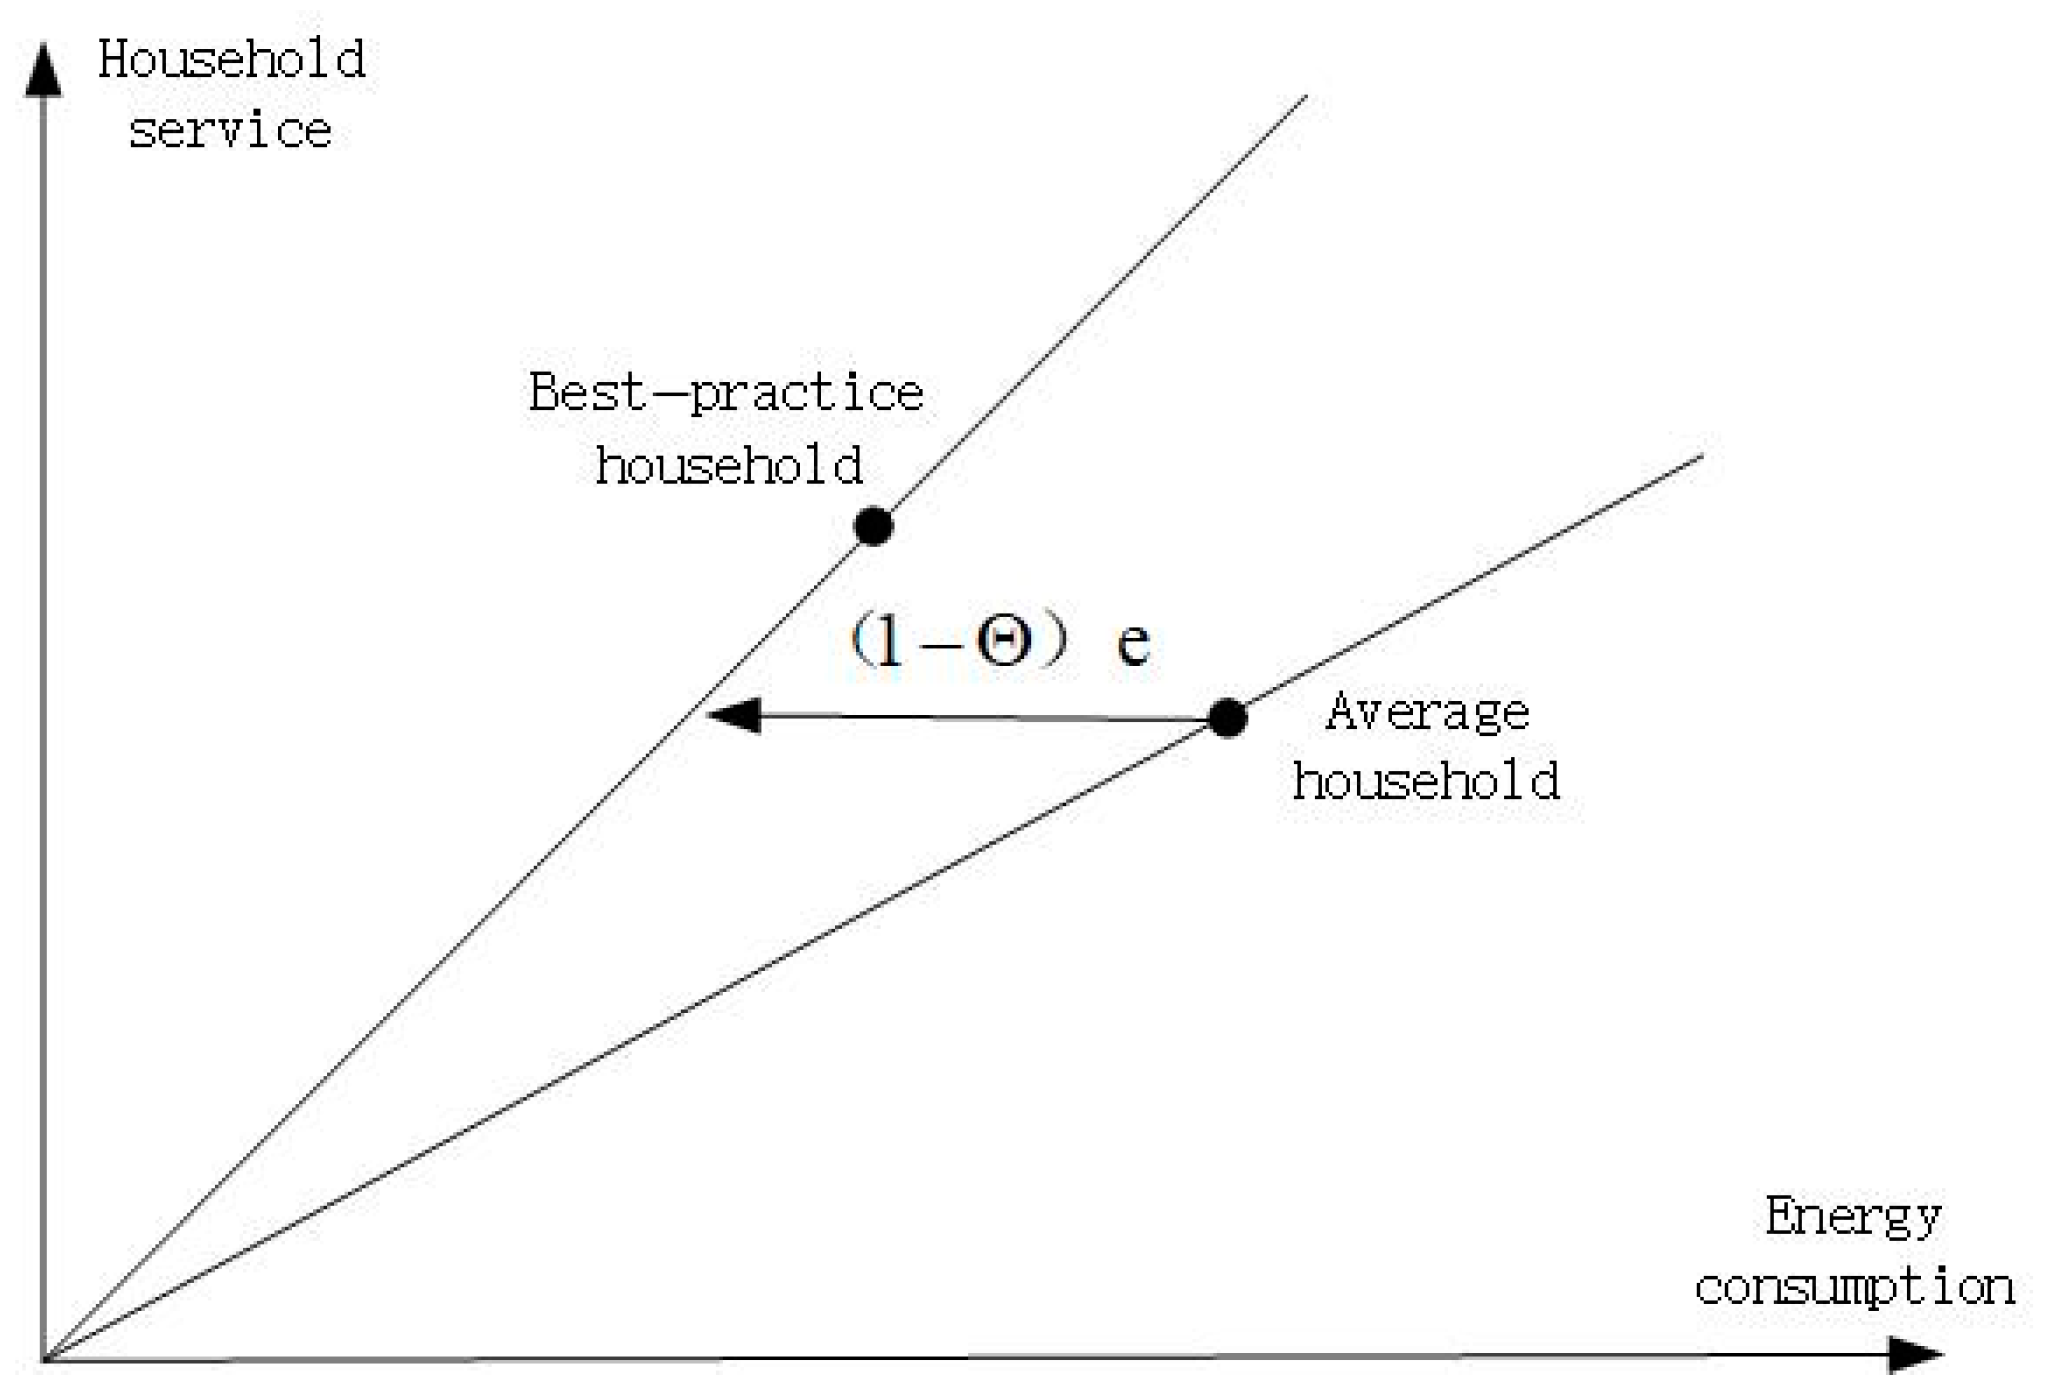
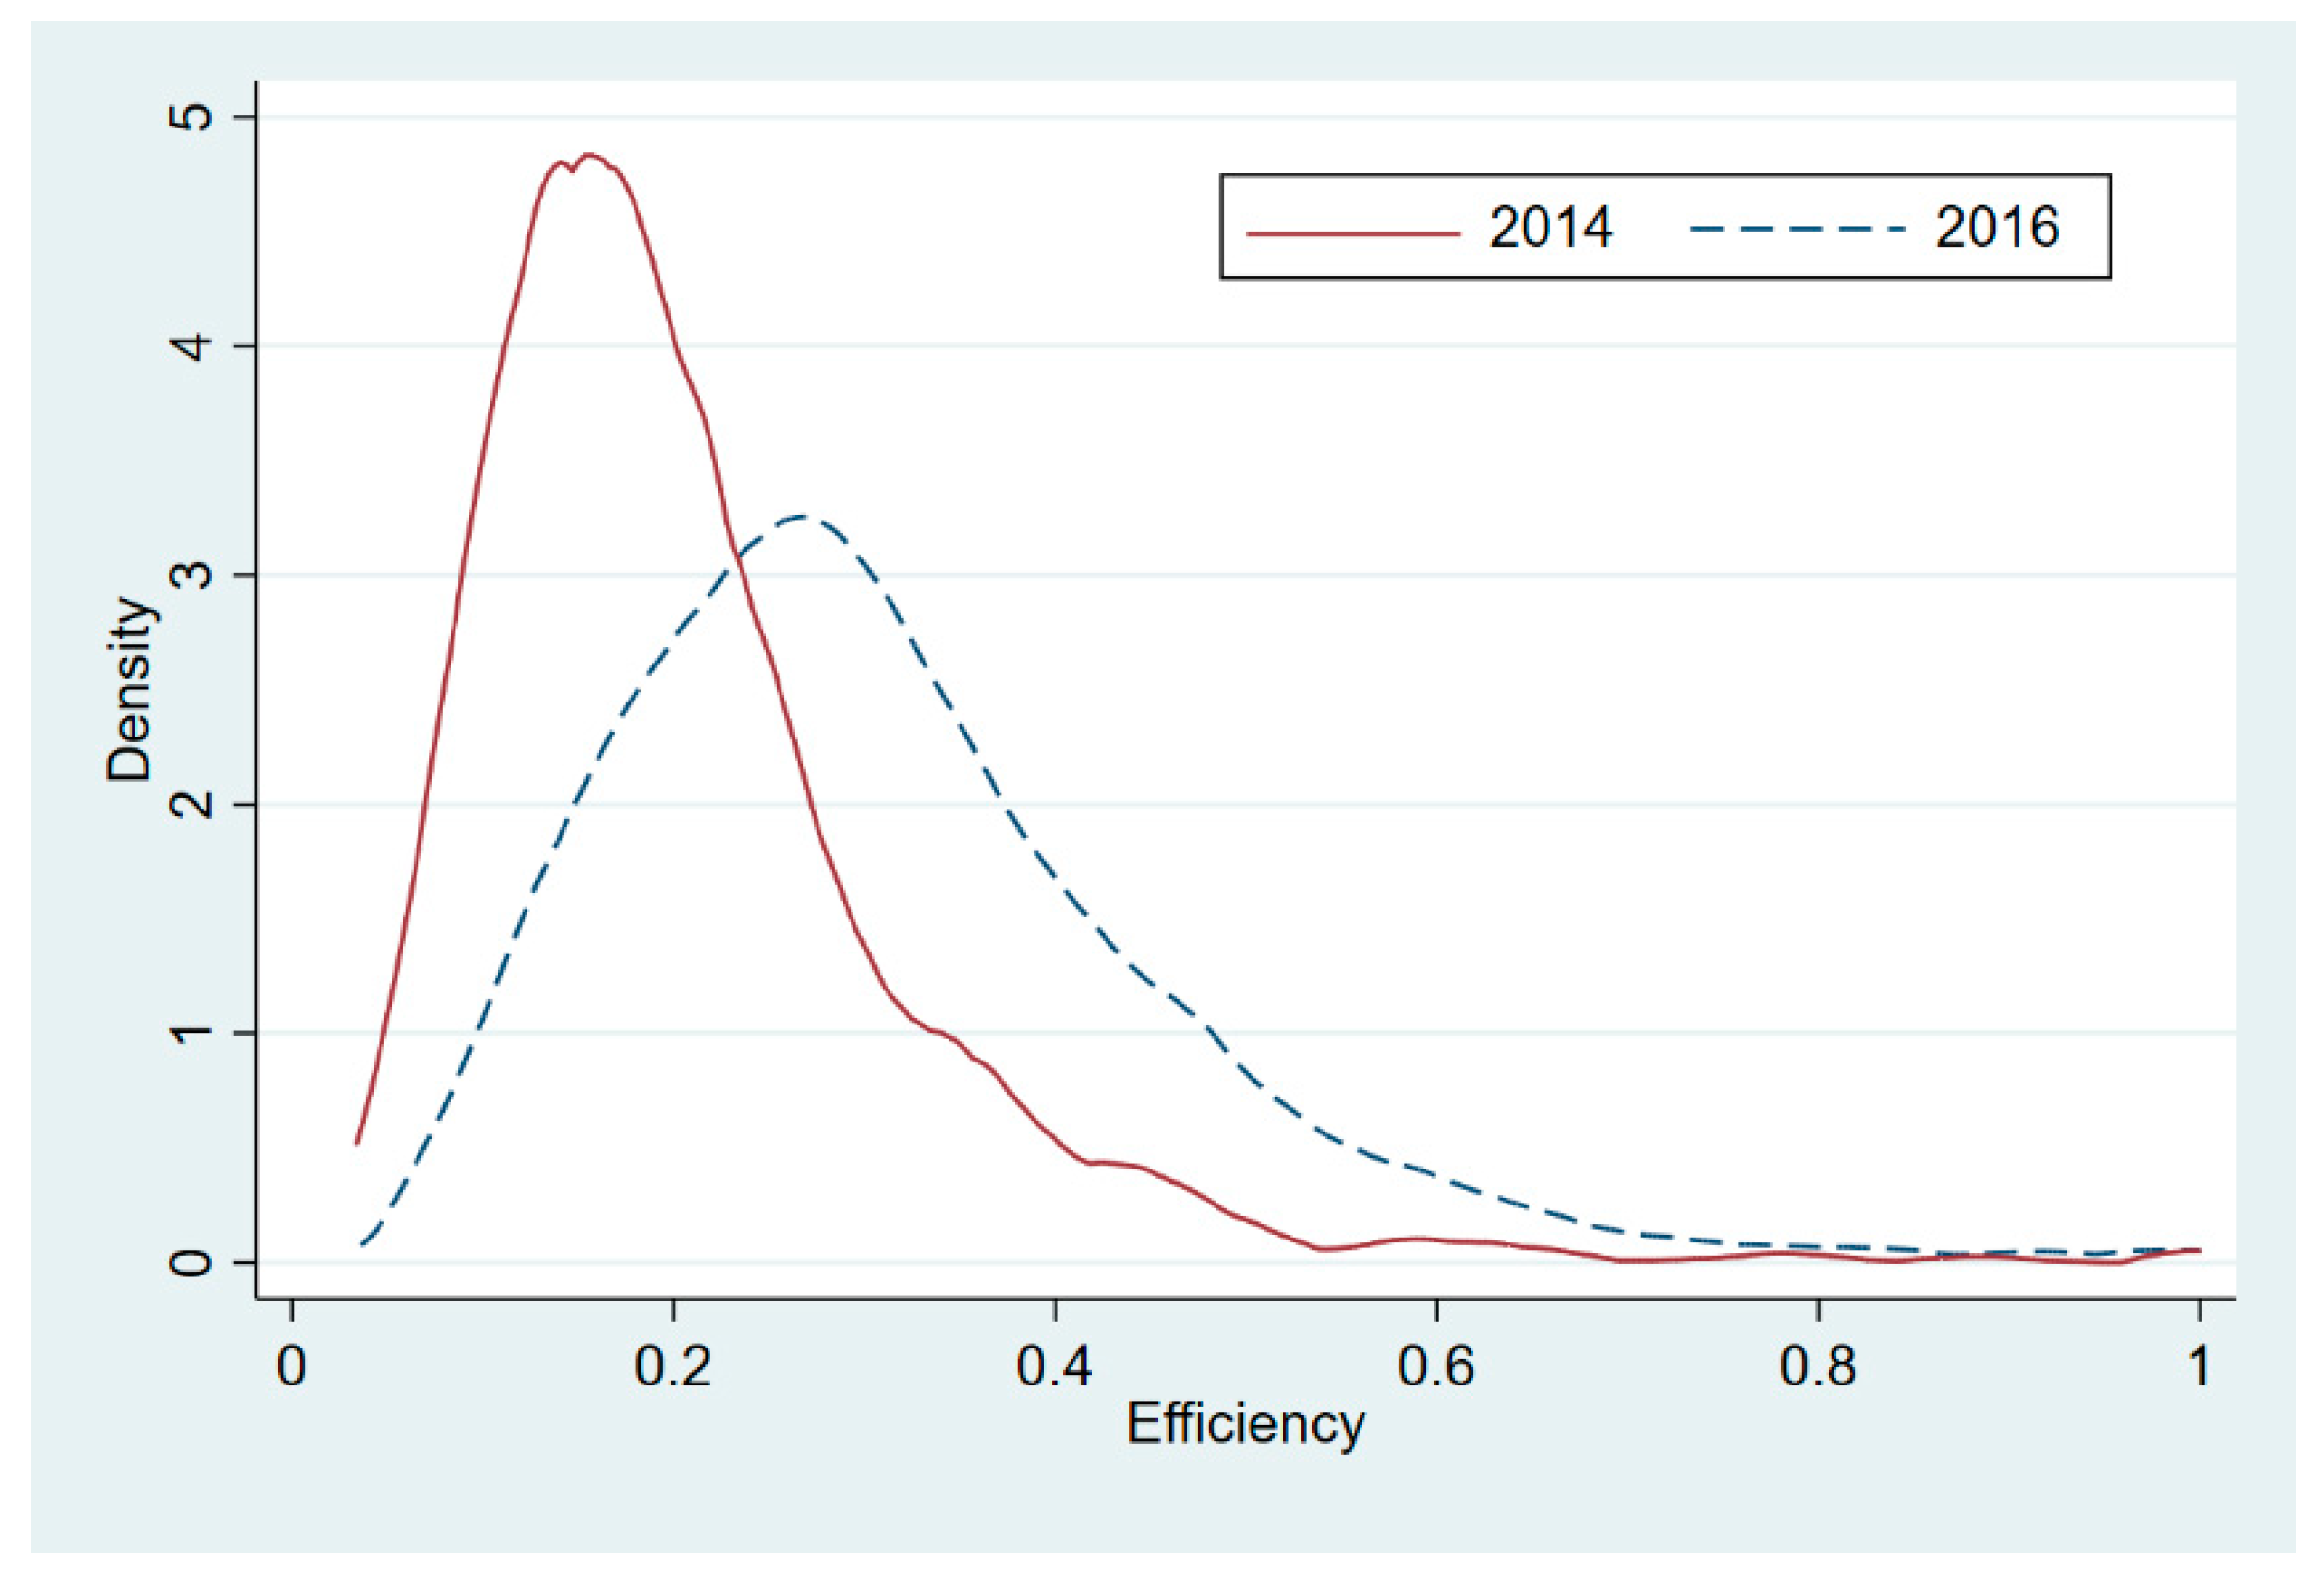
4.1. Characteristics of Household Electricity Consumption Efficiency

The efficiency values for both years were obtained in the first step, and most values were within the range of 0 to 0.6. The average efficiency value for 2014 was 0.176, 89%, 9%, and 2% of households' efficiency values are below 0.6, between 0.6–1 and 1, respectively. The average efficiency value for 2016 was 0.234, 86%, 11%, and 3% of values are below 0.8, between 0.8–1 and 1, respectively. It can be seen that not only the household electricity consumption efficiency has increased, but also the proportion of households whose efficiency values are between 0.6–1 and 1 has also gone up. In Figure 2, it is clear that the kernel density distribution curve in 2016 shifted to the right, indicating that the overall level of household electricity efficiency tended to increase during the sample period. Compared with 2014, the height of the main peak of the kernel density curve in 2016 decreased, the width was greatly expanded significantly, the corresponding efficiency value was larger, and the ductility was stronger, which shows an overall upward trend although the household electricity efficiency fluctuated during the sample period. In addition, there is a long right trailing of the curve in both 2014 and 2016, indicating that there are still more high-efficiency households.

4.2. Analysis of the Influencing Factors on the Household Electricity Efficiency

Here the traditional Tobit regression method is used for estimation, and then the Bootstrap truncated regression model is used as a robustness test. As shown in Table 2, we can see both low-income and middle-income households increase their electricity consumption efficiency. There is not much difference in using more energy for high-income households, especially since many wealthy households prefer to satisfy their needs through enjoying luxury consumption, so the results are not significant. The results for the age of the household head are positive and significant, while the results for the elderly are not significant, which means young and middle-aged household heads are willing to implement energy-saving behaviors. This is consistent with the results of Pais-Magalhães V et al. (2020), who found that increasing the proportion of elderly people reduces households’ electricity consumption in 28 countries of the European Union and the reasons are the elderly spend too much time in the house, which consumes more energy consumption [39]. Then, household heads with high school and above are able to significantly improve household electricity efficiency; that is to say, more educated households have more energy-saving consciousness and are more willing to use energy-saving equipment and technologies. The result of housing type is positive and significant, and new houses always exhibit higher energy efficiency standards, usually using the latest energy-saving technologies such as solar systems, ground source heat pump systems and Low-E insulation windows, etc., which can reduce energy loss due to indoor-outdoor air exchange, and households are willing to use the latest energy-saving appliances in a new home. This is consistent with the results of Yagita, Y. and Iwafune, Y. (2021), who also found that the energy demand for heating is high in older houses in Japan because they do not feature insulation [62]. Both HDD and CDD have negative and significant effects on household electricity efficiency, indicating inefficiency in very cold or very warm areas. Interestingly, the coefficients of CDD2 and HDD2 are significantly positive, which indicates that the household electricity consumption efficiency continues to improve with the demand for heating and cooling, thus implying a “U”-shaped effect with respect to efficiency. Grösche P (2009) also found a “U”-shaped relationship between HDD and household energy efficiency in the U.S., but not for CDD [19].
The determinants of efficiency improvement in 2016 can be obtained in the lower panel of Table 2. We found that household heads whose ages are above 60 were more focused on energy-saving behaviors by changing their energy use habits after three years, and the reason we guess is that they have more social activities and fitness exercise and thus do not spend too much time in the house. The results of the highest-income households become significant, which means more and more of them show a stronger willingness to use green products and technologies with income increase further and are willing to spend money on green consumption. The coefficient of education level is also significant, which means households with high education levels actively respond to the national promotion of energy-saving behavior. The result of household heads with junior high school become significant, which means the income of these households has steadily increased, and they have a strong desire to save energy and respond to the call of the nation.

5. Conclusions and Policy Recommendations

Improving energy efficiency is a key global policy goal for climate protection. We cannot miss the main determinants that can explain changes in household energy efficiency only by conducting a detailed analysis of household-specific end-use consumption. In order to explore whether the electricity consumption efficiency of Chinese urban households has been improved and the driving factors, we use two-step methods to measure the dynamic changes of electricity consumption efficiency in 2014 and 2016 and then explore the main determinants through the Tobit regression model.
Our results show that household electricity efficiency tends to increase over the sample period. Specifically, the average efficiency was from 0.176 in 2014 to 0.234 in 2016. The change in efficiency values is partly due to climate conditions, household characteristics, and housing type have nevertheless improved their electricity consumption efficiency. In particular, it shows significant improvements with middle-and high-income households, young and highly educated heads of households, and living in new houses, while the energy-saving behavior of the elderly household head is a future research direction.
In order to improve energy efficiency, low-income households, head of households with low education levels, and living in second-hand houses should be targeted. For low-income households, this can be achieved through social or energy policies such as subsidies for energy-saving appliances or transfers to them. For the second-hand house, it should be targeted with energy efficiency improvement programs, such as energy audits and information campaigns, which may improve their cost-effectiveness and minimize electricity consumption. As population aging has become a long-term and irreversible trend in China, we should pay special attention to energy saving and consumption reduction for the old community age-appropriate renovation when elderly households will become more common in the future, and such renovation also meets the needs of the elderly. In addition, the government can also use some incentive methods, such as promoting the application of energy labels in appliances, encouraging households to use energy-saving appliances such as inverter air conditioners, and supporting households to use renewable energy technologies such as photovoltaic systems. Grid companies can provide residents with more detailed information about their current electricity bills and increase public awareness, knowledge, attitudes, and norms, which can guide residents to adopt energy-saving behaviors.
We would like to highlight that countries have promoted solar development policies to reduce dependence on fossil fuels in emerging low-carbon societies. Compare the expectations and behavior of Spanish and Italian consumers, Colasante et al. (2022) find that introduction of a bonus for self-consumed energy may enhance the development of photovoltaic systems, a bonus of four cent€ /kWh and a green premium of 10 cent€ /kWh can be obtained [63]. Solar photovoltaic systems installations have a positive impact on house values and transaction prices as well, and the average housing premium price for properties with solar power systems was around $45,000 in Arizona, USA [64]. With regard to China, Jin et al. (2019) found that Beijing residents were willing to pay an average of 5.85 yuan ($0.86) per month per household for the research and development of solar energy [65]. Opposed to “active” design strategies in housing, Zhang X et al. (2011) found that passive design strategies, such as solar heating appliances, are comparatively inexpensive. Real estate developers believe that the application of green strategies such as solar systems can help build a competitive advantage, for example, helping to gain a reputation, reducing construction and operating costs, and increasing access to finance [66]. The combination of monetary and non-monetary instruments mentioned above can facilitate the transition from conventional energy sources to solar installations and increase the self-consumption of energy. On the one hand, policymakers can undertake information campaigns to undermine existing technologies by highlighting their shortcomings, for example, stimulate consumer behavior by disseminating information about the economic and environmental advantages of solar technologies. If non-monetary incentives are mainly used to change individuals’ perceptions of solar energy, monetary incentives will help change their consumption habits. Subsidies can increase consumer acceptance of solar energy. Yang and Zhao (2015) found that Chinese consumers with higher incomes and familiarity with subsidy policies promote a shift in willingness to purchase energy-efficient and renewable energy equipment, such as solar water heaters. However, the price of subsidized equipment is still high for low-income households [67], and it is a future research direction with a focus on the precise economic and social impact of subsidies on low-income consumers.
All potential measures need to be evaluated individually, and it is unclear whether they ultimately achieve results. For example, the Ministry of Commerce has conducted activities such as exchanging old appliances for new ones to expand the sales of energy-saving appliances and green products, Wang et al. (2022) found that government provision of incentives does not necessarily lead to consumer participation in the collection and recycling of used appliances, this could lead to consumer participate in this activity as long as the government strictly monitors and adopts severe penalties even without incentives [68]. In addition, there is a partial rebound effect in the household electricity consumption efficiency in China that can make some of the energy savings from energy efficiency improvements be offset, Liu et al. (2022) argue that the reform of tiered pricing for household electricity will decrease the rebound effect and electricity consumption [69]. It can be analyzed in depth in the future with how to focus on long-term measures such as energy efficiency regulations and changes in the usage habits of energy-saving appliances, which can clarify the mechanism and provide more effective information for policymakers.

Author Contributions

Writing—original draft preparation, methodology, and validation, Z.L. and L.L.; Data curation and resources, L.L. and Z.Z.; conceptualization and writing—review and editing, Z.L., L.L. and Z.Z. All authors have read and agreed to the published version of the manuscript.

Funding

This research has received funding from the National Natural Science Foundation of China (no. 72074175, 72174071 and 71774066); Youth Foundation Project for Humanities and Social Sciences Research of Ministry of Education of China (no. 19YJCZH094); Key project of Shaanxi Provincial Department of Education of China (no. 19JZ042).

Data Availability Statement

Publicly available datasets were analyzed in this study. The survey data can be found here: (http://css.sysu.edu.cn/, accessed on 10 May 2022).

Conflicts of Interest

The authors declare no conflict of interest.

References

  1. Mallapaty, S. How China could be carbon neutral by mid-century. Nature 2020, 586, 482–484. [Google Scholar] [CrossRef] [PubMed]
  2. IEA. World Energy Outlook 2008; International Energy Agency Bookshop: Paris, France, 2008; pp. 99–116. [Google Scholar]
  3. Mckinsey. Preparing for China’s Urban Billlion. Mckinsey Global Institute. Available online: https://www.mckinsey.com/featured-insights/urbanization/preparing-for-chinas-urban-billion (accessed on 13 June 2022).
  4. Sinton, J.E.; Levine, M.D. Changing energy intensity in Chinese industry: The relatively importance of structural shift and intensity change. Energy Policy 1994, 22, 239–255. [Google Scholar] [CrossRef]
  5. Li, M.J.; Tao, W.Q. Review of methodologies and polices for evaluation of energy efficiency in high energy-consuming industry. Appl. Energy 2017, 187, 203–215. [Google Scholar] [CrossRef]
  6. Wang, R.; Wang, Q.; Yao, S. Evaluation and difference analysis of regional energy efficiency in China under the carbon neutrality targets: Insights from DEA and Theil models. J. Environ. Manag. 2021, 293, 112958. [Google Scholar] [CrossRef]
  7. Zheng, S.; Wang, R.; Glaeser, E.L.; Kahn, M.E. The greenness of China: Household carbon dioxide emissions and urban development. J. Econ. Geogr. 2011, 11, 761–792. [Google Scholar] [CrossRef] [Green Version]
  8. Lin, B.; Zhu, P. Measurement of the direct rebound effect of residential electricity consumption: An empirical study based on the China family panel studies. Appl. Energy 2021, 301, 117409. [Google Scholar] [CrossRef]
  9. Wang, Q.Y. 2020 Energy Data. Green Innovation Development Center: Beijing. Available online: https://www.efchina.org/Reports-zh/report-lceg-20210430-3-zh (accessed on 9 July 2022).
  10. Zheng, X.Y.; Wei, C. China Household Energy Consumption Research Report 2016; Science Press: Beijing, China, 2016; pp. 53–54. [Google Scholar]
  11. Deng, H.H.; Wang, H.N. New advances in research on low-carbon consumption of households from the perspective of behavioral economics. Econ. Perspect. 2020, 707, 128–141. [Google Scholar]
  12. IEA. Promoting Energy Efficiency Investments: Case Studies in the Residential Sector; International Energy Agency Bookshop: Paris, France, 2008; pp. 23–28. [Google Scholar]
  13. Du, K.R.; Yan, Z.M.; Yang, Z.M. Progress of Evaluation Methods on Energy and Environmental Performance. J. Environ. Econ. 2018, 3, 113–138. [Google Scholar] [CrossRef]
  14. Becker, G. A theory of the allocation of time. Econ. J. 1965, 75, 493–517. [Google Scholar] [CrossRef] [Green Version]
  15. Patterson, M.G. What is energy efficiency? Concepts, indicators and methodological issues. Energy Policy 1996, 24, 377–390. [Google Scholar] [CrossRef]
  16. Haas, R. Energy efficiency indicators in the residential sector: What do we know and what has to be ensured? Energy Policy 1997, 25, 789–802. [Google Scholar] [CrossRef]
  17. Evans, M.; Yu, S.; Song, B.; Deng, Q.; Liu, J.; Delgado, A. Building energy efficiency in rural China. Energy Policy 2014, 64, 243–251. [Google Scholar] [CrossRef]
  18. Andor, M.; Hesse, F. The StoNED age: The departure into a new era of efficiency analysis? A monte carlo comparison of StoNED and the “oldies” (SFA and DEA). J. Product. Anal. 2014, 41, 85–109. [Google Scholar] [CrossRef] [Green Version]
  19. Grösche, P. Measuring residential energy efficiency improvements with DEA. J. Product. Anal. 2009, 31, 87–94. [Google Scholar] [CrossRef] [Green Version]
  20. Andor, M.A.; Parmeter, C.; Sommer, S. Combining uncertainty with uncertainty to get certainty? Efficiency analysis for regulation purposes. Eur. J. Oper. Res. 2019, 274, 240–252. [Google Scholar] [CrossRef] [Green Version]
  21. Andor, M.A.; Bernstein, D.H.; Sommer, S. Determining the efficiency of residential electricity consumption. Empir. Econ. 2021, 60, 2897–2923. [Google Scholar] [CrossRef]
  22. Reddy, B.S.; Nathan, H.S.K. Energy in the development strategy of Indian households—The missing half. Renew. Sustain. Energy Rev. 2013, 18, 203–210. [Google Scholar] [CrossRef] [Green Version]
  23. Ewing, R.; Rong, F. The impact of urban form on US residential energy use. Hous. Policy Debate 2008, 19, 1–30. [Google Scholar] [CrossRef]
  24. Sun, H.; Shen, J.; Peng, L.X.; Nie, F.F.; Yu, S.W. Study on the spatial effects of residential energy consumption in China’s provinces. Sci. Res. Manag. 2016, 37, 82–91. [Google Scholar] [CrossRef]
  25. Hu, Z.; Wang, Y.; Zhang, Z. Regional characteristics and variation patterns of urban household carbon emissions-a study of 47 cities in Japan. Urban Dev. Res. 2018, 25, 23–28. [Google Scholar] [CrossRef]
  26. Weyman-Jones, T.; Boucinha, J.M.; Inácio, C.F. Measuring electric energy efficiency in Portuguese households: A tool for energy policy. Manag. Environ. Qual. Int. J. 2015, 26, 407–422. [Google Scholar] [CrossRef]
  27. Broadstock, D.C.; Li, J.; Zhang, D. Efficiency snakes and energy ladders: A (meta-) frontier demand analysis of electricity consumption efficiency in Chinese households. Energy Policy 2016, 91, 383–396. [Google Scholar] [CrossRef] [Green Version]
  28. Orea, L.; Llorca, M.; Filippini, M. A new approach to measuring the rebound effect associated to energy efficiency improvements: An application to the US residential energy demand. Energy Econ. 2015, 49, 599–609. [Google Scholar] [CrossRef] [Green Version]
  29. Alberini, A.; Filippini, M. Transient and persistent energy efficiency in the US residential sector: Evidence from household-level data. Energy Effic. 2018, 11, 589–601. [Google Scholar] [CrossRef] [Green Version]
  30. Boogen, N.; Cattaneo, C.; Filippini, M.; Obrist, A. Energy efficiency and the role of energy-related financial literacy: Evidence from the European residential sector. Energy Effic. 2021, 14, 40. [Google Scholar] [CrossRef]
  31. Firoz, A.; Khan, M.M.K.; Rasul, M.G. A Comparative Study of Residential Household Energy Consumption in Australia and the USA. Int. J. Mech. Mater. Eng. 2008, 3, 127–132. [Google Scholar]
  32. Ebrahimi, M. Enhancing residential energy efficiency enhancement: Through the use of system dynamics. Int. J. Sustain. Soc. 2019, 11, 162–185. [Google Scholar] [CrossRef]
  33. Chen, Q.; Yang, H.; Wang, W.; Liu, T. Beyond the city: Effects of urbanization on rural residential energy intensity and CO2 emissions. Sustainability 2019, 11, 2421. [Google Scholar] [CrossRef] [Green Version]
  34. Sun, Y. The influence of household heterogeneity factors on urban residents’ energy use behavior. J. Beijing Univ. Technol. (Soc. Sci. Ed.) 2013, 15, 23–28. [Google Scholar] [CrossRef]
  35. Kalia, P.; Zia, A.; Mladenović, D. Examining country development indicators and e-waste under the moderating effect of country development levels and e-waste policy. Int. J. Qual. Reliab. Manag. 2021, 39, 1601–1616. [Google Scholar] [CrossRef]
  36. Romero-Jordán, D.; del Río, P. Analyzing the drivers of the efficiency of households in electricity consumption. Energy Policy 2022, 164, 112828. [Google Scholar] [CrossRef]
  37. Zia, A.; Alzahrani, M.; Alomari, A.; AlGhamdi, F. Investigating the Drivers of Sustainable Consumption and Their Impact on Online Purchase Intentions for Agricultural Products. Sustainability 2022, 14, 6563. [Google Scholar] [CrossRef]
  38. Menz, T.; Kühling, J. Population aging and environmental quality in OECD countries: Evidence from sulfur dioxide emissions data. Popul. Environ. 2011, 33, 55–79. [Google Scholar] [CrossRef]
  39. Pais-Magalhães, V.; Moutinho, V.; Robaina, M. Households’ electricity consumption efficiency of an ageing population: A DEA analysis for the EU-28. Electr. J. 2020, 33, 106823. [Google Scholar] [CrossRef]
  40. Tong, Q.; Sun, H.; Cheng, J.; Ma, Z. The influence of residents’ energy consumption behavior on residential building energy consumption—A typical residential household in Sydney as an example. J. Beijing Univ. Technol. (Soc. Sci. Ed.) 2017, 19, 9–19. [Google Scholar] [CrossRef]
  41. Mi, L.Y.; Gu, M.; Yang, J.; Yu, X.Y.; Liu, Y. Psychological Motivation of Low Carbonization of Urban Residents’ Energy Consumption Behavior—Example of Xuzhou City, Jiangsu Province. Resour. Sci. 2016, 38, 609–621. Available online: https://kns.cnki.net/kcms/detail/detail.aspx?FileName=ZRZY201604004&DbName=CJFQ2016 (accessed on 11 August 2022).
  42. Dietz, T.; Gardner, G.T.; Gilligan, J.; Stern, P.C.; Vandenbergh, M.P. Household actions can provide a behavioral wedge to rapidly reduce US carbon emissions. Proc. Natl. Acad. Sci. USA 2009, 106, 18452–18456. [Google Scholar] [CrossRef] [Green Version]
  43. Hu, W.; Chen, L.C.; Yan, J.X.; Hu, K.; Chen, S.D. An empirical analysis of factors influencing residents’ non-productive low-carbon consumption behavior-Based on TPB theory. Rural Econ. Sci.-Technol. 2014, 25, 19–21. [Google Scholar] [CrossRef]
  44. Zhang, N.; Xu, W. Analysis of farmers’ domestic electricity consumption based on energy self-selection behavior. Chin. Rural. Econ. 2011, 319, 72–84. [Google Scholar]
  45. Zia, A. Exploring factors influencing online classes due to social distancing in COVID-19 pandemic: A business students perspective. Int. J. Inf. Learn. Technol. 2020, 37, 197–211. [Google Scholar] [CrossRef]
  46. Wu, S.; Zheng, X. Income growth and household energy consumption ladder-a reexamination based on data from the Chinese Rural Household Energy Consumption Survey. Economics 2022, 22, 45–66. [Google Scholar] [CrossRef]
  47. Fazeli, R.; Ruth, M.; Davidsdottir, B. Temperature response functions for residential energy demand—A review of models. Urban Clim. 2016, 15, 45–59. [Google Scholar] [CrossRef]
  48. Zhang, J.; Li, F.; Sun, M.; Sun, S.; Wang, H.; Zheng, P.; Wang, R. Household consumption characteristics and energy-related carbon emissions estimation at the community scale: A study of Zengcheng, China. Clean. Responsible Consum. 2021, 2, 100016. [Google Scholar] [CrossRef]
  49. Wei, C.; Shen, Z. Research on the influencing factors of residents’ energy consumption based on urban-rural perspective. Econ. Theory Econ. Manag. 2019, 348, 4–16. [Google Scholar]
  50. Twerefou, D.K.; Abeney, J.O. Efficiency of household electricity consumption in Ghana. Energy Policy 2020, 144, 111661. [Google Scholar] [CrossRef]
  51. Mansur, E.T. Upstream competition and vertical integration in electricity markets. J. Law Econ. 2007, 50, 125–156. [Google Scholar] [CrossRef] [Green Version]
  52. Yau, Y.H.; Hasbi, S. A review of climate change impacts on commercial buildings and their technical services in the tropics. Renew. Sustain. Energy Rev. 2013, 18, 430–441. [Google Scholar] [CrossRef]
  53. Xie, L.Y.; Chen, F.; Xiang, C.X. Comparison of urban and rural household energy consumption and influencing factors-Example of Zhejiang Province. J. Cent. South Univ. (Soc. Sci. Ed.) 2019, 25, 106–117. [Google Scholar] [CrossRef]
  54. Du, K.; Yu, Y.; Wei, C. Climatic impact on China’s residential electricity consumption: Does the income level matter? China Econ. Rev. 2020, 63, 101520. [Google Scholar] [CrossRef]
  55. Farrell, M.J. The measurement of productive efficiency. J. R. Stat. Soc. Ser. A 1957, 120, 253–281. [Google Scholar] [CrossRef]
  56. Charnes, A.; Cooper, W.W.; Rhodes, E. Measuring the efficiency of decision making units. Eur. J. Oper. Res. 1978, 2, 429–444. [Google Scholar] [CrossRef]
  57. Coelli, T.J. A Guide to DEAP Version 2.1: A Data Envelopment Analysis (Computer) Program, CEPA Working Paper, Department of Econometrics, University of New England, Armidale NSW Australia. 1996. Available online: http://www.owlnet.rice.edu/~econ380/DEAP.PDF (accessed on 17 July 2022).
  58. Banker, R.D.; Charnes, A.; Cooper, W.W. Some Models for Estimating Technical and Scale Inefficiencies in Data Envelopment Analysis. Manag. Sci. 1984, 30, 1078–1092. [Google Scholar] [CrossRef] [Green Version]
  59. Coelli, T.J.; Rao, D.S.P.; Battese, G.E. An Introduction to Efficiency and Productivity Analysis; Kluwer Academic Publishers: Boston, MA, USA, 1998; pp. 122–131. [Google Scholar]
  60. Simar, L.; Wilson, P.W. Estimation and inference in two-stage, semi-parametric models of production processes. J. Econom. 2007, 136, 31–64. [Google Scholar] [CrossRef]
  61. Liu, M.; Li, J.; Meng, K.; Yang, S. How does temperature change affect household energy consumption in the context of climate shocks? Based on demand heterogeneity perspective. J. Xi’an Jiaotong Univ. (Soc. Sci. Ed.) 2022, 42, 1–16. [Google Scholar] [CrossRef]
  62. Yagita, Y.; Iwafune, Y. Residential energy use and energy-saving of older adults: A case from Japan, the fastest-aging country. Energy Res. Soc. Sci. 2021, 75, 102022. [Google Scholar] [CrossRef]
  63. Colasante, A.; D’Adamo, I.; Morone, P. Nudging for the increased adoption of solar energy? Evidence from a survey in Italy. Energy Res. Soc. Sci. 2021, 74, 101978. [Google Scholar] [CrossRef]
  64. Qiu, Y.; Wang, Y.D.; Wang, J. Soak up the sun: Impact of solar energy systems on residential home values in Arizona. Energy Econ. 2017, 66, 328–336. [Google Scholar] [CrossRef]
  65. Jin, J.; Wan, X.; Lin, Y.; Kuang, F.; Ning, J. Public willingness to pay for the research and development of solar energy in Beijing, China. Energy Policy 2019, 134, 110962. [Google Scholar] [CrossRef]
  66. Zhang, X.; Shen, L.; Wu, Y. Green strategy for gaining competitive advantage in housing development: A China study. J. Clean. Prod. 2011, 19, 157–167. [Google Scholar] [CrossRef]
  67. Yang, S.; Zhao, D. Do subsidies work better in low-income than in high-income families? Survey on domestic energy-efficient and renewable energy equipment purchase in China. J. Clean. Prod. 2015, 108, 841–851. [Google Scholar] [CrossRef]
  68. Wang, Z.; Duan, Y.; Huo, J. The impact of government intervention measures on recycling of waste electrical and electronic equipment in China considering consumer decision. Energy Policy 2022, 160, 112697. [Google Scholar] [CrossRef]
  69. Liu, Z.; Zhu, P.; Deng, M.; Yang, D. Estimation of energy efficiency endogeneity, rebound effect asymmetry and emission reduction potential—An empirical analysis based on urban electricity data in China. J. Nanjing Univ. Financ. Econ. 2022, 233, 64–74. Available online: https://kns.cnki.net/kcms/detail/detail.aspx?FileName=NJJJ202201007&DbName=CJFQ2022 (accessed on 17 July 2022).
Figure 1. Household’s energy-saving potential.
Energies 15 07748 g001
Figure 2. Kernel density estimation of household electricity efficiency.
Energies 15 07748 g002
Table 1. Descriptive analysis of input-output variables.
Input-Output Variables20142016
MeanStandard DeviationMeanStandard Deviation
Output variablePersons2.681.133.121.49
(number)
electric
appliances5.051.415.241.38
(number)
house area88.8145.0789.9263.04
(m2)
Input variableElectricity2036240.62183332.6
consumption
(kWh)
Table 2. Regression results.
Tobit RegressionBootstrapped Truncated Regression
Income Levels (Ten Thousand Yuan)
<100.015 *0.019 *
(1.82)(1.86)
10–200.009 **0.008 **
(2.03)(2.06)
Above 200.0030.005
(0.02)(0.03)
Age
20–400.003 **0.004 **
(2.14)(2.16)
40–600.037 ***0.042 ***
(3.32)(3.36)
Above 600.0020.008
(0.02)(0.03)
Educational Level
Primary School 0.0320.026
(0.01)(0.02)
Junior High School 0.0130.011
(0.009)(0.008)
High School0.029 ***0.028 ***
(2.91)(2.87)
University and Above0.077 ***0.073 ***
(3.03)(3.11)
Housing Type0.027 ***0.026 ***
(5.26)(5.41)
Climatic Conditions
HDD−0.00042 ***−0.00041 ***
(−4.52)(−4.53)
CDD−0.00033 ***−0.00034 ***
(−3.17)(−3.22)
HDD20.0000084 ***0.0000081 ***
(3.92)(3.87)
CDD20.000003 ***0.0000032 ***
(2.68)(2.74)
Constant0.310 ***0.308 ***
(2.67)(2.78)
Interaction with Dummy for 2016
Income Level (Ten Thousand Yuan)
<100.0120.018
(0.02)(0.01)
10–200.005 **0.007 **
(2.23)(2.43)
Above 200.007 **0.008 **
(1.99)(2.03)
Age
20–400.042 **0.038 **
(2.26)(2.29)
40–600.0150.014
(0.78)(0.82)
Above 600.050 **0.043 **
(2.32)(2.37)
Educational Level
Primary School0.0050.001
(0.02)(0.01)
Junior High School0.026 **0.027 ***
(2.11)(2.06)
High School0.037 ***0.036 ***
(3.03)(3.01)
University and Above0.081 ***0.081 ***
(3.41)(3.62)
Housing Type0.024 ***0.023 ***
(5.37)(5.44)
Climate Conditions
HDD−0.00041 ***−0.00044 ***
(−4.49)(−4.50)
CDD−0.00027 ***−0.00039 ***
(−3.32)(−3.27)
HDD20.0000077 ***0.0000067 ***
(3.84)(3.87)
CDD20.0000022 ***0.0000024 ***
(2.69)(2.71)
Constant0.303 **0.305 ***
(2.41)(2.78)
Note: Tobit regressions with t-values in parentheses and Bootstrap truncated regressions with z-values in parentheses; *, **, and *** represent the significance levels of 10%, 5%, and 1%, respectively.
Publisher’s Note: MDPI stays neutral with regard to jurisdictional claims in published maps and institutional affiliations.

