Article

Eradication of Solar Power Unsustainability through Cost-Benefit Analysis: KwaZulu Natal Case Study

by
Bantubenzani Nelson Mdlolo
* and
Oludolapo Akanni Olanrewaju
Department of Industrial Engineering, Durban University of Technology, Durban 4001, South Africa
*
Author to whom correspondence should be addressed.
Energies 2022, 15(20), 7554; https://doi.org/10.3390/en15207554
Submission received: 8 September 2022 / Revised: 3 October 2022 / Accepted: 11 October 2022 / Published: 13 October 2022

Abstract

:
As a developing country, South Africa relies on electricity as the most critical amenity needed for development. KwaZulu-Natal (KZN) is one of the nine provinces in South Africa that faces an energy supply challenge. KZN is also the warmest province among them all due to its location. As one of the warmest provinces, solar power could be utilised to assist in dealing with the energy crisis. This paper focuses on the cost uncertainties attributed to the implementation of solar power which will assist in meeting the demand of energy in the region. The unsustainability of energy has led to a near collapse of the region’s economy. This study also contributes to improving the scientific implementation of solar power in the region to deal with the unsustainability criteria observed. The employment of Cost Benefit Analysis (CBA) revealed solar power as one of the most reliable renewable energies for planned implementation bases. With the development of the Economical, Methodological and Environmental (EME) strategic framework which addresses all social cohesion of solar power, the early turn around has been seen through the use of cost-benefit analysis (CBA) in the region of KZN.

1. Introduction

Based on the economic state of the countries in the African continent where most of the countries if not all are still developing, energy becomes the most critical tool to develop the economy of such countries. Obaideen [1] believes that owning energy from the onset will yield economic and political incentives and improve the state of energy production. Fossil fuels remain the most reliable source of energy in a developing country such as South Africa. The challenges faced by other sources of energy make fossil fuels the most reliable source, even though it has a negative impact of emancipating a lot of carbon dioxide (CO₂) from the energy mix [1]. Coal has been the main source of fossil fuel in South Africa ever since the establishment of electricity which contributed massively to climate change [2]. Climate change caused by human beings is easily controllable compared to that of fossil fuel at the moment. Energy has often been one of the most vital issues for economic parties including countries, policymakers, economies, and people. Sustaining social-economic development is very crucial for modern energy services, depending on the relationship of energy and human development [3]. Looking back from the previous centuries, the world has become more globalized [4].
South Africa has joined other countries by contributing negatively to the environment through producing energy from fossil fuels. In the study of empirical analysis, the question of empirical level was not addressed properly [5]. Despite having regions such as KZN take part in the implementation of renewable energy, there still has been no Renewable Energy (RE) implementation improvement even when Currie et al. [3] conducted solar PV rapid technological evolution to demonstrate future-cost assumption through the Integrated Assessment Modelling (IAM). The energy sustainability development challenge is as a result of the rise in emerging nations [6]. The high level of unsustainability in the fossil fuel energy field has led to the importance of the study. There is a random scheduling of load shedding over the past decade due to Eskom’s (South Africa’s power utility provider) power failure caused by the shortage of energy generating material, e.g., coal [7].
Renewable energy has been facing the sustainability challenge that needs an effective response. However, Sakah et al. [8] have developed Sustainable Development Goals (SDGs) to promote sustainability overall, but energy has not been updated accordingly.
KZN contributes to solar energy significantly in South Africa as it always has a high temperature [9,10]. Western Cape has successfully implemented solar energy with a contempt that reflects KZN’s inadequacy to sustain solar power which led to unavailability of sponsors for any solar project in the region. Sunlight in KZN is more than enough to run solar energy in the province. Another region (Northern Cape) has been believed to have high concentration of solar and implemented a very large solar Concentrated Solar Power (CSP) with numerous financial support.
Only a few sectors have accepted solar to be exploited worldwide for it to be available, as it consists of minimum cost, and benefits a constructive economy [11]. Over and above, the KZN region is humid and subtropical with a warm winter and very hot summer [12]. Financial stability is one of the main challenges that is expected to hinder solar power’s performance. The main aim is to determine and eradicate the root cause of solar power unsustainability [7]. Additionally, the study intends to make recommendations to address the solar power unsustainability in the region of KZN [13]. As it is a scientific factor that an increase in demand will cause an increase in consumption, the South African population is rapidly increasing, and yet the energy generation sector has moved extremely slowly [14]. The objective of this study is to ensure sustainability of solar power in the region of KZN through the identification of financial techniques that will encourage financial stakeholders to invest in solar power projects. Achieving this will ensure the protection of the environment. The following questions are to guide the study:
-
Why is solar power believed to be highly unimplementable in the coastal regions such as KZN?
-
What financial stakeholders are reluctant to support solar power energy in coastal regions?
-
Will the implementation of solar power energy be sustainable for the next decade?
The use of quantitative approach techniques to analyse the data for scientific discussion has been endorsed for the implementation cost of solar power and its energy production [7]. The use of cost-benefit analysis was employed to address the implementation rationality of solar power by determining the return on investment (ROI) [13]. Based on the management of this article: Section 2 deals with historical information to provide an overview on solar power, sustainability and implementation of solar power. Section 3 addresses the technique used—the CBA model. Section 4 addresses the analysis of results and discussion. Section 5 presents our recommendations and Section 6 concludes the study.

2. Literature Review

2.1. Sustainability Overview

Sustainability is a critical aspect when it comes to implementing renewable energy in South Africa or any other country. Some key factors affect the sustainability of the world [15]. Malkki [15] analysed the learning result to recognise the learning outcomes and basics of the courses (such as engineering sciences), together with renewable energy along with sustainability [7]. The approach to sustainability and the skills required to develop renewable energy must improve to increase renewable energy and improve efficiency. Dostal [16] believed that the time profile of electrical and thermal energy varies, increasing energy supply unreliability; this brings a significant challenge as energy consumers consistently need reliability and availability [7].
Germany established the significant Renewable Energy Sources Act (RESA) that proposed favourable circumstances to effect savings in renewable energy electricity production, assuring steady feed-in tariffs (FIT) for close to two decades and even longer to ensure sustainability [17]. However, in as much as there is technology to generate electricity and technology affecting utilisation hours of electricity generation differ, sustainability remains the largest challenge [18]. Among all the forms of RE, solar energy seems to be the most reliable source, but the solar system relies mainly on sunlight energy, battery, panels and technology wiring, making it unreliable [19].

2.2. Financial Factors Affecting Renewable Energy

RE investors are exposed to high risk when the renewable energy project fails, which makes RE a financial risk compared to fossil fuel. RE thus requires a huge initial investment [19]. The total quantity of RE connected is reliant on additional influences contributing to the entire connection cost of the structure [20]. However, RE funding is still lagging [21]. Jadhav [20] confirmed that there is a lack of appropriate financial environment for RE, especially for solar technologies. Hence, the financial outlay on renewables seems to play a significant role in policymaking, but the challenge lies in policy and educational circles [22].
However, Polzin [23] believed that investors are discouraged by the lengthy repayment periods and lack of resources attached with extraordinarily controlling needs and consistent hesitations. These factors have negative economic implications for global RE projects, including the KZN region. Gxasheka [24] believed that reducing technology costs through competitive procurement programmes would lower SA energy prices [7].

2.3. Technological and Environmental Overview

Polzin [23] viewed RE technologies as major subjects connected with commercialisation as well as the dissemination of innovations. Feed-in tariff includes connecting RE sources such as solar PV, wind farms, micro-hydro plants, etc., on a service grid and exporting electrical energy to the service grid to be remunerated at a quantified rate per kWh for a certain period [25]. Figure 1 demonstrates a renewable solar power system’s general flow and system link. This system is in the form of technology that allows sunlight energy to be converted to energy and stored simultaneously for later use. This solar panel is connected to the grid.
Pan [4] believed that SA is classified as one of the greatest sunspots on Earth, and believed it was suitable for photovoltaic (PV) and Concentrated Solar Power (CSP) systems considering that performance and energy production from RE sources, such as PV and CSP, are extremely dependent on local conditions [27]. According to Marzo [27], Chile is one of the countries that demonstrated a speedy growth in solar energy technologies application in both PV and CSP. Jain [28] agreed that solar energy is enough and freely available, and solar PV and thermal applications are most suitable [7]. Therefore, solar PV and CSP can play a prominent role in providing clean energy in SA. The energy mix in SA consists of all types of energy technology playing a role in achieving expected capacity according to the national development plan established by the South African government. Solar PV and CSP are among these technologies [7].

2.4. Energy Consumption Overview

The energy consumption rate of a household tells us about the affordability of energy among families. It is important to measure energy consumption to understand the effects of energy barriers correctly [7]. As Damari [29] once said, the realm of energy consumption must be understood completely for the monthly consumption to be translated to an annual figure with a generated index by using the average consumption of the whole investigated population each month [7].
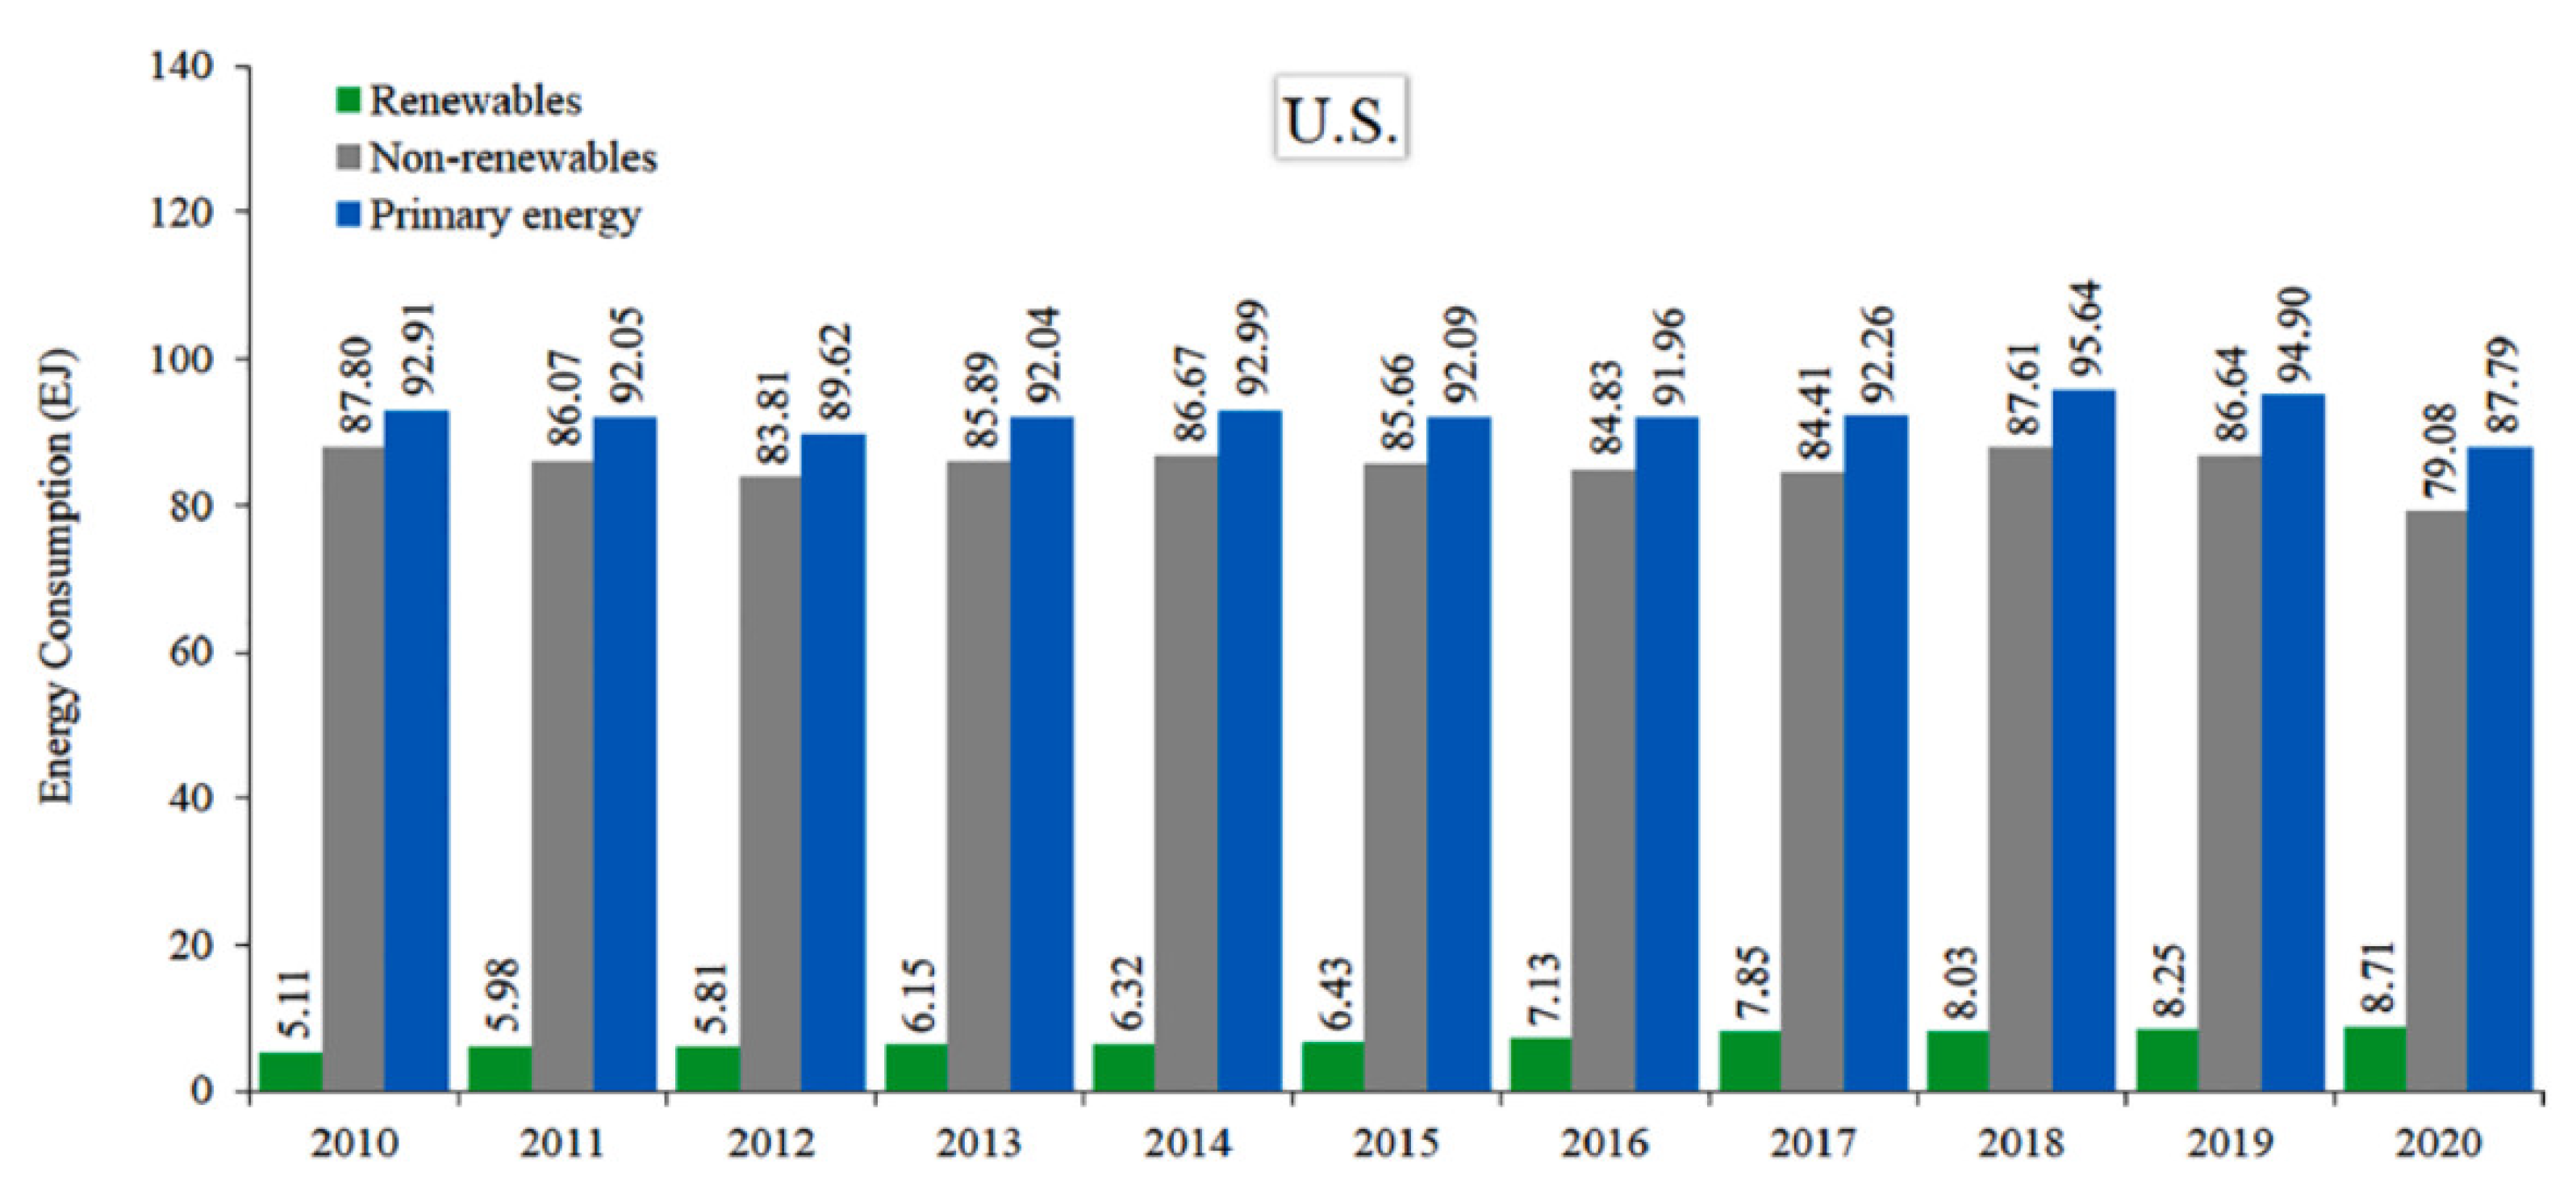
In the past few years, demand for non-renewable energy has declined due to its many challenges [7]. Figure 2 shows the relationship between renewable energy, non-renewable energy and primary energy for a developed country such as the United States (U.S). This figure clearly demonstrates that RE production has been in gradual growth for the past 35 years [7].
One of the most critical moves performed in 2017 by the Department of Energy was to implement the Department of Energy Renewable Energy Independent Power Producer (DoE IPP) power plants which increased the grid capacity by 872 MW [31].

3. Materials and Methods

3.1. Research Design and Gathering Approach

The crucial phase of design led to numerical phases or stages in the form of analytical techniques for it to be successful. All these phases or stages are interconnected. However, each phase or stage is independent of each other. The outlined research design model and its phases start with the problem discovery as an initial vital stage of the research—the sustainability challenge of renewable energy [7]. To proceed with the research, the next phase was necessary, which was data gathering.
The research on solar energy uses the case study of the KZN region. KZN is one of the provinces in South Africa and is made up of municipalities operating together at the local government level [7]. Several methods were used to gather data, including telephoning, emailing and face-to-face meetings to communicate with relevant personnel in the municipality [7]. More details on the communication methods are listed in Table 1.
Data utilized in this research on solar energy was extracted from the database of eThekwini Municipality under the department of renewable energy. The primary data was obtained from the departmental database with the help of the Municipal manager, and the secondary data were obtained from the literature review [7].

3.2. Sample and Population

The population target for this study were the users of eThekwini municipality solar power projects developed in the past decade, which are available in the database [7]. The eThekwini municipality owns several buildings, and solar power is installed in some buildings, such as the Moses Mabhida stadium, the Metro police building and uShaka Marine World. Therefore, this study focused on the information provided by almost 370 solar panels installed by eThekwini municipality around KZN, Durban. The data received at uShaka Marine World was within the period of five years [7].

3.3. Cost-Benefit Model

The cost-benefit analyses (CBA) model is important in revealing the root cause of the region’s modification of solar power sustainability [7]. This tool assists in making financial decisions when developing a new project or reviewing an existing project. In general, charges increase, and resource demand increases, creating resource scarcity. If implemented, this will also create a shortage of renewable energy supply in the KZN region.
The cost-benefit analysis conducted in this study is divided into three sections: total benefits, total costs and, lastly, return on investment. Yang [32], believed that a cost-benefit analysis could be used to investigate whether the effort exerted to achieve the specific target was cost-operative or not [7]. The total benefits section (TB) deals with two kinds of benefits: tangible and intangible. The difference between the two is that tangible benefits are based on the performance of the business (for example, customer tariff cost) and intangible benefits are influenced by the system’s service (for example, rent and grid connection) [7]. The formulae used in this study to calculate this section is:
T B = T + I
where:
  • Σ—summation sign
  • TB—total benefits,
  • T—represents the sum of all the tangible benefits of solar energy activities carried out in the KZN region [7].
  • I—represents all the activities that belong under the intangible category. Adding up all the activities with both tangible and intangible benefits give the required total benefits [4].
The other section of this study is total costs (TC). A total cost represents all the relevant costs needed to carry out the solar energy projects in the region of KwaZulu-Natal [7]. Based on information obtained from the database, total costs are also divided into two; the first is developmental costs (D), where these costs represent all the one-time costs in the solar energy projects. They do not have any effect when the projects are up and running; installation cost is an example. Installation cost is only charged once at the initial stage. The second cost that make up the total costs is operational cost (O) [7]. Operational costs are costs that will affect the solar energy project throughout the entire existence of the project. The operational costs for this study are the license operating cost, and the cost will be charged every year [7]. Therefore, it is necessary to calculate the total costs of the section using the following formulae:
T C = D + O
where D represents the sum of all activities that belong to developmental costs,
D = n
where:
  • n is for all activities.
And O represents the sum of all the activities that are carried out in the operational category [7],
O = m
where,
  • m is for all activities.
The third and last section on cost benefit analysis in this study is return on investment (ROI) [7]. Since this is a feasibility study, there is a need to calculate the profit or loss during the project’s existence. Earnings before income tax (EBIT) is the difference between total benefits and total costs [7]. The formula that represents this calculation is:
E B I T = I i + T B + T C E B I T
  • Ii—initial investment
  • TB—total benefits
  • TC—total costs
Tax inclusion comes in at this stage, where benefits and losses are calculated to get taxable operating income. The taxable operating income is the difference between total benefit and total cost, excluding initial investment. The formula is as follows:
T o i = T B T C
The operating tax is calculated only when the taxable operating income is greater than zero and not less than zero [7]. The tax percentage is 28% on the taxable operating income, as arranged between the South African Revenue Service (SARS) and the municipality. This percentage was taken from the SARS tax table.
If   T o i > 0 ,   T p = T o i × 28 %
where:
  • Toi—Taxable operating income
  • Tp—Tax payable
The return on investment (ROI) is the total output in the form that demonstrates the business loss or profit for each year [7]. The formula that represents the calculation of return on investment is presented below:
R O I = E B I T O I T
where:
  • EBIT—earning before income tax
  • OIT—operating income tax.
The cost-benefit analyses will end after obtaining the return on investment for each year until the targeted period (seventh year). The probability is investigated using the statistical analysis tool that will assist in predicting the success rate of the installation of solar power in the region [7].

4. Results and Discussion

Financial Analysis and Projection of Cost-Benefit Analysis

The main objective of this economic model is to guide the potential costs of solar power installations in the eThekwini municipal area. Small (<100 KW) installations have been planned [7]. The model was developed to calculate the benefits of installing solar power in the region. It is divided into sections: output, income and rates, investment and installation, and expenses. Table 2 represents the figures used to calculate the overall implementation of solar power in the KZN region [7].
The output section in Table 2 contains basic information containing the total capacity of 10 kWp, which is expected at the end of the desired period, which is 17 years. The income sections represent the income and rates component that was utilized to obtain the tangible benefit for the solar power system: it also describes how much the plant will earn. In addition, components such as inflation adjustments are used on all tariffs and operational costs [7]. Finally, the investment and instalment section deal with the investment and installation components such as turnkey, grid connection, and other initial costs. Among them is project development, which is useful in calculating the projected development cost found in the developmental cost [7].
The expenses section clarifies the expense components of implementing a solar power system. These components are insurance premiums as a percentage used to calculate the insured project material for a certain duration of time [7]. The upkeep component is used to obtain the solar connection system’s annual maintenance cost to ensure the system’s reliability and sustainability [4]. The allowance for component change (first year) is vital for component variance costs, and the land/roof lease is set to zero in this case because the municipality will own the land or roof used for the solar power project. Table 2 represents the possible percentage calculation for the duration of the study [7].
Considering the government’s plan, the cost-benefit study was carried out with the expectation period in mind. The CBA in Table 3 below was conducted for 17 years since almost 10 years still remain to achieve the NDP plan [7]. The extra seven years were added to ensure the performance moved forward after attaining the government plan by 2030. The users will share the energy produced by solar power, and the feed-in tariff is considered to obtain the total energy used [7]. The annual degradation of 0.30% is also considered for the yearly energy produced. This assists in understanding the actual amount of energy that can be produced. The tangible benefit of the project is obtained by adding the feed-in tariff and customer tariff costs. The two parameters are calculated based on the region’s annual target of solar power implementation. The calculations are as follows:
F T C = F T R × F T C h
where,
  • FTC—feed-in tariff cost,
  • FTR—feed-in tariff rate,
  • FTCh—feed-in tariff charge.
The feed-in tariff rate is 784 kWh in the first year. The feed-in tariff charge is R1/kWh. However, this charge is not expected to increase for the next 17 years because solar power is still in the developmental stage [7]. Feed-in tariff costs are added to the customer tariff to obtain the actual cost. The customer tariff is as follows:
C T = S E ÷ S T
where,
  • CT—customer tariff,
  • SE—self-use energy
  • ST—self-use tariff
This formula was obtained from a percentage of 95% set by the region for that year. The combination of these figures in the first year gave us R30,590/kWh, which is the total tangible benefit. The carbon credit in this cost is R0/kWh, but there are no charges related to it at this point. The intangible benefit is another part of the benefit that completes the possible total benefit of the solar implementation project in the region. In this project, there is a rent and grid connection, where rent will assist the project in generating income by renting the solar system to the municipality customer with an initial fee of R3000 for the first four years because rent still costs the municipality for maintenance and installation. This figure is recommended to be 1.7% of the investment cost. The four-year fixed-term drive by the expected solar power challenge is still minimum at the initial stage. The next four years (5th to 9th year) and eight remaining years will increase to R4500 and R5500, respectively, because solar system output increases by 100 kWh yearly. This will also be affected by maintenance costs that the system will need due to the increased capacity of the solar system [7].
Grid connection will be an annual charge when the customer has installed his/her own solar power system. This is conducted to control the grid connection and properly maintain the grid system. These charges are not that high compared to the rent cost since they only come at a value of R1100 per year for the first 9 years and increase to R1200 per year for the rest of the duration of the project, and these charges will be directed to the greenhouse gas emission funds of the municipality.
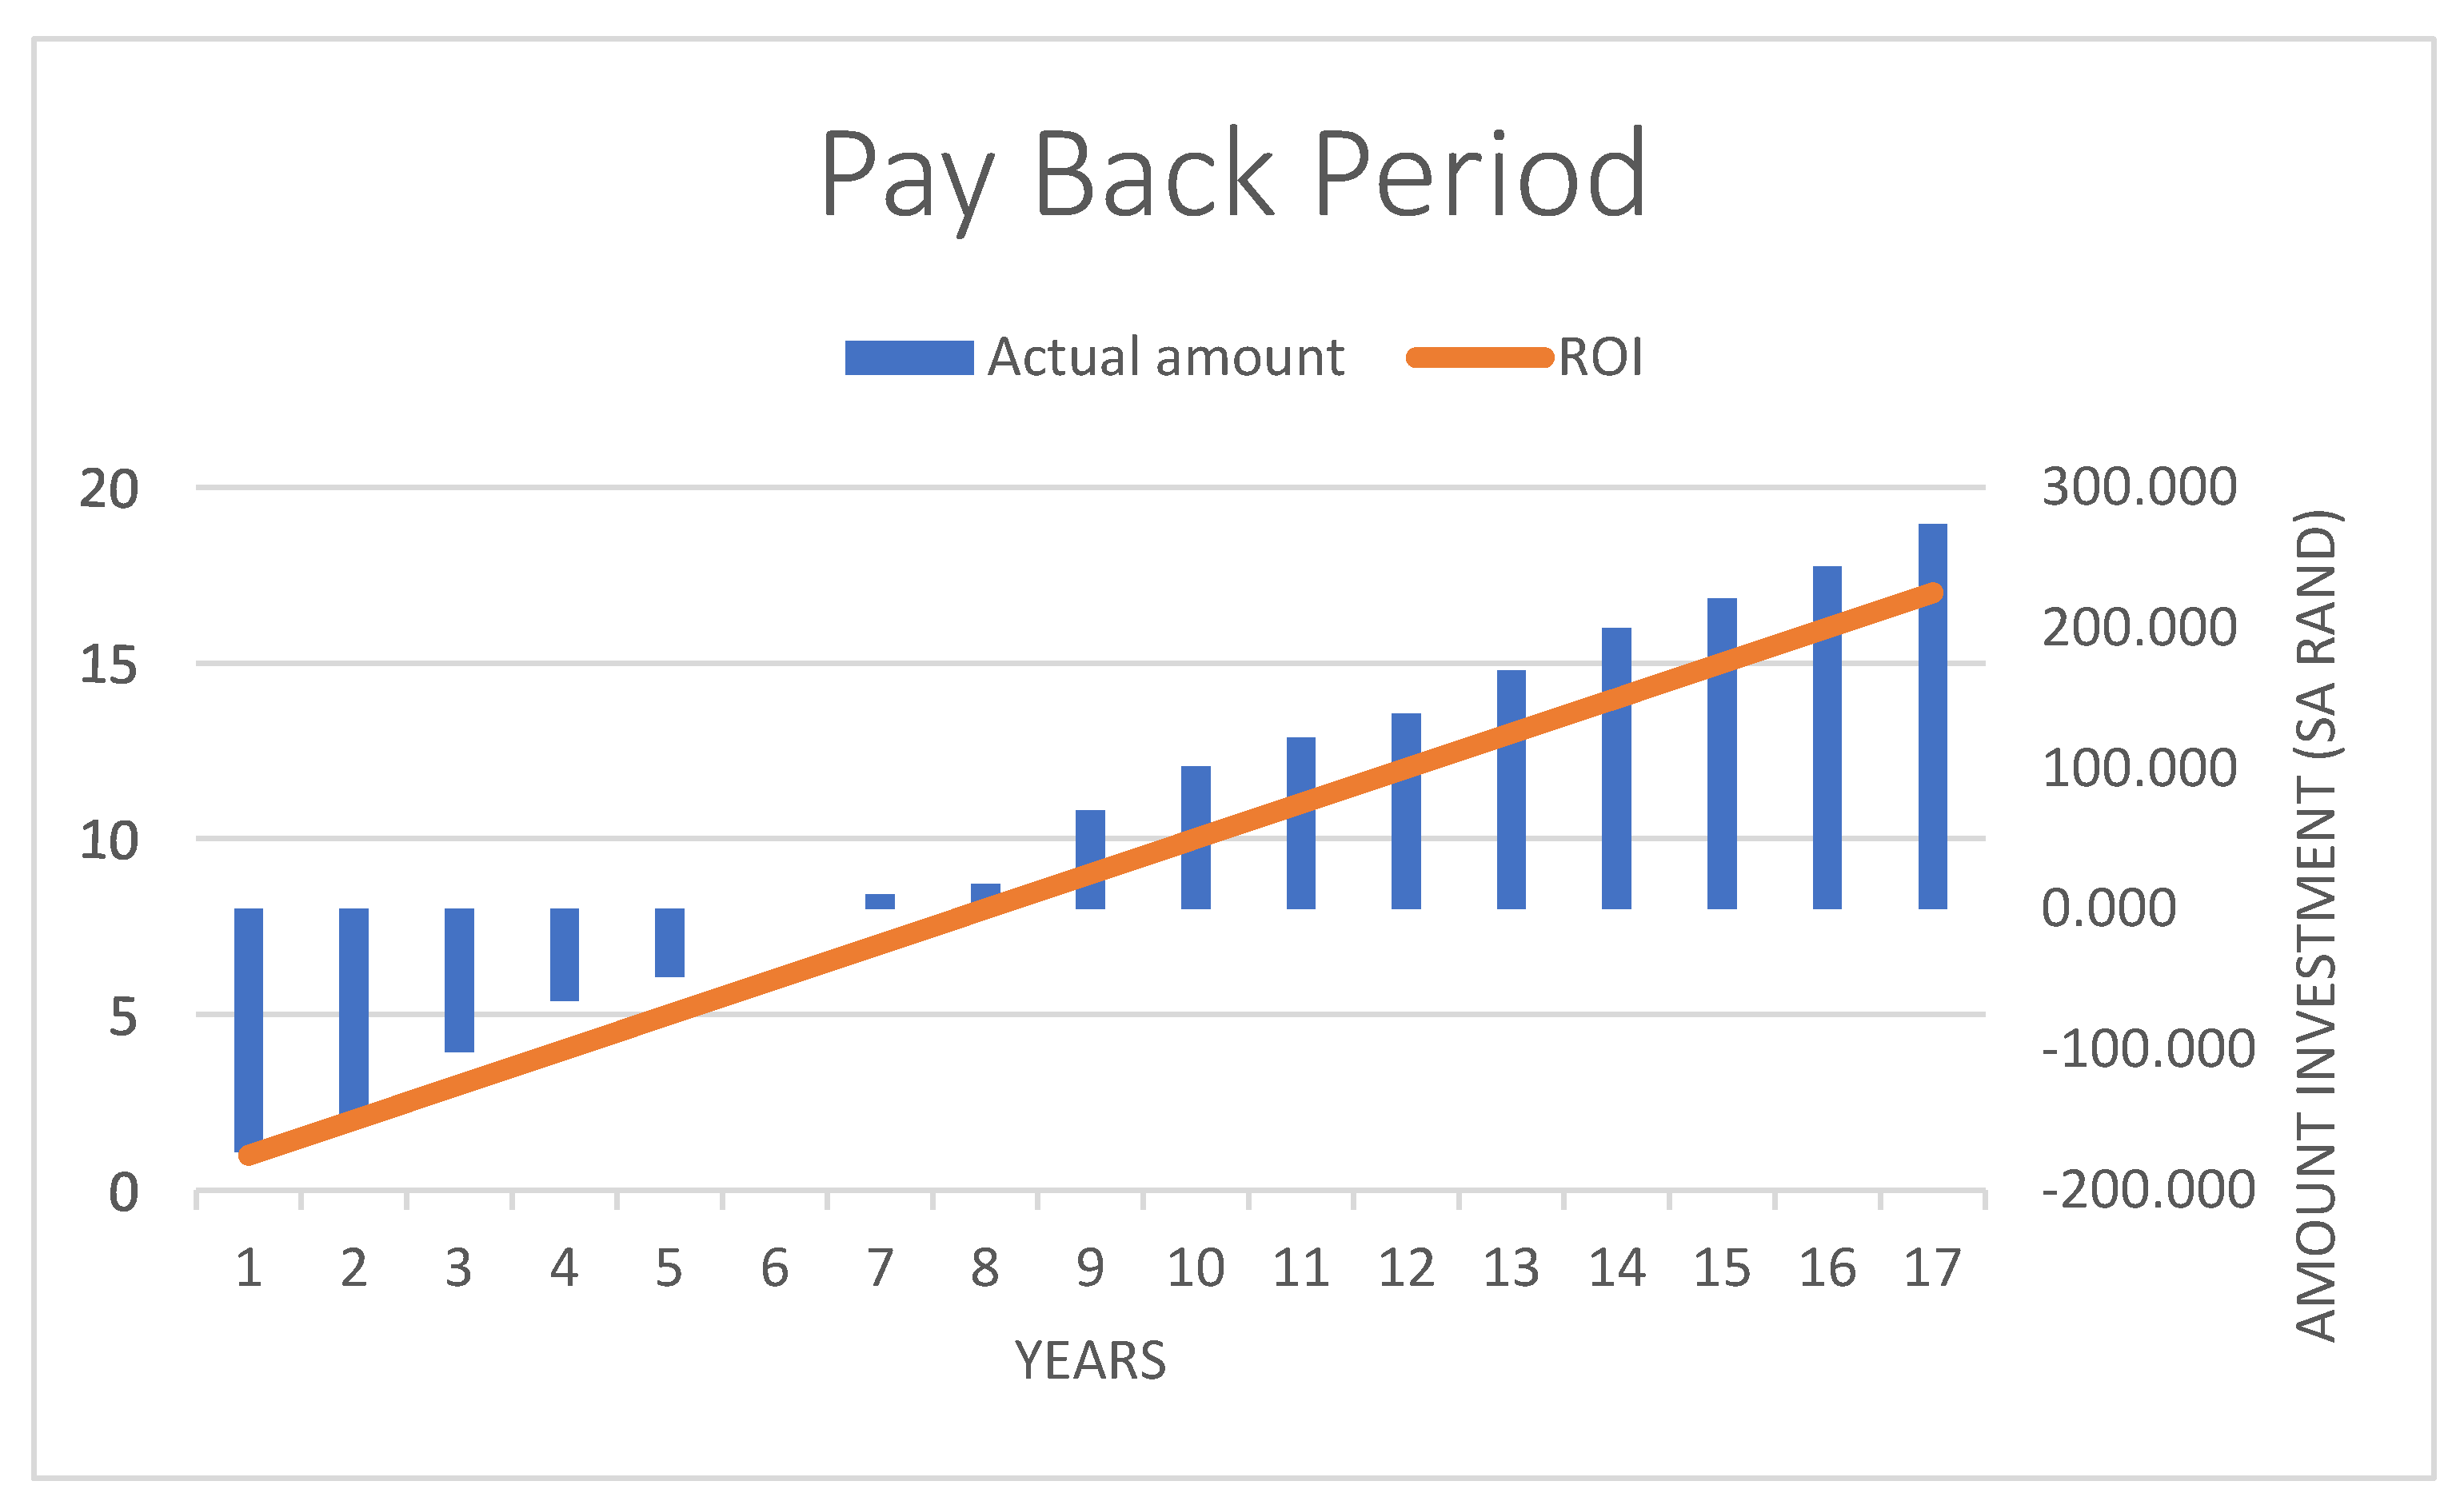
The solar power system project in the region of KZN will face many challenges since it is in the initial phase [4]. The solar energy project for the duration of 17 years will require R181,000 for the project to be successful. This financial model shows that solar implementation will not generate profit for approximately five years [7]. The return on investment was presented/given in Table 2. In the first year, it will run at a loss of about R172,598. During the first year, almost 4.4% will be returned by the project.
The increase will begin to show from the second year since the project will be running at about a loss of R138,744 and will manage to accumulate a 23.3% return on the initial investment. This shows an amazing return in the short term of about 19.1% difference from the first year. In the third year, solar projects will be running at a loss of about R105,223 and will manage to return almost half (41.9%) of the initial investment. This demonstrates a positive sign of the project since the project duration is 17 years, yet in the third year, it returns almost half of the investment [7].
In the fourth year, it will run at a loss of R72,434 with an investment return of 60%, and in the fifth year, 78.7% will be returned by this solar energy project since it will be running at a loss of R38,501 in that financial year. This will be the last loss of the project since, in the sixth year, the solar project will manage to reach the breakeven point. In the sixth year, the solar energy project made no loss or profit. In other words, every cent invested in the project will be fully returned in the sixth year. As every cent invested in the project has been returned, the project will start generating profit from the seventh year. The first proof that profit will be generated will be equivalent to R26,848 which is almost 15% of the initial investment.
The return on investment has been delayed by the project’s total cost, such as development and operating costs. These costs are considered running costs for a solar project in the region. The most respectable aspect regarding developmental costs is that they are one-time costs [7]. The contribution of the developmental costs to the solar energy project, in this case, is the sum of project developmental cost (PD), labour cost (LC), transportation cost (TC) and solar panel cost (SC) to the value of R168,000. The developmental cost is almost 93% of the proposed investment. The calculation details are given below:
D e v e l o p m e n t a l   c o s t = P D + L C + T C + S C = ( R 1670 + R 3330 ) + ( R 45   ×   8   ×   122   ×   1 ) + ( 320   km   ×   140.6 ) + R 29000 = R 5000 + R 44000 + R 45000 + R 29000 = R 168,000
On the other hand, the operating cost is not a one-time cost but a recurring cost every year [7]. This has a contribution of R43,648 which adds almost 24% to the investment cost in the first year of the project. Among other operating costs are facility management cost (FC), depreciation cost (DC), allowance of component changes cost (AC), maintenance cost (MC) and insurance cost (IC) [7]. However, the depreciation cost will be further calculated for the next period of 10 years since it only affects the value of the solar system, not the investment and encourages proper maintenance. Most solar systems can only be removed when defective, but most solar systems showed high levels of defects and required more maintenance after ten years [30]. To add to that, the NDP still has almost ten years to yield results; therefore, the study can focus on a minimum of ten years for it to be in line with the government’s plan, particularly for the KZN regional government [7]. Calculation details used are given below:
O p e r a t i n g   c o s t O C = F C + D C + A C + M C + I C   ( 12 ) = R 1000 + ( R 181000 × 20 % ) + R 1000 + ( 10   km × R 400 ) + ( R 181000 × 0.80 % ) = R 1000 + R 36200 + R 1000 + R 4000 + R 1448 = R 43,648
These two costs (developmental cost and operating cost) have overturned the return on investment for almost 5 years but in the first year have demonstrated a loss of R172,598 to zero costs in the sixth year, as clearly demonstrated in Figure 3 [7].
A positive cost trend will be seen in the next ten years after the 15% increase in the seventh year. A consistent 15% increase will be seen each year throughout the estimated period. In the 12th year, the profit will almost double the investment cost with a profit of R174,780. This is almost equivalent to 97% of the initial investment, which ensures the future financial stability of the energy department in the region.
In another part of the country, such as Johannesburg, one can look at a repayment period of about 7.9 years to install a solar power system of the same quantity [31]. Whereas here in eThekwini (KZN municipality), it will take a payback period of approximately 6 years, according to the research conducted in eThekwini municipality. According to Ozorhon [34], the service life of a solar power project is seen to be very long to generate profit after the breakeven point. Therefore, investors appreciate the fact that any solar power investment should give a return on investment within the estimated timeframe and will not take a longer time, as is the case with fossil fuels [34].
In the tenth year, the depreciating value is R4859, but the system remains controllable above 10%. Depreciation values could assist in the maintenance schedule to keep the solar system in good performing shape. Ghenai [35] claims solar systems can have a lifespan of almost 25 years with a solar cell efficiency of 16%.

5. Recommendations

5.1. Economical, Methodological and Environmental (EME) Framework Analysis of Measured Solar Challenges

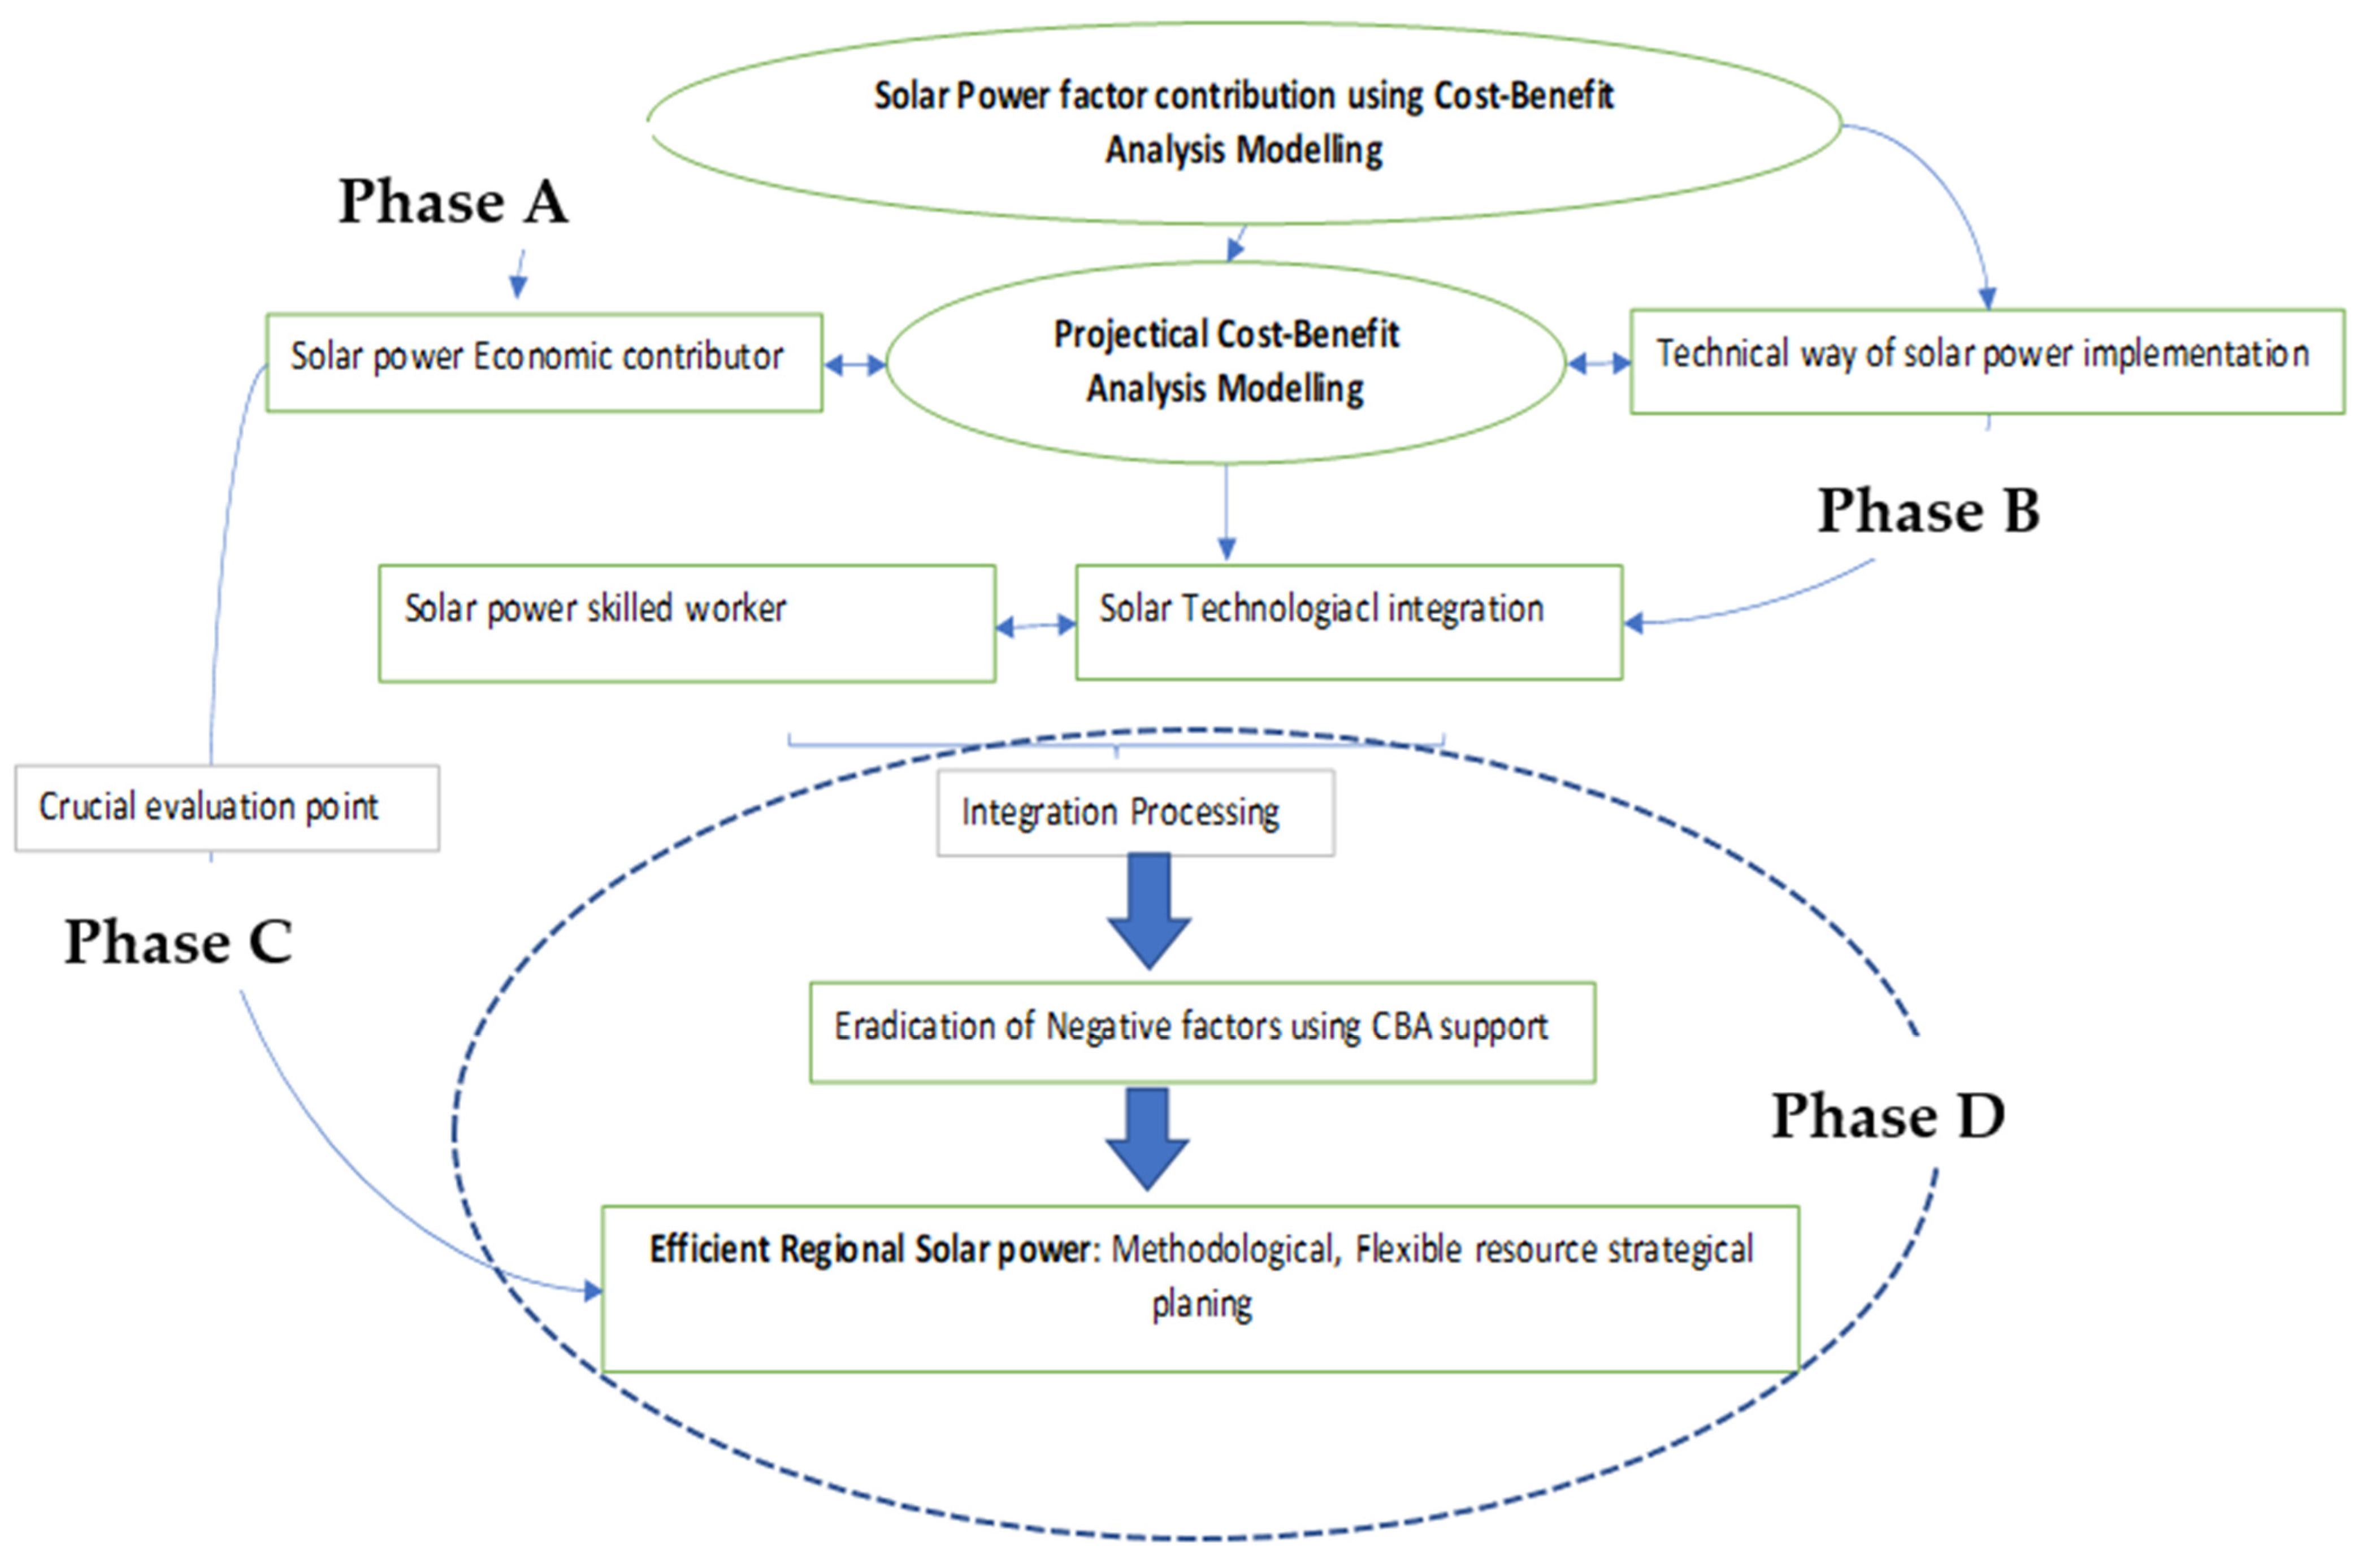
Figure 4 was developed to overcome the solar power unsustainability in the KZN region. It proposes the path from potential solar power factors to better regional solar performance.
The economic advantages of solar power give direction to the aspects of the solar power system to be funded. If funding of solar power in the region is directed to SP technology depreciation and SP technology implementation costs, the sustainability of solar energy could be easily achieved.

5.2. Economic Breakdown of Solar Power in the Region of KZN

SP technology depreciation—the funding will focus more on the age of solar technology to keep it up to the required standard. The standard of the solar power system will be ensured using a proper maintenance plan [7]. Equipment such as solar panels must be kept in good shape to avoid premature failure of the system. Panels are affected by dust and corrosion that occurs during solar power supply [7]. On the other hand, the battery duration is affected by its chemicals [7]. Therefore, it would be more beneficial if funds were directed at dealing with the critical solar contributors that can easily collapse the solar system.
The SP technology cost will be directed to the implementation of solar power. The technology must be the latest technology to ensure the efficiency of the solar power system. The technology upgrade will cost slightly more, reducing the costs budgeted for SP technology depreciation [7].

5.3. Methodological Breakdown of Solar Power in the Region of KZN

The main reason why the research overlooked the solar power methodology is that the potential solar power has and the less increase in its implementation of solar power from small scale to large scale in the KZN region. At this stage, the KZN region can function best at a small scale [7]. The other reason was to eliminate investment risks due to an incorrect method being carried out. The cost of a solar power system will be reduced if the correct methodology is used. The proposed reduction in solar power costs can be achieved by looking into two aspects of solar:
  • Solar power research and development—this aspect can benefit the region since there will be a better understanding of the technology required in the KZN region. It will prepare the solar power system organizers for future technology and increase the opportunity to develop relevant technology for the region rather than benchmarking against developed countries, e.g., Germany [7]. There is nothing wrong with benchmarking, but it must be remembered that other countries use technology that suits their solar radiance and temperature. This creates an opportunity for solar power products with superior performance to be manufactured once the relevant parameters have been analysed [7].
  • Solar power training and financing policy—this will assist in reducing implementation time and the waste of solar power material, provided training is maximized through proper training policies to ensure proper skills transfer for renewable energy as a whole at the regional level [7]. This process will need to be guided by policies directed towards renewable energy such as solar power [7]. For example, a solar power financing policy should be developed since the author was unable to access such a policy for the KZN region during his research for this study. Both SP research and development as well as SP training and financing policy could help reduce the premature collapse of the SP system [7].

5.4. Incapacitating Solar Power Unsustainability in the KZN Region

Global emissions of greenhouse gases are extremely high and they incapacitate the amount of oxygen required. However, the study focused on ensuring the sustainability of solar using CBA. The below diagram collaborated the solar power resources to efficiently implement solar power in the coastal region. Protecting the environment is highly recommended for the solar power project to be the opposite of the current fossil fuel when it comes to damaging the environment. A proper integration of skill and technology used will reduce solar power uncertainties [7]. The CO₂ emission measures can play a prominent role in making the world feel more confident about solar energy as a viable alternative to fossil fuel energy [7].
The diagram above has multiple phases and these phases interlink each other. Phase A takes place first and interacts with phase B on the project’s cost-benefit analysis model. Phase B will then include the technical way of solar power implementation and leaves it in the integration of skill analysis. Phase C evaluates the crucial points from phase A. Phase D will then deal with integrated solar system skills, processing of the eradication of negative factors through CBA and ends at efficient regional solar power.
The study outcomes reveal the importance to track the regional solar power sustainability to be able to identify the backlog to the proper implementation and growth in the KZN region. Results from this research study further revealed a positive correlated relationship between productivity and quality. In order to improve the growth of solar power in the region of KZN as an alternative to energy supplied from fossil, there is crucial need for research scientists to ensure sustainability in its implementation. The results clearly demonstrates that return on investment will be attained from the 6th year onwards as long as sustainability measures are maintained. The proper sustainability relies on solar power education, skilful technicians and closing the investors gap. The literature, results analysis and CBA model assisted in determining the cause of the gap within the solar power in the KZN region.

6. Conclusions

The study of solar power implementation in coastal region using the CBA method yielded positive results, where multiple tools such as root cause analysis played a crucial part to direct the next move on solar power by determining the level of success on the solar project in the region of KZN.
Based on the results obtained in the study, solar power can be implemented without any unforeseen challenges as a literature review outlined all possible challenges. The study discussed the proper way of implementing solar power in the region such as KZN. Through proper sustainability discussed in Section 5 above, the implementation of solar power can easily contribute to positive outcomes which can in turn yield profit as a means of tracking regional solar power sustainability.
The literature clearly tells us that the implementation of solar power in SA is still far behind other countries, such as Germany [7]. Nevertheless, solar power is a promising alternative energy supply in South Africa [7]. The research revealed that solar power has potential in the KZN region, but more research needs to be performed in the field of solar power sustainability in rural areas, where electricity from the grid is hardly supplied.

Author Contributions

Conceptualization, B.N.M.; Data curation, B.N.M.; Formal analysis, B.N.M.; Investigation, B.N.M.; Methodology, B.N.M.; Project administration, O.A.O.; Supervision, O.A.O.; Validation, B.N.M. and O.A.O.; Visualization, B.N.M. and O.A.O.; Writing—original draft, B.N.M.; Writing—review & editing, O.A.O. and B.N.M. All authors have read and agreed to the published version of the manuscript.

Funding

This research received no external funding.

Data Availability Statement

Not applicable.

Conflicts of Interest

The authors declare no conflict of interest.

References

  1. Obaideen, K.; AlMallahi, M.N.; Alami, A.H.; Ramadan, M.; Abdelkareem, M.A.; Shehata, N.; Olabi, A.G. On the contribution of solar energy to sustainable developments goals: Case study on Mohammed bin Rashid Al Maktoum Solar Park. Int. J. Thermofluids 2021, 12, 100–123. [Google Scholar] [CrossRef]
  2. Afonso, A.; Tovar, J. Soveriegn debt composition and time varying public finance sustainability. N. Am. J. Econ. Financ. 2017, 42, 144–155. [Google Scholar] [CrossRef]
  3. Currie, P.K.; Musango, J.K.; May, N.D. Urban metabolism: A review with reference to Cape Town. Cities 2017, 70, 91–110. [Google Scholar] [CrossRef]
  4. Şahin, U. Forecasting share of renewables in primary energy consumption and CO2 emissions of China and the United States under COVID−19 pandemic using a novel fractional nonlinear grey model. Expert Syst. Appl. 2022, 209, 118429. [Google Scholar] [CrossRef]
  5. Mark, L.; Legget, W.; Ball, A. The implication for climate change and peak fossil fuel of the continuation of the current trend in wind and solar energy production. Energy Policies 2022, 41, 610–617. [Google Scholar]
  6. Depren, S.K.; Kartal, M.T.; Çelikdemir, N.; Depren, Ö. Energy consumption and environmental degradation nexus: A systematic review and meta-analysis of fossil fuel and renewable energy consumption. Ecol. Inform. 2022, 70, 101747. [Google Scholar] [CrossRef]
  7. Mdlolo, B. Investigating the Root Cause OF Solar Power Unsustainability in Kwazulu-Natal, South AFRICA; Durban University of Technology: Durban, South Africa, 2019. [Google Scholar]
  8. Sakah, M.; Diawuo, F.A.; Katzenbach, R.; Gyamfi, S. Towards a sustainable electrification in Ghana: A review of renewable energy deployment policies. Renew. Sustain. Energy Rev. 2017, 79, 544–557. [Google Scholar] [CrossRef]
  9. Pan, C.A.; Dinter, F. Combination of PV and central receiver CSP plants for base load power generation in South Africa. Sol. Energy 2017, 146, 379–388. [Google Scholar] [CrossRef]
  10. Van Ravenswaay, J.; Roos, T.; Surridge-Talbot, A.; Xosa, S.; Sattler, C. Development of a Solar Fuels Roadmap for South Africa. Energy Procedia 2015, 69, 1838–1848. [Google Scholar] [CrossRef] [Green Version]
  11. Nuortimo, K.; Härkönen, J.; Karvonen, E. Exploring the global media image of solar power. Renew. Sustain. Energy Rev. 2018, 81, 2806–2811. [Google Scholar] [CrossRef] [Green Version]
  12. Zawilska, E.B.M. An assessment of the solar resource for Durban, South Africa. Renew. Energy 2011, 36, 3433–3438. [Google Scholar] [CrossRef]
  13. Hachicha, R.I.G.C. Thermo-hydraulic analysis and numerical simulation of a parabolic trough solar collector for direct steam generation. Appl. Energy 2018, 214, 152–165. [Google Scholar] [CrossRef] [Green Version]
  14. Bohlmann, J.; Inglesi-Lotz, R. Analysing the South African residential sector’s energy profile. Renew. Sustain. Energy Rev. 2018, 96, 240–252. [Google Scholar] [CrossRef]
  15. Mälkki, H.; Alanne, K.; Hirsto, L. A method to quantify the integration of renewable energy and sustainability in energy degree programmes: A Finnish case study. J. Clean. Prod. 2015, 106, 239–246. [Google Scholar] [CrossRef]
  16. Dostál, Z.; Ladányi, L. Demands on energy storage for renewable power sources. J. Energy Storage 2018, 18, 250–255. [Google Scholar] [CrossRef]
  17. Frondel, M.; Schmidt, C.M.; Vance, C. Revisiting Germany’s solar cell promotion: An unfolding disaster. Econ. Anal. Policy 2014, 44, 3–13. [Google Scholar] [CrossRef]
  18. Weida, S.; Kumar, S.; Madlener, R. Financial Viability of Grid-connected Solar PV and Wind Power Systems in Germany. Energy Procedia 2016, 106, 35–45. [Google Scholar] [CrossRef]
  19. Spachos, P.; Mackey, A. Energy efficiency and accuracy of solar powered BLE beacons. Comput. Commun. 2018, 119, 94–100. [Google Scholar] [CrossRef]
  20. Dinh, D.K.; Lee, D.H.; Song, Y.-H.; Jo, S.; Kim, K.-T. Arc length control for efficiency enhancement of energy usage in plasma dry reforming process. J. CO2 Util. 2018, 28, 274–282. [Google Scholar] [CrossRef]
  21. Schwerhoff, G.; Sy, M. Financing renewable energy in Africa—Key challenge of the sustainable development goals. Renew. Sustain. Energy Rev. 2017, 75, 393–401. [Google Scholar] [CrossRef]
  22. Jadhav, A.S.; Chembe, D.K.; Strauss, J.M.; Van Niekerk, J.L. Status of Solar Technology Implementation in the Southern African Developing Community (SADC) Region. Renew. Sustain. Energy Rev. 2017, 73, 622–631. [Google Scholar] [CrossRef]
  23. Polzin, F.; Sanders, M.; Täube, F. A diverse and resilient financial system for investments in the energy transition. Curr. Opin. Environ. Sustain. 2017, 28, 24–32. [Google Scholar] [CrossRef] [Green Version]
  24. Gxasheka, H. Mokhonoana and R. Mokoena. Monitor of Renewable Energy Performance of Power Plants–Progress in the First Half of 2018—Issue 12; NERSA: Pretoria, South Africa, 2018. [Google Scholar]
  25. Aliyu, A.K.; Modu, B.; Tan, C.W. A review of renewable energy development in Africa: A focus in South Africa, Egypt and Nigeria. Renew. Sustain. Energy Rev. 2018, 81, 2502–2518. [Google Scholar] [CrossRef]
  26. Chen, X.; Li, X.; Zhu, H. Condition evaluation of urban metro shield tunnels in Shanghai through multiple indicators multiple causes model combined with multiple regression method. Tunn. Undergr. Space Technol. 2018, 85, 170–181. [Google Scholar] [CrossRef]
  27. Marzo, M.; Alía, R.G.; Infantino, A.; Brucoli, M.; Danzeca, S. Fuentealba. Impact of neutrons on the Rad FET dose response when exposed to mixed fields. Radiat. Phys. Chem. 2018, 127, 871–882. [Google Scholar]
  28. Jain, S.; Jain, P. The rise of Renewable Energy implementation in South Africa, in World Engineers Summit—Applied Energy Symposium & Forum: Low Carbon Cities & Urban Energy Joint Conference. Energy Procedia Singap. 2017, 143, 721–724. [Google Scholar]
  29. Damari, Y.; Kissinger, M. An integrated analysis of households’ electricity consumption in Israel. Energy Policy 2018, 119, 51–58. [Google Scholar] [CrossRef]
  30. Destek, M.A.; Manga, M.; Cengiz, O.; Destek, G. Investigating the potential of renewable energy in establishing global peace: Fresh evidence from top energy consumer countries. Renew. Energy 2022, 197, 170–177. [Google Scholar] [CrossRef]
  31. NERSA. Monitoring_Renewable_Performance_of_Power_Plants, in Tracking Progress of 2017; NERSA: Pretoria, South Africa, 2017. [Google Scholar]
  32. Yang, T.; Segets, D.; Thajudeen, T.; Han, Y.; Peukert, W. The effect of mixing on silver particle morphology in flow synthesis. Chem. Eng. Sci. 2018, 192, 254–263. [Google Scholar] [CrossRef]
  33. Ntshalintshali, S. By 2030 eThekwini Will Be Africa’s Most Caring and Loveable City, in eThekwini Magazine, eThekwini Municipality; eThekwini Municipality: Durban, South Africa, 2016. [Google Scholar]
  34. Ozorhon, B.; Batmaz, A.; Caglayan, S. Generating a framework to facilitate decision making in renewable energy investments. Renew. Sustain. Energy Rev. 2018, 95, 217–226. [Google Scholar] [CrossRef]
  35. Ghenai, K.; Alamara, K.; Inayat, A. Solar Assisted Pyrolysis of Plastic Waste: Pyrolysis Oil Characterization and Grid-Tied Solar PV Power System Design. Energy Procedia 2019, 159, 123–129. [Google Scholar] [CrossRef]
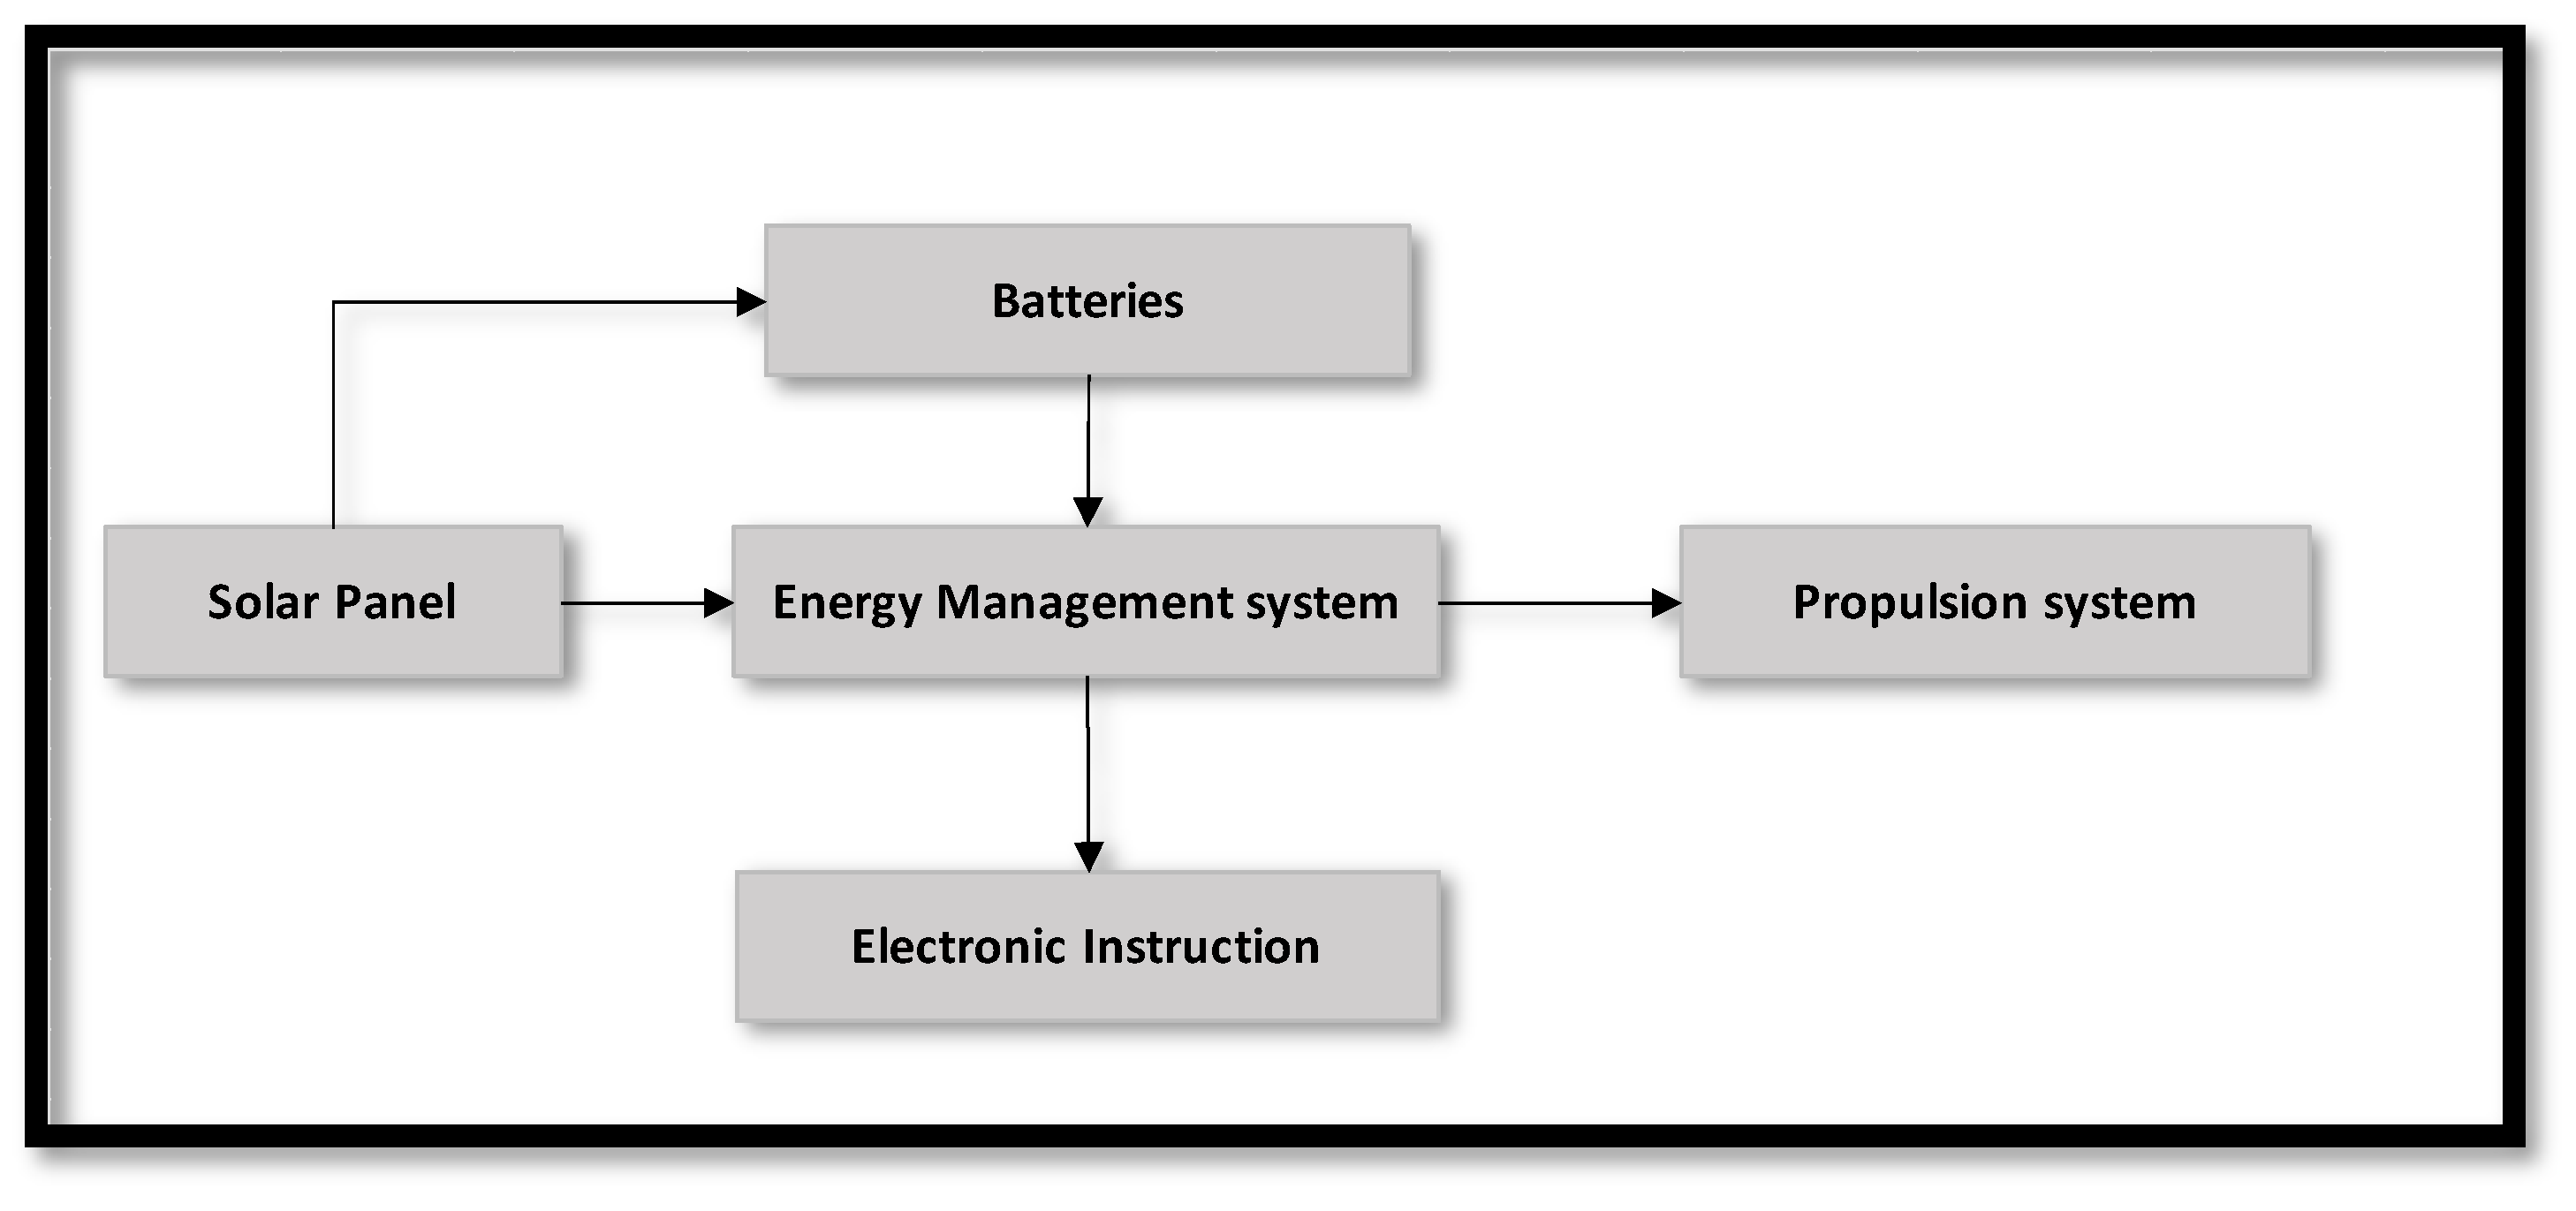
Figure 1. Renewable power system of stratospheric airships [26].
Energies 15 07554 g001
Figure 2. Actual data of energy balances for the U.S. from 2010 to 2020 [30].
Energies 15 07554 g002
Figure 3. Payback period on solar power implementation [7].
Energies 15 07554 g003
Figure 4. Proposed Solar Power (SP) sustainability analysis framework for KZN.
Energies 15 07554 g004
Table 1. Detailed gathering communication methods [7].
Communication TypesDescription of Uses
Emailing-Initially used to schedule meetings between
the researcher and municipal representatives.
-To receive data and send follow-up questions
from the researcher to the municipal
representatives.
Telephoning-Used to remind the municipal representatives
about meetings and to follow up of how far
the person with expected data is.
Face-to-face meetings-Used to introduce the researcher and to
outline the type of data expected from each
partner.
Table 2. Financial model component for a solar power system in eThekwini municipality [7,33].
1. OutputUnit
Total capacity 10 kWp
Annual insolation 1890 kWh/m2
Performance ratio 83.0%
Annual degradation 0.30%
Yearly production (first year) 15,687 kWh
Per cent self-use 95%
2. Income and rates
Customer tariff (avoided electricity) 1.35 R/kWh
Feed-in tariff 0.65 R/kWh
Carbon credit 0 R/kWh
Tax rate 28%
Inflation adjustment 7% per annum
3. Investment and installation
Turnkey EPC 18,000 R/kWp
Grid connection R0
Project development R1000
Other initial costs R0
Decommission 0 R/kWp
4. Expenses
Upkeep (first year) 400 R/kWp/annum
Allowance for component change (first year)1000 R/annum
Land/Roof Lease 0 R/annum
Insurance premium 0.8% of initial invest
Table 3. Cost Benefit Analysis (CBA) for solar energy in eThekwini region.
Cost Benefit Analysis (CBA)
Total Benefit (TB)Year
Unit1234567891011121314151617
Total Tangible Benefit
Energy producedkWh15,68715,64015,59315,54615,49915,45215,40515,35815,31115,26315,21615,169
15,122
15,07515,02814,98114,934
Self-usekWh14,903.0014,85814,81314,769147214,67914,63414,59014,54514,50014,45614,411
14,366
14,32114,27714,23214,187
Feed in tariffkWh784782780777775773770768766763761758756754751749747
Feed in tariffR/kWh11111111111 1
1
1111
Customer r tariffR/kWh22222222222 2
2
2222
Carbon creditR/kWh00000000000000000
Total TB costR/kWh30,59030,49830,40630,31430,22330,13130,03929,94729,85529,76429,672295829,48829,39729,30529,21329,121
b) Intangible Benefit
Rent costR/kWh300
300
3000300045004500450045004500450050005005005500550055005800
Grid connection licenceR11001100110011001100110011001100120012001200120012001200120012001200
Total benefitR34,69034,59834,50634,41435,82335,73135,63935,54735,55535,46435,872357835,68836,09736,00535,91336,121
Total CT (expenses)
a) Developmental cost
Project developmentR50,000
Labour costR−44,000
Transportation costR45,000
Solar panel costR/m′25,000
b) Operational Cost
Facilities managementR/kWh−1000−1070−1145−1225−1311140315011606−1718−18381967−2105−2252−2410−2579−2759−2952
DepreciationR36,200 001000000
0
0
00
Allowance of component changeR100010,7001145122513111403150116061718−18311967−2105−2252−2410−247927592952
Maintenance costR/kWh−400042804580490052435610−6003.0064236873735478698419 9009963910,31411,03611,809
Insurance premiumR1448 −144814411448144814481441−1448−1448144114411448 −1448−1441−144114481448
Total costR207,6417868 −8317−87989313986310,45211,083 −11,157−12,47913,25114,077 16,919−15,907−16,91911,00219,161
EBITR8042267326,18925,61025,61025,86725,13724,46523,79822,98522,62121,703
20,727
20,100
19,086
17,911
16,960
Taxable operating incomeR−172,958267326,1892561265125,86725,13724,46523,79822,98522,62121,70320,72720,10019,08617,91116,960
Operating income taxR074847333717326,18974237243705268506660643663346077580565353445015
Operating income After TaxR−172,958342133,52232,78933,933331132,23931,31530,46229,42128,955277826,53125,843244,30122,92621,709
Return On Investment (ROI)R−172,958−138,744−10,522−72,434−38,501−539126,84858,16388,624118,045147,000174,780201,311227,154251,583274,509296,219
Publisher’s Note: MDPI stays neutral with regard to jurisdictional claims in published maps and institutional affiliations.