Abstract
This paper proposes a novel maximum power point tracking (MPPT) method inspired by the horse racing game for standalone photovoltaic (PV) power systems, such that the highest PV power conversion efficiency is obtained. From the horse racing game rules, we develop the horse racing algorithm (HRA) with the qualifying stage and final ranking stage. The MPP can be searched even if there exist multiple local MPPs for the PV power system. Moreover, from the proposed horse racing algorithm, the calculation is reduced, so that the transient searching points are less than traditional methods, i.e., the transient oscillation is less during the MPPT control. Therefore, the HRA based MPPT method avoids local maximum power traps and achieves the MPP quickly even if considering partial shading influence and varying environment for PV panels. Evidence of the accuracy and effectiveness of the proposed HRA method is exhibited by simulation results. These results are also compared with typical particle swarm optimization (PSO) and grey wolf optimization (GWO) methods and shown better convergence time as well as transient oscillation. Within the range from 0.34 to 0.58 s, the proposed method has effectively tracked the global maximum power point, which is from 0.42 to 0.48 s faster than the conventional PSO technique and from 0.36 to 0.74 s faster than the GWO method. Finally, the obtained findings proved the effectiveness and superiority of the proposed HRA technique through experimental results. The fast response in terms of good transient oscillation and global power tracking time of the proposed method are from 0.40 to 1.0 s, while the PSO and GWO methods are from 1.56 to 1.6 s and from 1.9 to 2.2 s, respectively.
1. Introduction
Currently, the PV energy system is widely used from urban to rural areas because PV panels are having cheaper price, longer service life, and lower maintenance costs. Especially, the PV energy system is easy to install and operate. In order to take advantage of the endless solar energy effectively, the PV power conversion system needs an optimal MPPT control solution to obtain the highest power from the PV energy panels [1]. Under uniform irradiance, the traditional MPPT methods including the incremental conductance (IC) method, perturbation and observation (P&O) algorithm, etc., easily achieve the MPP because only one power peak appears on the P-V curve characteristic [2,3]. However, actual environmental conditions, such as tree shadow, building shadow, clouds, etc., will cause the various supplied power of each PV panel, i.e., multiple power peaks occur on the P-V curve characteristic of PV panels. It becomes more difficult to find the global MPP in this case because the conventional algorithms are easily stuck at the local maximum power points and cause energy loss of the PV power system.
Although some innovative solutions [4,5] have been proposed to improve the power conversion performance, these methods still cannot overcome the drawback under rapidly changing weather conditions and partial shading influences. To solve this problem, a great variety of intelligent, metaheuristics, integrated methods have been developed to obtain the global MPP under partial shading influences. Although the artificial intelligence methods [6,7,8] have been very successful to accurately find the global MPP under various weather conditions, large memory and enormous computational time are required for data training and knowledge-based implementation. To alleviate these intricacies, the metaheuristics methods are propounded because they guarantee optimal searching ability without much mathematical computation [9,10,11,12]. However, there is a tradeoff between the convergence time and searching accuracy. Furthermore, to speed up convergence ratio, hybrid methods combined a metaheuristics method or an artificial intelligence method with a traditional method are issued in [13,14,15,16,17]. Through the results shown in these investigations, the global MPP searching can be achieved. Unfortunately, the computational complexity of these methods become higher, so that the implementation is difficult [18,19]. This implies that the current MPPT studies still have disadvantages including high complexity, long convergence time, and low accuracy.
From the reviews mentioned above, a novel MPPT control approach is proposed in this paper. In detail, a typical standalone PV power conversion system [5,20,21,22] is established to evaluate the efficiency of the proposed method. The new idea behind the horse racing algorithm (HRA) comes from simulating (mimicking) a horse racing game to achieve the global MPP searching accurately and effectively. The proposed HRA MPPT method can quickly achieve the global MPP without more oscillation around the global MPP, such that the high efficiency of the PV system is obtained. The power conversion system not only transfers power from the PV energy system to the load but also increases the output power for efficiency. This implies that the current MPPT studies still have disadvantages including high complexity, long convergence time, and low accuracy.
The remainder of this paper is organized as follows. Section 2 introduces the PV system model and the DC-DC boost converter. The proposed HRA based MPPT control method is presented in Section 3. Simulation and experimental results are shown in Section 4 and Section 5, respectively. Some conclusions are made in Section 6.
2. Model of the PV Power Conversion Systems
2.1. PV Power Array Model
PV cells are the smallest components of a PV panel to convert the solar irradiance into electrical power. A PV cell model consists of a diode, a resistor connected in parallel to the diode, and a resistor connected in series [23,24,25]. The output current of a PV cell () is calculated by the following equations:
where acronyms, symbols in the above equations are defined in Table 1. In practical applications, a single PV cell cannot generate enough electrical power to supply the load. Furthermore, PV cells are connected in series and parallel as a PV panel or a PV array to obtain the larger output voltage and current. The equivalent model of the PV array can be exhibited as shown in Figure 1. To simplify the calculation, the resistors in the model are assumed to be ideal, i.e., = 0 Ω, = ∞ Ω. As a result, the output current () and power () of the ideal PV array are calculated by using the formulas below:
where the parameters are defined in Table 1.

Table 1.
Symbols and paraphrase for the PV panel.
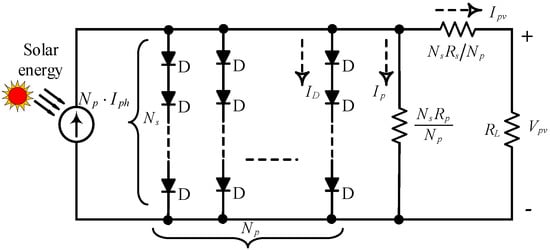
Figure 1.
Equivalent model of a PV array.
For the standalone PV power system, the PV panels are connected in a parallel and series configuration. In the case of uniform PV illumination intensity, all PV panels will emit the same current and voltage. As shown as the black P-V curve in Figure 2, only one power peak appears on the P-V curve, where it is easily found by traditional MPPT methods as well as modern MPPT methods. In contrast, when the illuminance intensity on the PV panels is not uniform, the P-V curve will have many power peaks, e.g., the red and green P-V curves as shown as in Figure 2. In which there is one highest power peak called the global maximum power point, and the remaining peaks have smaller power values called local maximum power points. Since the partial shaded PV panels only provide low output currents, the overall efficiency is limited. Furthermore, each PV panel is parallel with a bypass diode, as an example shown in Figure 3. At that time, the bypass diode will conduct the current of the whole PV system to bypass the shaded PV panel which can only provide a lower limited current. As a result, the power of the PV system under the partial shading effect is improved. For example, when the illuminance intensity of the PV panels in Figure 3 are distributed in 100, 75, 45 mW/cm2, the PV output current and output voltage have the relationship given in Table 2, where , , respectively, are the short-circuit currents satisfying . In other words, the shaded PV panel may be isolated for some cases of load currents. This induces multiple power peaks in the P-V curve under partial shading influences as shown as Figure 2.
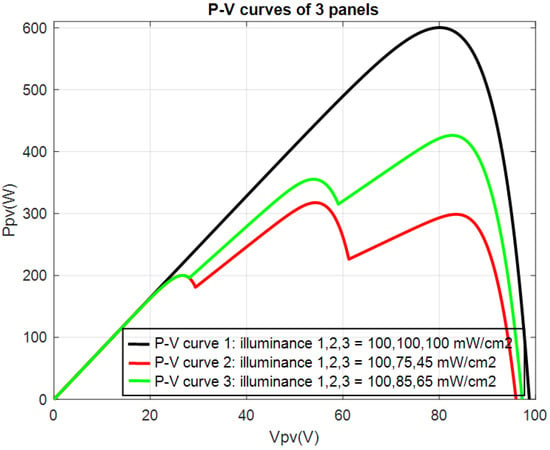
Figure 2.
P-V curves of three PV power panels in series.
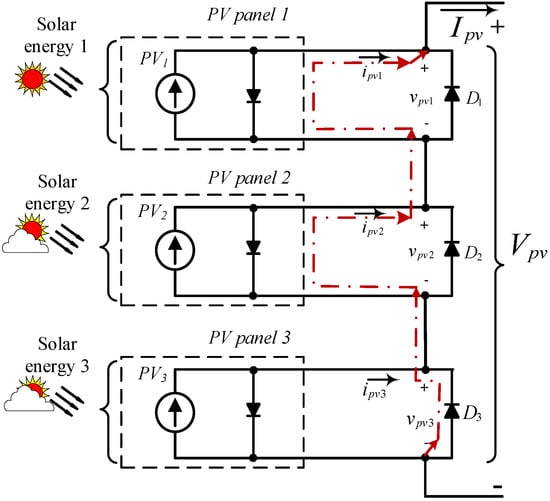
Figure 3.
Model of the PV string under partial shading conditions.

Table 2.
Relationship between the output voltage and current under partial influences.
2.2. DC-DC Boost Converter
For some applications requiring a larger voltage for loads, the boost converter is used in the PV power conversion system [26,27]. To obtain high power conversion efficiency, the system is controlled for impedance matching between the PV panels and load by adjusting the duty ratio () of the boost converter in MPPT control. The basic structure of the boost converter is illustrated as shown in Figure 4. Assume that the transient response of the boost converter is omitted. The duty ratio can be determined by:
where is the impedance of the load; and is the impedance of the PV panel. However, the impedance of the PV panels is difficult to find because the characteristics of the PV panels is dependent on the varying environment situations. In other words, we require an intelligent MPPT method to achieve the impedance matching.
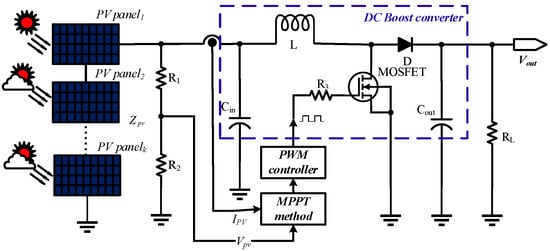
Figure 4.
PV power conversion system with the boost converter.
3. Proposed HRA MPPT Method
In order to extract the maximum power from the PV array at any time, the PV power conversion system shown in Figure 4 is applied and an efficient MPP search method is designed here. In this paper, a novel horse racing algorithm (HRA) based MPPT control strategy is proposed for optimal efficiency. From the horse racing game rules, we develop the horse racing algorithm (HRA) with the qualifying stage and final ranking stage. In the qualifying stage, the racehorses are appropriately located, and their scores are evaluated to eliminate the poor horses and obtain better horses. Next, the positions of better horses are iteratively updated and qualified, such that the racehorses have the same best score. If the qualified horses do not converge to a concerned score region, only the selected best horses are tuned in the final ranking stage to save the computation. As a result, the HRA method is introduced for the MPPT as below.
In the horse racing sport, the racehorses are separated into several racing groups for running in several qualifying rounds. Each racing group has a certain number of racehorses, and they are numbered, arranged at the starting line. After each lap is finished, some slower running racehorses will be removed from the track in the current lap to avoid being merged into the next lap. At the end of each lap, some better racehorses and the global best racehorse are chosen to compare ranking with the next racing laps and other groups in the final ranking phase. The best of the whole racehorses is thus found in the final phase. Depending on the nature and size of the race, the number of laps (), better racehorses () for each lap, and the global best racehorse () of all the groups are also adjusted to match the size of the competition.
Inspired by the horse racing competition, a horse racing algorithm is created and applied on searching the global MPP of the PV energy system. In which the power is the score performance of each racehorse. The duty ratio of the boost converter is taken as the control variable which is ranged from the minimum to the maximum . In detail, the HRA is divided into two stages described as follows.
3.1. The Qualifying Stage
The main goal of this stage is to select better racehorses for final competition. Furthermore, this stage is implemented by 4 steps as follows.
- Step 1: Arrange the racing positions of the racehorses
The racehorses are divided into groups, where each group has racehorses. The active area of each racehorse is given by:
where is the running active area of each racehorse; is the index of the racehorse for one group; is the group index; is the lap index for one group; ; ; is a resolution parameter of the duty ratio adjusted by users; and is defined as the interval size between two horses. In other words, the -multiplied limited range of the duty ratio from the minimum to the maximum is evenly divided into the areas. Next, the starting position of the racehorse will randomly move inside the active area which is his lane. Furthermore, the positions of the racehorses are defined by the duty ratios to control the boost converter.
where is a random function which takes a random integer number during the active area . This subdivision of the search area is an effective solution to prevent the MPP searching process trapped in the local power region.
- Step 2: Eliminate racehorses with the lower performance
After the racehorses finish one running lap, the race scores are obtained, i.e., each duty ratio (each racehorse position) is applied on the power conversion system and leads to a corresponding output PV power value . From these results, the racehorses are evaluated according to their performance by:
where is a performance cutting coefficient, its value is less than 1; is the maximum power value obtained from the finished racehorse positions in the current lap. If the racehorses with lower power performance do not satisfy the condition of inequality (10), then these weaker racehorses are removed from the racetrack to avoid merging into the next racing lap. The remainder qualified racehorses will join with other racehorses in the next laps. Moreover, the best racehorses are selected from the qualified racehorses from inequality (10) in the current lap and are denoted as the position for . In addition, the worst racehorse is determined from the qualified racehorses with the duty ratio . The global best racehorses in the ranking of all qualified racehorses are selected and denoted as , for .
- Step 3: Evaluate global best racehorses
The race will stop when the global best locations satisfy the convergence constraint:
where ; is called the running area of each racehorse; is an adjustment coefficient being less than 1. This means that the global best racehorses converge into the global maximum power region. The win racehorse is located at the .
- Step 4: Reviews and rankings
If the end condition (11) is not achieved, teleport the best locations and update remaining qualified racehorses in next lap. The locations of the best racehorses are updated to participate the race in the next lap. To optimize the solution, we simulate the random movement to the right or left relative to the current location of the racehorses in playing the race game. Accordingly, the best locations will be teleported by:
for , where is the number of extra-laps for displacements to the right and left, respectively. After this teleportation, the best racehorses are evaluated again to obtain the new global best locations (). This way will drive the global best racehorses to converge to one position for satisfying the inequality (11). Meanwhile, to avoid local traps, the positions of the remaining qualified racehorses are also updated in the next laps by the rules:
where ; is the worst location; is an adjustment coefficient to be less than 0.5. It is a worthwhile note that the global best racehorse is also updated by Equation (14) to join the race in the next lap for avoiding the local maximum point. After this update process, the new power performance (race score) is measured again to continue the race. As a result, this step has a great advantage to avoid falling into local traps and to efficiently search the global MPP when the PV system has multiple maximum power peaks. Next, the removal of low power locations is still carried out in progress, while the global best power locations are updated after every lap. This process is continued until (11) is met or all racing groups have completed their race.
3.2. The Final Ranking Stage
If the resultant global best racehorses do not still satisfy the condition (11) after all racing groups have completed their competition, the algorithm enters the final ranking stage. This stage is implemented by one step continuing the above qualifying stage.
- Step 5: Update the global best racehorses to yield their scores being close in extra laps. The update law is presented by:
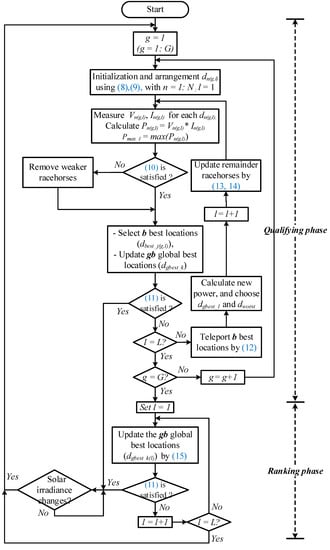
Figure 5.
Flowchart of the proposed HRA MPPT method.
With initial location arrangement in the qualifying stage, the proposed MPPT method will avoid falling into the local MPP trap and quickly find the global MPP. The proposed method is resulting in the faster response because only the qualified racehorses are updated for new locations. Furthermore, the remainder racehorses are continuously reduced after each lap according to the qualified condition. These advantages can be shown by comparing the proposed HRA with the PSO, GWO methods. Therefore, the proposed method is very suitable for PV systems operated in various weather conditions.
4. Simulation Results
For comparison of results between simulation and experiment, the specifications of the PV power system are set the same for the simulation and actual cases, where the parameters of one PV panel are listed in Table 3. The basic components of the boost converter include the conductor = 1.4 mH, the capacitors = 330 μF, = 470 μF, and the load resistor = 40 Ω connected to the output of the boost converter. The switching frequency = 20 kHz is selected for the MOSFET. For the HRA algorithm, the number of racehorses is 8 for each group, the number of laps () is 4, and the number of groups () is 3. Both the number of the selected best racehorses () and the global best racehorses () are set to 3. The values of , , , and are 0.25, 0.65, 0.9, and 1000, respectively. The calculation of the MPPT algorithm is performed in period of 400 switching cycles for the MOSEFT, i.e., the voltage and current values of the PV energy system are measured every 20 ms. Two PV energy system configurations are built for simulation including three serial PV panels and two serial PV panels, respectively. Moreover, the proposed method and the conventional PSO, GWO methods will be performed in the same setting to evaluate and compare the results.

Table 3.
Relationship between the output voltage and current under partial influences.
4.1. Three PV Panel Configuration Case
Consider three PV panels connected in series for the PV power system. Assume that three situations of solar irradiance intensities occur and result in the P-V characteristic curves as shown in Figure 6. The black, red, and green color curves represent the three irradiance situations, respectively, where the second and third situations are the partial shading cases. The hexagon is the best location with the global maximum power. To verify the validity of the proposed method, various irradiance intensities are considered in the simulation, where the three situations occur in turn, i.e., the irradiance situation 1 occurs from 0.0 to 3.0 s, the situation 2 occurs from 3.0 to 6.0 s, and the situation 3 occurs from 6.0 to 9.0 s.
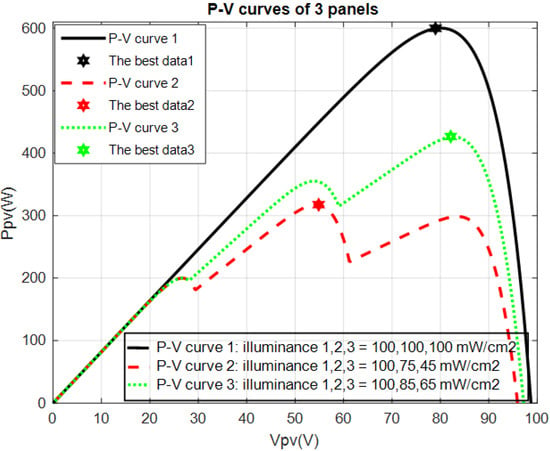
Figure 6.
P-V curve characteristics of three serial PV panels.
After applying the conventional PSO [29], GWO [30], and proposed HRA methods, the simulation results are obtained as shown in Figure 7, Figure 8 and Figure 9. In these figures, the dashed lines show the values of the global maximum power, i.e., 600.2 W (the black dashed line), 317.5 W (the red dashed line), and 426.2 W (the green dashed line). From the results, the proposed HRA method has converged and achieved the global MPPs faster than the conventional PSO, GWO methods. Thus, the efficiency of the proposed method is assured through its faster convergence speed to compared to conventional PSO, GWO methods [31,32].
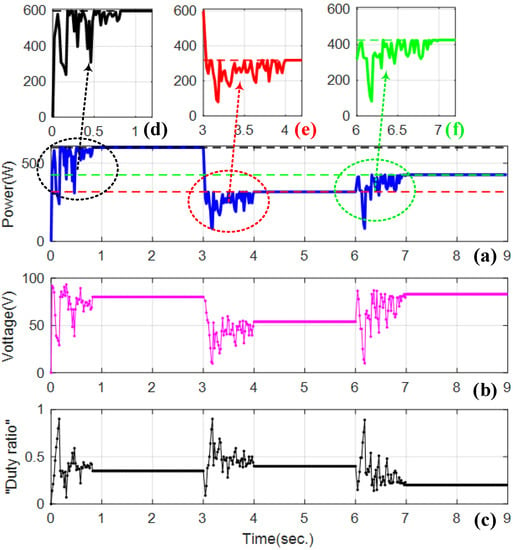
Figure 7.
Results of the PSO method for three serial panels. (a) PV power, (b) PV voltage, (c) duty ratio, and (d–f) transient trajectories for situations 1–3, respectively. (Black --, red --, green --: global maximum values of situations 1–3).
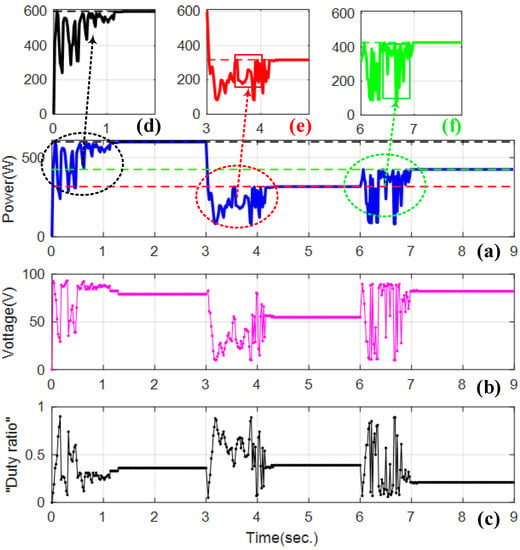
Figure 8.
Results of the GWA method for three serial panels. (a) PV power, (b) PV voltage, (c) duty ratio, and (d–f) transient trajectories for situations 1–3, respectively. (Black --, red --, green --: global maximum values of situations 1–3).
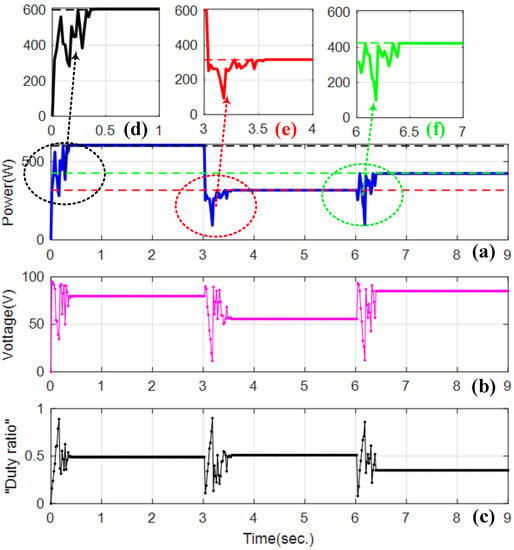
Figure 9.
Results of the proposed HRA method for three serial panels. (a) PV power, (b) PV voltage, (c) duty ratio, and (d–f) transient trajectories for situations 1–3, respectively. (Black --, red --, green --: global maximum values of situations 1–3).
4.2. Two PV Panel Configuration Case
In this case, we consider two PV panels connected in series for the PV power system. Assume that three situations of solar irradiance intensities occur, where the three irradiance situations are assumed to be (85, 32) mW/cm2, (85, 85) mW/cm2, and (85, 57) mW/cm2 for the two panels, respectively. The ambient temperature is 22 °C. The resultant P-V characteristic curves are shown in Figure 10, where black, red, and green color curves represent the three irradiance situations, respectively. The first and third situations are the partial shading cases. The hexagon points are the best locations with the global maximum power 140, 280, and 200.5 W for the situations 1 to 3, sequentially. The three radiation intensity situations will be considered in the simulation and experiments.
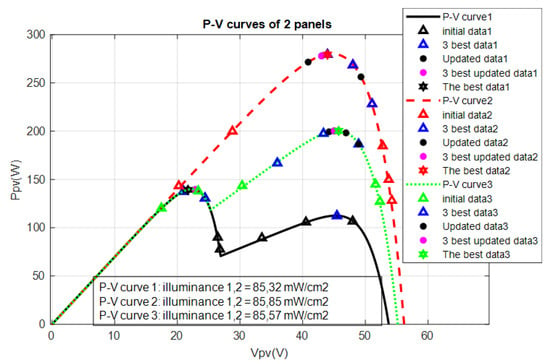
Figure 10.
P-V curve characteristics of two serial PV panels.
After applying the conventional PSO [29], GWO [30], and proposed HRA methods, the simulation results are obtained as shown in Figure 11, Figure 12 and Figure 13. From the results, the proposed HRA method has converged and achieved the global MPPs faster than the PSO, GWO methods. The comparison of the convergence time for the above and these cases is stated in Table 4, where the proposed HRA MPPT method spends less time in the transient response. It is a worthwhile note that the updated positions of the HRA processing of MPP searching are illustrated in Figure 10. The searched locations in the HRA continuously tend to be close to the global MPP after each lap. Thus, less calculation is used in the proposed HRA MPPT method, such that the faster response is obtained. In addition, the achievements of the proposed method are also compared with other methods in terms of convergence speed under uniform radiation as well as partial shading conditions. The comparison results in Table 5 have proved this statement.
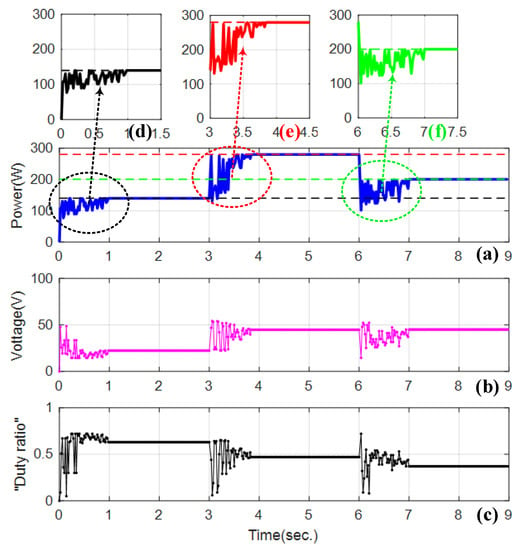
Figure 11.
Results of the PSO method for two serial panels. (a) PV power, (b) PV voltage, (c) duty ratio, and (d–f) transient trajectories for situations 1–3, respectively. (Black --, red --, green --: global maximum values of situations 1–3).
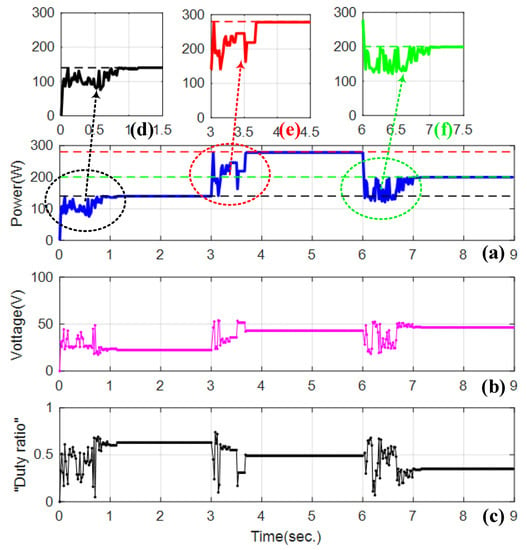
Figure 12.
Results of the GWA method for two serial panels. (a) PV power, (b) PV voltage, (c) duty ratio, and (d–f) transient trajectories for situations 1–3, respectively. (Black --, red --, green --: global maximum values of situations 1–3).
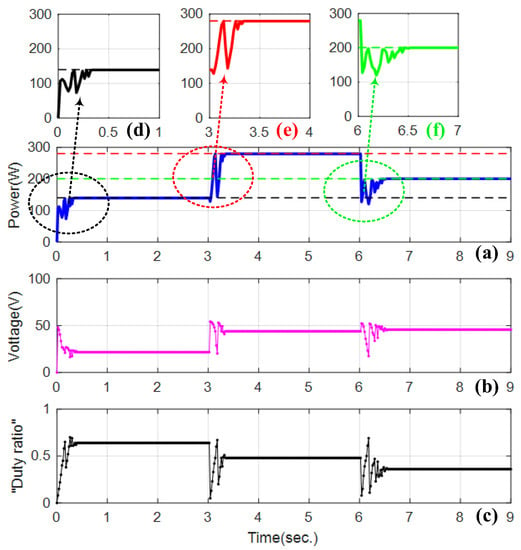
Figure 13.
Results of the proposed HRA method for two serial panels. (a) PV power, (b) PV voltage, (c) duty ratio, and (d–f) transient trajectories for situations 1–3, respectively. (Black --, red --, green --: global maximum values of situations 1–3).

Table 4.
Comparison of simulation results between three MPPT methods for two cases.

Table 5.
Comparison of the simulation results of different algorithms.
5. Experimental Verification and Discussion
5.1. Experimental Setting
The new proposed HRA method and typical PSO and GWO algorithms are compared for fairness using an experimental model. This model structure is built based on the configuration shown in Figure 4, which shows two PV panels connected in series. Table 2 contains information on the PV panel specifications. The components of the boost converter are designed with the following values: the input capacitor = 220 μF/200 V, the output capacitor = 330 μF/450 V, the inductor = 1.5 mH, the high frequency switching diode = PT, the electronic power switch MOSFET = N, and the resistant load = 40 Ω. The boost converter is designed to be capable for 200 V output voltage and 500 W output power. The experiment was carried out with an ARDUINO Mega2560 board-controlled DC/DC boost converter to determine the feasibility and efficacy of the MPP search technique using the proposed HRA method. This ARDUINO Mega 2560 board has an intuitive I/O interface, high clock speed (16 MHz), and simple design. The Mega 2560 micro-controller includes 16 analog inputs, each providing 10 bits of resolution, and there are 54 digital I/O pins (of which 14 provide PWM output) used for measuring and signal control. Each duty ratio value runs for 30 milliseconds to capture the PV current and PV voltage values of the power system using the current sensor and the voltage divider created by the resistors and .
The experimental environment has an ambient temperature of 21–23 °C and normal irradiance intensity of 83–87 mW/cm2. When the partial shading (generated by manual work) occurs on one of the two PV panels, the measured irradiance intensities are 85 and 57 mW/cm2, i.e., the situations 2 and 3 in Figure 10 are used for the verification. The parameters of the proposed HRA method and the PSO, GWO algorithms are established as the simulation setting above.
5.2. Experimental Verification and Discussion
Under normal weather circumstances, the measured solar radiation intensity values are 85 mW/cm2 on both PV panels. The global MPP value under the uniform condition is obtained after applying the approaches, and it is around 280 W for the GWO, HRA methods, and about 176 W for the PSO method. The proposed HRA method can acquire the global MPP in under 0.4 s. In comparison, the typical PSO and GWO algorithms require 1.56 and 1.9 s, respectively, to reach the global MPP.
At the second situation, after around 8 s, one of the two PV panels is partially shaded, the irradiance intensity measured on this shaded PV panel is 57 mW/cm2 and the normal PV panel is 85 mW/cm2. The global MPP value during partial shading condition was achieved about 200 W in 2.2 and 1.0 s for the GWO and the proposed method, respectively, while the PSO obtained the global MPP about 196 W in 1.6 s. The power value obtained by the PSO method is lower than that of the GWO and HRA methods due to the reduced radiation intensity at the time of the PSO method experiment. However, the PSO method still reached the global MPPs at that time.
The experimental results of the conventional PSO and GWO methods are shown in Figure 14 and Figure 15, respectively. Figure 16 exhibits the experimental results of the proposed HRA MPPT method, which obtained global MPPs faster than typical PSO and GWO algorithms. The displayed results demonstrate that the PSO and GWO methods are susceptible to abrupt variations in the power value following each MPP execution step because the duty ratio value change is unpredictable. This causes the current and voltage of PV system to shift suddenly, causing unneeded disturbances. The disturbance is reduced due to the benefits of the suggested MPP tracking strategy, and the tracking power values tend to gradually reach the global MPP value. This experimental result once again proved the outstanding advantages of the proposed method in two aspects:
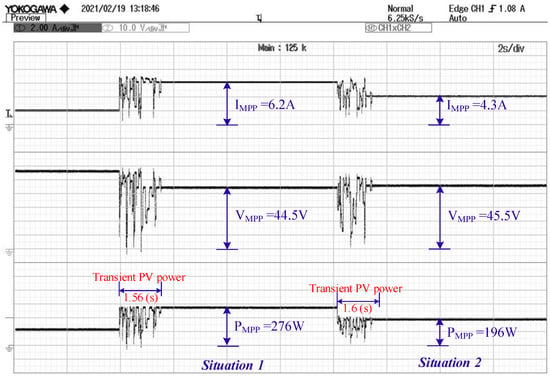
Figure 14.
Experimental results of the PSO method (top to bottom: PV current, PV voltage, PV power).
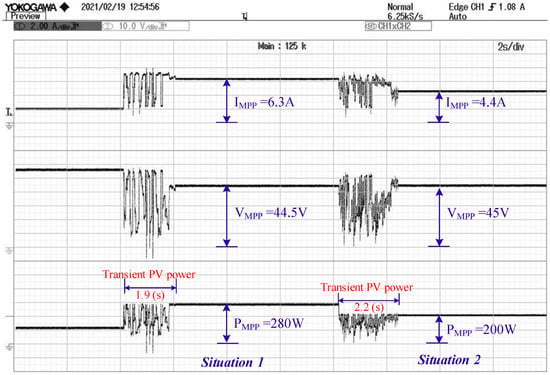
Figure 15.
Experimental results of the GWA method (top to bottom: PV current, PV voltage, PV power).
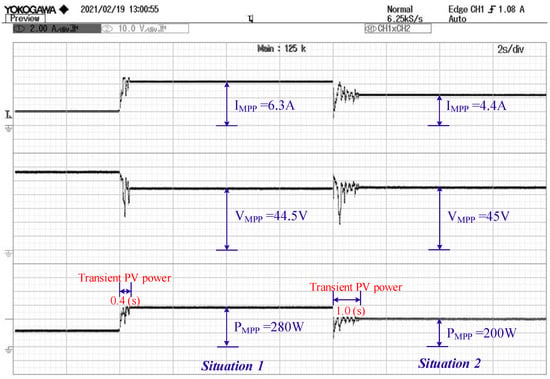
Figure 16.
Experimental results of the proposed HRA method (top to bottom: PV current, PV voltage, PV power).
Fast convergence time.
The power values tend to teleport to the global power value after each loop. In other words, the amplitude of transient oscillation decreases after each iteration of the proposed algorithm.
Therefore, the proposed method has better efficiency in terms of fast convergence speed and less transient oscillation. As a result, the global MPPT is achieved even when the solar radiation intensity on PV panels changes rapidly due to various weather conditions. The effectiveness of the proposed method is demonstrated through comparison with other methods in terms of convergence speed. These results are shown in Table 6.

Table 6.
Comparison of the experimental results of different algorithms.
6. Conclusions
A novel MPPT control approach called the HRA has been proposed in this paper. When the PV energy system is operated under partial shade conditions, the suggested algorithm is effective to prevent falling into the local power areas due to the arrangement of the initial racehorses and qualifying rules for racehorses. The HRA has less transient computing states, i.e., transient oscillation is less for the PV power system when conducting MPPT. This is achieved because weaker racehorses are removed from the racetrack, and the remaining racehorse positions are updated to be closer to the global power location. The validity of the suggested strategy has been demonstrated by simulation results with four different partial shading situations and two uniform irradiance intensity cases on the PV system. The experimental results under the influence of partial shadowing as well as uniform irradiance intensity conditions have verified the effectiveness of the proposed method. As a result, the proposed HRA approach for searching the global MPP provides faster convergence speed and less transient oscillation than the typical PSO and GWO methods. These results are proved by simulation and experimental results, which can be seen in Table 4, Table 5 and Table 6.
Author Contributions
Software, T.-D.N.; writing—original draft preparation, S.N.; writing—review and editing, C.-S.C. All authors have read and agreed to the published version of the manuscript.
Funding
This research received no external funding.
Acknowledgments
This work was supported by the Ministry of Science and Technology, R.O.C., under Grant MOST-107-2221-E-033- 064.
Conflicts of Interest
The authors declare no conflict of interest.
References
- Li, G.; Chen, Y.; Yu, Y.; Tang, R.; Mawire, A. Performance and design optimization of single-axis multi-position sun-tracking PV panels. J. Renew. Sustain. Energy 2019, 11, 063701. [Google Scholar] [CrossRef]
- Shengqing, L.; Fujun, L.; Jian, Z.; Wen, C.; Donghui, Z. An improved MPPT control strategy based on incremental conductance method. Soft Comput. 2020, 24, 6039–6046. [Google Scholar] [CrossRef]
- Bhattacharyya, S.; Kumar, P.D.S.; Samanta, S.; Mishra, S. Steady Output and Fast Tracking MPPT (SOFT-MPPT) for P&O and InC Algorithms. IEEE Trans. Sustain. Energy 2021, 12, 293–302. [Google Scholar] [CrossRef]
- Abdel-Salam, M.; El-Mohandes, M.-T.; Goda, M. An improved perturb-and-observe based MPPT method for PV systems under varying irradiation levels. Sol. Energy 2018, 171, 547–561. [Google Scholar] [CrossRef]
- Chalh, A.; El Hammoumi, A.; Motahhir, S.; El Ghzizal, A.; Subramaniam, U.; Derouich, A. Trusted Simulation Using Proteus Model for a PV System: Test Case of an Improved HC MPPT Algorithm. Energies 2020, 13, 1943. [Google Scholar] [CrossRef]
- Tossa, A.K.; Soro, Y.M.; Coulibaly, Y.; Azoumah, Y.; Migan-Dubois, A.; Thiaw, L.; Lishou, C. Artificial intelligence technique for estimating PV modules performance ratio under outdoor operating conditions. J. Renew. Sustain. Energy 2018, 10, 053505. [Google Scholar] [CrossRef]
- Ahmed, S.; Muhammad Adil, H.M.; Ahmad, I.; Azeem, M.K.; e Huma, Z.; Abbas Khan, S. Supertwisting Sliding Mode Algorithm Based Nonlinear MPPT Control for a Solar PV System with Artificial Neural Networks Based Reference Generation. Energies 2020, 13, 3695. [Google Scholar] [CrossRef]
- Hadji, S.; Gaubert, J.-P.; Krim, F. Real-Time Genetic Algorithms-Based MPPT: Study and Comparison (Theoretical an Experimental) with Conventional Methods. Energies 2018, 11, 459. [Google Scholar] [CrossRef]
- Zhang, M.; Chen, Z.; Wei, L. An Immune Firefly Algorithm for Tracking the Maximum Power Point of PV Array under Partial Shading Conditions. Energies 2019, 12, 3083. [Google Scholar] [CrossRef]
- Chiu, C.-S.; Ngo, S. A Novel Algorithm-based MPPT Strategy for PV Power Systems under Partial Shading Conditions. Elektron. Ir Elektrotechnika 2022, 28, 42–51. [Google Scholar] [CrossRef]
- He, H.; Lu, Z.; Guo, X.; Shi, C.; Jia, D.; Chen, C.; Guerrero, J.M. Optimized Control Strategy for Photovoltaic Hydrogen Generation System with Particle Swarm Algorithm. Energies 2022, 15, 1472. [Google Scholar] [CrossRef]
- Ranganathan, E.; Natarajan, R. Spotted Hyena Optimization Method for Harvesting Maximum PV Power under Uniform and Partial-Shade Conditions. Energies 2022, 15, 2850. [Google Scholar] [CrossRef]
- Rizzo, S.A.; Scelba, G. A hybrid global MPPT searching method for fast variable shading conditions. J. Clean. Prod. 2021, 298, 126775. [Google Scholar] [CrossRef]
- Chao, K.-H.; Rizal, M.N. A Hybrid MPPT Controller Based on the Genetic Algorithm and Ant Colony Optimization for Photovoltaic Systems under Partially Shaded Conditions. Energies 2021, 14, 2902. [Google Scholar] [CrossRef]
- Chiu, C.-S.; Ngo, S. Hybrid SFLA MPPT design for multi-module partial shading photovoltaic energy systems. Int. J. Electron. 2022, 109, 1–22. [Google Scholar] [CrossRef]
- Al-Wesabi, I.; Fang, Z.; Farh, H.M.H.; Al-Shamma’a, A.A.; Al-Shaalan, A.M.; Kandil, T.; Ding, M. Cuckoo Search Combined with PID Controller for Maximum Power Extraction of Partially Shaded Photovoltaic System. Energies 2022, 15, 2513. [Google Scholar] [CrossRef]
- Sharma, A.; Sharma, A.; Jately, V.; Averbukh, M.; Rajput, S.; Azzopardi, B. A Novel TSA-PSO Based Hybrid Algorithm for GMPP Tracking under Partial Shading Conditions. Energies 2022, 15, 3164. [Google Scholar] [CrossRef]
- Danandeh, M.A.; Mousavi, G.S.M. Comparative and comprehensive review of maximum power point tracking methods for PV cells. Renew. Sustain. Energy Rev. 2018, 82, 2743–2767. [Google Scholar] [CrossRef]
- Gupta, A.; Chauhan, Y.K.; Pachauri, R.K. A comparative investigation of maximum power point tracking methods for solar PV system. Sol. Energy 2016, 136, 236–253. [Google Scholar] [CrossRef]
- Ngo, S.; Chiu, C.S. Simulation Implementation of MPPT Design under Partial Shading Effect of PV Panels. In Proceedings of the 2020 International Conference on System Science and Engineering (ICSSE), Kagawa, Japan, 31 August–3 September 2020; pp. 1–6. [Google Scholar]
- Ngo, S.; Chiu, C.S. A Short-Distance Running Algorithm Based MPPT Control Strategy for PV Power Systems Under Partial Shading Conditions. In Proceedings of the 2022 International Power Electronics Conference (IPEC-Himeji 2022- ECCE Asia), Himeji. Japan, 15–19 May 2022; pp. 1573–1577. [Google Scholar]
- Vankadara, S.K.; Chatterjee, S.; Balachandran, P.K.; Mihet-Popa, L. Marine Predator Algorithm (MPA)-Based MPPT Technique for Solar PV Systems under Partial Shading Conditions. Energies 2022, 15, 6172. [Google Scholar] [CrossRef]
- Windarko, N.A.; Nizar Habibi, M.; Sumantri, B.; Prasetyono, E.; Efendi, M.Z.; Taufik. A New MPPT Algorithm for Photovoltaic Power Generation under Uniform and Partial Shading Conditions. Energies 2021, 14, 483. [Google Scholar] [CrossRef]
- Premkumar, M.; Subramaniam, U.; Babu, T.S.; Elavarasan, R.M.; Mihet-Popa, L. Evaluation of Mathematical Model to Characterize the Performance of Conventional and Hybrid PV Array Topologies under Static and Dynamic Shading Patterns. Energies 2020, 13, 3216. [Google Scholar] [CrossRef]
- Akram, N.; Khan, L.; Agha, S.; Hafeez, K. Global Maximum Power Point Tracking of Partially Shaded PV System Using Advanced Optimization Techniques. Energies 2022, 15, 4055. [Google Scholar] [CrossRef]
- Basha, C.H.H.; Rani, C. Different Conventional and Soft Computing MPPT Techniques for Solar PV Systems with High Step-Up Boost Converters: A Comprehensive Analysis. Energies 2020, 13, 371. [Google Scholar] [CrossRef]
- Bouarroudj, N.; Boukhetala, D.; Feliu-Batlle, V.; Boudjema, F.; Benlahbib, B.; Batoun, B. Maximum Power Point Tracker Based on Fuzzy Adaptive Radial Basis Function Neural Network for PV-System. Energies 2019, 12, 2827. [Google Scholar] [CrossRef]
- Mao, M.; Zhou, L.; Yang, Z.; Zhang, Q.; Zheng, C.; Xie, B.; Wan, Y. A hybrid intelligent GMPPT algorithm for partial shading PV system. Control Eng. Pract. 2019, 83, 108–115. [Google Scholar] [CrossRef]
- Dileep, G.; Singh, S.N. An improved particle swarm optimization based maximum power point tracking algorithm for PV system operating under partial shading conditions. Sol. Energy 2017, 158, 1006–1015. [Google Scholar] [CrossRef]
- Cherukuri, S.K.; Rayapudi, S.R. Enhanced Grey Wolf Optimizer Based MPPT Algorithm of PV System Under Partial Shaded Condition. Int. J. Renew. Energy Dev. 2017, 6, 10. [Google Scholar] [CrossRef]
- Eltamaly, A.M.; Al-Saud, M.S.; Abokhalil, A.G.; Farh, H.M. Photovoltaic maximum power point tracking under dynamic partial shading changes by novel adaptive particle swarm optimization strategy. Trans. Inst. Meas. Control Eng. Pract. 2020, 42, 104–115. [Google Scholar] [CrossRef]
- Shi, J.-Y.; Zhang, D.Y.; Ling, L.T.; Xue, F.; Li, Y.J.; Qin, Z.J.; Yang, T. Dual-algorithm maximum power point tracking control method for photovoltaic systems based on grey wolf optimization and golden-section optimization. J. Power Electron. 2018, 18, 841–852. [Google Scholar] [CrossRef]
- Eltamaly, A.M. An Improved Cuckoo Search Algorithm for Maximum Power Point Tracking of Photovoltaic Systems under Partial Shading Conditions. Energies 2021, 14, 953. [Google Scholar] [CrossRef]
- Li, H.; Yang, D.; Su, W.; Lu, J.; Yu, X. An Overall Distribution Particle Swarm Optimization MPPT Algorithm for Photovoltaic System Under Partial Shading. IEEE Trans. Ind. Electron. 2019, 66, 265–275. [Google Scholar] [CrossRef]
Publisher’s Note: MDPI stays neutral with regard to jurisdictional claims in published maps and institutional affiliations. |
© 2022 by the authors. Licensee MDPI, Basel, Switzerland. This article is an open access article distributed under the terms and conditions of the Creative Commons Attribution (CC BY) license (https://creativecommons.org/licenses/by/4.0/).