Article

Optimum Solar Panel Orientation and Performance: A Climatic Data-Driven Metaheuristic Approach

Department of Mechanical Engineering, Manhattan College, Riverdale, NY 10471, USA
*
Author to whom correspondence should be addressed.
Energies 2022, 15(2), 624; https://doi.org/10.3390/en15020624
Submission received: 10 December 2021 / Revised: 8 January 2022 / Accepted: 12 January 2022 / Published: 17 January 2022

Abstract

:
This study presents an optimization platform based on the climatic data provided by the National Renewable Energy Laboratory (NREL) to determine the optimum solar panel orientation. Our optimization model is simpler to use than the clearness index model since there is no need to calculate the extraterrestrial insolation on a horizontal flat plate and the shape factor. This optimization approach is based on the hourly climatic data. It determines the optimum tilt angle and azimuth angle of a solar panel for the maximum power generation, considering the diurnal variation of climatic conditions. The hourly evaluation of insolation allows setting up a solar panel azimuth angle that responds to the peak power demand. The main data that impacts the solar panel performance consists of the solar direct normal incident (DNI), direct horizontal incident (DHI), global horizontal incident (GHI), ambient temperature, wind speed, and ground albedo, all of which were obtained from the NREL database for over twenty years. The accuracy of the optimization platform introduced in this study is scrutinized by investigating the three locations in the United States with different climatic conditions. The results based on the present optimization model show higher PV power than the general rule of thumb for south-facing panels with title angles the same as the latitude of the location. Moreover, the effect of deviations from optimum panel orientation is discussed to show the versatility of our technique. Our optimization model is easy-to-use, computationally efficient, and capable of being applied to other locations worldwide.

1. Introduction

Flat plate solar panels, photovoltaic and water heaters, are commonly used to produce green energy. A major issue in the installation of solar panels is their orientations. Based on the general rule of thumb a south-facing panel with a tilt angle the same as the altitude would result in a maximum insolation incident on the solar panel. Several recently published works have shown that, depending on the location, other orientations are more appropriate for maximum solar irradiance on solar panels.
The sequential neural-network approximation is used to determine the optimum tilt angles of south-facing solar panels in various locations in China [1]. This work concluded that the optimum tilt angle for those locations is approximately the same as the latitude of those locations. The Genetic Algorithm and the Simulated-Annealing methods were used to determine optimum tilt angles of south-facing solar panels in various locations in Taiwan [2]. Hussein et al. [3] investigated the performance of monocrystalline silicon PV modules for various tilt angle south-facing panels. They concluded that the best solar panel orientations are south-facing with tilt angles of 20–30° for Cairo, Egypt. Tang and Wu [4] used the monthly clearness index model to determine the optimal south-facing tilt angles for solar collectors used in China. The optimum tilt angle of solar collectors for building applications is studied in [5], concluding that south-facing solar collectors with adjusted monthly tilt angles are the best option. Yang and Lu [6] studied the optimum orientation of PV claddings for building-integrated photovoltaic applications in Hong Kong. They concluded that a south-facing panel with a tilt angle of 20 degrees, which is slightly less than local latitude, yields the maximum power. Optimum orientations of solar panels for Bronx New York based on the clearness index and clear sky models are studied in [7]. It was concluded that a south-facing optimum tilt angle is influenced by ground reflectivity.
Hourly clearness index model is used to determine solar panel orientations in three locations in the United States with different climatic conditions [8]. The advantage of this model over the traditional monthly clearness index is that it takes into consideration the asymmetric nature of solar irradiance relative to the solar noon. Specifically, the pattern of morning solar irradiance and afternoons is different for some locations. This can have some effects on the solar panel orientation as well as the expected amount of insolation at different times of the day. Hartner et al. [9] varied solar panels from east to west and determined the electric energy generated by the panel at each orientation of the panel. Rhodes et al. [10] performed multiple assessments of the effect of solar PV orientation on energy production and system economics. Their study considered the AC power produced from a typical PV system and considered electricity prices on a national scale. The result of their study show how local electricity markets, based on Time-Of-Use (TOU) electricity prices, affect the economic value of solar placement on a national level.
Hafez et al. [11] presented a comprehensive review of optimum solar panel orientations for various locations worldwide. Most recently, Chinchilla et al. [12] used data from 2551 sites worldwide and by using a regression analysis developed correlations for optimum solar panel tilt angles in terms of local latitudes for locations where meteorological data are absent.
Demand-based solar panel orientation has received considerable attention in recent years. In some municipalities, the peak demand occurs during summer afternoons due to heavy use of air conditioning units. The optimum orientation of a solar panel to match the energy consumption of New York City was investigated in [13,14], which concluded that based on the historical power consumption of the city highest power demand is on afternoons during August. The best orientation of the panel to best match the peak demand, which also provides reasonably high overall annual power. Solar panel orientation based on a building power consumption in New York City was investigated in [11], resulting in a westward orientation that responds to the peak demand and provides reasonable overall annual power.
The financial aspect of photovoltaic systems is another consideration in deciding the orientation and cost analysis of solar panels. In many municipalities, nonresidential buildings are charged at a higher rate for their electric consumption during peak demand. Hence, it makes more economic sense to orient solar panels such that the annual cost of electricity is minimized instead of maximizing the total kWh produced by panels. Orientation of solar panels to reduce the cost of electricity for a typical commercial building is addressed in [15]. The electricity market in the United States is managed by an independent service operator (ISO) or regional transmission organization (RTO). As shown in [16], for markets like PJM (Pennsylvania, Jersey, and Maryland RTO) and California ISO, optimum orientation to shave the peak demand produced 50% more energy during the peak demand with just 8–10% drop in annual energy output, leading to a large economic benefit because of higher prices during peak hours and higher capacity value of that resource. Economic benefits, such an optimum orientation, help to stabilize the grid by meeting the peak demand and help in greenhouse gas reduction by decreasing the need to use diesel generators and natural gas plants, which are a major source of CO2 emissions, and the added economic benefits.
The present work introduces a new approach based on the historical climatic data given by the NREL website [17], which provides hourly solar data that spans more than twenty years. The solar data is based on the Direct Normal Incident (DNI), which can be measured by a Pyrheliometer, and Global Horizontal Incident (GHI), which can be measured by a Pyranometer. The advantage of the present approach over the clearness index method described in [18] is that there is no need to evaluate extraterrestrial insolation, clearness index, and the geometric factor, Rb. Since the model skips some unnecessary steps, it makes the model efficient to determine optimum solar panel orientation based on desirable objectives, such as maximum annual power delivered by the PV panels or responding to the peak demand at certain times. The NREL database in addition to the solar data it provides the hourly variation of ambient temperature and wind speed, which affect the efficiency of the solar panel.
The following sections include the Material and Methods section, which is broken into six sections describing the details of the present model. The results section gives details various options for solar panel orientation for three locations in the United States. Finally, the concluding remakes, summarizing the contribution of the present work.

2. Materials and Methods

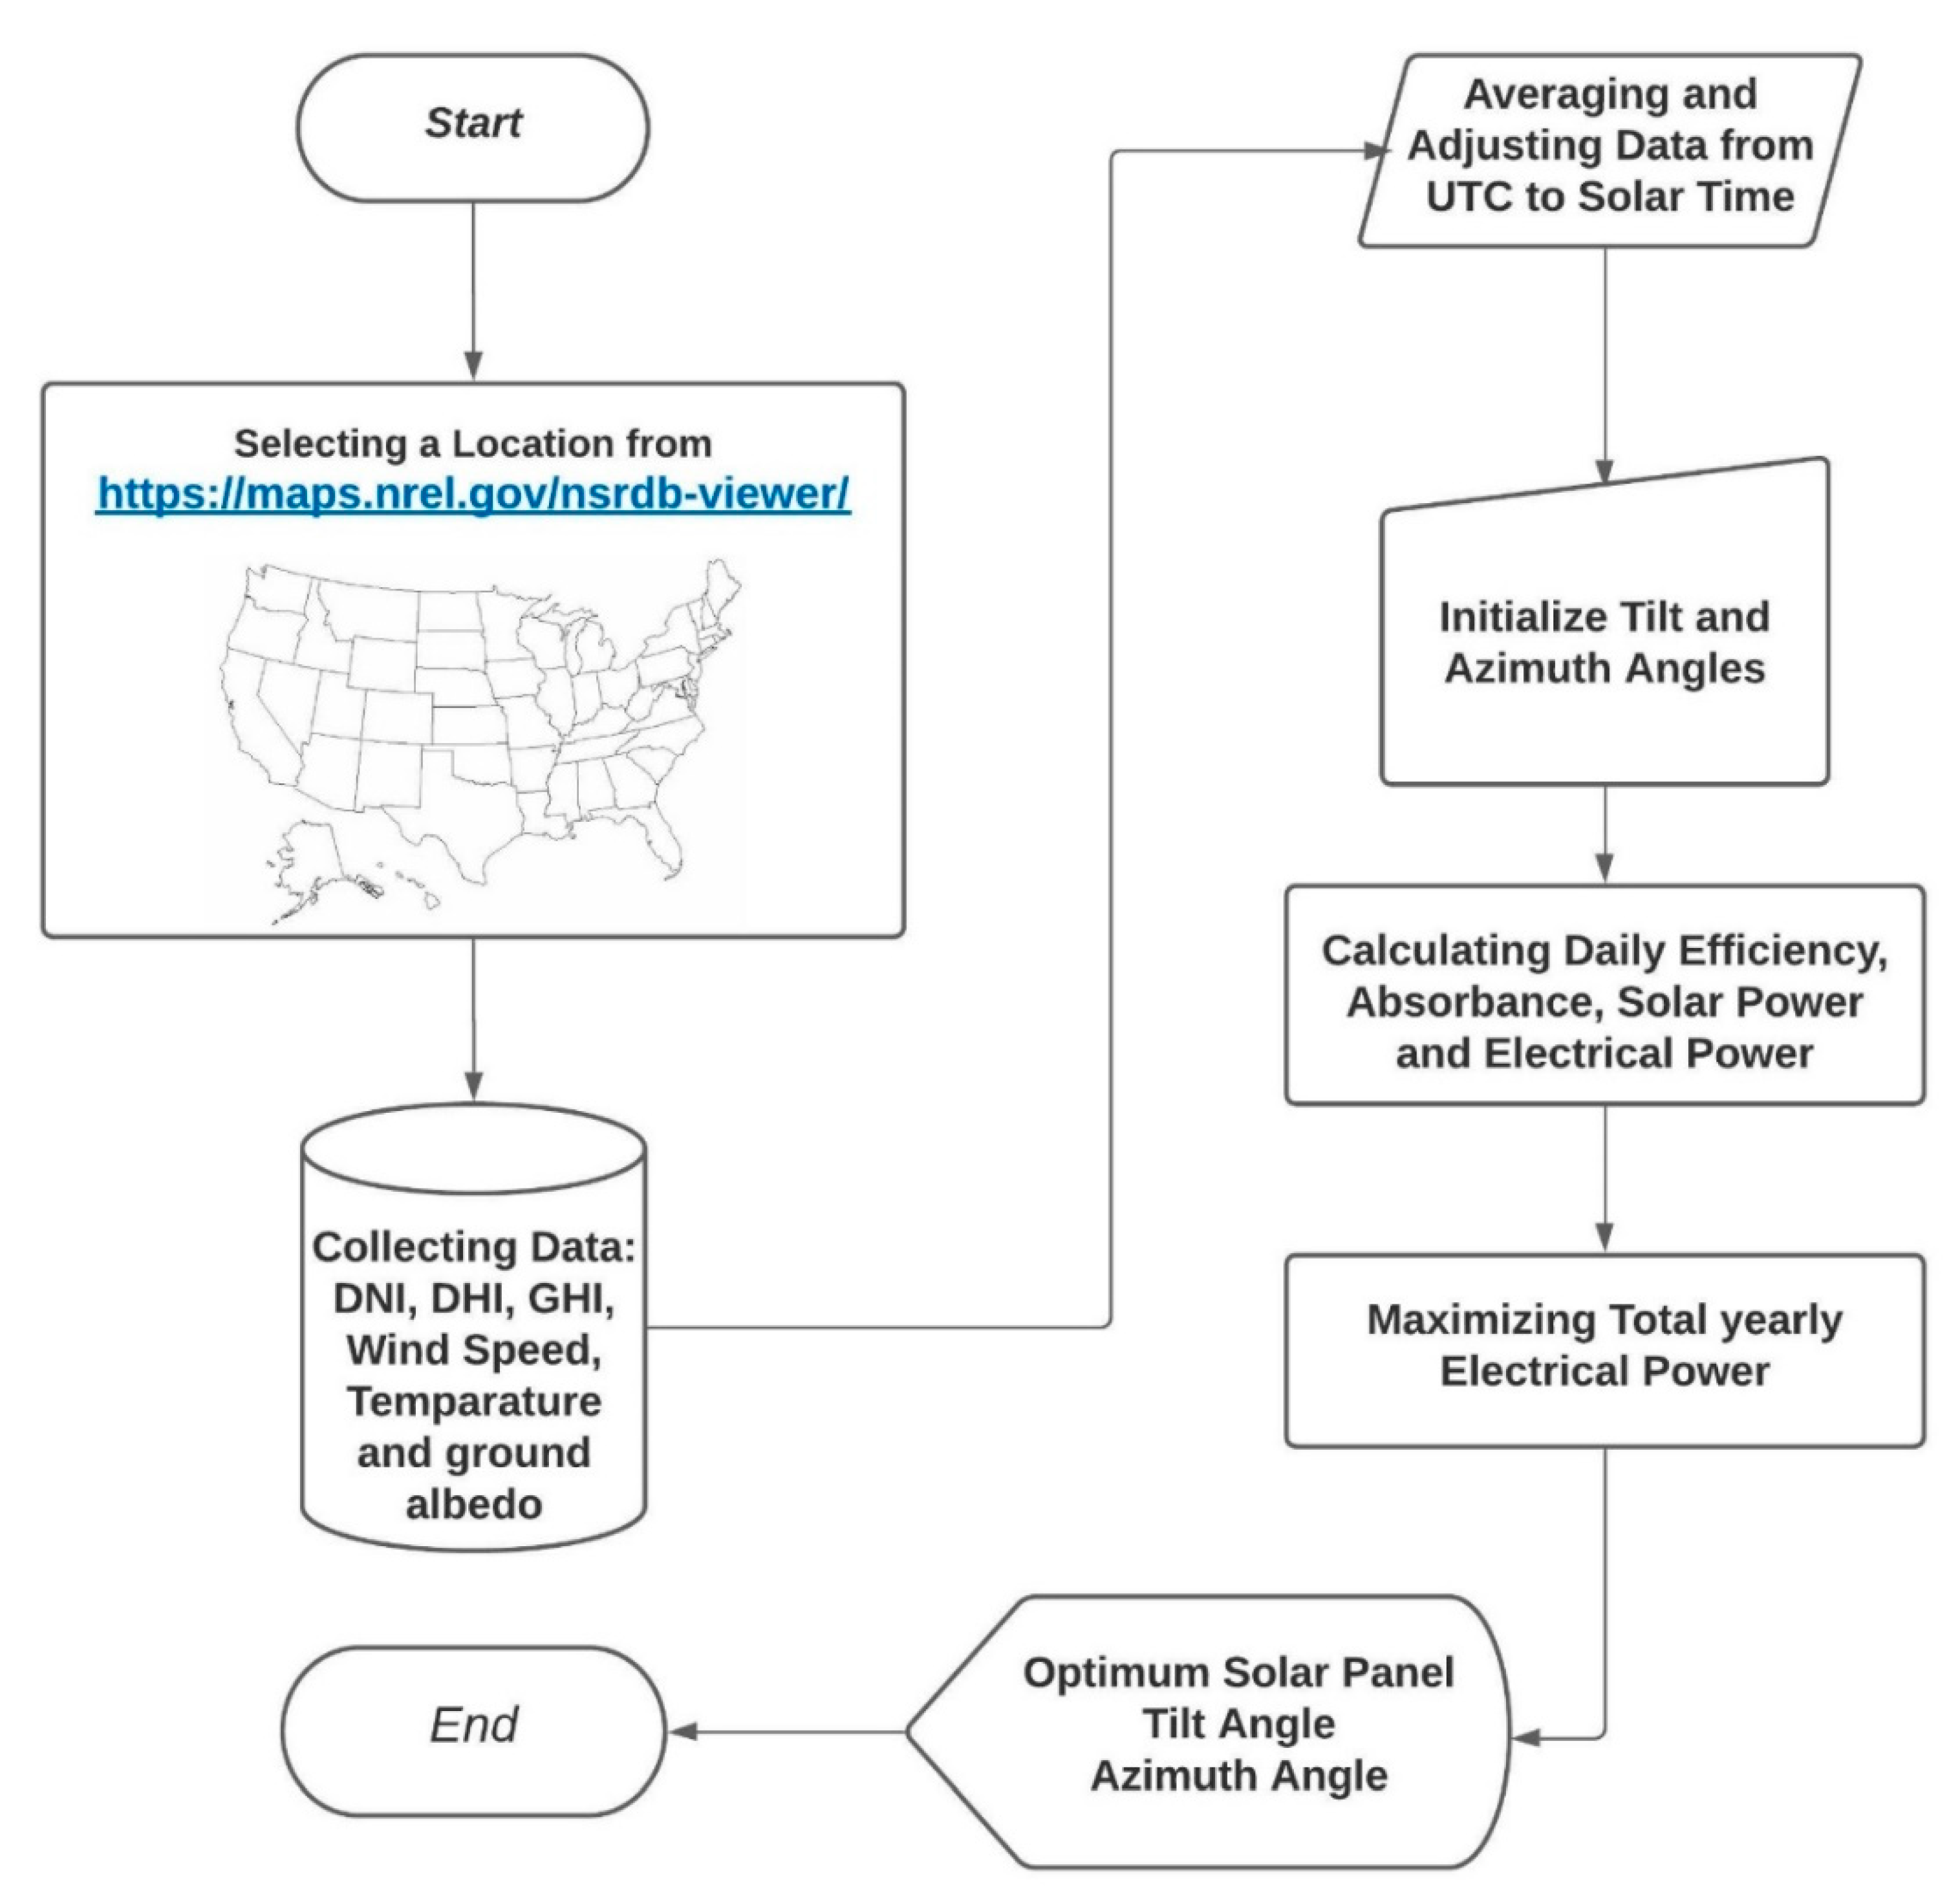
2.1. The Climatic Data-Driven Optimization Platform

The present work introduces a Climatic Data-Driven Optimization Platform (CDDOP) that enables maximizing the power produced by a PV solar panel, and its optimum orientation for maximum annual power generation. The CDDOP is developed based on the data available in the National Renewable Energy (NREL) database [17]. NREL provides climatic and solar data for locations all around the world, and its US locations data are recorded based on half-hourly increments expanding over twenty years. The flowchart of the CDDOP is shown in Figure 1. It starts with downloading historical hourly climatic data from the late 1990s to 2020 through the NREL website [17]. The collected data is preprocessed to remove any missed data points and outliers, and the cleaned data is averaged for a typical year. Next, the total DC power generated by a PV solar panel is estimated considering the absorbance and efficiency of the panel. This estimation is made by incorporating the averaged climatic data into the model explained in detail in the next section. Finally, the Genetic Algorithm (GA) based on a metaheuristic optimization model is used to determine the optimum panel orientation for the maximum annual power generation by the solar panel. The CDDOP is developed using two programming platforms of R 3.6.3, for data processing, and MATLAB 2020b for optimization.
The CDDOP does not require hourly clearness indices, shape factor, and evaluation of extraterrestrial insolation. This makes CDDOP a computationally efficient approach that precisely defines the optimum orientation of a PV solar panel at any arbitrary location. It also provides a good assessment of the annual power generation for alternative deviations from the optimum orientation. A major limitation of CDDOP is that it relies on the availability of historic climatic data. NREL provides climatic data for several locations globally; however, the number of years during which the data is collected might vary from one place to another. The climatic data for the United States locations are available for more than twenty years. For other worldwide locations, the constraint for using CDDOP is when the NREL data is recorded at least for 3 years.

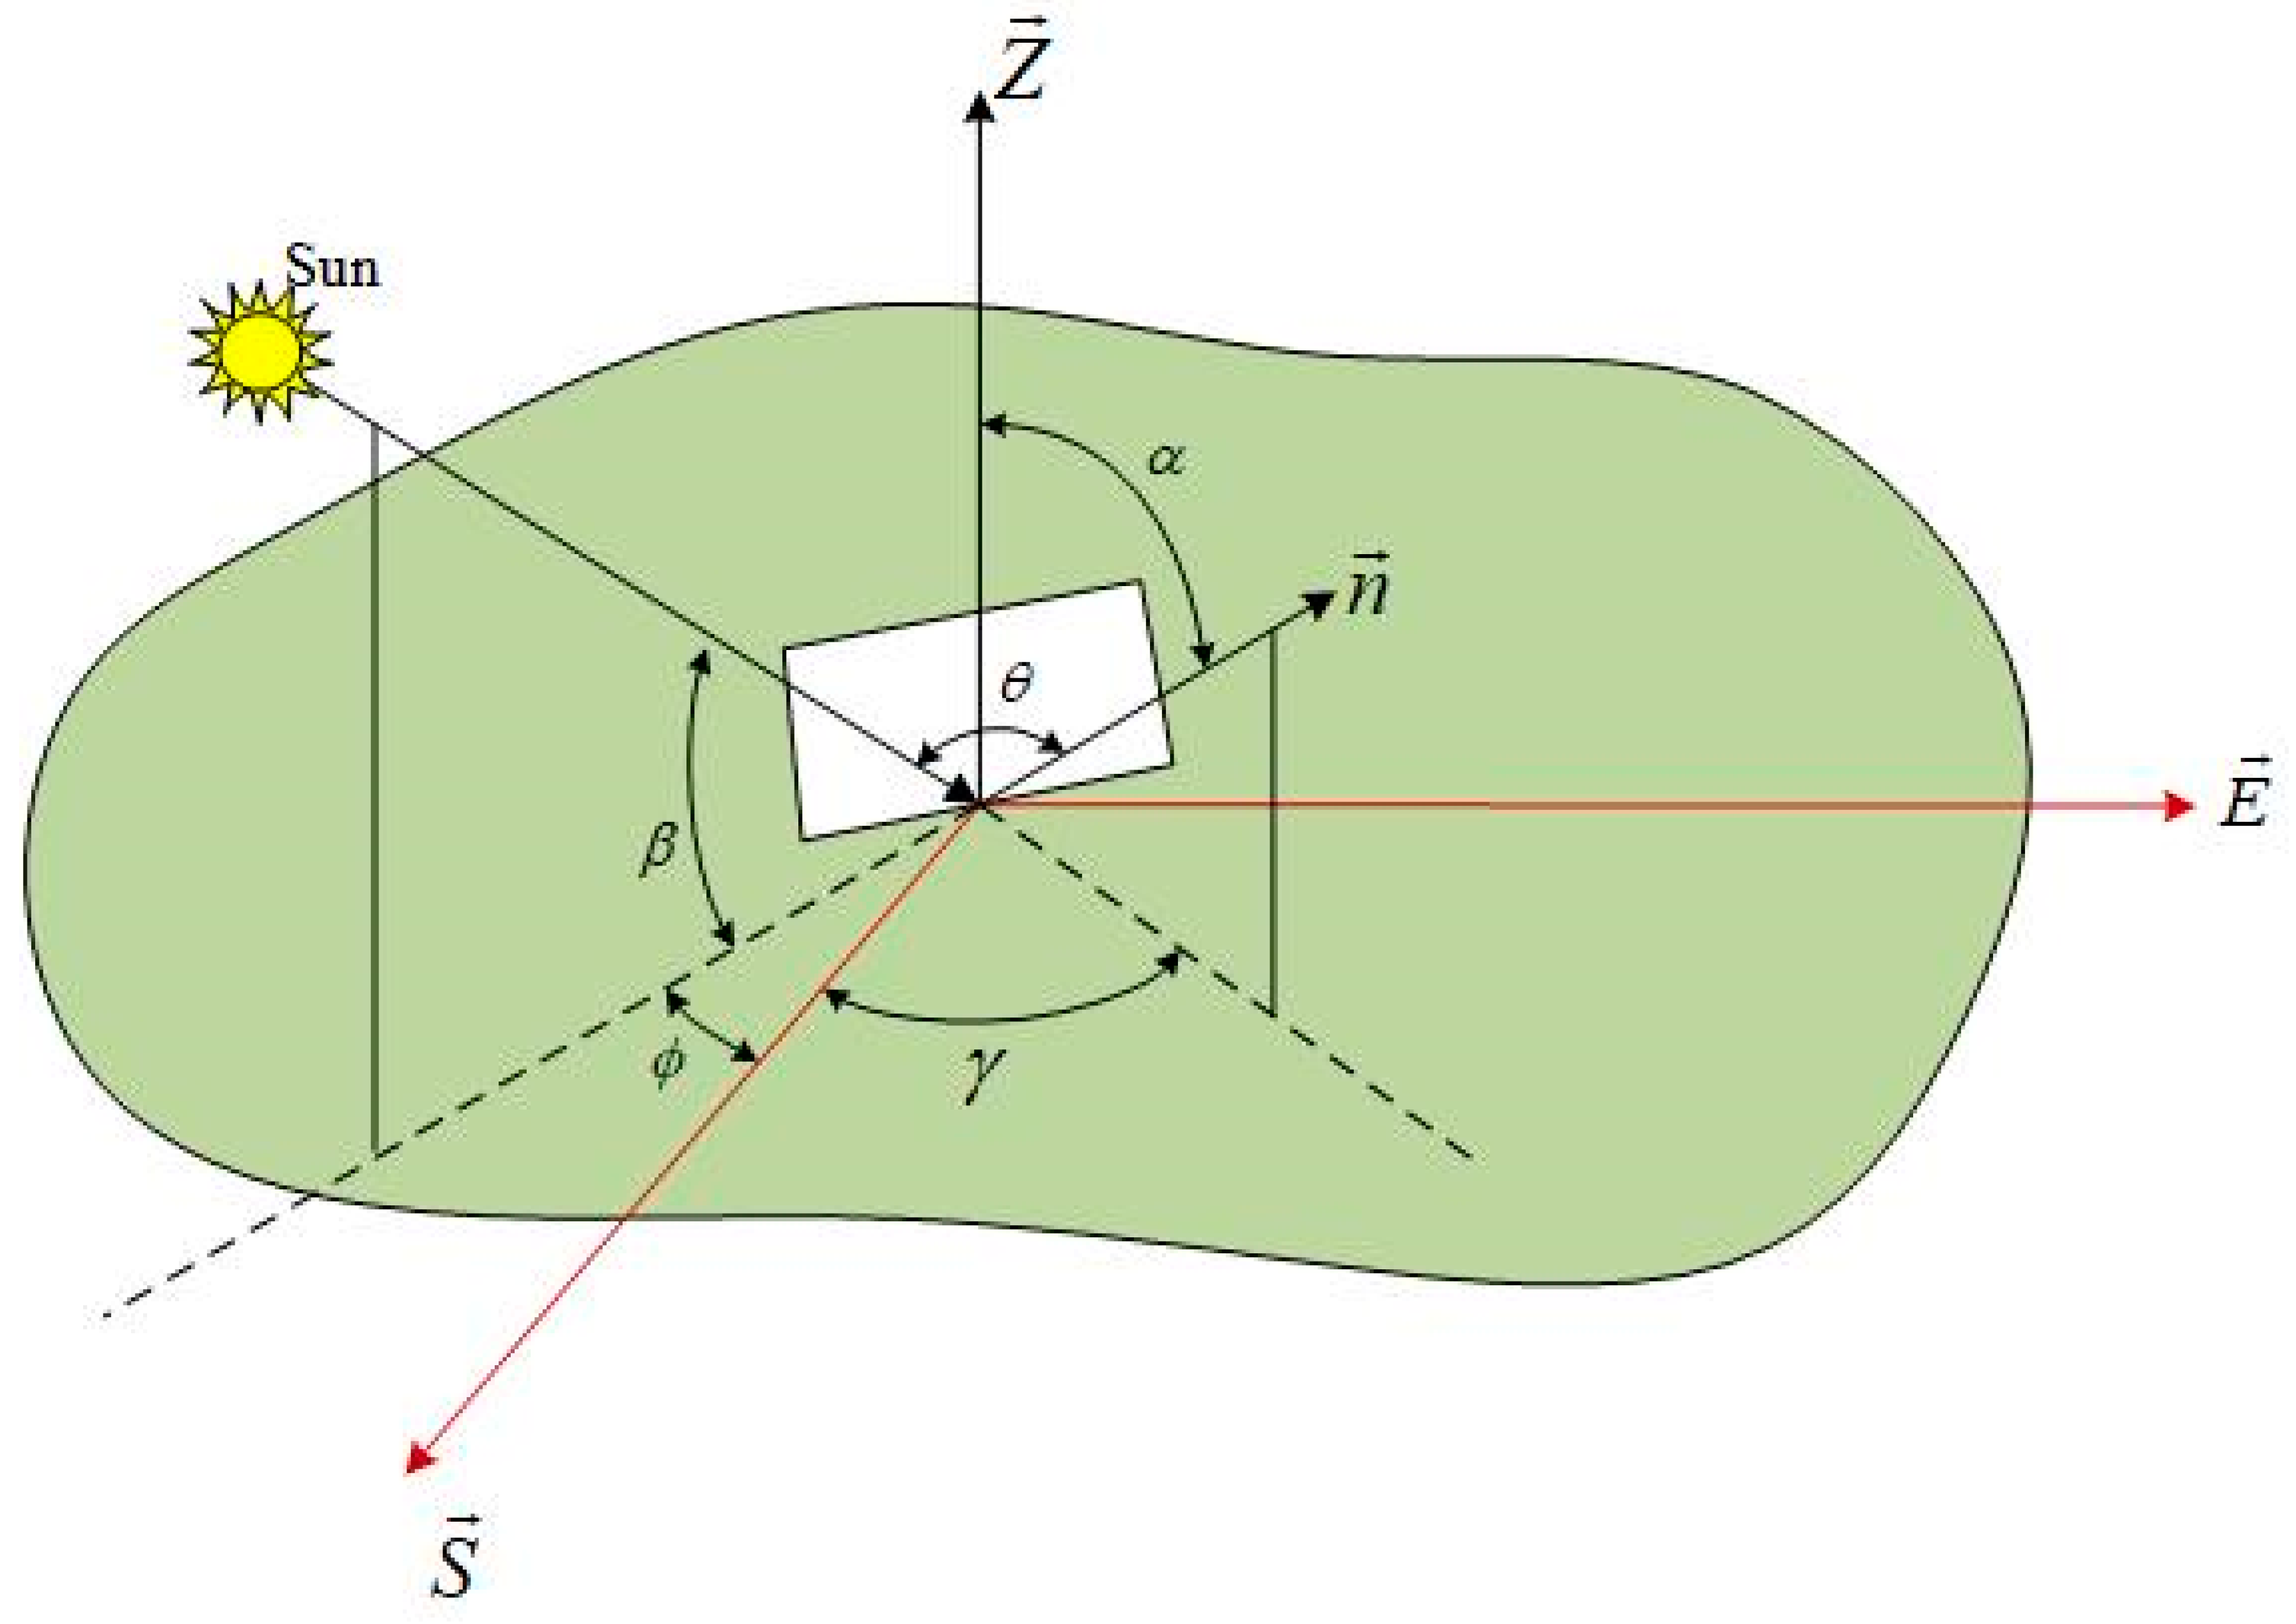
2.2. Solar Angles Formulation and NREL Database

The solar radiation incident angle on an arbitrarily oriented solar panel depends on the time of the day, the latitude of the location, and the orientation of the solar panel as illustrated in Figure 2. The panel orientation is described by the tilt angle, α and the azimuth angle, γ (see Figure 2). The solar altitude angle β can be calculated via
sin β = cos l cos h cos δ + sin l sin δ
where l is the local latitude, h = (Solar time-12) × 15° is the hour angle, solar declination angle, δ = 23.45 ° sin [ 2 π ( N + 284 ) / 365 ] , and N is the day number. The solar time can be calculated in terms of local standard time, local longitude L l o c and standard longitude for the time zone L s t via
Solar   time   =   Standard   time + [ 4 ( L st L loc ) + EOT ] / 60
The equation of time is given by:
EOT = 9.87 sin ( 2 B ) 7.53 cos ( B ) 1.5 sin ( B )   and B = 2 π ( N 81 ) / 365
Both of the azimuth angles, solar φ and panel γ , are measured against the south direction, so it is positive for the western side, negative for the eastern side and zero for south-facing panels. The solar azimuth angle is calculated via
φ = ( 1 ) s cos 1 ( sin β sin l sin δ cos β cos l )
Note that exponent s = 1 for solar mornings ( h < 0 ), s = 2 for solar afternoons ( h > 0 ) and φ = 0 at solar noon h = 0 .
The angle between the solar beam incident on the panel and the normal to the panel (angle θ in Figure 2) is calculated via the following equation:
cos   θ = cos   β cos ( φ γ ) sin   α + sin   β cos   α
The National Renewable Energy Laboratory (NREL) database [17] includes solar data for Diffuse Horizontal Incident (DHI) Direct Normal Incident (DNI) and Global Horizontal Incident (GHI) for both actual and clear sky conditions. The value of DNI is typically measured by a pyrheliometer that tracks the sun and the GHI is measured by a fixed pyranometer. The value of DHI can then be can be calculated via
DHI = GHI DNI sin β
In addition to hourly solar data, the NREL database lists hourly ambient temperature, wind speed and ground albedo, which have some effect on the performance of the solar photovoltaic panels.

2.3. Solar Power Generated by a Solar Panel

The total insolation arriving at the surface of the solar panel consists of three components, beam, diffuse and ground reflected irradiation, which can be expressed as:
I T =   DNI cos θ + DHI ( 1 + cos α 2 ) + GHI   ρ g ( 1 cos α 2 )
where ρ g is the ground albedo, α is the solar panel tilt angle. Note that when θ 90 ° then there is no direct solar beam on the panel and the first term in Equation (6) is zero.
A fraction of the solar ray that arrives at the PV panel, at the incident angle θ , is transmitted through the panel coating and absorbed by the PV. This fraction is expressed by the transmitted-absorbed product given by [15].
K τ α ( θ ) = [ 1 1 2 ( sin 2 ( θ r θ ) sin 2 ( θ r + θ ) + tan 2 ( θ r θ ) tan 2 ( θ r + θ ) ) ]
where θ r is the reflective angle and is evaluated via Snell’s relation, sin θ r = sin θ / n , and n is the refractive index.
To evaluate the solar incident transmitted and absorbed by a PV panel, all three irradiation terms of Equation (7) are multiplied by the corresponding values of K τ α , as shown in the following equation.
I T , P V =   DNI cos θ   K τ α ( θ b ) + DHI ( 1 + cos α 2 )   K τ α ( θ e , d ) + GHI   ρ g ( 1 cos α 2 )   K τ α ( θ e , g )
where, θ e , d and θ e , g denote effective diffuse incident angle and effective ground-reflected incident angle, respectively. For the diffuse and ground reflected solar irradiation, the rays arrive at the panel in all directions. Hence, there is no single angle for these two terms. Correlations for effective incident angles of diffuse and ground-reflected insolation on sloped surfaces are developed by Brandemuehl and Beckman [19] in terms of panel tilt angle, α . These correlations are given in the following equations:
θ e , g = 90 0.5788 α + 0.002693 α 2 for   ground   reflected   insolation ,   and   θ e , d = 59.7 0.1388 α + 0.001497 α 2 for   diffuse   insolation .
Considering the conditions discussed in Equation (6) for any incident angle larger than 90, Equation (8) is reduced to Equation (10). It is due to the fact that θ b > 90 ° the beam insolation is behind the panel.
I T , P V =   DHI ( 1 + cos α 2 )   K τ α ( θ e , d ) + GHI ρ g ( 1 cos α 2 )   K τ α ( θ e , r )   when   θ b > 90 °
The value of effective diffuse incident angle, θ e , d , varies between 55 and 60 degrees where based on the Equation (7), the transmitted-absorbed product. K τ α range from 0.9 to 0.93. However, the effective ground reflected incident angle is greater than 60 degrees for all the tilt angles, making the value of K τ α about 0.95.

2.4. The Efficiency of a Solar Panel

The efficiency of PV systems is influenced by the ambient temperature and wind speed. A comprehensive review of available correlation for effects of ambient temperature and wind speed is in [20,21]. In the present work, the following correlation is used:
η = η r e f { 1 β r e f [ T a T r e f + ( 9.5 5.7 + 3.8 V w ) ( T N O C T T a ) I t I t , N O C T ] }
where, η is the output efficiency of the PV panel array, η r e f is the reference efficiency, which is the efficiency of panel supplied by the manufacturer, β r e f is the temperature coefficient of the PV panel (0.0045 K−1), T a is the ambient temperature, T r e f is the reference temperature of the PV panels (25 °C), and V w is the wind speed in m/s. Note that the hourly local ambient temperature and wind speed are obtained from the data obtained from the NREL database [17]. The nominal operating cell temperature (NOCT) conditions are: T N O C T = 20 °C and I t , N O C T = 800 W/m2.

2.5. The DC Power of a Solar Panel
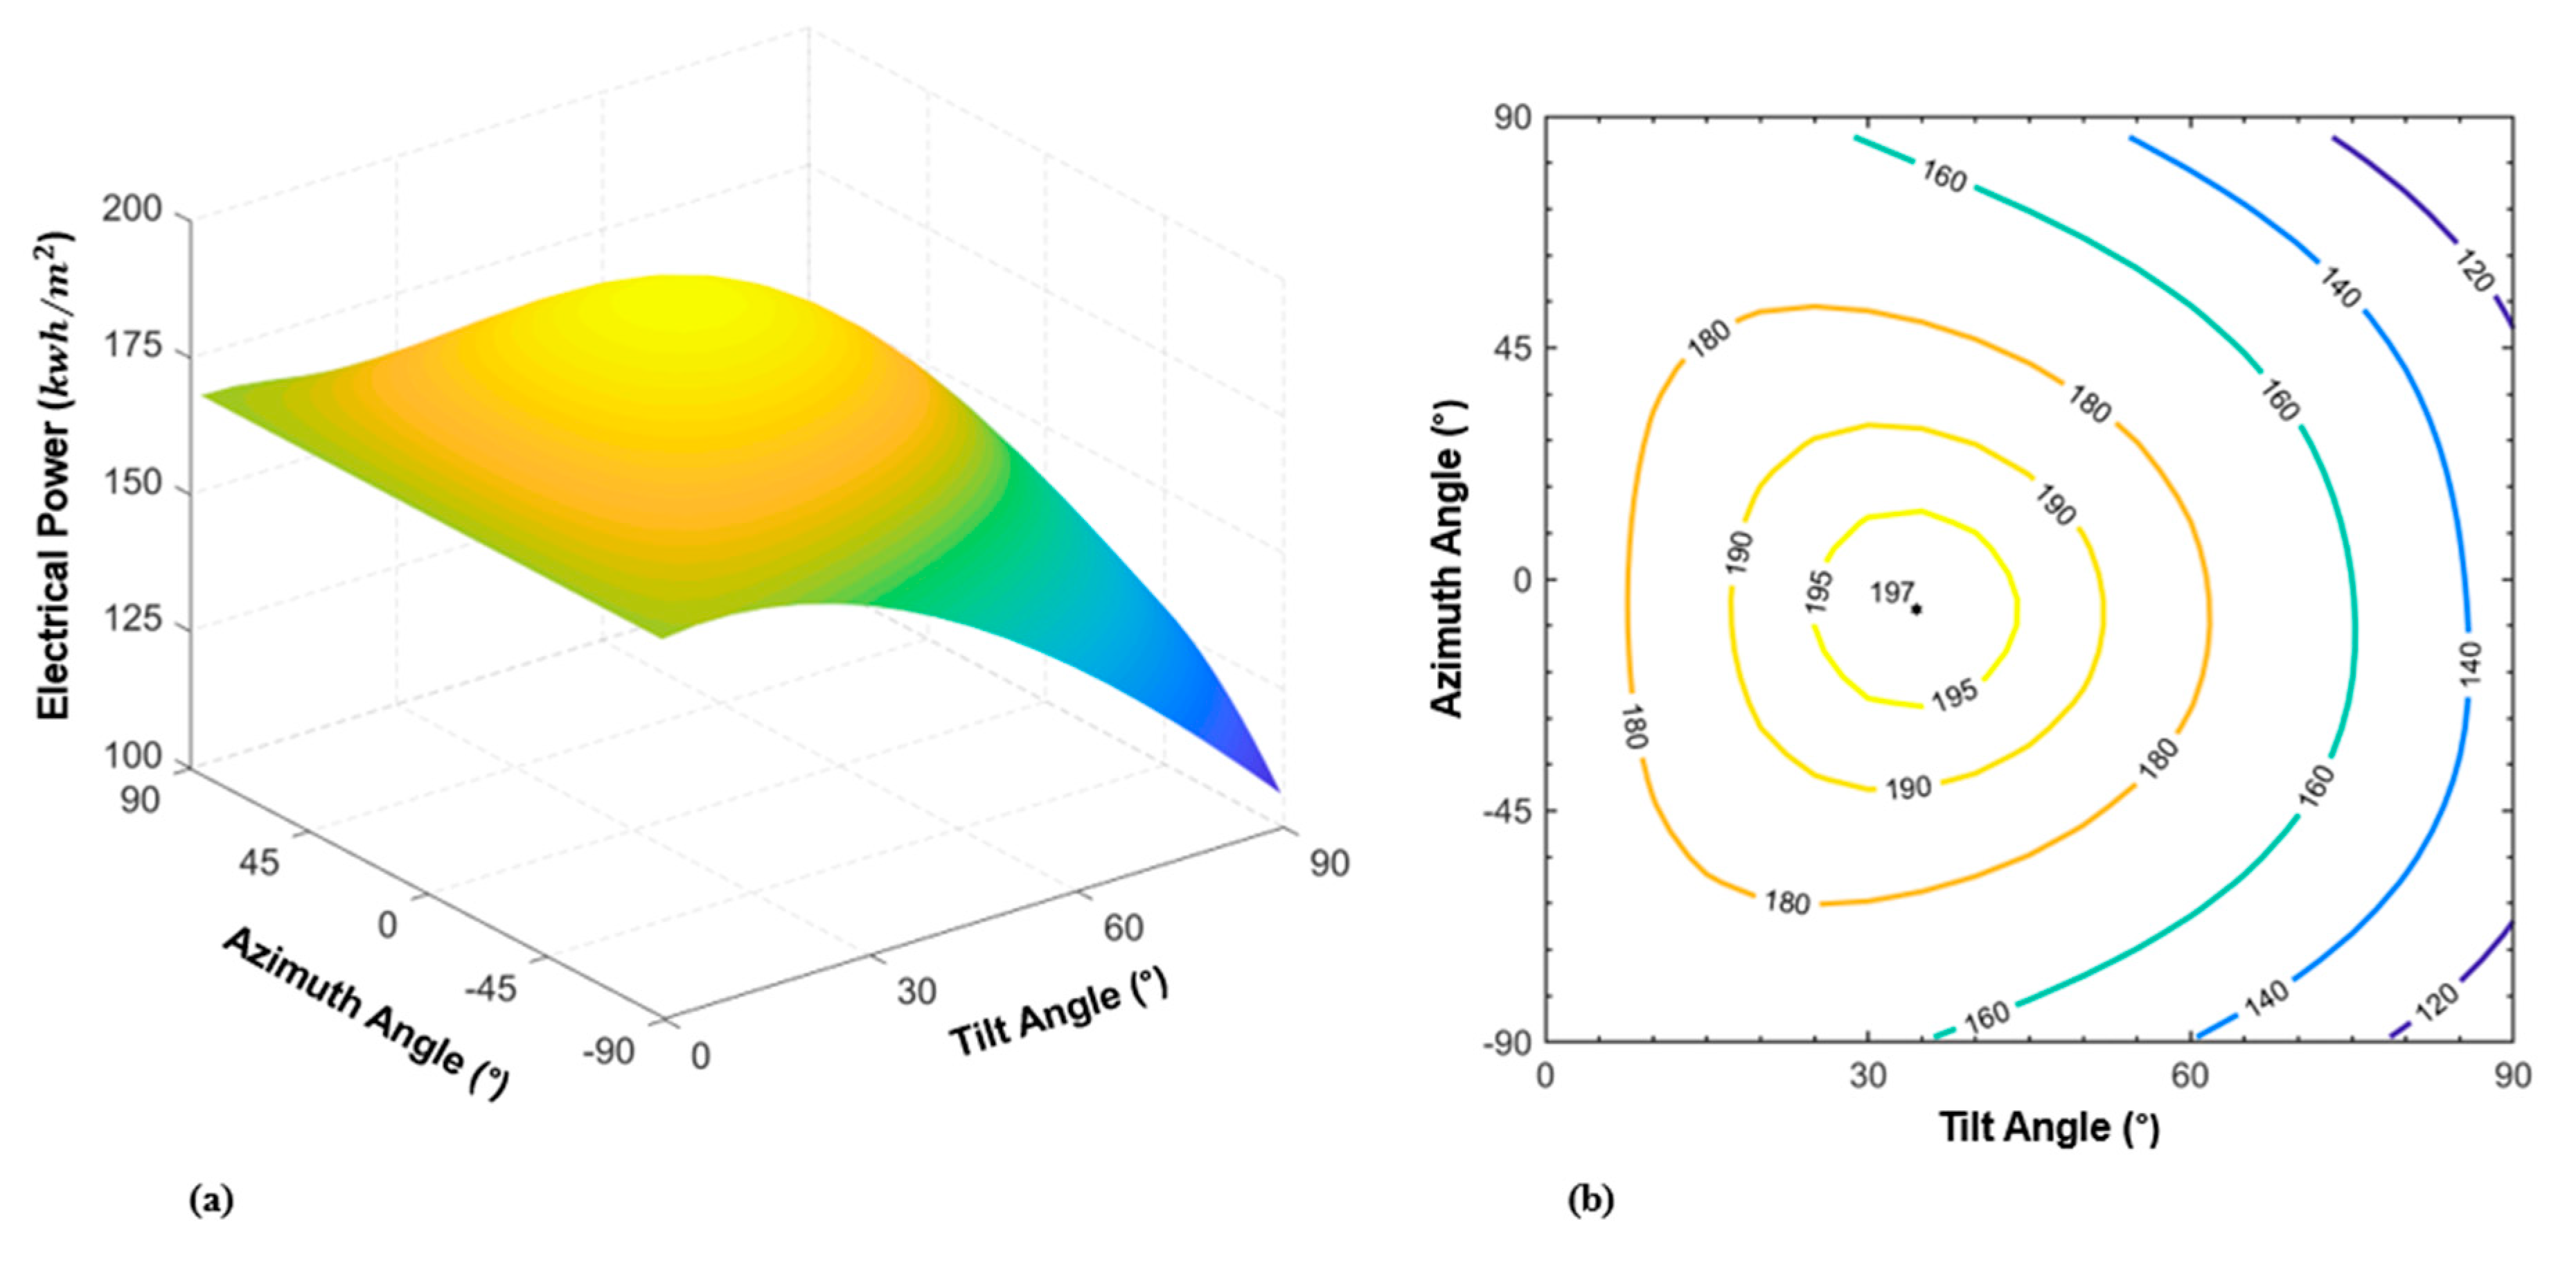
The DC power supplied from the PV cells is obtained from Equation (12). There are other losses in electrical convertors that are not included in this work since the focus of the present work is on the orientation of solar panels to maximize DC power delivered by the PV panels.
W ˙ n , t = η I t , P V
To determine the total annual DC power out of the PV panel, Equation (12) is integrated over the entire year, i.e.,
P = n = 1 365 t = 1 28 W ˙ n , t Δ t
where Δ t is set to 0.5 h since the data provided by NREL is based on every half an hour increment [14]. The annual DC power output of PV does not include losses in the DC to AC invertor. The average hourly power for the whole year or a season is calculated via Equation (14).
P t = n = N 1 N 2 W ˙ n , t N 2 N 1 + 1
where N1 is the first day and N2 is the last day of the averaging period. For the whole year N1 = 1 and N2 = 365, and for the summer (June, July and August) N1 = 151 and N2 = 245. In the present work, the hourly average for the whole year and summer are calculated. The model, however, can be used to calculate hourly power for any period of the year. This feature is used to assess the time of the day that solar energy peaks. Additionally, it is a guide for producing more power for the time of the day when energy demand peaks.

2.6. Optimization

Here, we introduce a data-driven optimization platform for finding the optimum tilt angle, α , and azimuth angle, γ , of a PV solar panel located at any arbitrary location, which guarantees the maximum DC power generation. The objective function for this optimization is defined via Equation (15).
Max α , γ f ( α , γ , Γ ) = t η ( α , γ , Γ ) × I t , P V ( α , γ , Γ )
where, Γ represents the vector of constant and location properties-that does not change with time and season-defined as Γ = [ L s t ,   L l o c ,   l , T N O C T ,   I N O C T ,   n , T r e f ] , and I t , P V represents the solar energy from Equations (8) and (10). We modified the Genetic Algorithm (GA) for maximizing f ( α , γ , Γ ) to precisely determine the optimum angles of α and γ . GA is a biologically inspired meta-heuristic optimization approach that starts with randomly generating an initial population of potential solutions. Then, the objective function is evaluated at the initial population to estimate the goodness of each solution. A combination of some of the fittest and least fit individuals from the initial solution is selected to serve as parents for creating the next-generation solutions. To migrate to the next-generation population, parent solutions are evolved through the use of mutation and crossover. In addition, some of the parent solutions are copied into the next generation to further diversify the population. This entire process is repeated unless the change in the average objective function—through a certain number of generations—falls below a predefined threshold value, or the number of the generations exceeds a maximum number. The benefit of the GA is the fact that it probabilistically models a population of points at each generation and evolves towards the optimum objective function [22,23,24]. Figure 3 presents a pseudo code for the metaheuristic optimization process used in our data-driven platform. For each GA run, we implemented function tolerance of 10 6 , the maximum number of generations of 500, the population size of 50, and the crossover probability of 80%. To ensure consistency in our results, we repeated the GA runs at least 10 times.

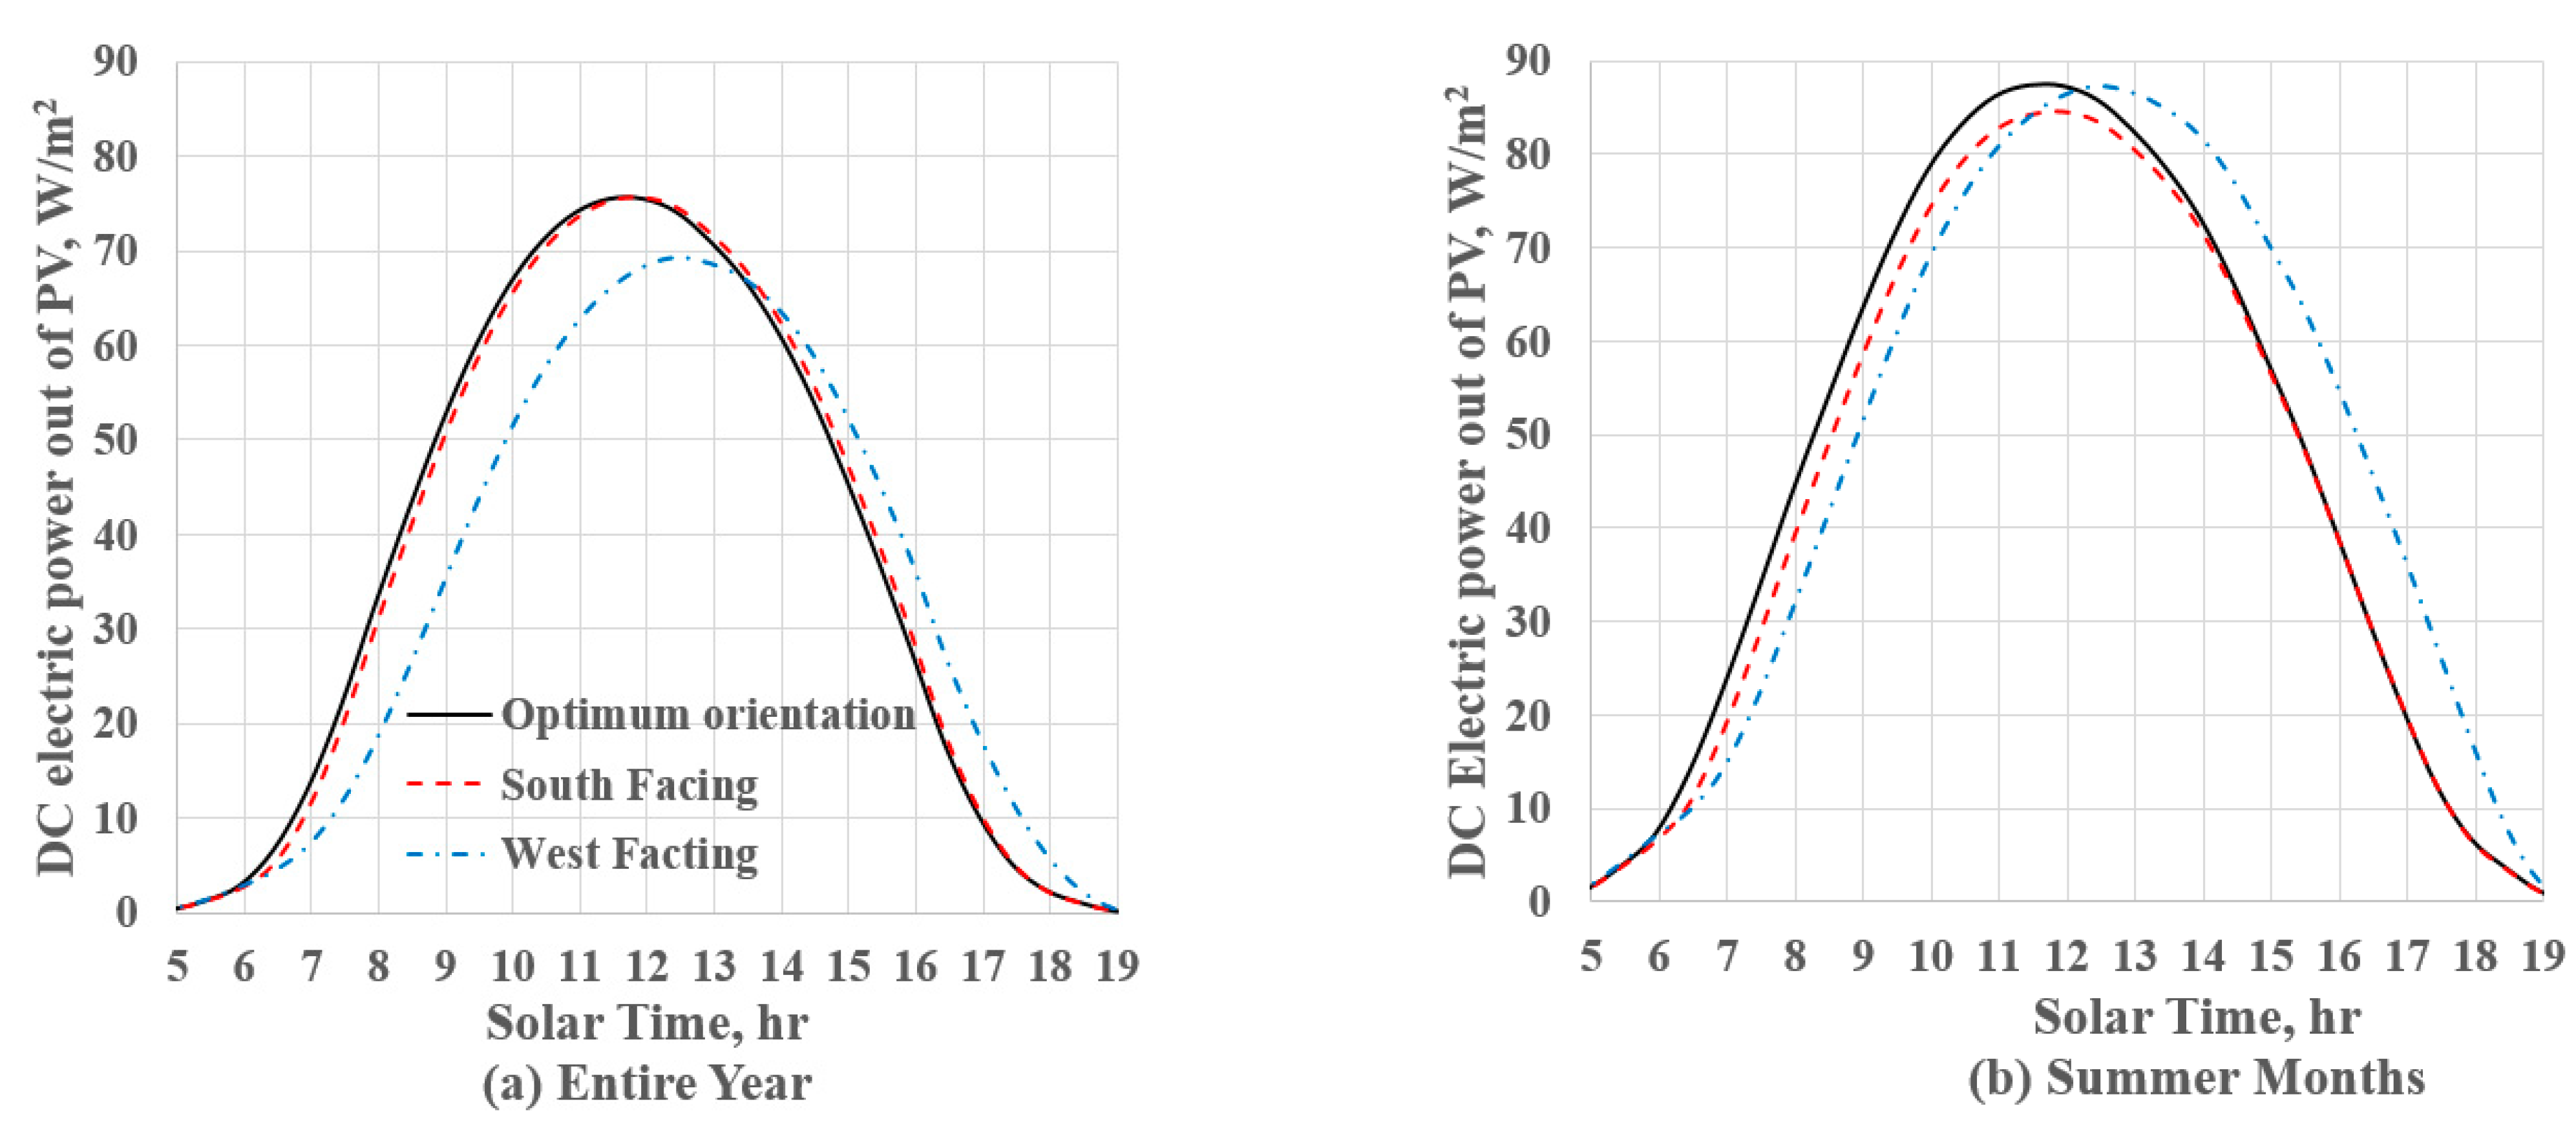
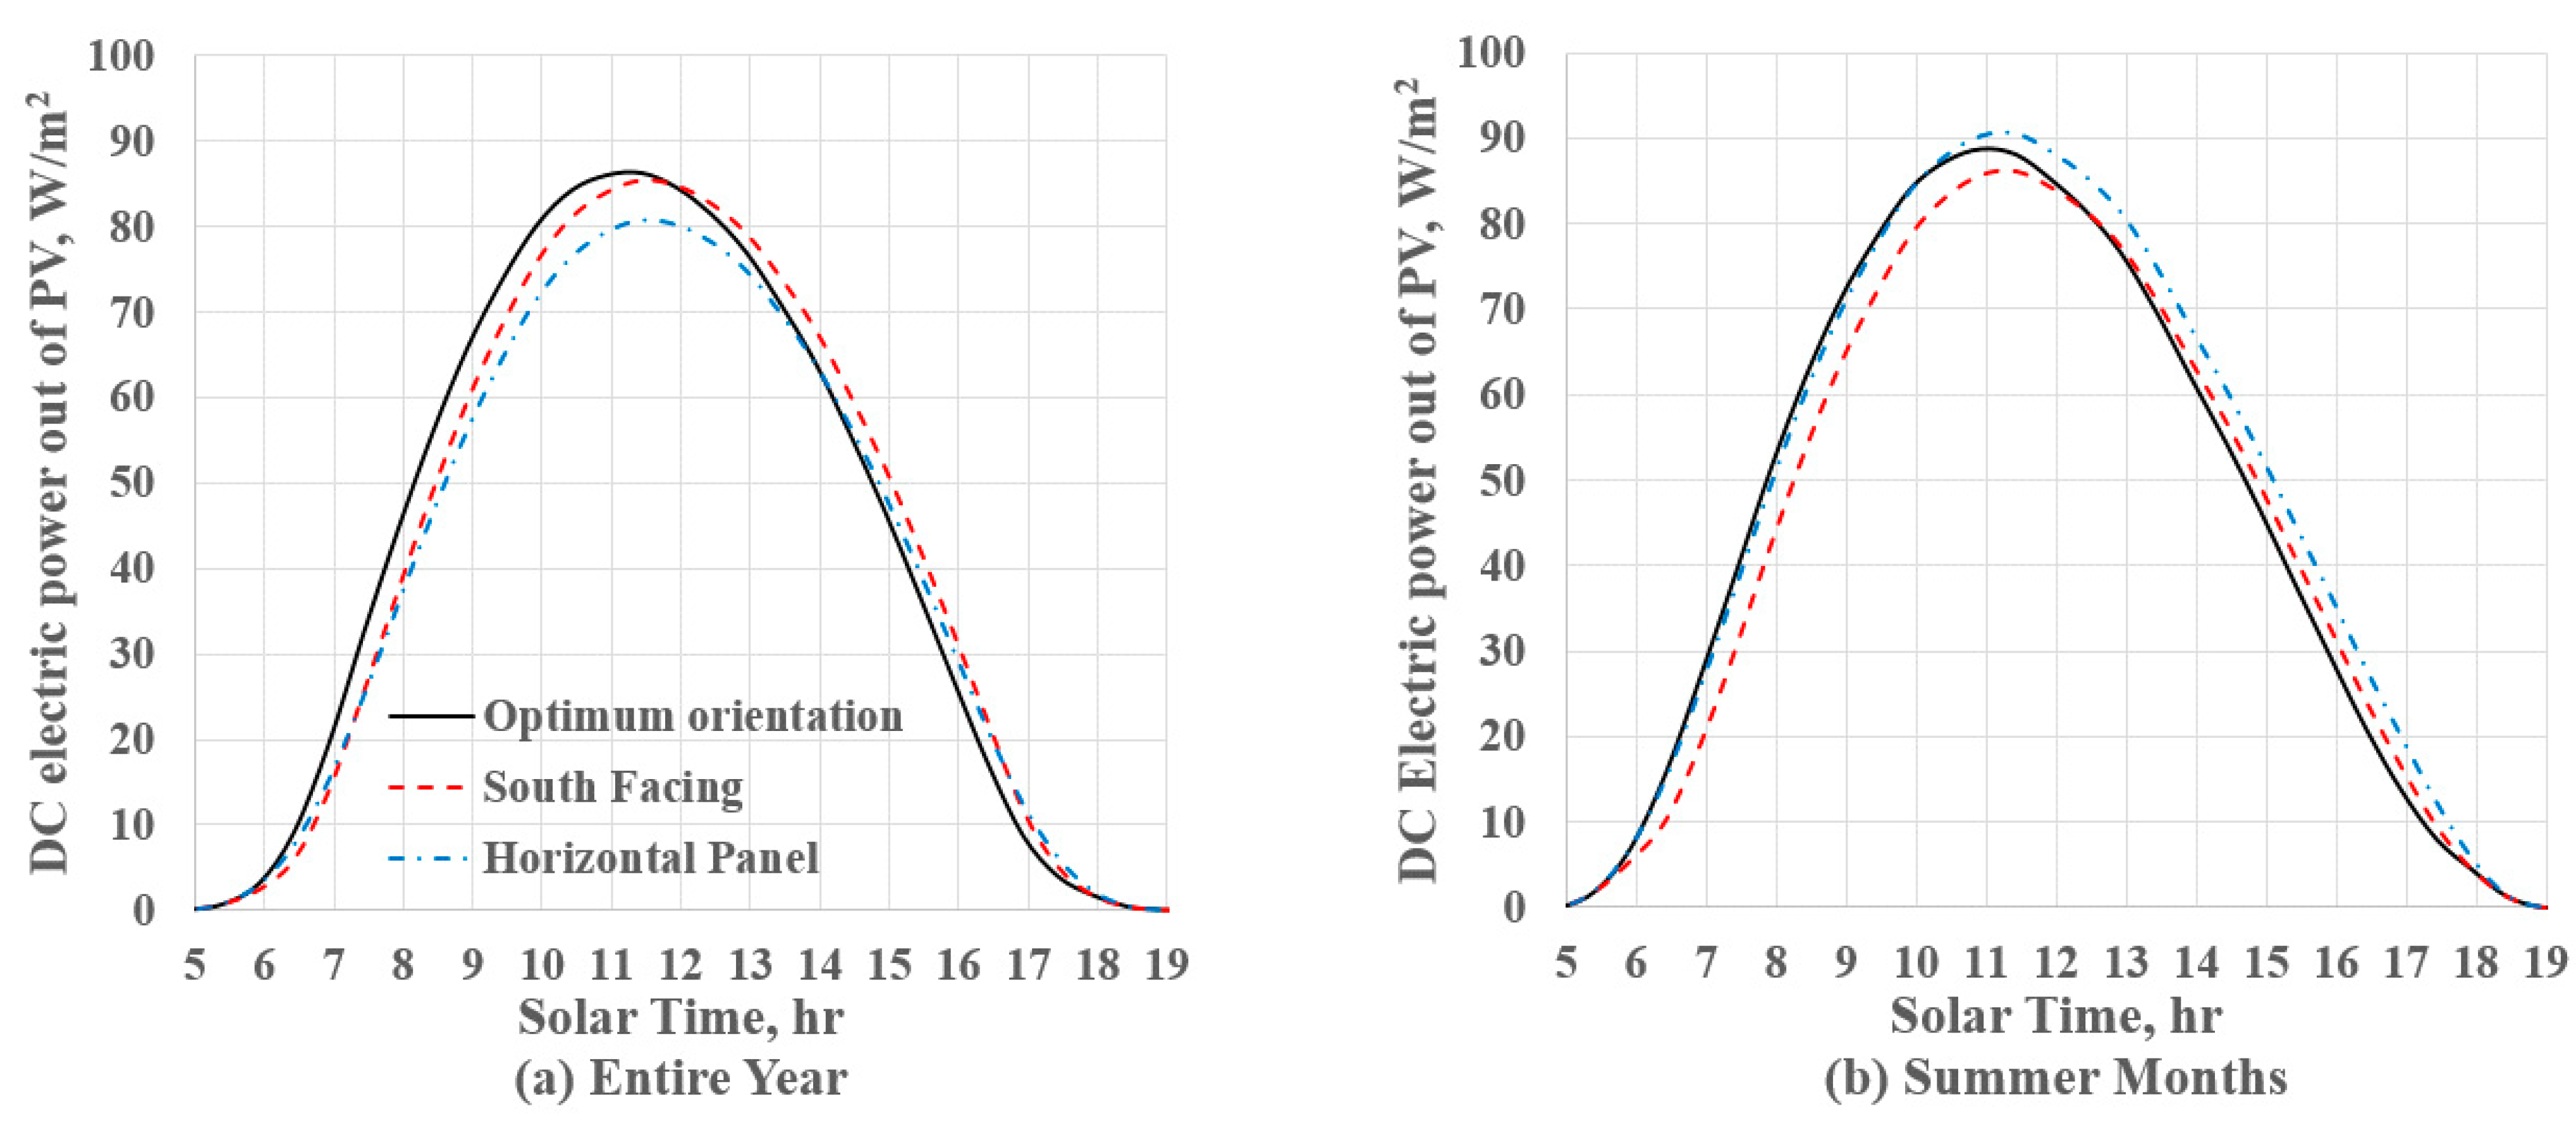
3. Results and Discussion

In this work, considerations are given to three different locations in the United States with different climatic characteristics, Riverdale (New York), Orlando (Florida), and Los Angeles (California). Orientation of solar panels can be based on the power needs of the system. In some cases, they can be used to shave the maximum power demand, and in some other cases maximize the annual power production. In the present work, we set the objective maximum annual production; however, the alternative orientations based on other objectives are also discussed. Based on the general rule of thumb, the maximum annual solar energy production can be achieved by south-facing panels with a tilt angle equal to the latitude of the location. This is a good rule as long as climatic data are symmetric concerning the solar noon. However, for some locations, diurnal variation of climatic conditions results in lower insolation in the morning or afternoon hours.
As a first case consideration given to a location in Riverdale, New York City, the USA with the latitude of 40.89 N and longitude of 73.9 W. The optimum panel orientation based on the present approach and the historical solar and climatic data is a tilt angle of 33.68° and azimuth angle of −5.62° (slightly eastward). This results in 1690 kWh/m2 overall solar irradiation on the panel and 197 kWh/m2 annual DC electric power output from the panel. Using the rule of thumb, a south-facing panel with a tilt angle of 40.89° results in 1676 kWh/m2 solar irradiation and 194.4 kWh/m2 electrical power, which is about 1% lower than the optimized panel orientation for the maximum power.
Figure 4 shows surface and contour plots of the annual power generated by one-meter square of a panel versus its orientation, azimuth and tilt angles. Figure 4a is used to calculate the optimum orientation of a PV panel which results in the maximum yearly power generation. Figure 4b is used to assess the power generated by a panel if the panel orientation is diverted from the optimum orientation. In some municipalities, such as New York City, the electric power demand due to heavy use of air-conditioning units is high during summer afternoons. Hence, a westward-facing panel can result in more power generation during afternoon hours. This may, however, reduce the total annual power generated by the panel.
Table 1 presents a comparison of the results between the present approach and three widely used models of clear sky [25], monthly clearness index [18], and the rule of thumb. From Table 1, the tilt angle by the present model (CDDOP) and the clearness index model are similar. However, the predicted solar irradiation on the panel based on the clearness index model is 8.6% lower than the present model. This is due to the fact that the clearness index model uses monthly data that do not capture hourly variation insolation. The tilt angles based on the clear sky and the rule of thumb are identical, while the clear sky returns significantly higher annual solar irradiation.
The contour plot of Figure 4b is used to keep the annual power relatively high and respond to the peak demand of summer afternoons. For instance, if we decide to settle with 180 kWh/m2 instead of 197 kWh/m2 (less than 10% reduction) the contour line shows that 180 kWh/m2 is achieved with the maximum westward azimuth angle of 50° and the tilt angle of 20°.
An assessment of average daily variation power for the entire year and summer months (June, July and August) for three solar orientations is shown in Figure 5. There is a small difference between the hourly optimum orientation and the south-facing orientation that has a tilt angle of the same as the altitude of the location. The westward-facing orientation with an azimuth angle of 50° and tilt angle of 20° results in a higher power during afternoon hours (see Figure 5a). One can use Figure 5b along with the contours presented in Figure 4b to ensure the maximum production of the power during the peak demand period. For example, in New York City at 4 pm during the summer months, power demand peaks [15]. According to Figure 5b, the optimum orientation and south-facing orientation produce ~38 W/m2 while the west-facing panel produces 54 W/m2, which means a 42% increase in power generation during the high demand period.
Next, Orlando, Florida, a location with an altitude of 28.38 N and longitude of 81.38 W, is considered. The CDDOP returns an optimum orientation with a tilt angle of 26.2° and azimuth angle of −17.6° (eastward oriented), which yields the total insolation of 1970 kWh/m2 and DC power of 225 kWh/m2. Figure 6 shows the surface and contour plots representing the power generated by one meter square of the PV panel as a function of the panel orientation. The contour plot shows the power output when the panel deviates from the optimum orientation.
Using the rule of thumb by setting the panel south facing with a tilt angle of 28.38 degrees, the total annual insolation becomes 1957 kWh/m2, and the output power of the PV panel reaches 221 kWh/m2, which slightly deviates from that of the optimum orientation based on the present model. The contour plot of Figure 6 is used to assess alternative orientations. One may consider an almost horizontal orientation of a panel (tilt angle of five degrees) for a flat roof of a building which yields annual an output of 210 kWh/m2 based on Figure 6b contour plots. The average hourly DC power generated by one-meter squared of a panel is presented in Figure 7 pointing to the fact that the power output is larger during the morning hours. This is more pronounced during the summer due to more cloudiness and wet afternoons over the summer months. Additionally, Figure 7 shows why facing the panel slightly eastward increases the annual power by a small amount, less than 1%. For the horizontal panel, the overall hourly panel output is lower for the entire year. However, the hourly panel output is higher than the two other cases during the summer.
A comparison is done between the present approach and the three other models including clear sky, monthly clearness index, and rule of thumb for Orlando, Florida, in Table 2. The tilt angle and the annual solar energy predicted by the present model is approximately an average of the monthly clearness index and the rule of thumb. Like the Riverdale case, the tilt angles based on the clear sky model and the rule of thumb are similar. Since the clear sky model is based on perfect sunny days, it significantly overestimates the annual solar irradiation.
Finally, for the Los Angeles, CA, USA area, a location with latitude and longitude of 34.01 N and 118.38 W is considered. The optimum angle for the maximum energy generation in this location is a tilt angle of 29.86° and an azimuth angle of 2.78° (slightly westward). The annual maximum insolation on the panel is 2236 kWh/m2 and the DC power output from the panel is 257 kWh/m2. When the rule of thumb is used to orient the panel southward with the tilt angle of 34° (the same as the latitude of the location), the annual power is decreased by a small amount to 255 kWh/m2. Figure 8 shows the surface and contour plots of the electric power produced by one meter square of a PV panel as functions of solar panel orientation, tilt angle and azimuth angle. As shown in this figure, there is a wide range of panel orientations that produces annual power of above 250 kWh/m2.
Similar to the previous two cases, a comparison of the results between the present approach and three other models of clear sky, monthly clearness index, and rule of thumb for Los Angles, California, is given in Table 3. As shown in this table, the tilt angle and the annual solar energy predicted by the present model is almost identical to that of the monthly clearness index model.
In the southern area of California, electric power consumption spikes during the summer afternoons [16]. To respond to the peak demand, one can position the PV panel to be southwest-facing, which yields reasonably high power generation during afternoon hours. According to Figure 8b, the southwest-facing orientation (e.g., azimuth angle of 50° and tilt angle of 25°) returns the annual output power of 242 kWh/m2, about 6% less than the maximum value of 257 kWh/m2. Figure 9 shows average hourly variations of DC power for the whole year and summer months generated by a PV panel with the optimal orientation and south-facing orientation. As shown in Figure 9a, the difference between power generated by an optimally oriented and south-facing PV panel is almost indistinguishable. The southwest-facing panel generates~6% less power. However, during the summer, the southwest-facing panel produces 67% higher power at 4:00 PM compared to the optimum or south-facing orientations (see Figure 9b), helping the shave the peak power demand.

4. Conclusions

An optimization model, CDDOP, is introduced that maximizes the solar panel performance and searches for the optimum panel orientation based on the hourly climatic data. The model primarily uses hourly solar Direct Normal Incident (DNI), Direct Horizontal Incident (DHI) and Global Horizontal Incident (GHI) provided by the NREL database. CDDOP is a versatile and user-friendly data-driven approach with a low cost of computation. Despite the Clear Sky model and Clearness Index model which mathematically estimates the solar incident and requires monthly averaged information from the location, CDDOP acquires the hourly solar data directly from the NREL large database, which is updated every year by adding the most recent climatic data. This enables CDDOP to capture diurnal climate change precisely and significantly lowers the number of mathematical calculations. The CDDOP versatility and accuracy are examined by investigating optimum solar panel orientations at three locations in the United States. The results generated in this work are used to assess alternative directions that provide reasonable annual power and are good choices for shaving the peak demands. Although the present work focuses on three locations in the United States, CDDOP can be used for the assessment of solar panel orientation and power output at any location globally.
The novelty of the present approach over the existing hourly clearness index model is as follows:
  • There is no need for an hourly clearness index, which is not available in the climatic database.
  • There is no need to evaluate extraterrestrial solar irradiance. This fact converts CDDOP into a user-friendly and easy-to-use platform.
  • The model is based on the climatic data available globally (for more than twenty years in the USA) from the National Renewable Lab database. This makes CDDOP a versatile and reliable platform.
  • CDDOP uses a data-driven metaheuristic optimization approach, which significantly lowers the cost of computation and improves the accuracy of the platform.

Author Contributions

All authors contributed equally (conceptualization, methodology, validation, formal analysis, investigation, resources, data curation, writing—original draft preparation, writing—review and editing, visualization, supervision, project administration, funding acquisition, M.H.N. and E.A.). All authors have read and agreed to the published version of the manuscript.

Funding

This research received no external funding.

Data Availability Statement

Data and computer programs will be provided upon request.

Acknowledgments

The authors would like to thank the Mechanical Engineering Department at Manhattan College for its support in publishing this manuscript.

Conflicts of Interest

Authors declare no conflict of interest.

Nomenclature

DHIDirect Horizontal Insolation (W/m2)
DNIDirect Normal Insolation (W/m2)
GHIGlobal Horizontal Insolation (W/m2)
h Solar hour angle
I t Total insolation on a flat surface (W/m2)
K τ α ( θ ) Fraction of solar energy transmitted and absorbed by PV for incident direction θ
l Latitude of location
n PV coating refractive index
N Day number = 1 for 1st January and 365 for 31st December
t Time
TaAmbient temperature
Greek Symbols:
α Solar panel tilt angle
β Solar altitude angle
γ Surface azimuth angle
δ Solar declination angle
φ Solar azimuth angle
ρ g Ground albedo (reflectivity)
θ The angle between solar beam and normal to the surface
θ r PV coating refraction angle
τ α Transmittance absorbance product of the PV coating

References

  1. Chang, Y.-P. Optimal Design of Discrete-Value Tilt Angle of PV Using Sequential Neural-Network Approximation and Orthogonal Array. Expert Syst. Appl. 2009, 36, 6010–6018. [Google Scholar] [CrossRef]
  2. Chen, Y.-M.; Lee, C.-H.; Wu, H.-C. Calculation of the Optimum Installation Angle for Fixed Solar-Cell Panels Based on the Genetic Algorithm and Simulated-Annealing Method. IEEE Trans. Energy Convers. 2005, 20, 467–473. Available online: https://ieeexplore.ieee.org/document/1432862 (accessed on 10 January 2022). [CrossRef]
  3. Hussein, H.M.S.; Ahmad, G.E.; El-Ghetany, H.H. Performance evaluation of photovoltaic modules at different tilt angles and orientations. Energy Convers. Manag. 2004, 45, 2441–2452. [Google Scholar] [CrossRef]
  4. Tang, R.; Wu, T. Optimal tilt-angles for solar collectors used in China. Appl. Energy 2004, 79, 239–248. [Google Scholar] [CrossRef]
  5. Gunrhan, H.; Hepbasli, A. Determination of the optimum tilt angle of solar collectors for building applications. Build. Environ. 2007, 42, 779–783. [Google Scholar] [CrossRef]
  6. Yang, H.; Lu, L. The optimum tilt angle and orientation of PV claddings for building-integrated photovoltaic (BIPV) application. J. Sol. Energy Eng. Trans. ASME 2007, 129, 253–255. [Google Scholar] [CrossRef] [Green Version]
  7. Naraghi, M.H. Optimum Solar Panel Tilt Angle for Maximum Annual Irradiation. In Proceedings of the IMECE2009, Lake Buena Vista, FL, USA, 13–19 November 2009; pp. 211–220. [Google Scholar] [CrossRef]
  8. Naraghi, M.H.; Etienne, G. Solar Panel Orientation and Modeling Based on Hourly Clearness Index. In Proceedings of the 2012 Energy Sustainability Conference & Fuel Cell Conference, San Diego, CA, USA, 23–26 July 2012. [Google Scholar] [CrossRef]
  9. Hartner, M.; Ortner, A.; Hiesl, A.; Hass, R. East to West—The Optimum Angle and orientation of Photovoltaic Panels from and Electricity System Perspective. Appl. Energy 2015, 160, 94–107. [Google Scholar] [CrossRef]
  10. Rhodes, J.D.; Upshaw, C.R.; Cole, W.J.; Holcomb, C.L.; Webber, M.E. A Multi-Objective Assessment of the Effect of Solar PV Array Orientation and Tilt on Energy Production and System Economics. Sol. Energy 2014, 108, 28–40. [Google Scholar] [CrossRef] [Green Version]
  11. Hafez, A.Z.; Soliman, A.; El-Metwally, I.M.; Ismail, I.M. Tilt and Azimuth Angles in Solar Energy Applications—A Review. Renew. Sustain. Energy Rev. 2017, 77, 147–168. [Google Scholar] [CrossRef]
  12. Chinchilla, M.; Santos-Martin, D.; Carpintero, M.; Lemon, S. Worldwide Annual Optimum Tilt Angle Model for Solar Collectors and Photovoltaic Systems in the Absense of Site Meteorological Data. Appl. Energy 2021, 281, 116056. [Google Scholar] [CrossRef]
  13. Naraghi, M.H. A Demand Based Optimum Solar Panel Orientation. In Proceedings of the IMECE2010-37918, Vancouver, BC, Canada, 12–18 November 2010. [Google Scholar] [CrossRef]
  14. Cabuk, M.; Naraghi, M.H. Solar Panel Orientation Based on Building Power Consumption. In Proceedings of the IMECE 2014-37643, Montreal, QC, Canada, 14–20 November 2014. [Google Scholar] [CrossRef]
  15. Delenne, E.; Naraghi, M.H. A Study of the Financial Aspect of Using Photovoltaic Panels in Buildings. In Proceedings of the 15th International Energy Conversion Engineering Conference, Atlanta, GA, USA, 10–12 July 2017. [Google Scholar] [CrossRef]
  16. Shah, V.; Naraghi, M.H. Shaving Peak Demand using Photovoltaics—Economic Analysis. In Proceedings of the 2018 International Energy Engineering Conversion, Cincinnati, OH, USA, 9–11 July 2018. [Google Scholar] [CrossRef]
  17. National Renewable Energy Laboratory Solar Database. Available online: https://maps.nrel.gov/nsrdb-viewer/ (accessed on 10 January 2022).
  18. Duffie, J.A.; Beckman, W.A. Solar Engineering of Thermal Process; John Wiley & Sons: Hoboken, NJ, USA, 2006. [Google Scholar]
  19. Brandemurhl, M.J.; Beckman, W.A. Transmission of Diffuse Radiation through CPC and Flat Plate Collector Glazing. Sol. Energy 1980, 24, 511–513. [Google Scholar] [CrossRef]
  20. Dubey, S.; Sarvaiya, J.N.; Seshadri, B. Temperature Dependent Photovoltaic (PV) Efficiency and its Effect on PV Production in the World—Review. Energy Procedia 2013, 33, 311–321. [Google Scholar] [CrossRef] [Green Version]
  21. Ekoplaki, E.; Palyvos, J.A. On the Temperature Dependence of Photovoltaic Module Electrical Performance: A Review of Efficiency/Power Correlations. Sol. Energy 2009, 83, 614–624. [Google Scholar] [CrossRef]
  22. Elliott, L.; Ingham, D.B.; Kyne, A.G.; Mera, N.S.; Pourkashanian, M.; Wilson, C.W. Genetic algorithms for optimization of chemical kinetics reaction mechanisms. Prog. Energy Combust. Sci. 2004, 30, 297–328. [Google Scholar] [CrossRef]
  23. Michalewicz, Z. Genetic Algorithms and Data Structures = Evolution Programs, 3rd ed.; Chapter on “Genetic Algorithms: Why Do They Work?”; Springer: Heidelberg, Germany, 1996; pp. 44–57. [Google Scholar]
  24. Calicchia, M.A.; Atefi, E.; Leylegian, J.C. Creation of small kinetic models for CFD applications: A meta-heuristic approach. Eng. Comput. 2021, 1–15. [Google Scholar] [CrossRef]
  25. ASHRAE. Chapter 14, Climatic Design Information. In ASHRAE Handbook of Fundamentals; ASHRAE: Atlanta, GA, USA, 2021. [Google Scholar]
Figure 1. Flowchart of the CDDOP. It explains the steps involved in the three main modules of the CDDOP: data collection and preprocessing, DC power estimation, and maximization of the DC power to find the optimum panel orientation.
Energies 15 00624 g001
Figure 2. A solar panel showing its orientation and solar angles. Vectors S and E represent the South and East directions, respectively. Vector n is normal to the solar panel plane. Z denotes the Zenith vector perpendicular to the SE plane.
Energies 15 00624 g002
Figure 3. Shows a pseudo code for the GA implemented in the CDDOP. The code’s input consists of four parameters that define the GA behavior, and a vector of Γ that contains the coordinate of the location and the basic climatic data. The code returns the optimum tilt angle, α , and azimuth angle, γ , that corresponds to the maximum power generated by the PV panel.
Energies 15 00624 g003
Figure 4. Surface and contour plots of DC electric power per square meter generated by PV versus panel angles for Riverdale, New York City, NY, USA. (a) Shows the surface plot of the DC power kWh/m2 versus the Tilt and Azimuth angle. (b) Shows the contours of the DC power (kWh/m2) versus the orientation of the panel. The stared point in the middle represents the optimum tilt angle of 33.68° and azimuth angle of −5.62° at which 197 kWh/m2 power is delivered by the PV panel. The contour plot shows that small changes in the orientation of the panel result in a negligible DC power decrease.
Energies 15 00624 g004
Figure 5. Average daily DC power generation for New York City, NY, USA. (a) For an entire year and (b) for summer months (June, July, and August). The average daily distribution of power for the optimum orientation and the south-facing panels generate a very similar pattern, whereas the westward-facing panel produces significantly more power during summer afternoons.
Energies 15 00624 g005
Figure 6. Surface and contour plots of DC electric power per square meter generated by PV panel versus panel orientation in Orlando, FL, USA. (a) Presents the shape of the change in DC power [kWh/m2] versus the Tilt angle and the Azimuth angle. The surface plot presents a concave shape with an optimum value of 225 kWh/m2. The DC power decreases sharply for the tilt angle above optimum orientation. (b) Shows the contours of the DC power [kWh/m2] versus the tilt angle and the azimuth angle. The starred point represents the optimum tilt angle of 26.2° and the azimuth angle of −17.6°. While DC power is more sensitive to change in tilt angle, small changes in both tilt angle and azimuth angle result in a negligible power loss.
Energies 15 00624 g006
Figure 7. Average daily DC power generation for Orlando, FL, USA. (a) For an entire year and (b) for summer months (June, July, and August). The three different orientations generate similar power. The horizontal panel provides slightly more power in the afternoon hours. Additionally, the peak power generation is at about 11:00 a.m. solar time, particularly in the summertime. This is due to more cloud coverage during summer afternoons in Orlando, FL, USA.
Energies 15 00624 g007
Figure 8. Surface and contour plots of DC electric power per square meter generated by PV versus panel orientation in Los Angeles, CA, USA. (a) Shows change in the DC power kWh/m2 against the tilt angle and azimuth angle. The surface plot presents a concave shape with an optimum value of 25 kWh/m2 (b) shows the contours of the DC power kWh/m2 versus tilt angle and azimuth angle. The starred point represents the optimum tilt angle of 29.86° and the azimuth angle of 2.78°. The small changes in both tilt angle and azimuth angle cause a negligible decrease in power.
Energies 15 00624 g008
Figure 9. Average daily DC power generation for Los Angeles, CA, USA. (a) For an entire year and (b) for summer months (June, July, and August). The optimum orientation and the south-facing panel generate almost the exact amount of power. For the entire year, the difference between the optimum orientation and the southwest-facing panel is more significant, close to 6%. For the summer months, however, the southwest-facing panel produces significantly higher power in the afternoon.
Energies 15 00624 g009
Table 1. A comparison of optimum tilt angle and total incident irradiation on a solar panel calculated using present model (CDDOP), clear sky, clearness index and rule of thumb at Riverdale, NY, USA.
Model
Clear SkyMonthly Clearness IndexRule of ThumbPresent Model (CDDOP)
Tilt angle41.2°33.6°40.89°33.68°
Azimuth angle000−5.62°
Annual Solar energy incident on the panel, kWh·m22487154416761690
Table 2. A comparison of optimum tilt angle and total incident irradiation on a solar panel calculated using present model (CDDOP), clear sky, clearness index and rule of thumb at Orlando, FL, USA.
Model
Clear SkyMonthly Clearness IndexRule of ThumbPresent Model (CDDOP)
Tilt angle30.7°23.6°28.38°26.2°
Azimuth angle000−17.6°
Annual Solar energy incident on the panel, kWh·m22590199919571970
Table 3. A comparison of optimum tilt angle and total incident irradiation on a solar panel calculated using present model (CDDOP), clear sky, clearness index and rule of thumb at Los Angeles, CA, USA.
Model
Clear SkyMonthly Clearness IndexRule of ThumbPresent Model (CDDOP)
Tilt angle34.43°29.75°34°29.86°
Azimuth angle0002.78°
Annual Solar energy incident on the panel, kWh·m22598192322292236
Publisher’s Note: MDPI stays neutral with regard to jurisdictional claims in published maps and institutional affiliations.

