1. Introduction
According to the Global Status Report REN21 [
1], building energy need represents 33% of global energy demand and only a share less than 15% is satisfied by renewables. In total, 77% of the whole energy demand for buildings is related to heating, cooling, and domestic hot water (DHW) while the remaining 23% accounts for electricity needs such as lighting, equipment, and appliances [
1]. In line with the previous report, the European Commission’s 2020 report “A renovation wave for Europe” [
2] highlights that buildings are currently responsible for 40% of final energy consumption and 36% of greenhouse gas emissions (GHG) into the atmosphere.
In accordance with ENEA (Italian National Agency for New Technologies, Energy and Sustainable Economic Development), in Italy in 2018 the primary energy demand is equal to about 160 Mtep, satisfied for most by fossil fuel, even if the percentage covered by renewables increased in the past 2 years up to about 20% [
3]. A total of 40% of the Italian primary energy demand is required for civilian use (Source: Eurostat) [
3] and the residential sector shows energy consumption in line with the European average. On the contrary for non-residential buildings, Italy’s energy demand is, by far, higher than the European one (source: EU Building Stock Observatory) [
4].
Issues about energy consumption and environmental impact highlighted by this critical overview are mainly related to the age of the building stock, most of which was built in absence of specific energy and emissions regulations [
5,
6]. Furthermore, the European Commission admits that 75% of the current building stock is affected by several energy and environmental deficiencies and 80% of the existing building heritage will still be present by 2050 [
2].
For this reason, in accordance with the SDGs (Sustainable Development Goals) of ONU (United Nations), the European Member States have signed the European Green Deal [
7] highlighting the building sector as a key point of this agreement. In this perspective, one of the goals directly addresses the annual renovation rate of the building stock, prescribing an improvement from the current 0.4% up to 1.2% [
3]. Usually, high initial investment costs and raised payback periods make the integrated redevelopment (architectural, environmental, and energy) of a building difficult to achieve and very often retrofitting measures simply concern a single building element (e.g., the substitution of the lighting system). However, an integrated approach for existing building redevelopment also considering energy and environmental sustainability is mandatory to achieve a carbon-free economy by 2050, as called for in the Paris Agreement of 2015 [
8]. Moreover, existing building heritage retrofitting is necessary to reach the goals set for 2030 (reduction of GHG emissions of 55% with respect to 90s level, increase in energy efficiency up to 32.5%, use of renewables up to 40% to satisfy the energy needs) as well (2030 climate and energy framework) [
9].
In this context, a critical building stock is the one represented by education buildings. Italian existing schools are characterized by architectural, energy, and environmental critical issues since 63% of them were built before 1974 (23% before 1940) when no requirements dealing with energy and GHG emissions were considered in the design phase [
5]. Obviously, this building stock requires urgent retrofitting to meet European current goals concerning energy savings and reduction of the environmental impact of buildings but also to guarantee proper wellbeing to students and teachers. The Italian school sector energy demand accounts for 1 Mtoe/year [
10] and 73% of the whole energy needs is for kindergartens and primary and secondary schools. According to Legambiente’s report [
5] of 2020, only 15.5% of the total existing schools in Italy was energy retrofitted and an even lower percentage (nowadays only 5.5%) was classified as energy efficiency class A following the Italian energy label criteria (global energy performance index for non-renewables EP
gl,nren > 0.8 EP
gl,nren,rif,standard (2019/21) reference building global energy performance index for non-renewable) [
11]. In Italy, 0.8% of newly constructed buildings in the last 5 years were meant for hosting schools; moreover, demolition and reconstruction of buildings is not always the most suitable solution because of the required time, the initial investments, and the environmental impact [
12]. There are many studies in the literature about existing schools’ energy retrofitting, proposing different measures to reduce primary energy demand and operational costs [
13] or initial investments for different interventions [
14]. Moreover, other researchers aimed at redeveloping existing buildings to meet the Nearly Zero Energy Building (nZEB) standard [
15,
16,
17], also through an integrated approach [
18], 3-liter building standard [
19] or plus energy level [
20]. For instance, Salvalai et al. [
14] tried to define, with an energy and economical approach, the most suitable and cost-effective redevelopment measures for facilities (clusters) representative of different school building types in Italy. Many authors pointed out that renewing the artificial lighting systems and managing solar shading systems can significantly reduce the primary energy demand of a school building. Other research stressed that it is fundamental to implement an energy management system to decide which schools should be redeveloped [
21]. Furthermore, considering the Mediterranean climate, Gamarra et al. [
22] proposed different energy strategies for the retrofitting of two schools located in Madrid. The aim of the research was minimizing both the global warming potential and the energy consumption through the implementation of renewables and the optimization of energy use. This was obtained through the increase in cooling and lighting system efficiency. Otherwise, Marrone et al. [
23] firstly performed a cluster analysis to individuate the representative school building types between 80 different schools located in central Italy and secondly, they identified the best energy retrofit measure for each one of them. They suggested envelope insulation, energy service upgrade, and renewables implementation to obtain 80% of heating energy saving. On the other hand, Pagliano et al. [
24] considered a child center located in Milan and they want to define some energy redevelopment strategies to guarantee the proper thermal comfort of the occupants also in future decades considering climate change and the increase in external air temperature. They state that it is fundamental to take into account the introduction of passive cooling strategies combined with the refurbishment of the external envelope. According to the previous study also Heracleous et al. [
25] analyzed educational buildings in Cyprus considering the current climate change. They want to individuate the proper energy redevelopment measures (mainly passive measures and heat recovery for ventilation) to guarantee the occupants thermal comfort minimizing heating demand and avoiding overheating in summer. Alternatively, Lakhdari et al. [
26] used genetic algorithms to propose a classroom design to ensure proper thermal and lighting internal conditions by guaranteeing low energy consumption. They concluded that an optimization of the external envelope parameters (such as window-to-wall ratio or solar shading system) during the preliminary design phase ensures good comfort and energy performance.
Within the context outlined so far, the research presented in the paper proposes the application of the cost-optimal methodology to evaluate retrofitting interventions to be applied on several educational buildings. This study aims at supporting the decision-making process of designers involved in energy improvements of school facilities, preliminarily estimating the costs of different kinds of measures and their energy savings.
The paper deals with the analysis of two different school buildings located in Florence (cold climate zone) to define cost-effective energy and environmental redeveloping measures. Since the studied facilities are characterized by two different structural and technological solutions, both widely spread in Italy for schools built in the 70–90 s period, the chosen interventions could be implemented on a larger building stock. One of these buildings was chosen also because it was constructed by the same company with the same structural and technological solution of another school that was previously studied [
27]. Therefore, it is possible to make comparisons between the main results obtained [
27].
It is worth noticing that in the literature there is a lack of research applying a cost-optimal method to school building type. Thus, this work wants to focus on a wide building stock not often analyzed but affected by several energy issues. By adopting a cost-optimal approach, a series of cost-effective measures can be identified to produce relevant improvement in energy performance keeping the initial investments within an affordable level. This aspect is particularly significant in this case since these interventions are funded by public administrations that have to deal with limited budgets. The methodology was not only merely applied, but the results obtained were also critically discussed in order to highlight the weaknesses of the cost-optimal method itself. Moreover, an entire section of the paper deals with the optimization of PV modules distribution to maximize energy production that has no precedent in literature about schools. In the paper, at first the state of the art about cost-optimal methodology for different building types will be shown; secondly the methodology used for the research will be explained in detail, then the main results of the performed cost-optimal analysis will be illustrated and discussed, and finally conclusions will be delineated with some outlook for future research.
2. State of the Art
The cost-optimal procedure is a comparative method proposed for the first time directly by the European Directive 2010/31/EU [
28], known as EPBD recast, and the delegated Regulation 244/2012 [
29] and later updated by the last European Directive 2018/844/EU [
30]. This cost-optimality methodology enables to define the requalification measures for both new constructions and existing ones aiming at both energy and economic sustainability. Therefore, performing this kind of analysis, the designer can outline the redevelopment interventions that minimize energy consumption maintaining an affordable cost for the owners. The upgrading intervention alternatives are related in the same graph to both primary energy demand (kWh/m
2a) and global cost (EUR/m
2). The whole cost includes initial investments and operational, servicing, substitution, energy, and disposal costs [
31]. Obviously, it is possible to consider both single energy measures and combinations of different redevelopment interventions.
Several studies about cost-optimal methodology applied to different buildings typologies (residential and non-residential intended use) can be found in the literature [
32]. Many authors performed cost-optimal analysis in the case of residential constructions, which is indeed the most studied building type with this kind of approach. For instance, Tadeu et al. [
33,
34] used the cost-optimality methodology to study the existing residential building stock in Portugal. They proposed a simplified cost-optimal methodology to compare the energy resources for four possible systems to satisfy energy needs for DHW and heating. The solution coupling a gas water heater and heat pump proved to be the best to minimize primary energy consumption, but in a cost-effective perspective the gas water heater and the gas boiler had to be preferred for DHW and heating system, respectively. As a final result, acting on the energy system was assessed to have a greater impact than implementing passive measures, such as insulation of both facades and roofs or the substitution of windows with better ones. Moreover, such a result confirms other previous research findings for Italy [
35]. On the other hand, Panagoutidou et al. [
36], introducing environmental impact evaluations as well, tested the combination between active and passive measures affirming that the external envelope insulation and the installation of a heat pump can reduce greenhouse emissions by about 60%. A further decrease up to 96% can be achieved introducing a coupled PV system.
However, the residential intended use is not the only studied to find out the cost-effective solution for energy and environmental retrofitting. In the literature there are some studies concerning offices [
37], hotels [
38], shopping malls [
39], and some cases of industrial buildings [
40]. Vujnovic et al. [
41] performed a cost-optimal methodology to evaluate a newly built hotel in Croatia. They took into account the costs of energy, systems, and installation, considering also internal comfort conditions to avoid systems oversizing and consequent reductions in their efficiency.
In line with the previous study, the cost-optimal methodology was used by other authors also during the design phase to obtain efficient and environmentally friendly newly constructed buildings. For instance, Congedo et al. [
42] concluded that for a new office building located in a warm climate it was essential to install a heat pump integrated with solar collectors and PV panels to meet both the cost-effective and the nZEB standard. Considering the same intended use, Niemela et al. [
37] applied the cost-optimal methodology to evaluate retrofitting measures for office buildings built in the 70s and 80s. They proposed a ground-source heat pump for both heating and cooling purposes as cost-optimal measure to guarantee proper internal thermal conditions and low CO
2 emissions.
Moving up to a larger scale, other studies point out that is essential to consider the urban level and not only a single building type. Luzuriaga et al. [
43] proposed a cost-optimal assessment to be applied at urban scale to provide a tool supporting public administrations in the decision-making processes. By this way, long-term strategies for the management and the redevelopment of existing residential building stocks could be effectively improved. They considered a combination of both passive and active measures applied to 17 different types of residential buildings, selected as representative of the housing heritage. They stated that an external insulation layer of 0.7–0.8 m can reduce the heating primary energy demand by about 19–47%, depending on the characteristics of the building considered. Moreover, the combination of the external insulation layer and the use of solar collectors for DHW covering about 60% of production proved to be the cost-effective solution in this case. Following the previous study, Yazdanie et al. [
44] proposed a renovation of existing building stocks to reduce energy demand and CO
2 emissions at urban scale. Adopting cost-effective solutions in a long-term perspective of carbon-neutrality was considered by the authors a key point to ensure sustainable urban energy planning strategies with the same approach, research by Carpino et al. [
45] addressed the widespread Italian social housing building stock to promote an urban sustainable growth. They pointed out that for these kinds of facilities, often old and outdated, it was necessary to intervene on the building system and to integrate renewables for both cold and warm climates to have a cost-effective solution and a decrease in net thermal energy. Moreover, external envelope retrofitting was also needed to comply with the nZEB requirement. Some authors tried to analyze different kinds of refurbishment measures applied to different building types [
32,
46].
Some of them highlighted a significant gap between the cost-effective measures and the ones needed to reach the nZEB status. Baldoni et al. [
47] pointed out that such a difference can be related to the variability of the economic parameters used in the analysis, while Becchio et al. [
48] concluded that the nZEB solution is far from being the cost-effective one. However, Salem et al. [
49] stated that the nZEB retrofitting solution and cost effective one differs by about 30%. In this regard, Soares dos Reis [
50] proposed to update the cost-optimal evaluation introducing environmental impact and quality indicators remarking that sustainability must be ensured in a multidisciplinary perspective and not from a merely economic point of view.
Other studies performed a similar analysis in different climate conditions. Paduos et al. [
51] stated that the refurbishment of the existing building stock complying with the nZEB standards (considering the nZEB definition of several European Member State) is possible only with very high initial investment costs. Consequently, retrofitting measures allowing to ensure a zero-energy demand for buildings are not always the cost-effective ones. D’Agostino et al. [
52] pointed out a methodology to define the cost-effective solution to reach nZEB standard energy savings (beyond 90%) considering 14 different locations in Europe: for colder climate zones, envelope retrofitting is fundamental while for hotter climates the lighting system renovation is needed to obtain zero energy consumption. The energy system redevelopment and its integration with renewables are crucial to ensure zero energy consumption and low environmental impact. Finally, Ferrara et al. [
53] demonstrate that energy redevelopment interventions can produce a dual benefit, making buildings more efficient and, at the same time, most resilient to climate change.
Looking at the European target of a carbon-free economy by 2050, many authors agree that it is fundamental to include the greenhouse gas emissions in the cost-optimal methodology. For instance, Chastas et al. [
54] proposed a first attempt to introduce the embodied impact in the EPBD recast in the cost-optimal methodology. They performed a sensitivity analysis considering climatic, design, and economic parameters and they highlight an increase in global costs in a range between 0.90% and 2.40%. At the same time, Asdrubali et al. [
55] affirmed that it is necessary to consider the energy and environmental payback period in the analysis of cost optimal to obtain both the cost-effective measures and the nZEB standard.
Other research in the literature pointed out that achieving the nZEB status for existing building is impossible recurring only to passive redevelopment measures, but system retrofitting is essential. For instance, Galimshina et al. [
56] performed a multi-objective optimization considering all the possible uncertainties of LCA (Life Cycle Analysis) and LCCA (Life Cycle Cost Analysis), mainly related to building operation phase and materials production. They found out that to minimize both GHG and annual costs, the replacement of the existing gas boiler for the heating system is needed. For the authors, the best solution is a biomass (wood) boiler compared to an air–water heat pump. Amer et al. [
57] as well performed a multi-objectives optimization looking for the zero-energy and cost-optimal solution for the construction of a roof stacking. They pointed out that this could be an effective solution to build new residential facilities without constructing new buildings. The goal of the performed analysis was to minimize the global cost and the energy demand assisting in the decision-making process for this kind of intervention. Moreover, for completeness, they considered the increase in weight for the construction from a structural point of view.
Finally, studies applying a cost optimal method to school buildings [
13,
58,
59] are not very common in the literature since, as already mentioned, the residential type is the most studied building type. For instance, regarding school buildings, Bonomolo et al. [
60] proposed the cost-optimal approach to evaluate the cost-effective measure for the renovation of the artificial lighting system of two existing school buildings, since this measure proved to be the most effective and sustainable retrofitting intervention. Stocker et al. [
61] proposed this kind of method applied to eight schools in the Alps, considering different solutions for external walls with different thicknesses of insulation and several alternatives of heat generators to minimize heating energy needs. They stated that the substitution of the existing heating system can ensure the best trade-off solution between investment costs and primary energy demand reduction. Alternatively, Moazzen et al. [
62] aimed at implementing the life cycle assessment for school building type also taking into account the occupants’ thermal comfort, the nZEB standard, and the cost-optimal method to define the redevelopment measures to be used. They considered different technological solutions for the external envelope and three climate zones. For some climatic conditions, the increase in occupants comfort level can be reached for both nZEB and cost-optimal retrofitting scenario. Finally, Congedo et al. [
63] applied the cost-optimal method to a kindergarten and a nursery school situated in Italy. The cost-effective solutions proposed by the authors, always including heat pump and renewables coupling, permit to reduce the primary energy demand and the gas emissions by 85% and about 83%, respectively.
3. Method
The research followed a method made up by four phases, following the same procedural steps adopted in a previous similar work by the research group concerning [
27] the same building type:
Phase 1
At first, two different case study representatives of the Italian existing school buildings heritage are individuated. The facilities chosen are characterized by two of the most recurrent technological and structural solutions adopted in the period 70–90s, with a reinforced concrete load bearing structure and a prefabricated one, respectively. Both schools are located in Florence, in climate zone D [
64] with 1821 heating degree-day. The city has a temperate and sub-coastal climate with moderately cold winter and 2–3 months with an average temperature < 10 °C and hot summer with 3–4 months with an average temperature > 20 °C. The heating period is within 15 November and 15 April.
A more detailed description of the two buildings analyzed will be provided in
Section 3.1 Case studies. The differences registered in the construction technique are also reflected in the different approach to be applied for energy retrofitting measures. For the first building, the redevelopment proposed is based on the addition of layers to the existing external envelope, while for the other also disassembly and replacement of the current prefabricated panels is considered.
Phase 2
In a second stage, a detailed analysis of the case studies is performed to define their energy performance and, consequently, the environmental one. Energy simulations are performed using Energy Plus software [
65] with Design Builder [
66] as a graphical interface. Heating, cooling, artificial lighting, and domestic hot water were considered for the estimation of primary energy demand because they are the most important contributions to the energy balance of school buildings. As concerns the energy simulation set up, the real geometry of the two existing schools is imported in Design Builder starting from a Building Information Model (BIM) of the current condition previously realized in Revit software [
67]. In the energy analysis model, each thermal zone is individuated according to its intended use (
Figure 1). Further, for each functional unit the following design parameters are defined: (i) occupancy (persons/m
2) according to
Appendix A of UNI 10339 [
68] (UNI Italian National Agency of Unification), (ii) minimum air flow rate according to the same standard with reference to the type of functional unit (vol/h or m
3/s person), (iii) heating and cooling setpoint during the activity period and the attenuation temperature (°C) for the rest of the day depending on the thermal zone in accordance to UNI/TS 11300-1 [
69] (TS technical specification), (iv) internal gains according to the same legislation [
69], (v) domestic hot water need depending on the number of students in accordance to UNI/TS 11300-2 [
70], and (vi) the openings hours according to the real school time table. Dynamic energy simulations were performed in hourly time steps considering a simple Heating, Ventilation and Air Conditioning (HVAC) system and choosing the proper energy vector and the right efficiency for the system.
Phase 3
To integrate energy production from renewable sources, the installation of photovoltaic panels is proposed among the other retrofitting measures for both the case studies. A photovoltaic system with PV modules of 1 × 2 m with a power peak of 500 Wp was considered. While in the Rodari school their distribution is substantially obliged due to the roof geometry, the Poliziano case study is chosen to test an optimization method to guarantee the maximum exploitation of rooftop solar technical potential. Starting from the BIM model, parametric modelling and generative design tools are implemented to point out the optimized PV array geometry. Nowadays, these techniques are emerging trends in the Architecture Engineering and Construction (AEC) sector and can assist designers in the decision-making process. The extreme flexibility of these tools, often relying on algorithms autonomously set up by the designers, makes them suitable for different subjects of interest and final goals. They ensure the automatic generation of different solutions exploiting the computational resources of computers to produce several alternatives otherwise not considerable with traditional calculations. Two different approaches are currently adopted for the evaluation of the generated alternatives. The first one, related to said optimization procedures, is based on the maximization or minimization of one or more fitness functions set by the designer and is autonomously carried out by the computer until convergence according to the optimization algorithm [
71]. The second method is represented by the design optioneering approach, that allows the exploration of the various design options obtainable from a given set of parameters but without pre-set target values for the outputs of interest [
72]. This latter possibility was tested by the research group in a previous study [
73] concerning the choice of materials for envelope components based on multicriteria considerations including sustainability aspects. In this regard, several applications of optimization methods can be found in the literature [
74]. For instance, studies are performed regarding envelope components [
75] as well as lighting conditions and systems [
76]. To satisfy sustainability goals, other authors focus their research on the search of the optimized design of form and facade of buildings [
77], recurring to Mc Neal’s Grasshopper plugins. Generative design algorithms can indeed be coupled with environmental simulation platforms allowing rapid comparisons and more conscious design choices. In the research here presented, the tools illustrated until now are used to evaluate the most effective distribution of PV modules to be installed on the roof of Poliziano school aiming at maximizing the total incident radiation and, consequently, energy production. The method is summarized in
Figure 2 and combines the use of Revit, Grasshopper for Revit [
78], and a series of related plugins for environmental analysis, optimization, and design optioneering procedures.
Starting from the BIM model in Revit, Grasshopper is used to produce an original algorithm in visual programming language (VPL) for the automatic generation and evaluation of different configurations for the PV panels array. This procedure is implemented with reference to the wider roofing surface available, whose geometry is selected directly from the BIM model. Module dimensions can be set according to manufacturer technical sheets in terms of width and length and are assumed as fixed. The input variables chosen for the optimization are the tilt angle of the panels, the orientation of the array and the distance between consecutive rows. For each of the parameters listed before, a range of variability is assigned. For the tilt angle, configurations considered start from a minimum of 0° to reach a maximum value of 60° with increments of 2°. Orientation is assumed to vary from 0° to 360° (2° increment), while the maximum distance between rows is set to 2.2 m starting from 0.7 m (0.1 m increment). This minimum boundary is introduced to ensure adequate maintenance operations and for the same reason panels are not foreseen in a perimeter band all over the roof. As for the radiation analysis, climatic data are obtained by the EnergyPlus database available online and implemented in the algorithm through the Ladybug plugin, the same used for environmental simulation too. The reliability of this tool is certified by other authors [
79] comparing the result obtained with the ones provided by fully integrated climatic simulation engines. The radiation analysis is carried out considering a period from 1 to 6 January with 6 hourly timesteps to enhance energy production in the most adverse conditions. Moreover, considering a short time interval prevents from excessively time-consuming operations. The search for the optimized solution is initially undertaken using the genetic algorithm of the Galapagos plugin. Based on natural selection processes, this kind of algorithm proceeds until convergence starting from an initial set of possible configurations and applying combination and random mutation to reach the optimized solution. To validate the result obtained and ensure reliability to the whole process, various alternative solutions are explored with a design optioneering approach. The Colibri plugin [
80] is used to generate the configurations while the online viewer DesignExplorer by Thornton Tomasetti [
81] allows to effectively compare and filter them. Once the solution of interest is pointed out, the analysis is deepened considering a different distribution of PV modules. Instead of single rows of panels, a configuration with collectors paired on their top edge is considered since it proved to be the most effective according to the result of previous research [
82]. In this case, a multi-objective evolutionary optimization is processed thanks to the Octopus plugin for Grasshopper [
83] based on SPEA-2 and HypE algorithms from ETH Zurich. The total incident radiation and the number of panels installed are selected as outputs of interest and the pareto front of non-dominated solutions is generated by the optimization tool. By this way, the best trade off configurations, able to maximize energy production with the lowest number of panels installed, can be assessed. Comparing the incident radiation obtainable with the same collectors of the first optimized geometry, it is then possible to choose the most cost-effective array. The preferred panels geometry is finally reinstated in the Design Builder energy analysis model to assess hourly energy production.
Phase 4
At the final stage, the cost-optimal methodology is applied to analyze and compare the different retrofitting measures proposed and to individuate the most cost-effective ones from an energy and economic point of view. The most recurrent energy and environmental redevelopment measures for this building type were already individuated in literature as a result of a previous study [
84] and so some of them are applied to these two representative case studies to comply with Italian standard energy requirements. In the following tables (
Table 1 and
Table 2), the redevelopment proposed for the cost-optimal analysis is listed for both schools. The tables show redevelopment measures considered individually and some combination of them addressing both external envelope and system. Among the retrofitting measures related to the external envelope redevelopment, some foresee the insertion of an insulation layer (made of mineral wool or wood fiber) for both external wall and roof to meet the half of the minimum thermal transmittance. As it concerns systems retrofitting, three different kinds of solutions are proposed: firstly, the substitution of the existing gas boiler (efficiency equal to 50%) with a new one characterized by an efficiency of 90%, secondly the substitution of the existing halogen lamps with LED (Lighting Emitted Diode; efficiency equal to 120 lm/W), and finally the substitution of the existing gas boiler with an air-to-air heat pump (COP (Coefficient of Performance) equal to 3.8 and EER (Energy Efficiency Ratio) equal to 3.5). This last measure was evaluated in two different scenarios: at first considering the building connected to the public electricity grid and later taking into account the integration of photovoltaic system on the roof in order to maximize the electricity production on site. The choice is in this case to install as many panels as possible to produce a surplus of electrical energy, since Italian schools are expected to be plus energy buildings as many European ones. The modules for the photovoltaic system are characterized by an efficiency of 21.3% and a peak power of 500 Wp.
The different technological solutions proposed are detailed in
Table A8,
Table A9,
Table A10,
Table A11,
Table A12,
Table A13,
Table A14,
Table A15 and
Table A16 and
Table A21,
Table A22,
Table A23,
Table A24,
Table A25,
Table A26,
Table A27 and
Table A28 in
Appendix A for Poliziano and Rodari school, respectively.
In a cost-optimal analysis both financial and macroeconomic scenarios have to be considered as recommended by the European Directive [
28] and thus the global cost was calculated using the following equation (Equation (1)) according to the UNI EN 15459: 2018 [
85]:
where
CG (
τ) is the global cost referred to the first year
τ = 0,
CI means the initial investment costs,
Ca,
i(
j) stands for the annual cost for the year
i for the component
j,
Rd(
i) is the discount factor for the year
i for the component
j,
V(f,r)(
j) means the residual value of the component
j at the end of the calculation time, and
C(c,i)(
j) is the cost of CO
2 emissions that is considered only for the macroeconomic scenario.
As in [
27], the initial investment cost for materials was calculated recurring to Italian region price list [
86], DEI price list of 2018 [
87] and, in case of no available information, referring to producer’s websites and references in the literature [
45]. The cost of labor is included in the cost of components according to most of the price lists; when not available, the price of a specialized labor is considered for the calculation. As it concerns the period for the cost-optimality methodology, it is assumed equal to 30 years. For all the measures and components characterized by a shorter service life, the costs for maintenance and substitution have to be considered (
Table 3). The annual servicing cost is calculated as a percentage of the initial investment cost as required by Annex D of regulation EN 15459:2018 (EN Comité Européen de Normalisation) [
85]. On the other hand, the substitution cost is equal to the initial price of the element properly modified referring to the discount rate for the corresponding year. Finally, the disposal cost was not considered because in this case it is irrelevant compared to the others.
The cost of energy for building operational phase is set according to ARERA (Authority of Regulation for energy grid and environment) and it is included as well. As mentioned before, both financial and macroeconomic scenarios are considered for completeness; in the first one VAT (Value Added Tax) and excise duties are considered, while in the latter the cost of CO
2 emissions was included, and the previous factors are not. As stated by the aforementioned regulation [
72], the cost of the emissions is equal to 20 EUR/tCO
2 within 2025, 25 EUR/tCO
2 within 2030, and 25 EUR/tCO
2 after 2030. To calculate the CO
2 emissions related to energy consumption, the conversion factors for each energy vector provided by ISPRA (Institute for Environmental Protection and Environmental Research) report 317/2020 [
88] are used. Discounting factors are equal to 4% and 5% for financial scenario and 3% and 4% for the macroeconomic one.
3.1. Case Studies
Poliziano school is a secondary school located in Florence designed and built by “Baldassoni Adolfo e figlio s.r.l.” company in 1976 in a construction site of about 13,200 m
2. The building is organized into three different volumes, connected through a large horizontal connection, with a load-bearing structure with reinforced concrete pillars and beams. The school is characterized by a very complex and articulated geometry and the total surface is about 4700 m
2 with a volume equal to about 17,300 m
3. As it is possible to observe in
Figure 3, the central block and the east-oriented one are characterized by the presence of most of the classrooms and laboratories. As expected, the functional area dedicated to the teaching activities covers about 33% of the whole school surface. In the school there is also an auditorium and a gym that are used also for extracurricular activities. The load-bearing structure is made of reinforced concrete. This facility underwent an energy retrofitting in recent years with the addition of a polystyrene insulation layer for the redevelopment of the external walls. By the way, this intervention involved only a portion of the building that hosts part of the home base [
89]. With respect to the technological solutions used in this building (
Table A1,
Table A2,
Table A3,
Table A4,
Table A5,
Table A6 and
Table A7,
Appendix A), the ground floor is made of two different types of slab (brick slab or predalles one) depending on the building block, the external walls are constituted by a double layer of bricks with an internal cavity, except for the retrofitted building portion where they are made of expanded clay blocks and external insulation layer in EPS material. The roof floor is composed by a brick slab with external finishing made of waterproof sheet. Finally with respect to the windows, they are characterized by a wooden frame and a single glazing 5 mm thick. Except for the external wall of the retrofitted block, all the technological solutions do not meet the minimum requirements of the Italian energy standard, as demonstrated in
Table A1,
Table A2,
Table A3,
Table A4,
Table A5,
Table A6 and
Table A7 (
Appendix A). It must be specified that, for this school, the requalification of the gym is not considered.
Rodari school, built in the first half of the 70s by Fratelli Bortolaso Company of Verona, is located in Florence and it is characterized by a metal load-bearing structure with external walls made of insulated precast reinforced concrete panels. The use of such modular structures for school buildings was quite common in Italy during the 60s and 70s, when prefabrication techniques spread significantly. The building, hosting a primary school and a kindergarten, has a linear geometry and it develops over three floors (
Figure 4). The different functional units are organized along a horizontal connection on both sides. The total surface of the school building is about 790 m
2 and the area of the gym is equal to 360 m
2 for a total volume of the building of about 13,100 m
3. Canteens, kitchen, locker rooms, reception. and toilets are located on the ground floor. First and second floors host the home base with classrooms and laboratories for kindergarten and elementary school, respectively. In this case also the gym was considered in the redevelopment since it is characterized by the same structural and technological solutions of the main building. As regards technological solutions, the ground floor is characterized by a brick slab with wood internal finishing, the external walls are made of vibrated and reinforced concrete conglomerate panels of 0.03 m thick that also presents an insulation layer in resin foam. The roof floor is constituted by a precast reinforced concrete slab and an insulation layer in resin foam. In this case, windows and glazing have not been redeveloped yet and so their retrofitting is not considered in this study. As for Poliziano school, all the technological solutions do not meet with the minimum thermal Italian standard requirements, as reported in
Table A17,
Table A18,
Table A19 and
Table A20 (
Appendix A).
In both schools. the heating system is made of a gas boiler (efficiency was considered equal to 50%) for heat generation and in each functional units and radiators are installed. There is not a cooling system and natural ventilation for the internal space was considered.
4. Results and Discussion
As for the optimization of PV modules distributions, results will be discussed considering the different procedures and tools implemented. Starting from the optimization in the case of a single row-distribution, a PV array south oriented with rows spaced by 0.7 m and panels with a tilt angle of 42° proved to be the most suitable geometry according to the Galapagos solver (
Figure 5). This solution, emerging as the optimum solution after 53 iterations, can ensure a maximum solar incident radiation of 4442.30 kWh.
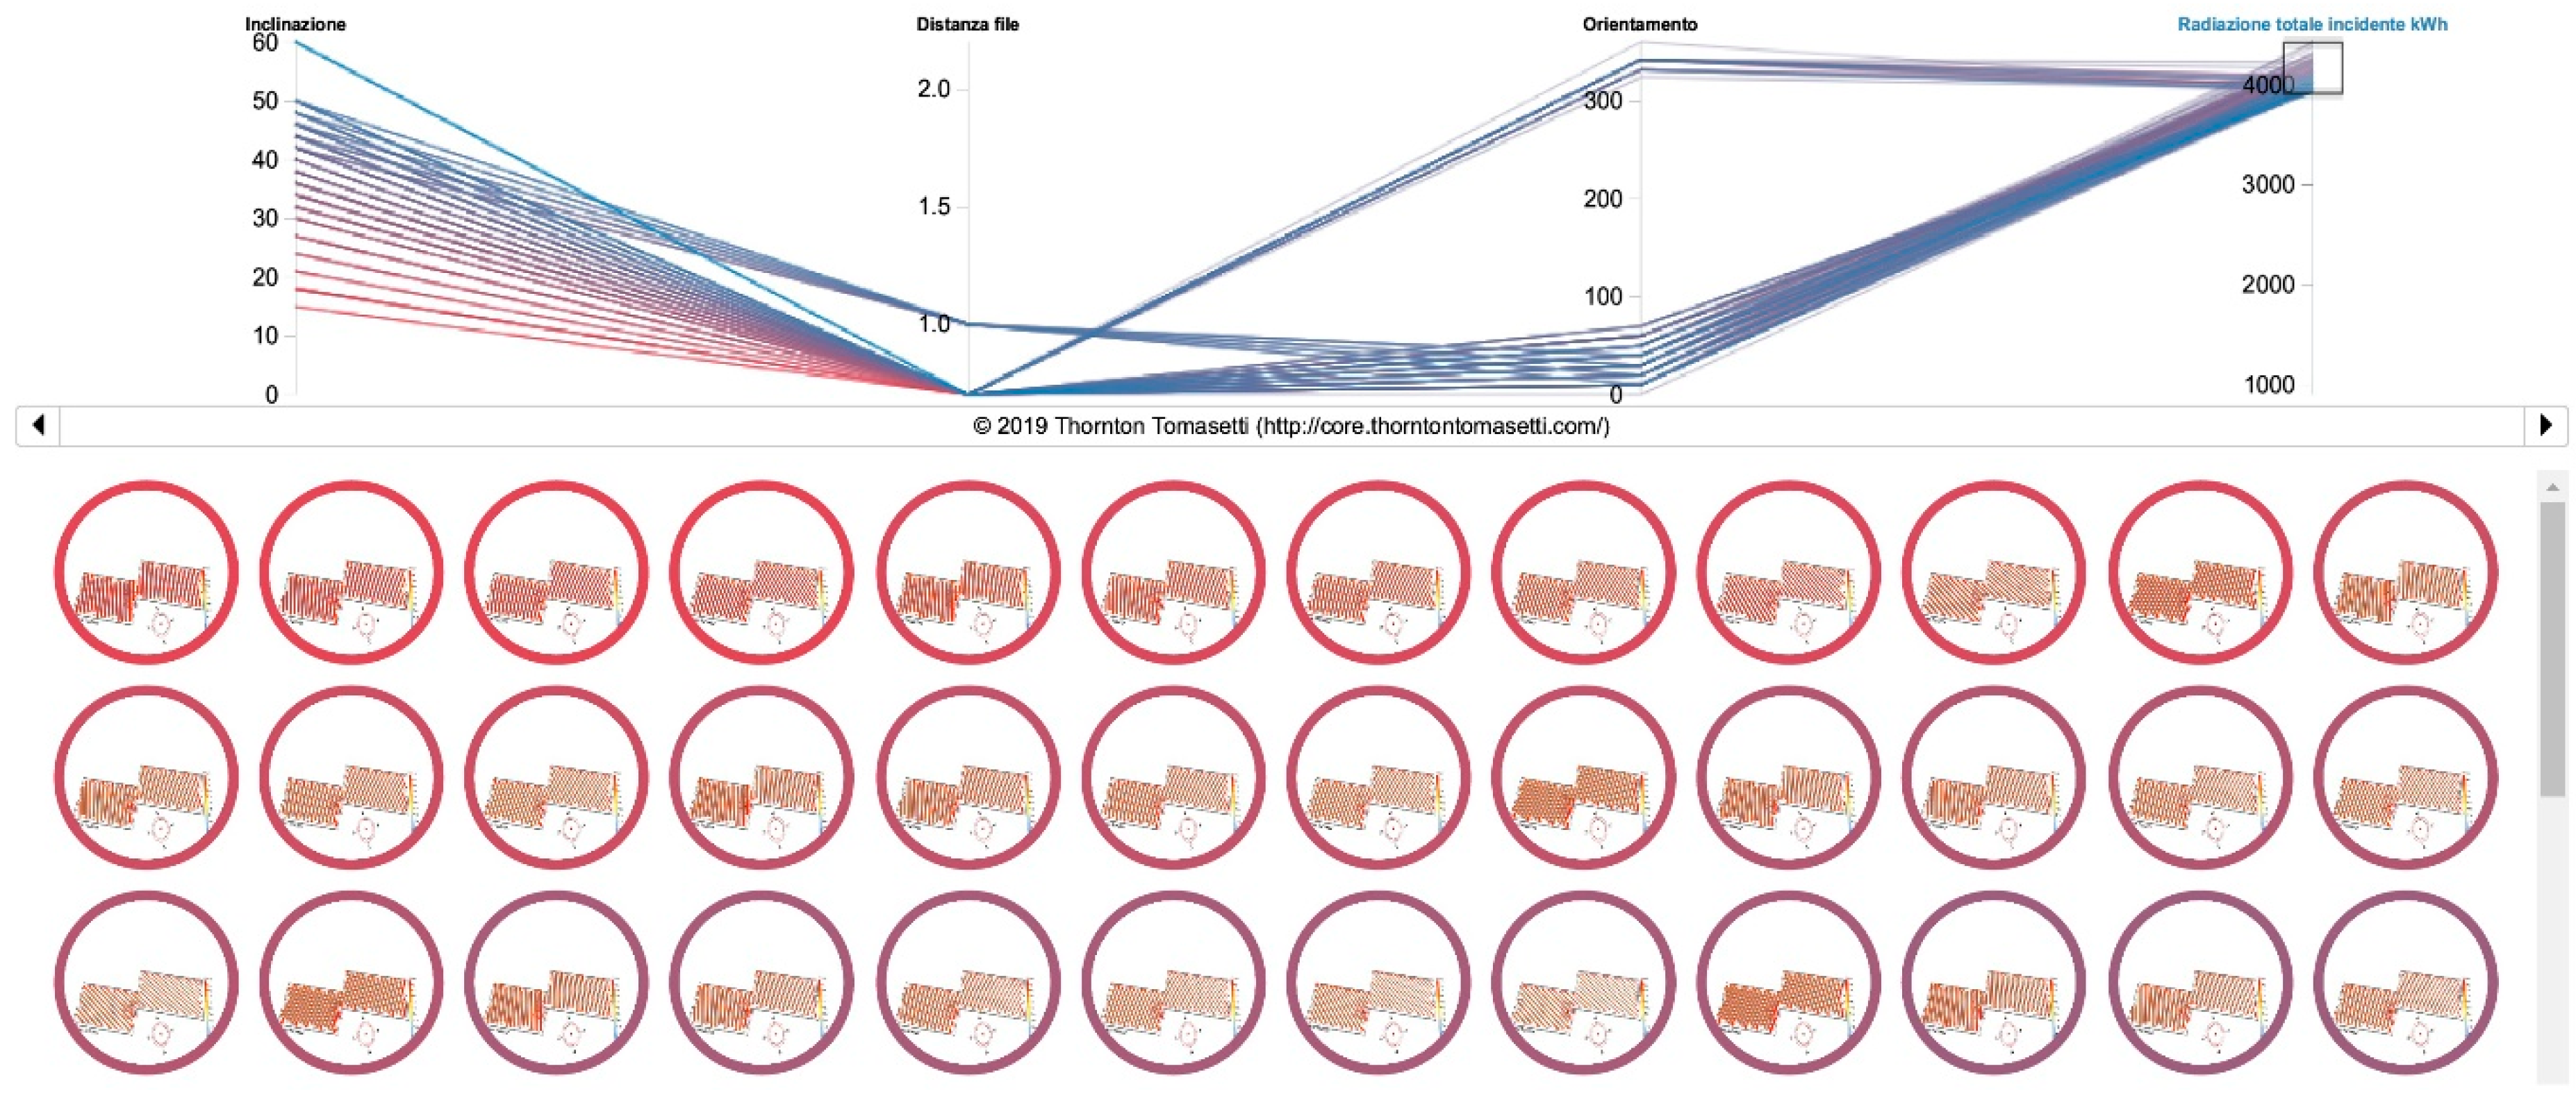
This geometry was validated applying a design optioneering procedure. Thanks to the open-source interactive visualization platform DesignExplorer (
Figure 6), it was possible to filter the 5016 solutions generated according to the preferred output of interest. Restricting the range of incident radiation values to admit only the highest performance, the same values of tilt angle, orientation, and rows distance previously obtained were retrieved in the columns collecting input variable parameters. Immediate visual feedback is associated to each of the geometries along with the graphical representation of the radiation analysis. The results are freely accessible online simply using the following link (
http://tt-acm.github.io/DesignExplorer/?ID=BL_3ncyykm, accessed on 7 November 2021).
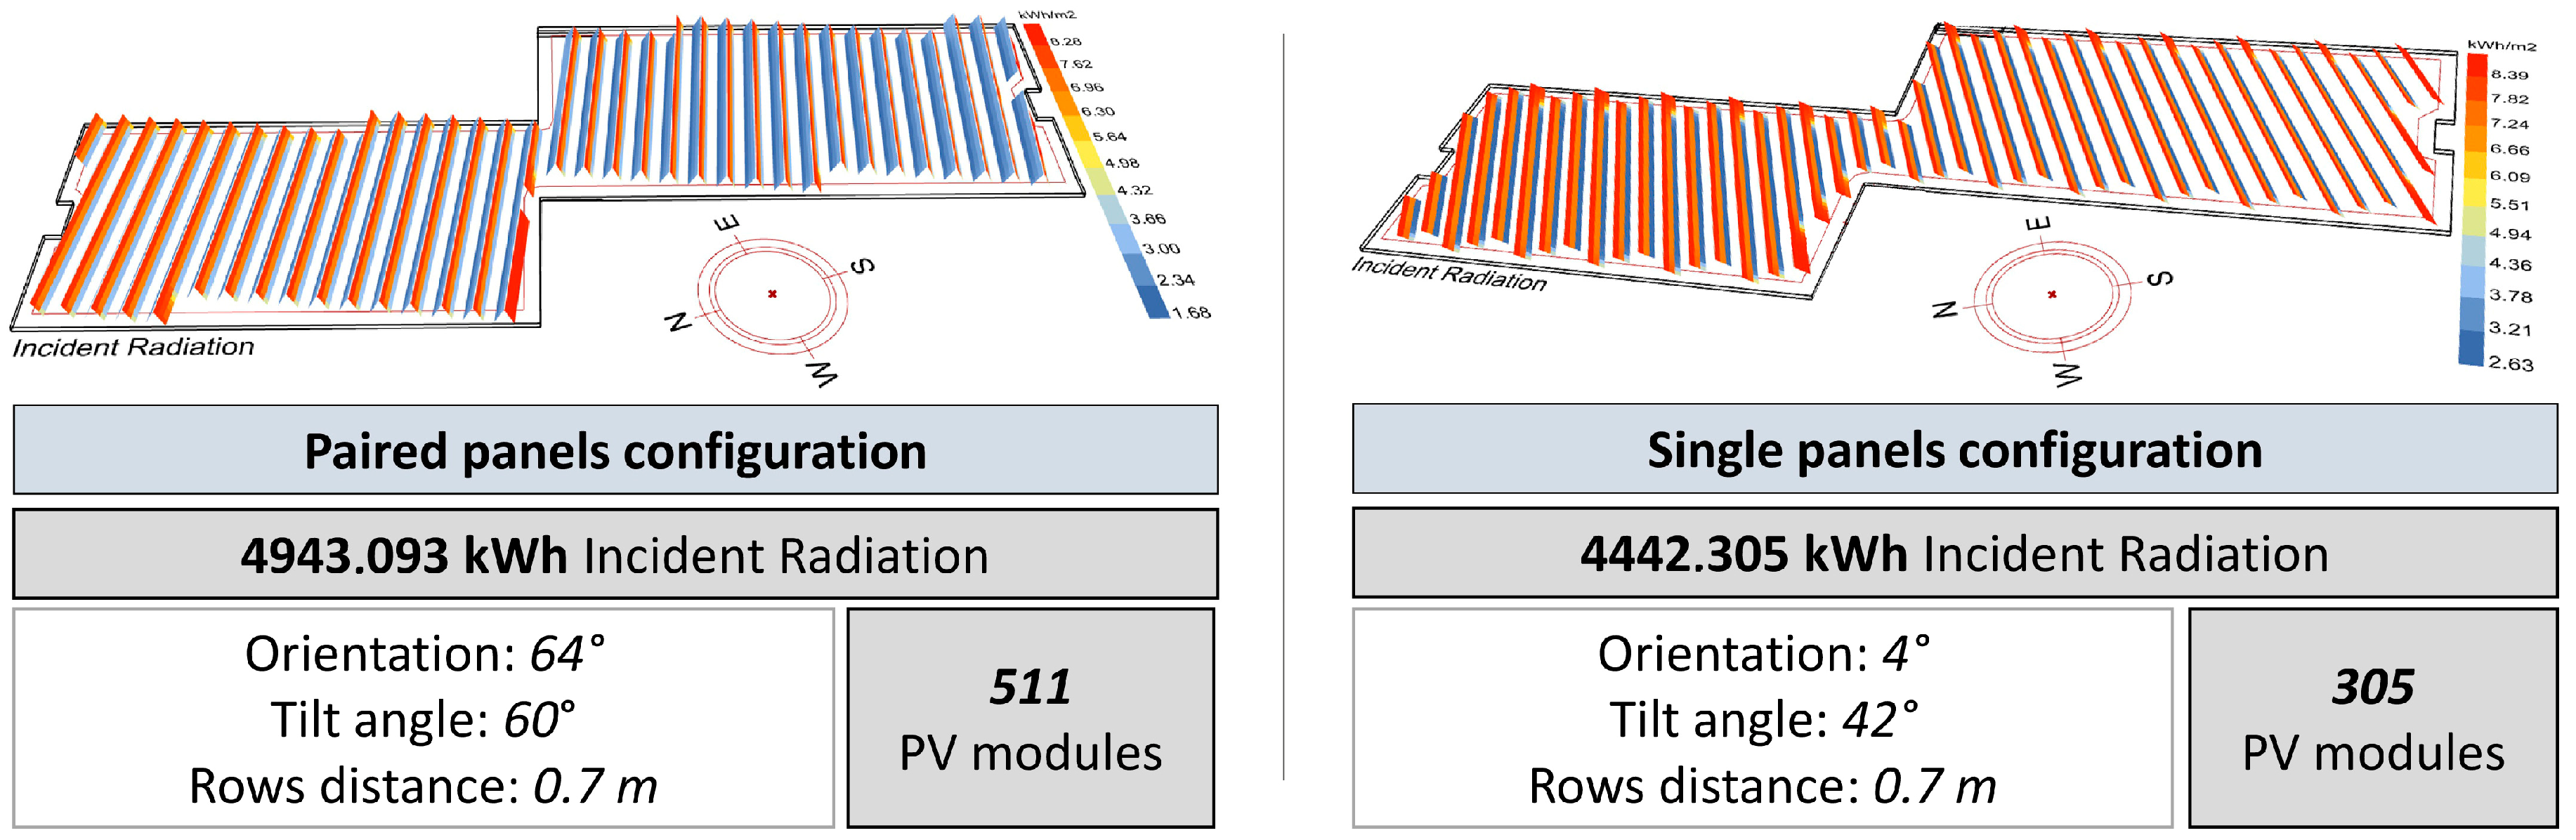
As anticipated in the previous section, a configuration with paired PV panels was also evaluated. At first, an optimization analysis with Galapagos was carried out. In
Figure 7 the two best distribution for paired and single panels, respectively, are compared: the former, with south-west orientation and 60° tilt angle, allows higher energy production but requires the installation of more modules.
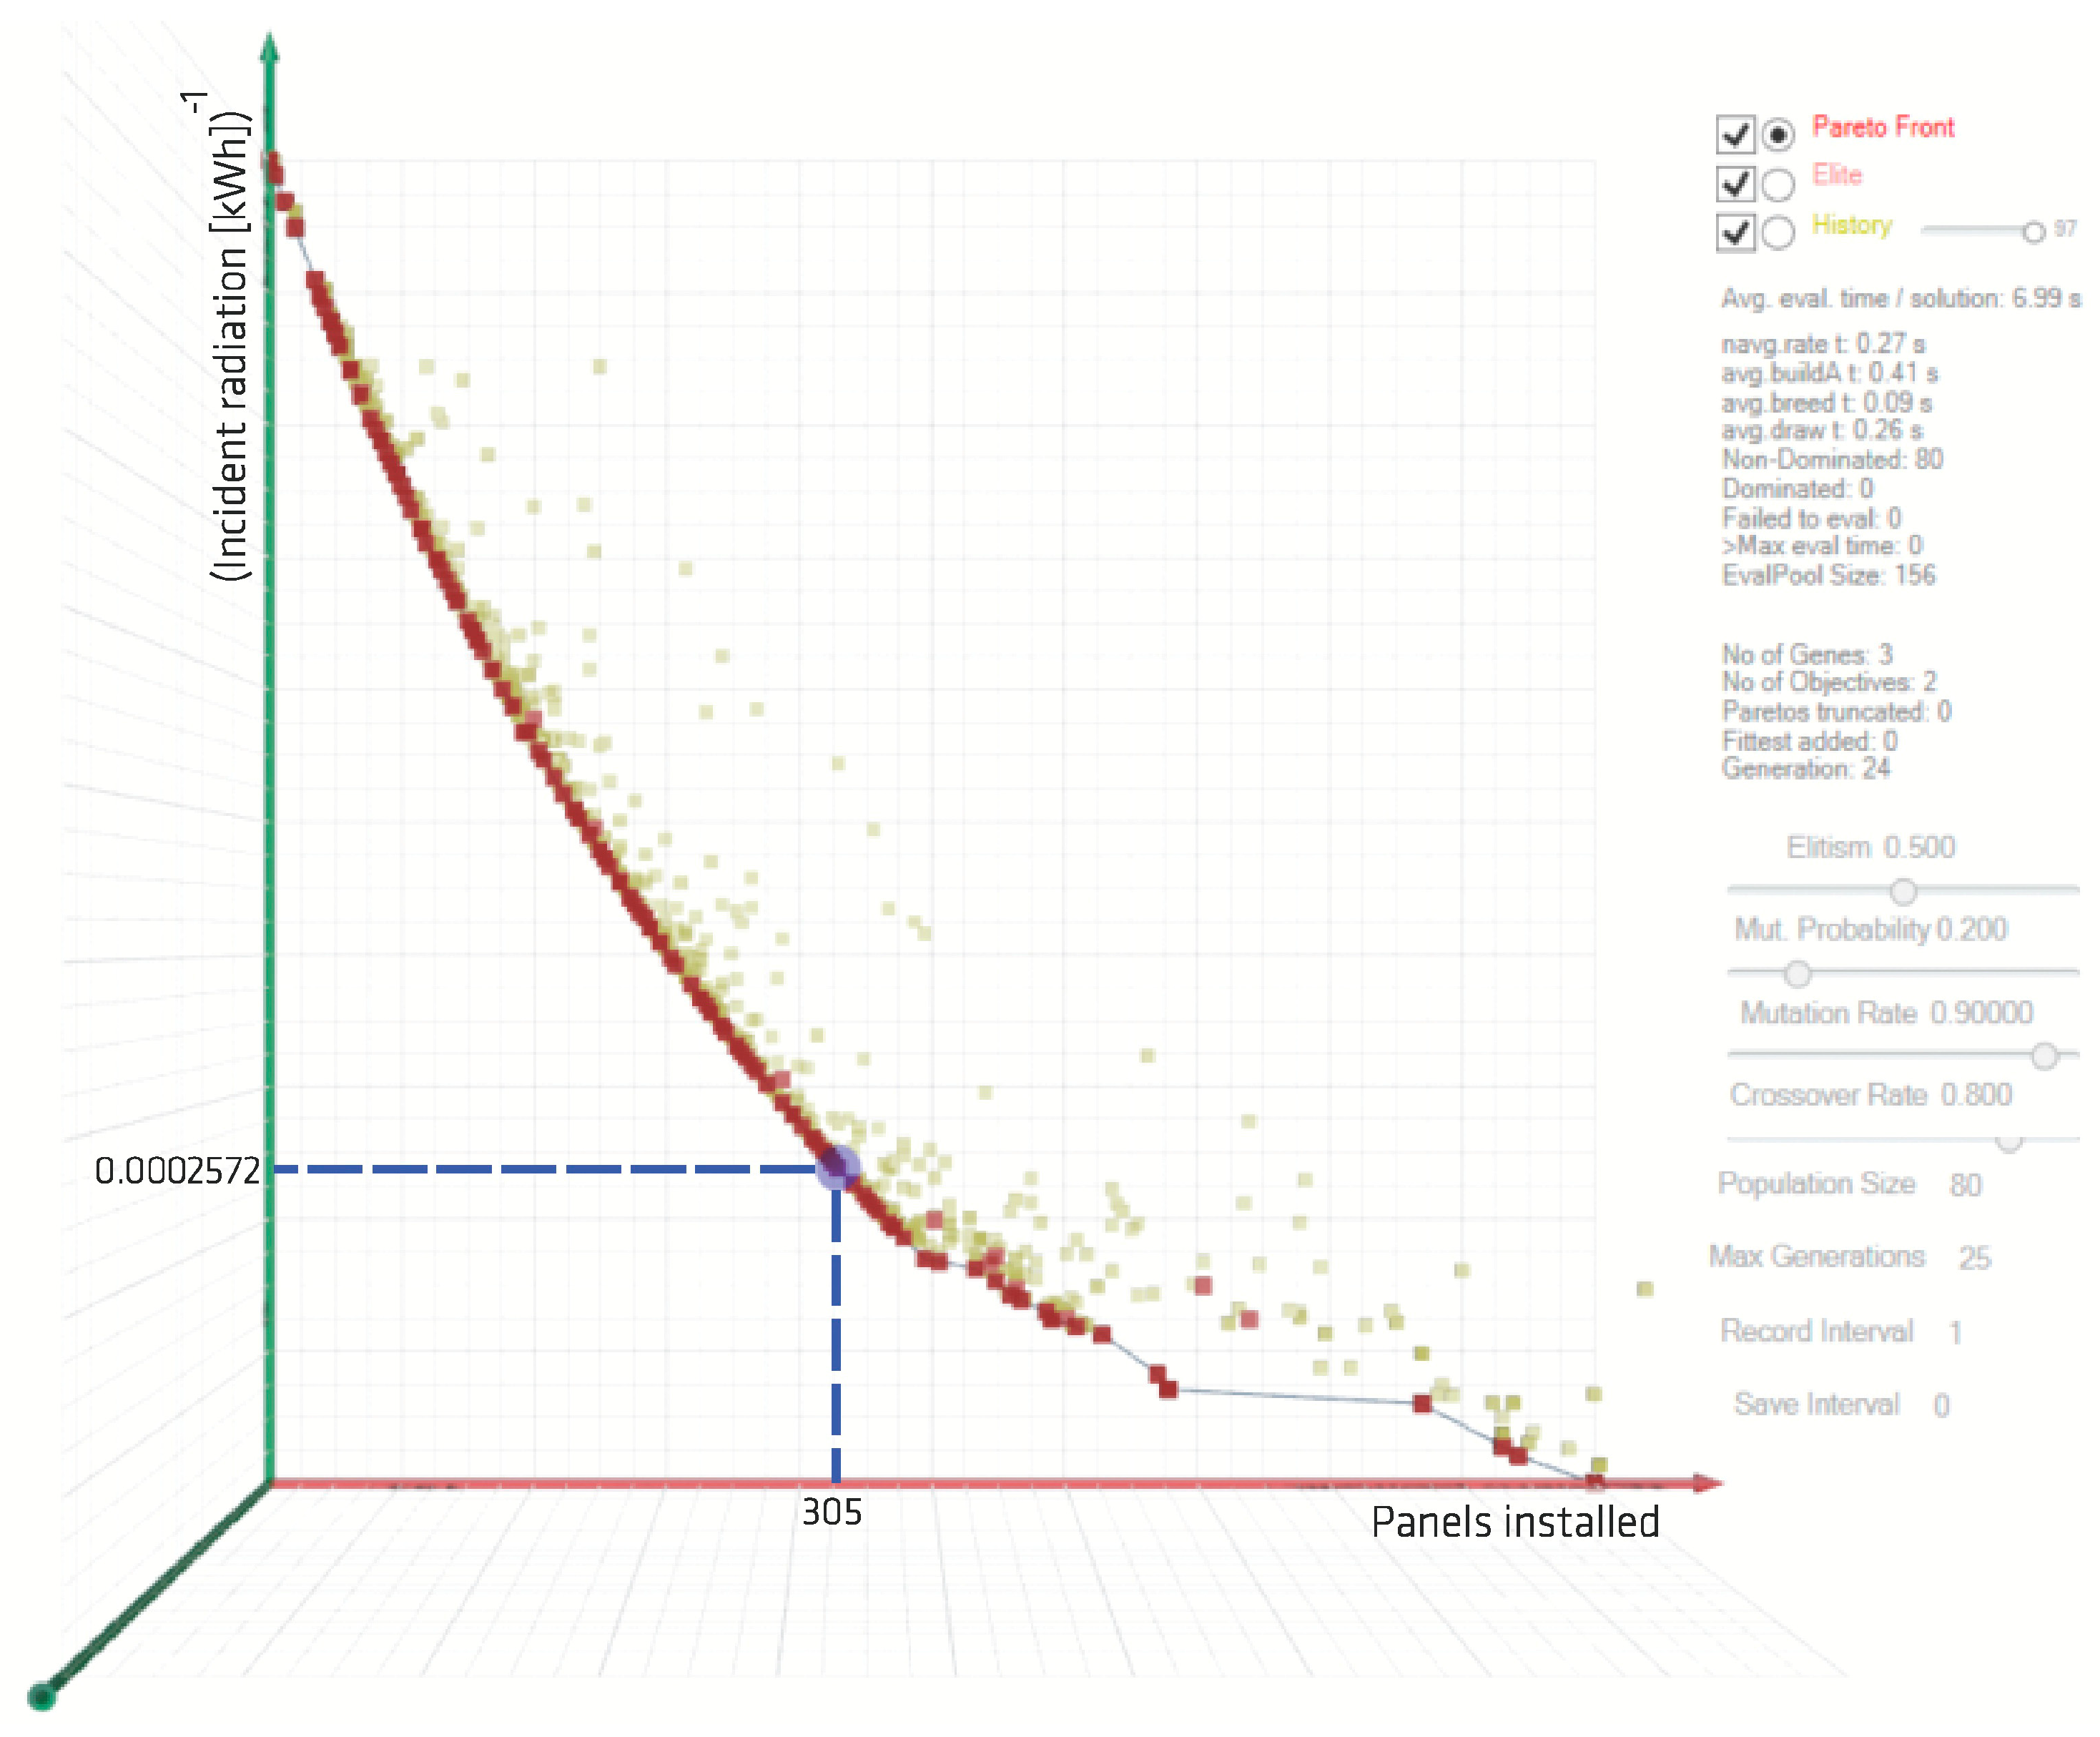
A multi-objective optimization was then performed with Octopus to assess the maximum radiation achievable with the same number of panels. The results of this process are plotted in a two-dimension graph (
Figure 8) relating the amount of PV modules and the incident radiation (kWh). Red dots are part of the so called “Pareto front” that collects all the best trade-off combinations. According to this simulation, by installing 305 panels the incident radiation is limited to 4442.305 kWh.
Considering this evidence, this latter configuration was discarded, and thus the PV distribution suggested by Galapagos for the single row configuration was adopted.
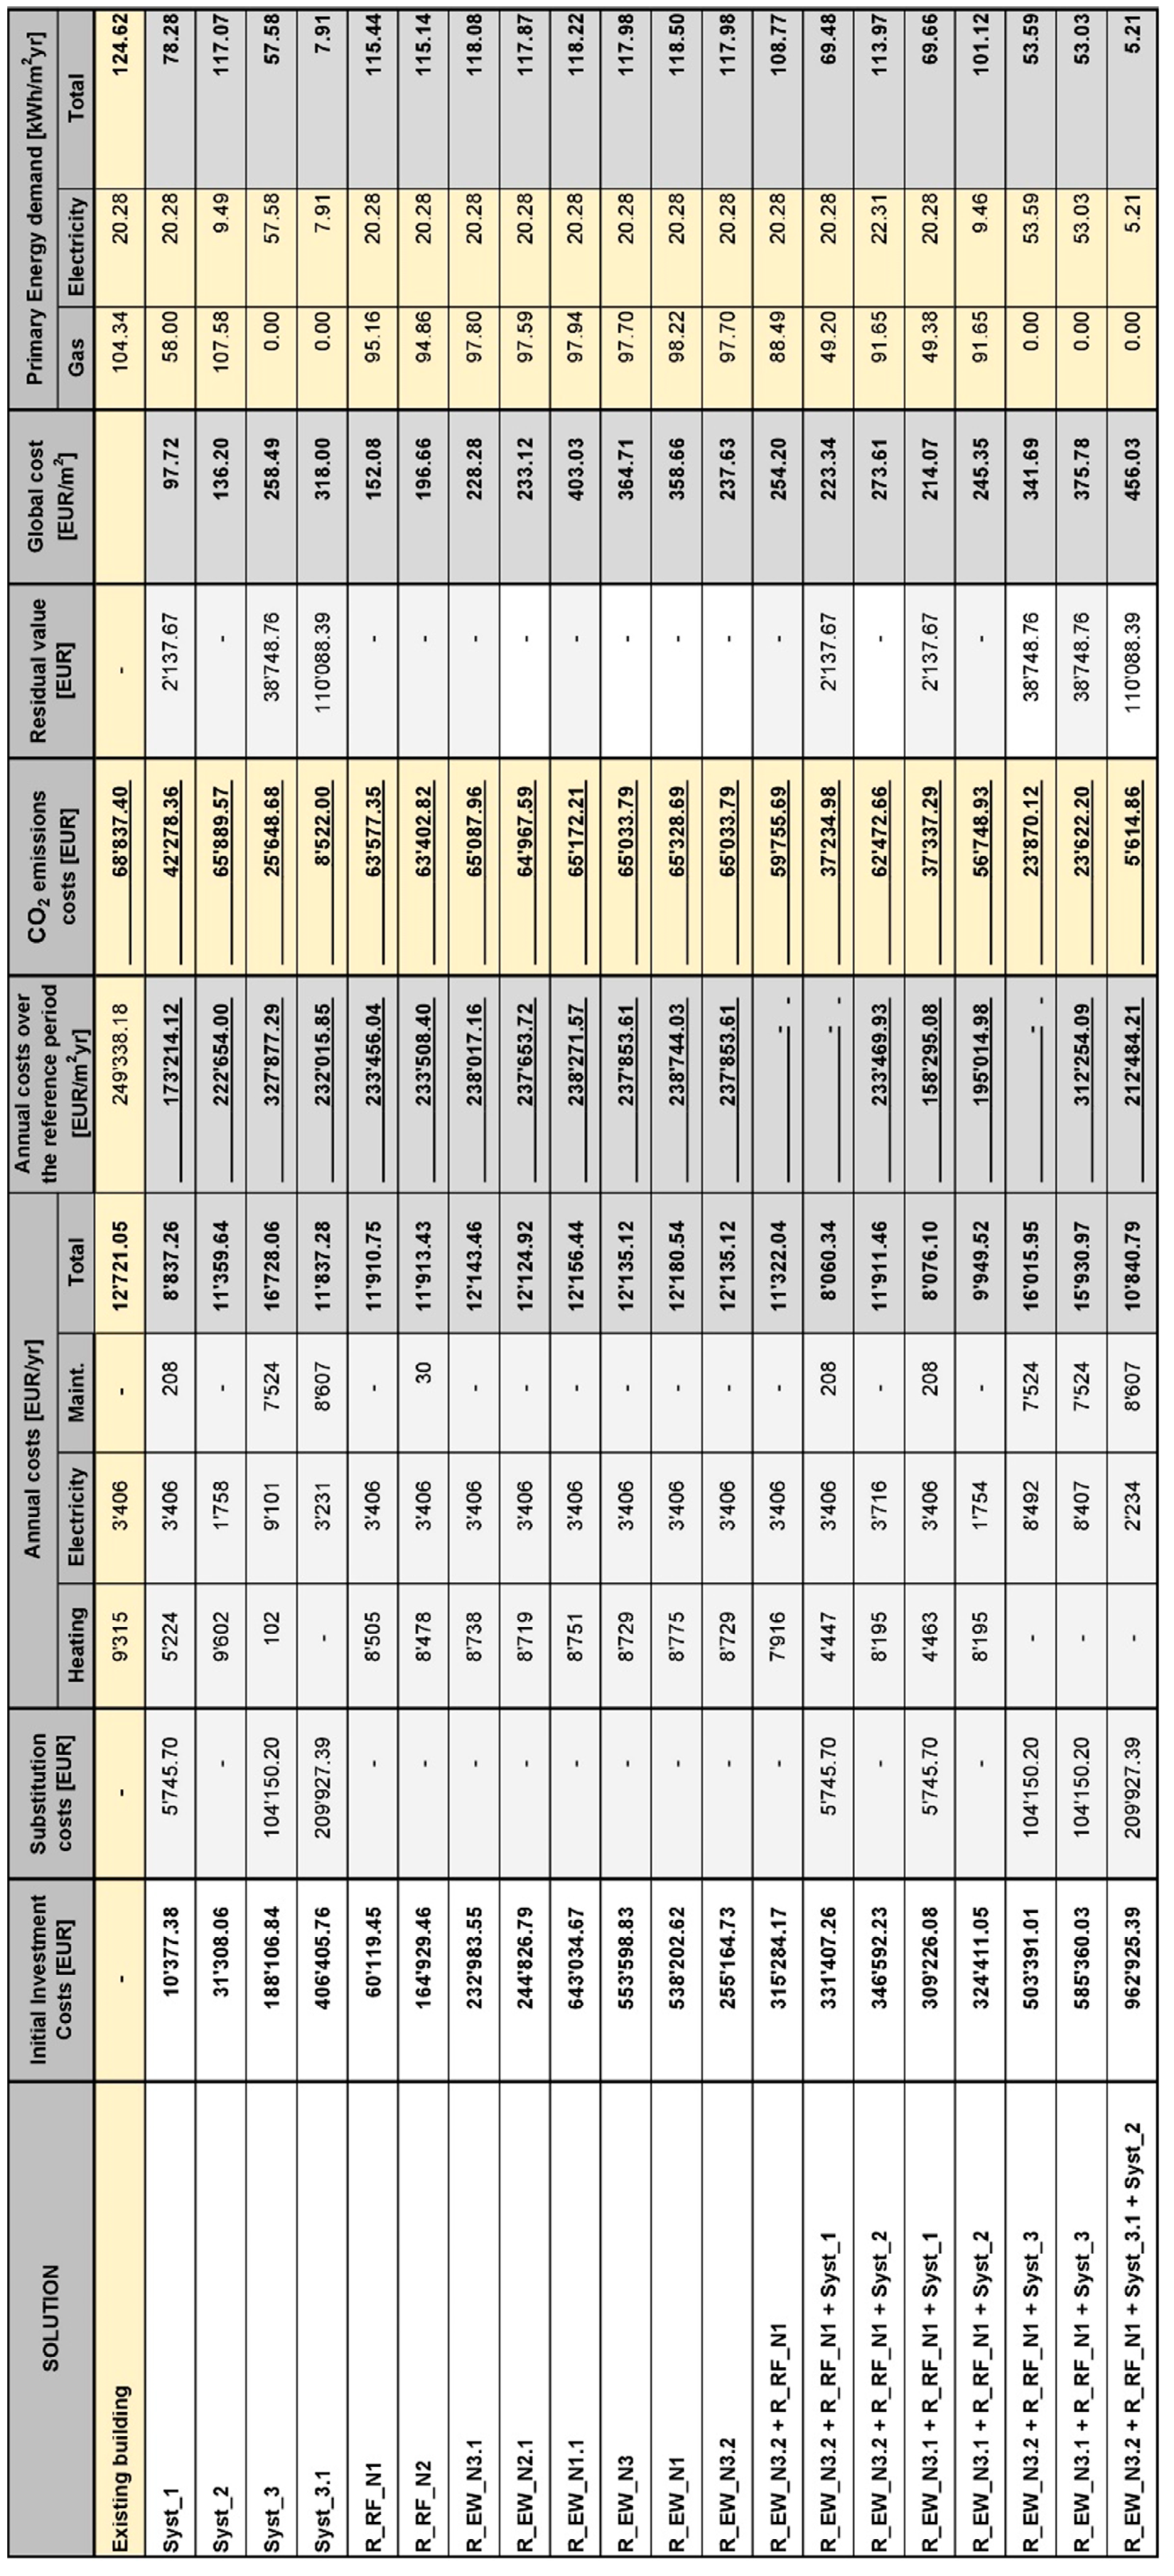
As far as the cost-optimality method concerns,
Figure 9 shows the results related to the financial scenario for the “Rodari” school with a discount factor equal to 4% considering only the single redevelopment measures (
Table 2).
Firstly, the graph highlights that all the retrofitting measures proposed for the external envelope for both external wall and roof floor are comparable in terms of primary energy demand. The optimum solution, that ensures a decrease in primary energy demand of about 7.6%, is the one with the redevelopment of the roof floor with insulation and gravel finishing (R_F_N1). Regardless, comparing this strategy with other interventions addressing the external envelope, a difference of about 3.5 kWh/m2yr is registered. With respect to the cost parameter, a more significant difference between the technological solutions suggested for external walls is highlighted: adopting a ventilated facade as external finishing leads to higher costs because of metal substructures and external cladding materials. By contrast, technological solutions implementing ETICS (using both rock wool and wood fiber insulation) involve the lowest cost ensuring the same energy performance. Regardless, the dry technological solution R_EW_N3.1, resulting in a slight decrease in primary energy demand of about 5.2% mainly related to energy needs for heating, proves to be the optimum one. Moreover, this technological solution is preferrable also because it requires lower time for construction with consequent economic savings. The difference between prices of ETICS and dry solution is related to the cost of the external plaster, more expensive than plasterboard panels. Moreover, acting on the roof components adopting solution R_F_N1 emerges as the cheapest strategy: its global cost, equal to about 150 EUR/m2, is by far the lowest especially if compared to the most expensive technological solution that is characterized by an annual cost of about 450 EUR/m2.
Focusing on interventions involving systems, the optimum solution is the substitution of the gas boiler with one characterized by a higher value of COP (Syst_1). This solution also represents the cost effective one among the single redevelopment measures for the financial scenario assuming a discount factor equal to 4%. This intervention permits to decrease the primary energy demand by 37.1% with a limited initial investment cost. Such a result requires further reflections about the cost-optimal methodology itself. The solution Syst_3.1, featuring an air-to-air heat pump coupled with a PV system to produce electrical energy, proves to be the most environmentally friendly one but, at the same time, is economically unprofitable because of the significant initial investment cost. In this case, adopting an optimized configuration of PV panels to enhance energy production, it is possible to guarantee about 76 kWh/m2yr of surplus electrical energy, avoiding 64tCO2/yr of CO2 emissions in the atmosphere. Energy in excess can be introduced in public electrical energy grids to be exploited by other buildings in the district.
Finally, it is worth noticing that primary energy demand can be decreased by 6.1% by simply renovating the existing artificial lighting system introducing LED lamps. If compared to interventions on the external envelope, this solution can ensure higher energy savings with a lower initial investment cost. Such a result is in line with the ones obtained in previous research; in that case [
27], where the substitution of the artificial lighting system was assessed as the cost-effective solution [
27].
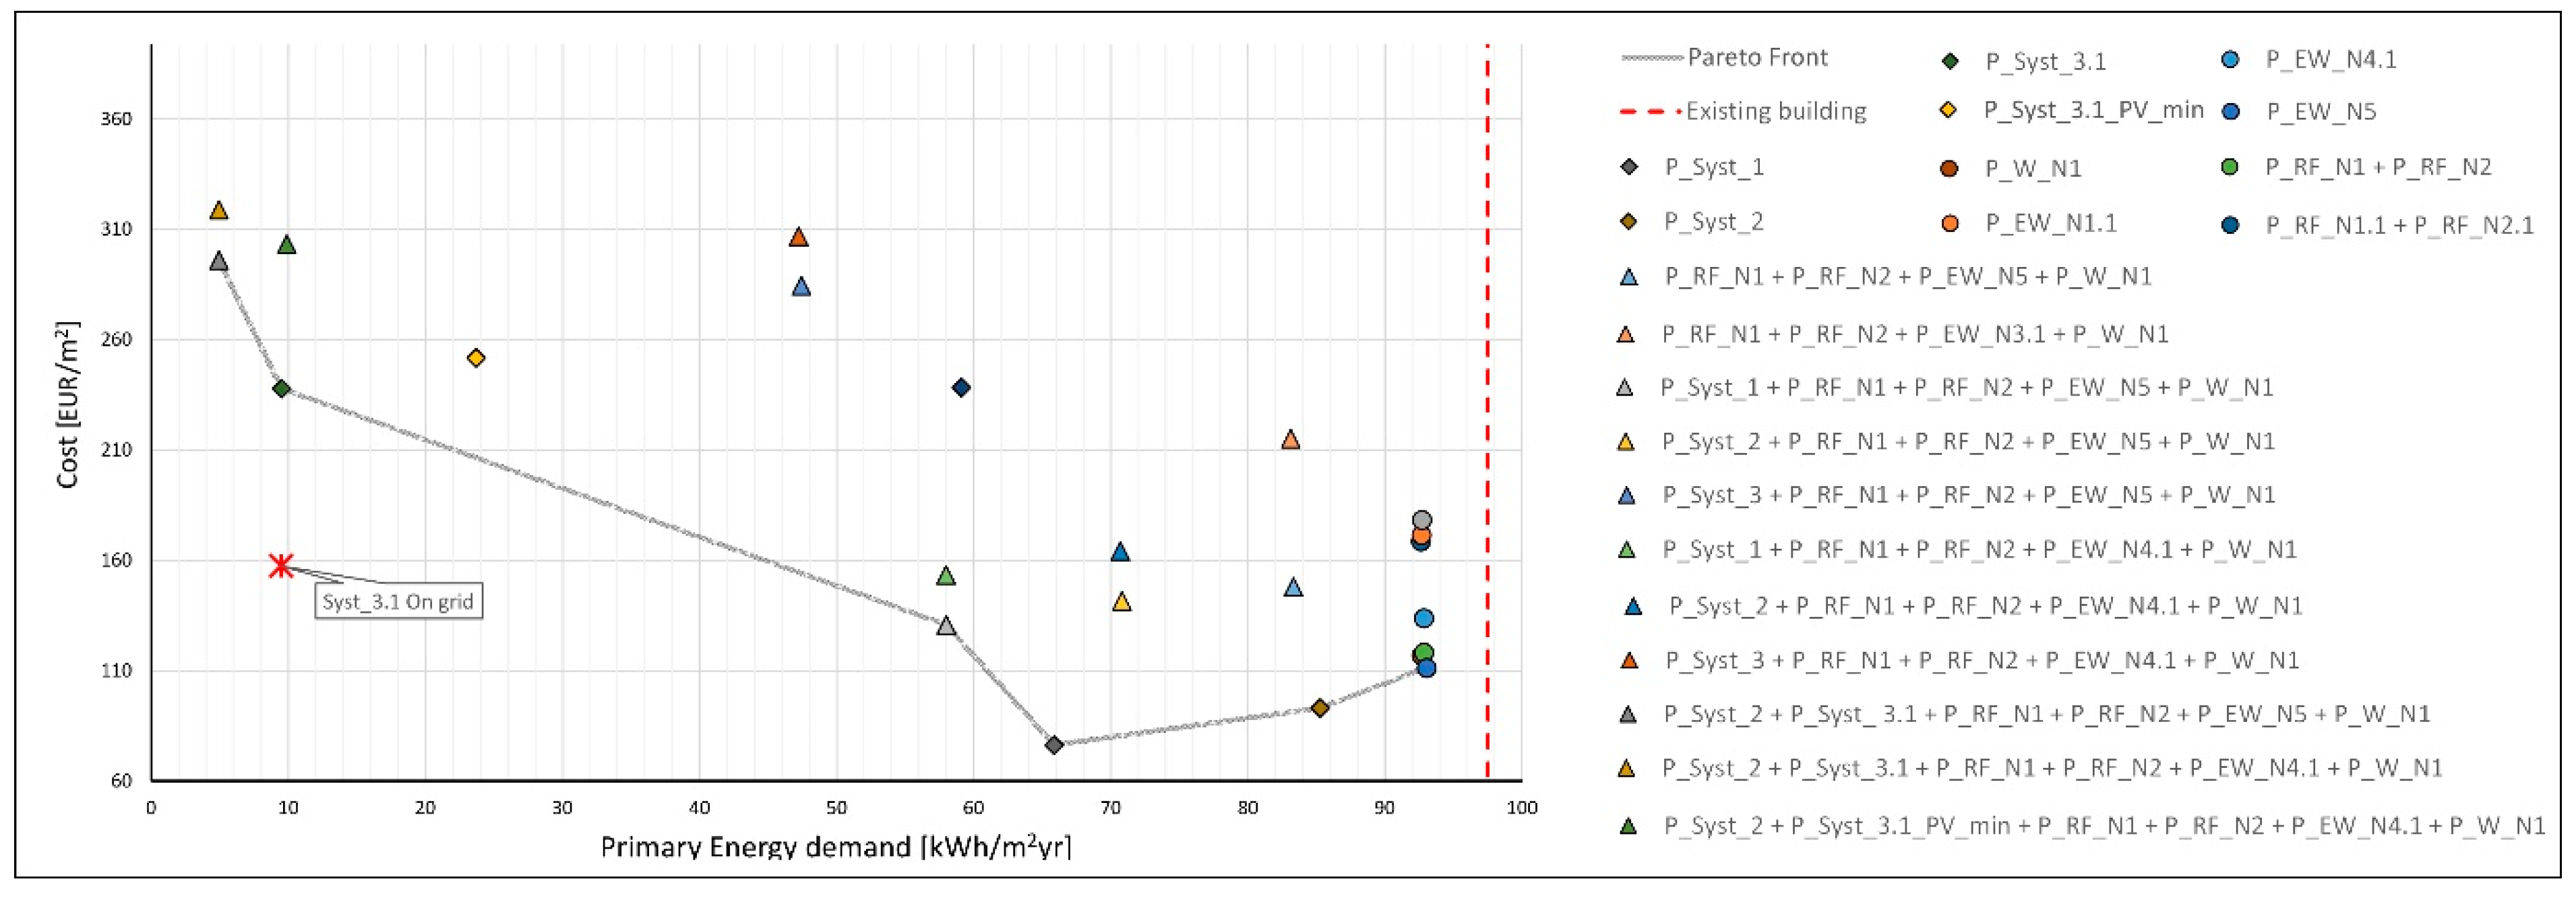
The graph in
Figure 10 illustrates the results related to the financial scenario as well but considering also several different combinations of the previous retrofitting measures (
Table 2).
Considering only the different combinations, the optimum one is the R_EW_N3.1 + R_RF_N1 + Syst_1 that includes the dry solution for the redevelopment of external walls, the retrofitting of the roof floor, and the replacement of the gas boiler. However, as clearly emerging from the graph, the solution with the simple substitution of the existing gas boiler with a new more efficient one is still the cost-effective one for the Rodari school with a cost of 89 EUR/m2. It is important to notice that also in this case this intervention (Syst_1) is preferrable in terms of cost and primary energy demand, but it does not allow to meet the nZEB or low-carbon standards.
This cost-optimality approach is useful to individuate the proper energy retrofitting compromise considering both initial investment cost and the advantages achieved in terms of energy saving. Moreover, other parameters crucial for the nZEB requirements considered in the current European policy cannot be easily included in the method. For instance, the environmental impact or the surplus energy production cannot be properly quantified or translated into real costs or advantages. However, this methodology can be surely used for all those schools that need urgent energy requalification without having significant funds available.
With respect to the European goal of a carbon-free economy by 2050, the solution R_EW_N3.2 + R_NF_N1 + Syst_3.1 + Syst_2 should be the most effective retrofitting measure for this school. In this case, the use of an air-to-air heat pump integrated with renewables allows to meet the nZEB standard and considerably reduces CO2 emissions. However, this solution is not emerging as the eligible one because of its very high initial investment cost (like a heat pump and PV system), obviously not suitable within a cost-optimal perspective.
The surplus energy production could be assessed considering the macroeconomic scenario as shown in the graph in
Figure 11, where the configuration Syst_3.1 On grid is introduced. In this case, an evaluation of the surplus electrical energy powered by the photovoltaic system on the roof was calculated also considering the hourly simultaneity of the energy production and building needs. Consequently, in the global cost formula the annual operational cost is decreased by the amount of energy fed into the grid applying a sell price of electrical energy of about 0.07 EUR/kWh. As a result, a sensible reduction of the global cost of about 30% was registered making the introduction of an air-to-air heat pump and renewables integration more cost-effective than some external envelope retrofitting measures. In
Appendix B,
Figure A5 and
Figure A6 show the summary of the results for the financial and macroeconomic scenario for a discount rate equal to 4%; for completeness,
Figure A7 and
Figure A8 synthesize the results for financial scenario with a discount rate equal to 5% and for the macroeconomic one with a discount rate equal to 3%.
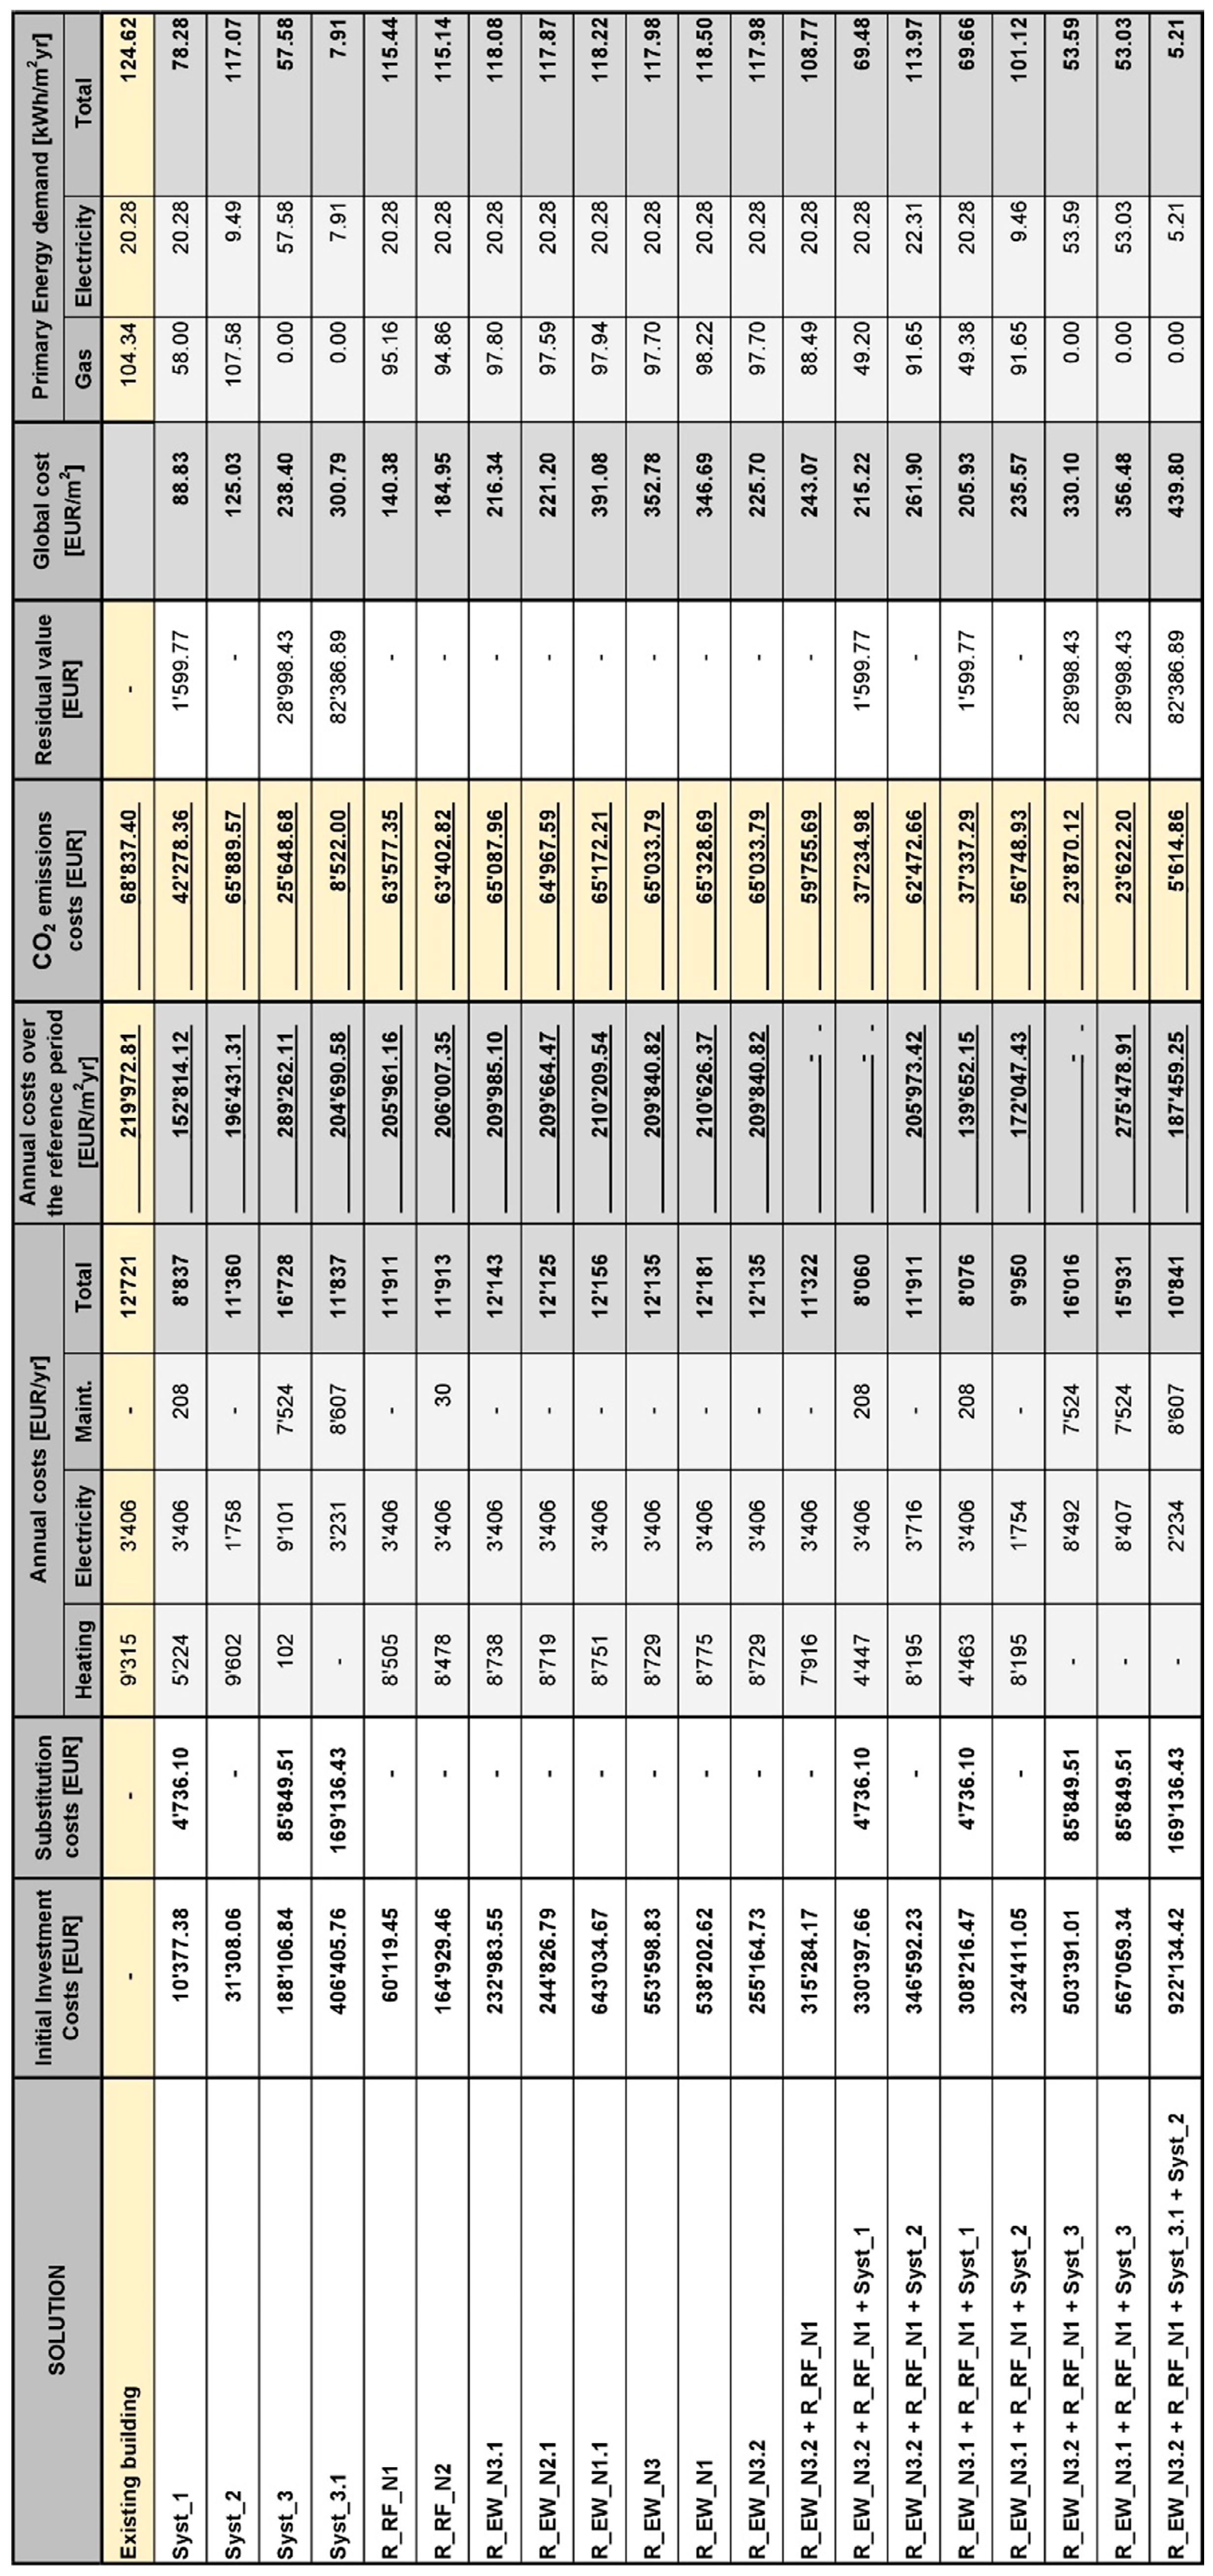
Moving on to the Poliziano school building, as it results from the graph in
Figure 12 related to the financial scenario, the cost-effective retrofitting measure is once again the configuration with the substitution of the existing gas boiler with a new and more efficient one (Syst_1). In this case, a reduction in primary energy demand by 32% with respect to the current energy performance of the school can be achieved. Additionally, for this school, the solution including a heat pump and PV system is characterized by the highest initial investment cost and so it is the less cost-effective one. This result confirms the weakness of the methodology, that does not properly consider environmental parameters and benefits. With respect to the redevelopment of the external envelope, the insufflation of the insulation materials in the existent air cavity (P_EW_N5) is the most convenient in terms of both energy performance and economic investment. While the adoption of an external insulation layer (P_EW_N4.1), comparable for energy performance and cost, requires scaffolding, this kind of measure is less invasive and could be realized during the summer closing period.
Figure 13 shows the graph illustrating the result for the financial scenario considering the several combinations as well. As for Rodari school, also in this case the configuration Syst_1 is still the cost-effective one. Regarding systems, it is worth noticing that in the case of Poliziano school another configuration with the minimum PV panels required by the Italian standard was considered (Syst_3.1_PV_min) to make a comparison with the optimized configuration that maximizes electrical energy production, such as explained before. As pointed out in the same graph (
Figure 13), comparing the retrofitting measures with a heat pump and the minimum (Syst_3.1_PV_min) and maximum (Syst_3.1) surface of PV panels, the maximization of the PV surface has to be preferred because of the reduced annual energy costs and mostly because of the very high residual value at the end of the building life. Regardless, the results slightly change when considering also the redevelopment of an artificial lighting system. The introduction of the LED system affects the value of the annual energy expense and the solution with the minimum surface of the photovoltaic system enables to save altogether about 20 EUR/m
2.
Finally,
Figure 14 shows the results obtained within a macroeconomic perspective and taking into account both the CO
2 emissions related to the surplus energy production and the economic advantages. As expected, the configuration with the minimum surface of the PV panels does not allow an extra-production of electrical energy (1 kWh/m
2yr), while recurring to the optimized modules distribution it is possible to obtain a surplus of about 128 kWh/m
2yr and a corresponding saving of 217 tCO
2/yr of emissions.
Comparing the results illustrated until now with the findings of other previous research, interesting considerations can be formulated even if only a few similar studies dealing with educational buildings can be retrieved in the literature. The lack of an adequate evaluation of environmental parameters was registered also by other authors such as Becchio et al. [
40] or Stocker et al. [
61]. In the cited works, they agree about the opportunity of a redefinition of the criteria adopted for the selection of the solution to be preferred in order to include an environmental impact quantification. According to the current framework of the methodology, acting on systems proves to be more cost-effective than developing envelope components. The same conclusion can be found in a work from Carpino et al. [
45] dealing with social housing facilities, where interventions addressing systems are highlighted as mandatory for effective retrofitting. By contrast, in the case of a school building, replacing the current lighting system with LED technology was indicated by Bonomolo et al. [
60] as the most cost-effective solution. For both the schools analyzed, only the renovation of the heating gas boiler proves to be better than the installation of LED systems from an economic point of view, thus confirming the great potential impact of this measure.
For completeness, the graph in
Figure 15 shows the monthly energy production with the optimized PV system installed on the roof, the energy needs of the school building, and the net energy balance. For all the quantities illustrated in the graph the simultaneity between energy production and needs is considered. For both January and December, the school electrical energy needs are covered for 34% and 22% by energy from public grid, respectively. In August, the PV system produces the highest quantity of surplus electrical energy. The results for the financial and macroeconomic scenario for a discount rate equal to 4% are summarized in
Figure A1 and
Figure A2 of
Appendix B, respectively; for completeness,
Figure A3 and
Figure A4 illustrate the findings for the financial scenario with a discount rate equal to 5% and for the macroeconomic one with a discount rate equal to 3%.
Furthermore,
Figure 16 shows the hourly energy demand of the building compared to the energy produced by the PV system over a representative week in March. The graph stresses that at the beginning of the day, when the heating setpoint temperature must be reached, PV panels alone cannot satisfy the energy needs.
5. Conclusions
In conclusion, with regard to the optimization of PV modules distribution, the configuration with orientation 4° with respect the building’s axis north–south, row distance equal to 0.70 m, and tilt angle equal to 42° emerges as the one that maximizes the incident solar radiation and therefore the electrical energy production. In the paper, several optimization strategies for PV panels configuration were analyzed to validate the different results obtained. The choice of the method for the optimization depends on the final goal of the analysis itself. For instance, the multi-objectives optimization allows more comprehensive considerations because it affects and involves a wider range of design parameters. While the optimization procedures rely on generation and evaluation of the alternatives carried out autonomously by computer, the Design Optioneering method assigns to the machine only the first operation, since it does not require in advance the definition of any fitness function. By this way, the designer can have a greater control on the results and the selection of the preferred solutions to be used. In this case, to exclude ineligible configurations, filters can be also applied to the input variables, whose range of variability must be by contrast necessarily defined in the initial phase of optimization procedures. The used tools allow to perform reliable, accurate, and less time-consuming simulations directly in the BIM environment without recurring to external simulation software.
As far as cost-optimal analysis concerns, the results illustrated in the paper show that the substitution of the existing condensing boiler with a more efficient one (Syst_1) is the cost-effective solution for both analyzed schools. Therefore, in this case as well, according to literature, it is more convenient to intervene on the existing system rather than on the external envelope, even if the latter does not meet the Italian minimum energy requirements. It is worth noticing that the applied cost-optimality method is not the most proper and precise methodology to evaluate also environmentally friendly retrofitting solutions including for instance active strategies to produce electrical energy. In fact, the configuration with the use of an air-to-air heat pump and PV panels installed on the roof it is not the cost-effective one even if it allows to produce a surplus of electrical energy completely preventing CO2 emissions. Indeed, the cost-optimal methodology is a cost-oriented method and so all the proposed retrofitting solutions affected by high initial investment costs are penalized. In the European context of reaching a carbon-free economy by 2050, this method should be updated to take adequately into account also environmental parameters and the surplus energy production. This because it is impossible to meet the European goals without considering the redevelopment of the existing heritage and the use of active integrated strategies to produce energy. Moreover, this method is still appropriate to enhance low-cost retrofitting measures to be applied on buildings that need an urgent energy requalification. This work could be developed in the future proposing the improvement of the cost-optimal methodology applied to schools with some indicators about the environmental impact. By this way, the actual weaknesses of the method could be overcome leading to a more comprehensive evaluation and avoiding the excessive penalization of all those measures that can ensure a better environmental performance but require a higher initial investment cost. For instance, future redevelopment measures to be considered in the cost-optimal analysis for schools could be different kinds of renewables and batteries for electrical energy storage.


