1. Introduction
Over the past two decades, the flow of fluid in small gaps has been extensively studied to obtain high efficiency for the cooling of electronic devices. The undoubted advantage of such technical solutions is the high heat transfer intensity and the possibility of significantly reducing the dimensions of heat exchangers. A reduction of energy consumption in the implementation of various technological processes and supplies is urgently needed. Additional benefits of using compact heat exchangers in systems of micro-or minigaps include the low weight of devices and low consumption of materials for their production as a result of miniaturization. Mini-gap heat exchangers have a wide range of practical applications in the automotive and nuclear industry, chemical engineering, bioengineering, and renewable heat sources. Recently, microchannels have been widely used in automotive air conditioning systems, fuel cells, and microelectronics.
The miniaturization of electronic systems is progressing rapidly. The reliability of these systems depends mainly on the temperature of the electronic elements. Therefore, proper temperature management becomes a key issue when the heat flux increases whereas the electronic component size decreases. In systems operating with large heat fluxes, such as in the electronics industry, heat transfer due to forced convection is highly efficient.
In the early 1980s, the problem of achieving compact and high-performance forced liquid cooling of planar integrated circuits was posed [
1]. A new, very compact, water-cooled integral heat sink for silicon integrated circuits was proposed and tested. It was stated that, by allowing high power densities, the heat sink may greatly enhance the feasibility of ultra-high-speed VLSI circuits.
Lazarek and Black [
2] focused on flow boiling heat transfer in circular mini-channels. The local heat transfer coefficient, pressure drop, and critical heat flux were measured for saturated boiling of R-113 in a mini-channel of 0.31 cm diameter and heated lengths of 12.3 and 24.6 cm. The research was performed for vertical, co-current upflow, and downflow configurations of the test section. The heat transfer correlation for the local heat transfer coefficient, which expresses the Nusselt number as a function of the liquid Reynolds number and boiling number proposed by the authors, has been widely used up to now.
Bowers and Mudawar [
3] tested a mini-channel heat sink (diameter 2.54 mm) and a micro-channel heat sink (diameter 510 μm) with a heated surface for their high heat flux performance with flow boiling of R-113. A pressure drop model was also developed. The authors focused on analyzing thermal conduction within the heat sink to determine the optimum channel geometry based on the dimensionless cell width and heat sink thickness. The authors stated that mini- and micro-channel heat sinks are capable of achieving heat fluxes in excess of 200 W/cm
2 with both low flow rates and low pressure drops. Key findings included an indication of dimensionless heat sink thickness (thickness of heat sink per channel diameter) with values of approximately 1.2 as a good compromise between maintaining low thermal resistance and providing adequate structural strength.
Investigations on the transfer of boiling heat transfer during flow in mini-channels of a rectangular cross-section and various dimensions, oriented horizontally and heated uniformly, were described by Peng et al., for example, in [
4]. In this work, the forced flow convection of water through rectangular micro-channels (hydraulic diameters of 0.133–0.367 mm) was experimentally investigated. The authors indicated that a laminar heat transfer regime occurred at a Reynolds number of 200–700, and fully turbulent connective heat transfer was reached at Reynolds numbers in the range of 400–1500. It was noticed that the transition Reynolds number diminished with the diminishing of the micro-channel diameter. The geometric parameters of the micro-channels were found to be important variables that could significantly affect the flow characteristics and heat transfer. The authors specified that the laminar connective heat transfer reached a maximum value when the aspect ratio (channel height per its width) was approximately 0.75, and turbulent heat transfer was optimal when the aspect ratio was in the range of 0.5–0.75.
Bao et al. [
5] presented the results of research on boiling heat transfer during the R-11 and HCFC123 flow along the uniformly heated circular mini-channel, which was horizontally oriented. It was found that the heat transfer coefficients are independent of the mass flux and vapor quality, but they are strong functions of the heat flux and system pressure in the saturated boiling region. The authors stated that the heat transfer is mainly dependent on nucleate boiling as the dominant mechanism over a wide range of flow conditions, whereas convective effects are less important (because of the relatively low Reynolds numbers and liquid conductivity). The experimental data were compared with some existing correlations. Furthermore, none of the correlations examined predicted the experimental data over the whole range examined, but most of them identified the dominance of nucleate boiling.
Kandlikar in [
6] presented fundamental questions related to the presence of nucleate boiling and the characteristics of flow boiling in micro- and mini-channels compared to conventional channels. Classification of channels due to their hydraulic diameter was performed. Moreover, the mechanisms of heat transfer, the flow patterns, and other phenomena accompanying the flow of fluids in confined spaces including the effect of configuration of heat exchanger on the heat transfer and pressure drop performance were discussed. According to the author, heat transfer studies in micro-channels indicate that, as a first-order estimate, heat transfer and pressure drop prediction schemes may be predicted using the correlations developed for large diameter tubes. Furthermore, it was underlined that the heat transfer rate in multichannel evaporators is different from that in single-channel evaporators under the same set of operating conditions. In the design of evaporators with small diameter channels, the length-to-diameter ratio depends on the characteristics of the heat transfer and pressure drop. Larger pressure drops are generally accepted in evaporators with small diameter channels.
Over the next years, researchers became interested in convective heat transfer during flow in mini-gaps, including the liquid change of the phase to the intensity of heat transfer as in [
7,
8]. The previous results of the authors and selected state-of-the-art covered works focused on heat transfer during flow in mini-channels of rectangular cross-sections were presented in numerous publications. The results of flow boiling heat transfer time-dependent research were described in [
9]. Steady-state experiments were the basis of heat transfer analyses discussed in [
10,
11]. The results of numerical calculations performed with the use of ADINA software were shown in [
12,
13]. Flow boiling heat transfer experiments with the use of an annular mini-gap was described in [
14]
For the analysis of experimental data, analytical methods were often used, the solutions of which had to be simplified in the solution of mathematical heat and flow models. At present, commercial computational programs are used to perform mathematically advanced numerical procedures in order to perform either simulations or computations using experimental data. Today, the Finite Element Method (FEM) and the Finite Volume Method (FVM) are commonly used for the study of heat transfer processes in compact heat exchangers of various constructions. Numerical investigations cover computational fluid dynamics needed for fluid flow.
Numerical analyses of specific design solutions of devices with mini- or micro-channels and compact heat exchangers were the subject of an increasing number of works in the literature.
Zhou et al. in [
15] proposed modeling of boiling flow in microchannels for nucleation characteristics and performance optimization. The interface separating the two-fluid phases was tracked by the LSM, which was used to calculate multiphase flow problems. The Level Set Two-Phase Flow Model was used to simulate the nucleate boiling of water in microchannels as a model for computing multiphase flow problems with the help of the COMSOL solver. Comparisons of the performance of the enhanced and plain-wall microchannels were also performed and discussed. The objective of [
16] was to numerically study the dynamical behavior of the bubble with a smaller growth rate and its influence on the fluid flow and heat transfer in the microchannel. An improved hybrid-lattice Boltzmann model was used in the computations as a tool to simulate the flow behavior and heat transfer performance in microchannels. The authors performed case studies using the developed LB model. A two-dimensional microchannel (0.2 mm x 5.3 mm) was considered. The numerical results obtained concern bubble dynamics, such as the influence of bubble growth and departure on flow disturbance.
The objective of the investigation described in [
17] was to develop a numerical model to analyze the boiling of subcooled flow in segmented finned microchannels. Simulations were performed for a single row of segmented finned microchannels with boundary conditions similar to experimental conditions. The predicted numerical results were compared with our own experimental results. Temperature and pressure fluctuations during the subcooled flow boiling condition were investigated. The predicted flow patterns were similar to the experimental results. Simulations were performed using the ANSYS Fluent code and the volume of fluid (VOF) method was used to model the two phases in nucleate flow boiling.
Ameur in [
18] investigated the impact of corrugated baffles inserted in a rectangular channel heat exchanger on the flow and thermal distribution of fluid. The shear thinning behavior of the working fluid was assumed. With the aim of the computer tool ICEM CFD, the geometry of the problem was studied and the computer code CFX was used in computations. The SIMPLE algorithm was used to perform pressure–velocity coupling. Several cases of the corrugated baffle configuration were studied. One of them was indicated as the best.
Lee et al. in [
19] provided the results of numerical simulations of bubble growth and heat transfer associated with flow boiling in a finned microchannel. Phase interfaces were determined by a sharp-interface level set method that was modified to include the effect of phase change at the liquid–vapor interface and to treat the non-slip and contact angle conditions on the immersed solid surface of fins. The effects of the fin height, spacing, and length on the flow boiling in a microchannel were investigated. The computational results showed that the flow boiling in a microchannel was significantly enhanced when the liquid–vapor–solid interface contact region increased with the addition of fins.
Zhuan and Wang in [
20] performed simulations of boiling flows of R-134a and R-22 in a circular micro-channel. The vapor–liquid interface was captured using the VOF method. Based on bubble lifting, growth, and coalescence behavior, the flow pattern transition related to bubble evolution in the microchannel was determined. The flow patterns at the micro-channel outlet predicted by simulation were in agreement with the flow structures observed in experiments. The peak bubble frequency at the outlet and the general shape of the bubble frequency distribution at the outlet from the simulation were found to be consistent with the experimental results.
Anandan and Ramalingam in [
21] presented a literature review focused on high heat flux cooling of electronic equipment and devices. Cooling methods were categorized as: air cooling, liquid cooling, heat pipes, refrigeration cooling, thermoelectric cooling, and phase change material-based cooling. Furthermore, each of the methods was characterized. The main issue pointed out was thermal management of electronics and development of new effective cooling schemes using advanced materials and manufacturing methods, with a special focus on (micro) electronic equipment.
This study aimed to perform a numerical analysis of fluid flow and heat transfer in a mini-channel heat exchanger. A novelty of this work was the development of a numerical model for analyzing subcooled flow boiling in parallel mini-channels and performing numerical calculations using commercial software by Simens-Simcenter STAR-CCM+ software. Experimental data describing the heat transfer during flow boiling in mini-channels of various spatial orientation of the flow under different operating conditions are needed to validate the results from numerical calculations. Simulations can give us information on how to construct mini heat exchangers and select thermal and flow parameters for their work to obtain high thermal efficiency.
3. Numerical Calculations
Numerical calculations were performed using Simcenter STAR-CCM+ software version 2020.2.1 Build 15.04.010 installed on a PC computer (main PC characteristics: Intel Core i9 CPU processor (24 cores), 3.50 GHz of clock speed, and 256 GB of RAM). Details on the calculation methodology within this numerical environment can be found in [
24]. It is assumed that heat and flow transfer problems should be solved due to suitable equations with the assumption of proper boundary conditions. The governing equations for the fluid cover continuity equation, momentum equation, and energy equation as follows:
where:
t—time,
V—volume,
a—the area vector,
ρ—the density,
v—the velocity,
Su—a user-specified source term;
where:
p—pressure,
T—the viscous stress tensor,
—the resultant of body forces,
—a user-specified source term,
I—identity tensor;
where:
E—the total energy,
H—the total enthalpy,
q—the heat flux.
The following assumptions were made:
The fluid temperature at the inlet of the mini-channel and the overpressure pressure at the outlet were taken into account under the boundary conditions;
The fluid flow in the mini-channel was incompressible with a constant mass flow rate;
The independence of the properties of the materials in temperature was assumed despite the Haynes-230 alloy;
Heat losses from the test section to the ambient air were assumed.
The convergence took about 26,000 iterations and 40–48 h of CPU time.
The main experimental parameters taken into account in the numerical computation are listed in
Table 1 as series No. #4.
In
Table 3, the main physical properties of the materials used in the calculations are specified: for the fluid region and each element of the solid region, respectively. In addition, the physical properties of HFE-7100 (as the working fluid) and copper (as the heater material) were used only for numerical simulations.
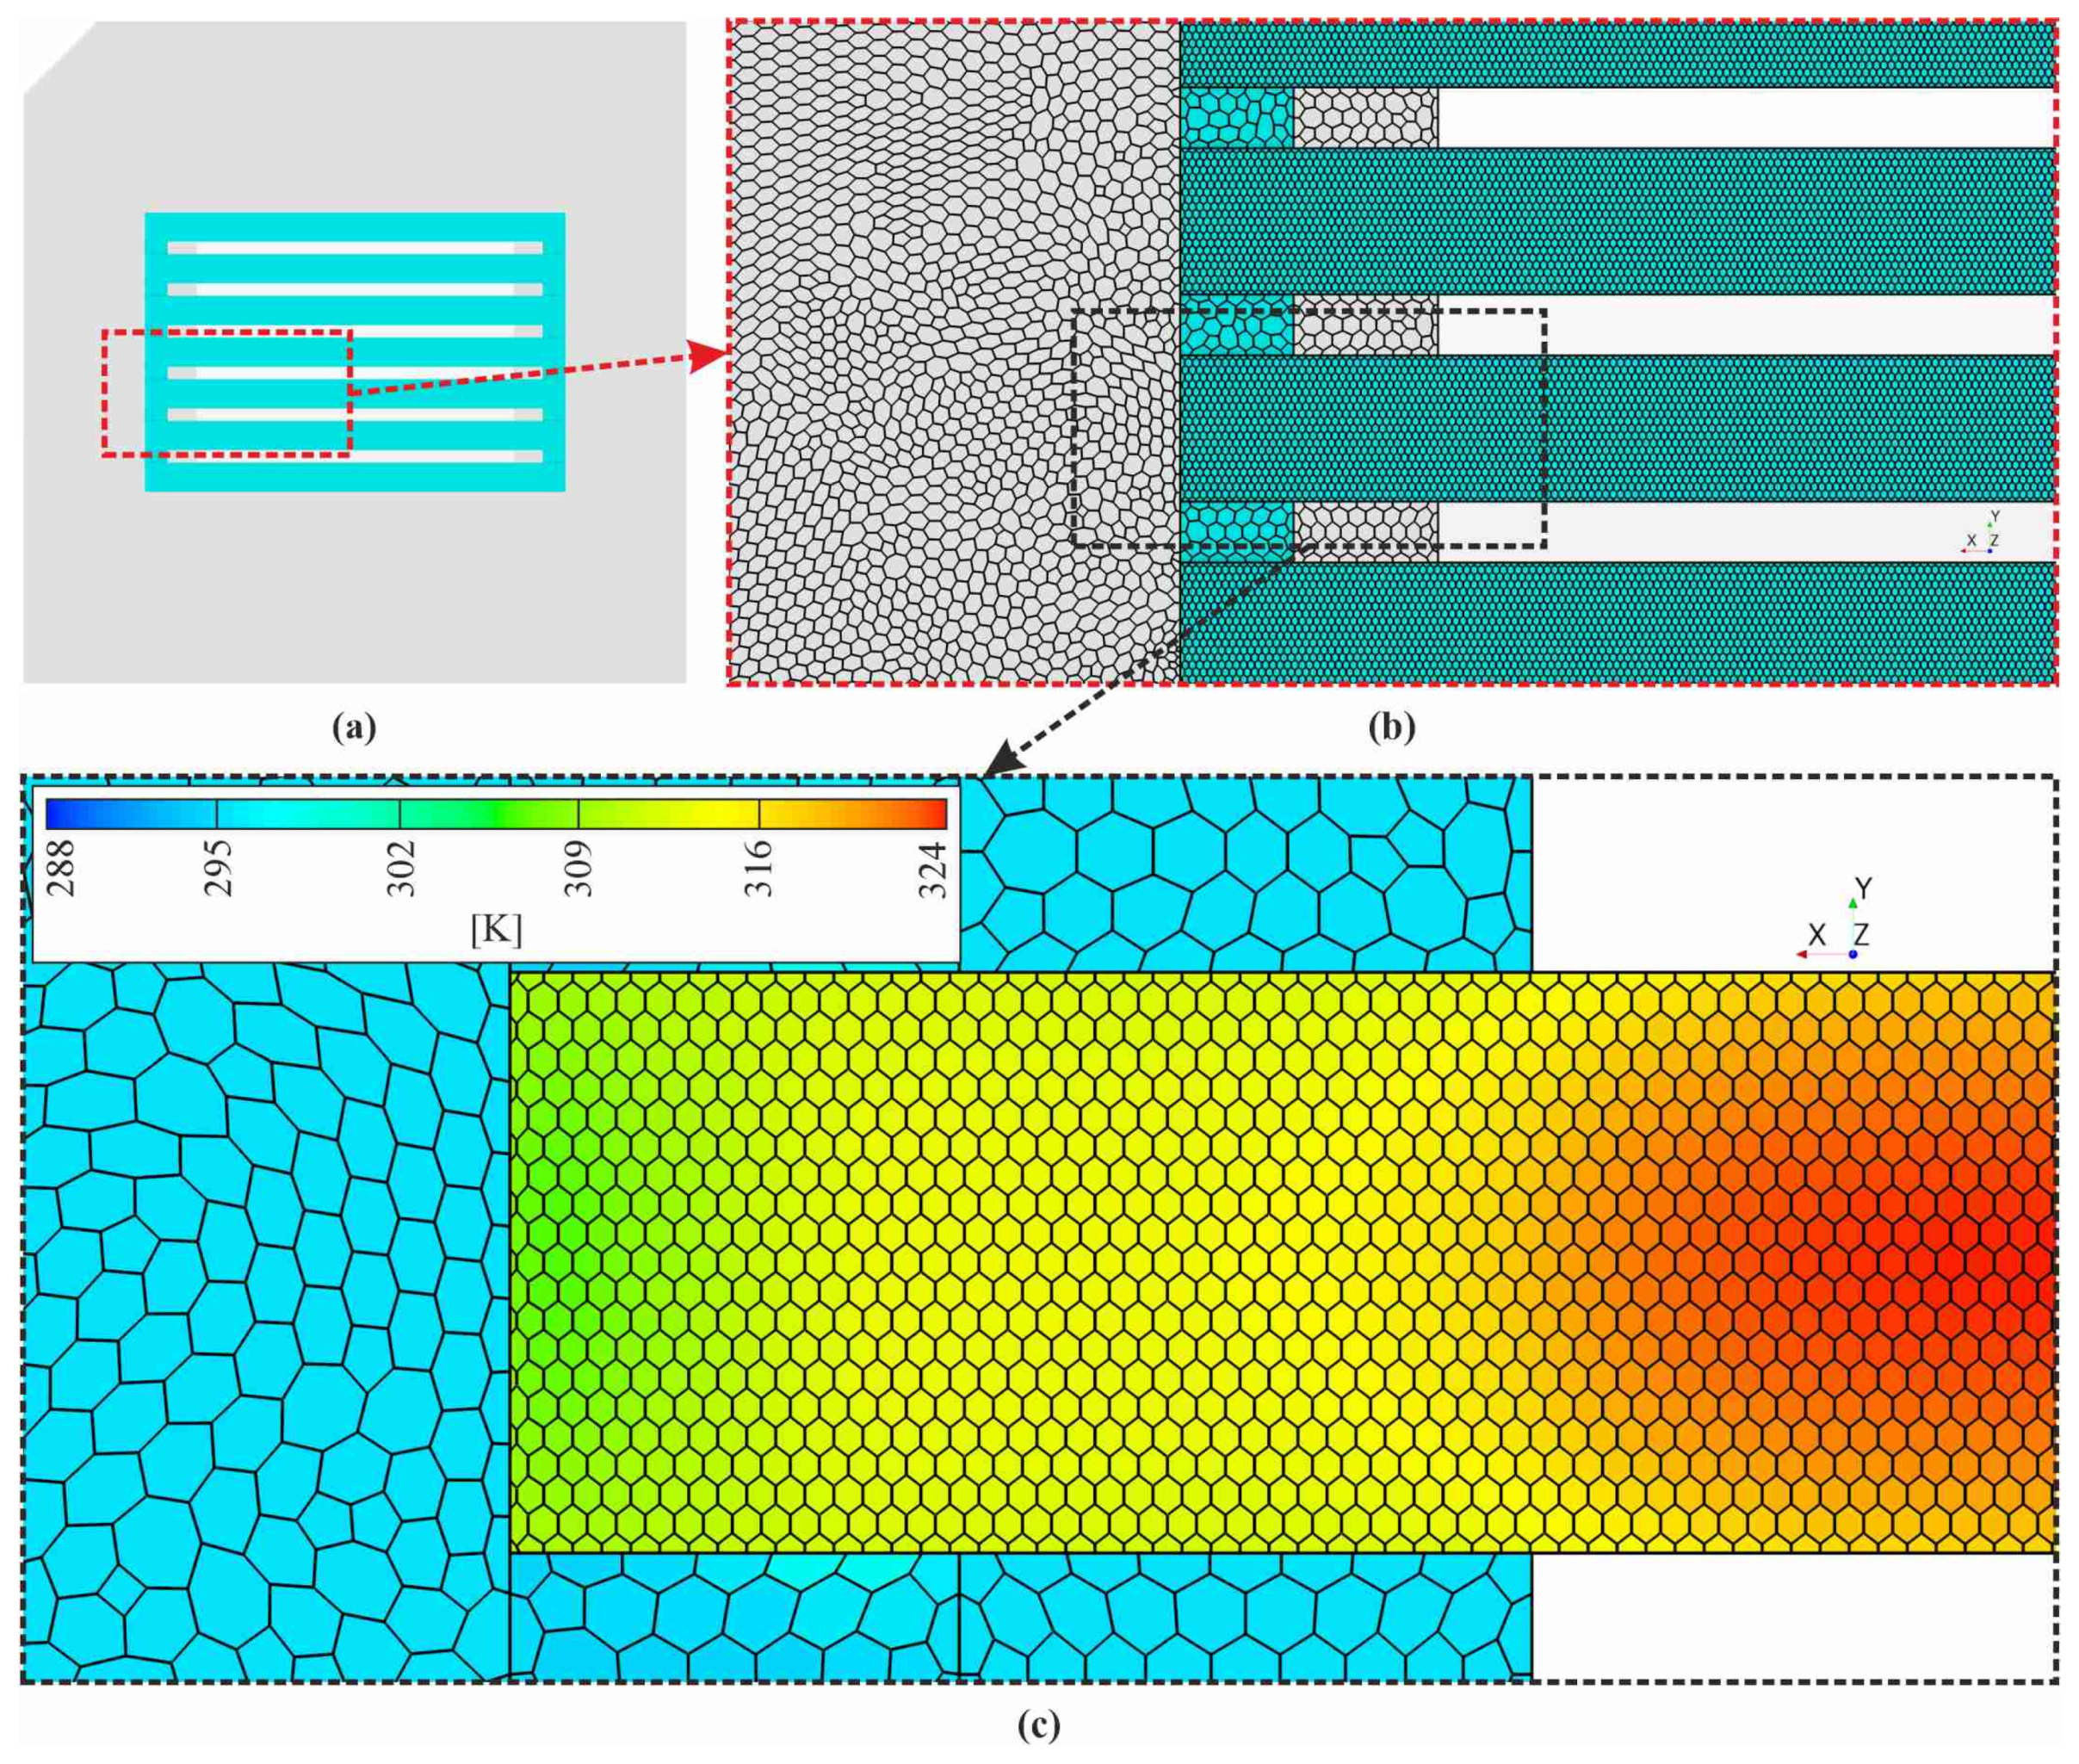
Figure 5 illustrates 2D views of the channel body and the working fluid in the test section (as the solid and fluid regions assumed in the simulations). The typical meshes that were assumed in the numerical calculations are shown, while some details are enlarged.
The fundamental strategy for computer simulations and verification of numerical analysis is the identification and quantification of errors in the computational solution. The most important activity in verification testing is systematically refining the grid size and time step [
25]. Therefore, the mesh refinement study was performed as part of the verification procedure.
To ensure the convergence stability of the numerical computations, a mesh dependency analysis based on the grid convergence index (
GCI) was performed. This method is recommended by the Fluids Engineering Division of the American Society of Mechanical Engineers (ASME) [
26,
27]. The
GCI was originally proposed by Roache in 1994 and is based on the Richardson extrapolation idea. Mesh dependency studies based on
GCI were carried out to estimate the numerical accuracy resulting from mesh resolution. To define the accuracy discretization error, the model was meshed with three grids with different sizes to obtain a range of 3–15 million cells. The
GCI was calculated according to the procedure described in [
26].
Firstly, in the CFD model, three base grid sizes of different resolutions (1, 2, and 3 mm) were selected. To define the representative cell size (
h), the following dependence was used:
where: Δ
Vi—volume of the
i-th cell,
N—total number of cells in the CFD model.
The smallest mean representative cell size from the calculation was h1 = 1.49 × 10⁻⁴ (for 15,110,063 cells in the grid) and the largest cell size was equal to h3 = 2.46 × 10⁻⁴ (for 3,338,533 cells in the grid).
The grid refinement factor
r defines that the selected meshes are sufficiently different. This factor was determined as follows:
where
hfine represents the finer mesh. If
h1 <
h2 <
h3, the following dependences were proposed to define grid refinement factors:
The order of convergence
p was determined from the following dependence:
where:
while ∅ denotes the value of the crucial variable for the specific numerical simulation of the solution obtained for each base grid size.
In further calculations, the highest temperature of the outer heated foil surface (∅1, ∅2 and ∅3) was chosen as the crucial variable.
The approximate relative error was estimated as follows:
Calculations of were performed in analogy.
The
GCI is defined by the following equation:
where
Fs is a safety factor. For three or more meshes in CFD simulations, the recommended value is equal to 1.25 and represents 95% confidence in the calculated error bound [
26,
27,
28]. Finally, the determined values of the
GCIs are listed in
Table 4.
Following the GCI calculation procedure, after selection of three base grid sizes of different resolutions to verify the results from numerical computations, it was found that the fine and coarse GCI were 0.23% and 0.94%, respectively. The reduction between coarse and fine GCI values showed the most reliable results. The base grid size of 1 mm is indicated as the preferred size for simulations.
5. Numerical Simulations
Numerical simulations included calculations with the following variable parameters of the experiment: working fluid (FC-72 or HFE-7100), heater material (Haynes-230, copper and aluminum), changeable spatial orientation of the test section (horizontal, with the fluid flowing above the heater, named ‘0°’, and vertical with the fluid upflow, named ‘90°’), and various numbers of mini-channels in the test section (7, 9, 11, and 15).
Input data used in the numerical simulations in Simcenter STAR-CCM+ software, concerning the working fluid, heater material, spatial orientation of the test section, and number of mini-channels, are listed in
Table 5. The main experimental parameters taken into account in the simulations are presented in
Table 1 as for Series No. #4.
Figure 11,
Figure 12,
Figure 13 and
Figure 14 illustrate the dependence of the heat transfer coefficient at the heater–fluid interface as a function of the distance from the mini-channel. The inlet and outlet parts of the tested length of the mini-channel were omitted due to the large spread of data. The key physical properties of the fluids and material of the heater taken into account in the numerical calculations are specified in
Table 3.
Figure 11 shows local heat transfer coefficients for two selected working fluids: Fluorinert FC-72 and fluid HFE-7100 (Novec
TM 7100 Engineered Fluid), both manufactured by 3M. The fluids differ in their physical properties (see
Table 3).
Analyzing the results presented in
Figure 11, it is obvious that the use of the FC-72 allows even 70% higher values of the heat transfer coefficient compared to the HFE-7100. Generally, the heat transfer process is known to depend on the thickness of the thermal boundary layer and the density of active nucleation sites. The thin liquid film evaporation has proven to be the heat transfer mechanism governing flow boiling in typical multi-micro or mini-channel heat sinks. The main physical properties of two tested working fluids, i.e., density, viscosity, and surface tension, differ. All these conditions strongly affect the convective heat transfer during the flow in narrow spaces, even more intense if subcooled boiling occurs, and single vapor bubbles appear.
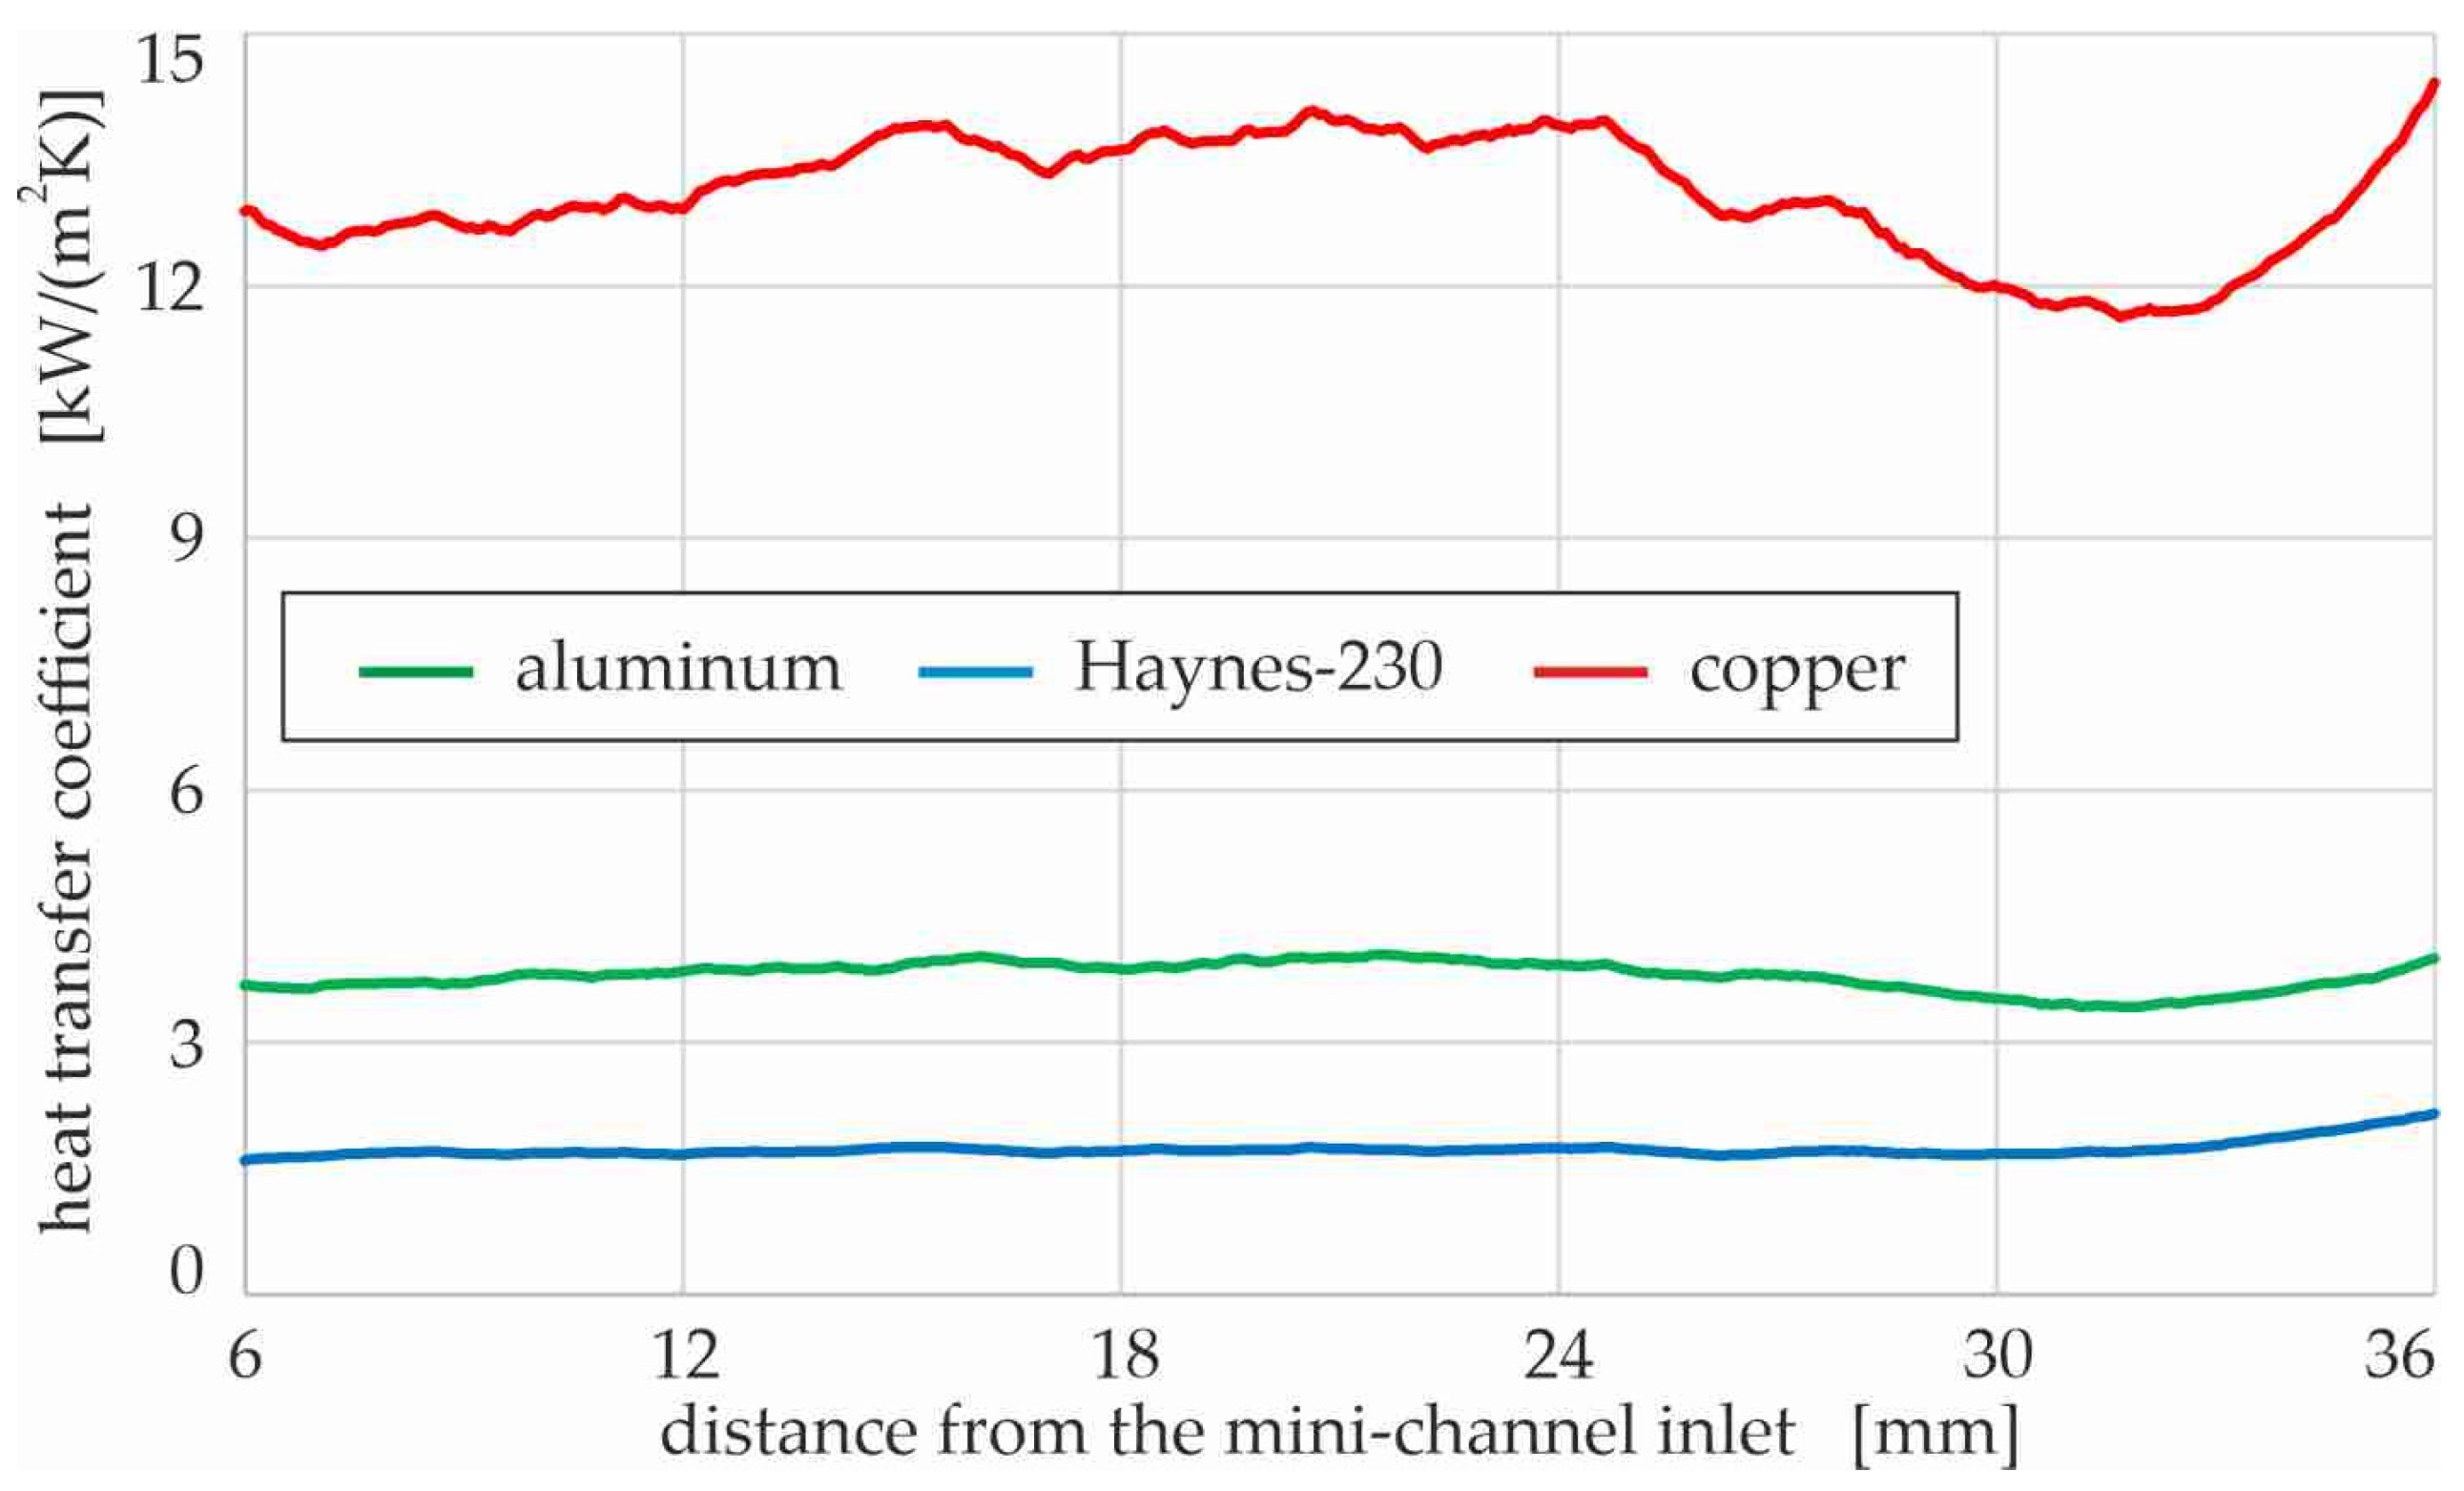
The dependence of the heat transfer coefficient as a function of the distance from the mini-channel inlet, assuming that the heater was made of: Haynes-230 alloy, copper, and aluminum, is presented in
Figure 12. The most important physical property due to the analysis performed is that the listed materials differ in the value of the thermal conductivity coefficient (see
Table 3).
The highest values of the heat transfer coefficient were recorded when a heater made of cooper was used in the simulations, and moderate values of coefficient were achieved for the aluminum heater. The lowest values of the heat transfer coefficient were observed for the application of Haynes-230 alloy as the heated foil. Both the physical properties of the heating surface in contact with the fluid, including the thermal conductivity and surface wettability, as well as the properties of the fluid, especially its surface tension, and cohesion forces, all affect the heat transfer processes. When analyzing subcooled boiling, it should be taken into account that bubble growth is accredited to intensive evaporation of a thin liquid layer trapped between a vapor bubble and a channel wall, and the physical properties of both are crucial to heat transfer development.
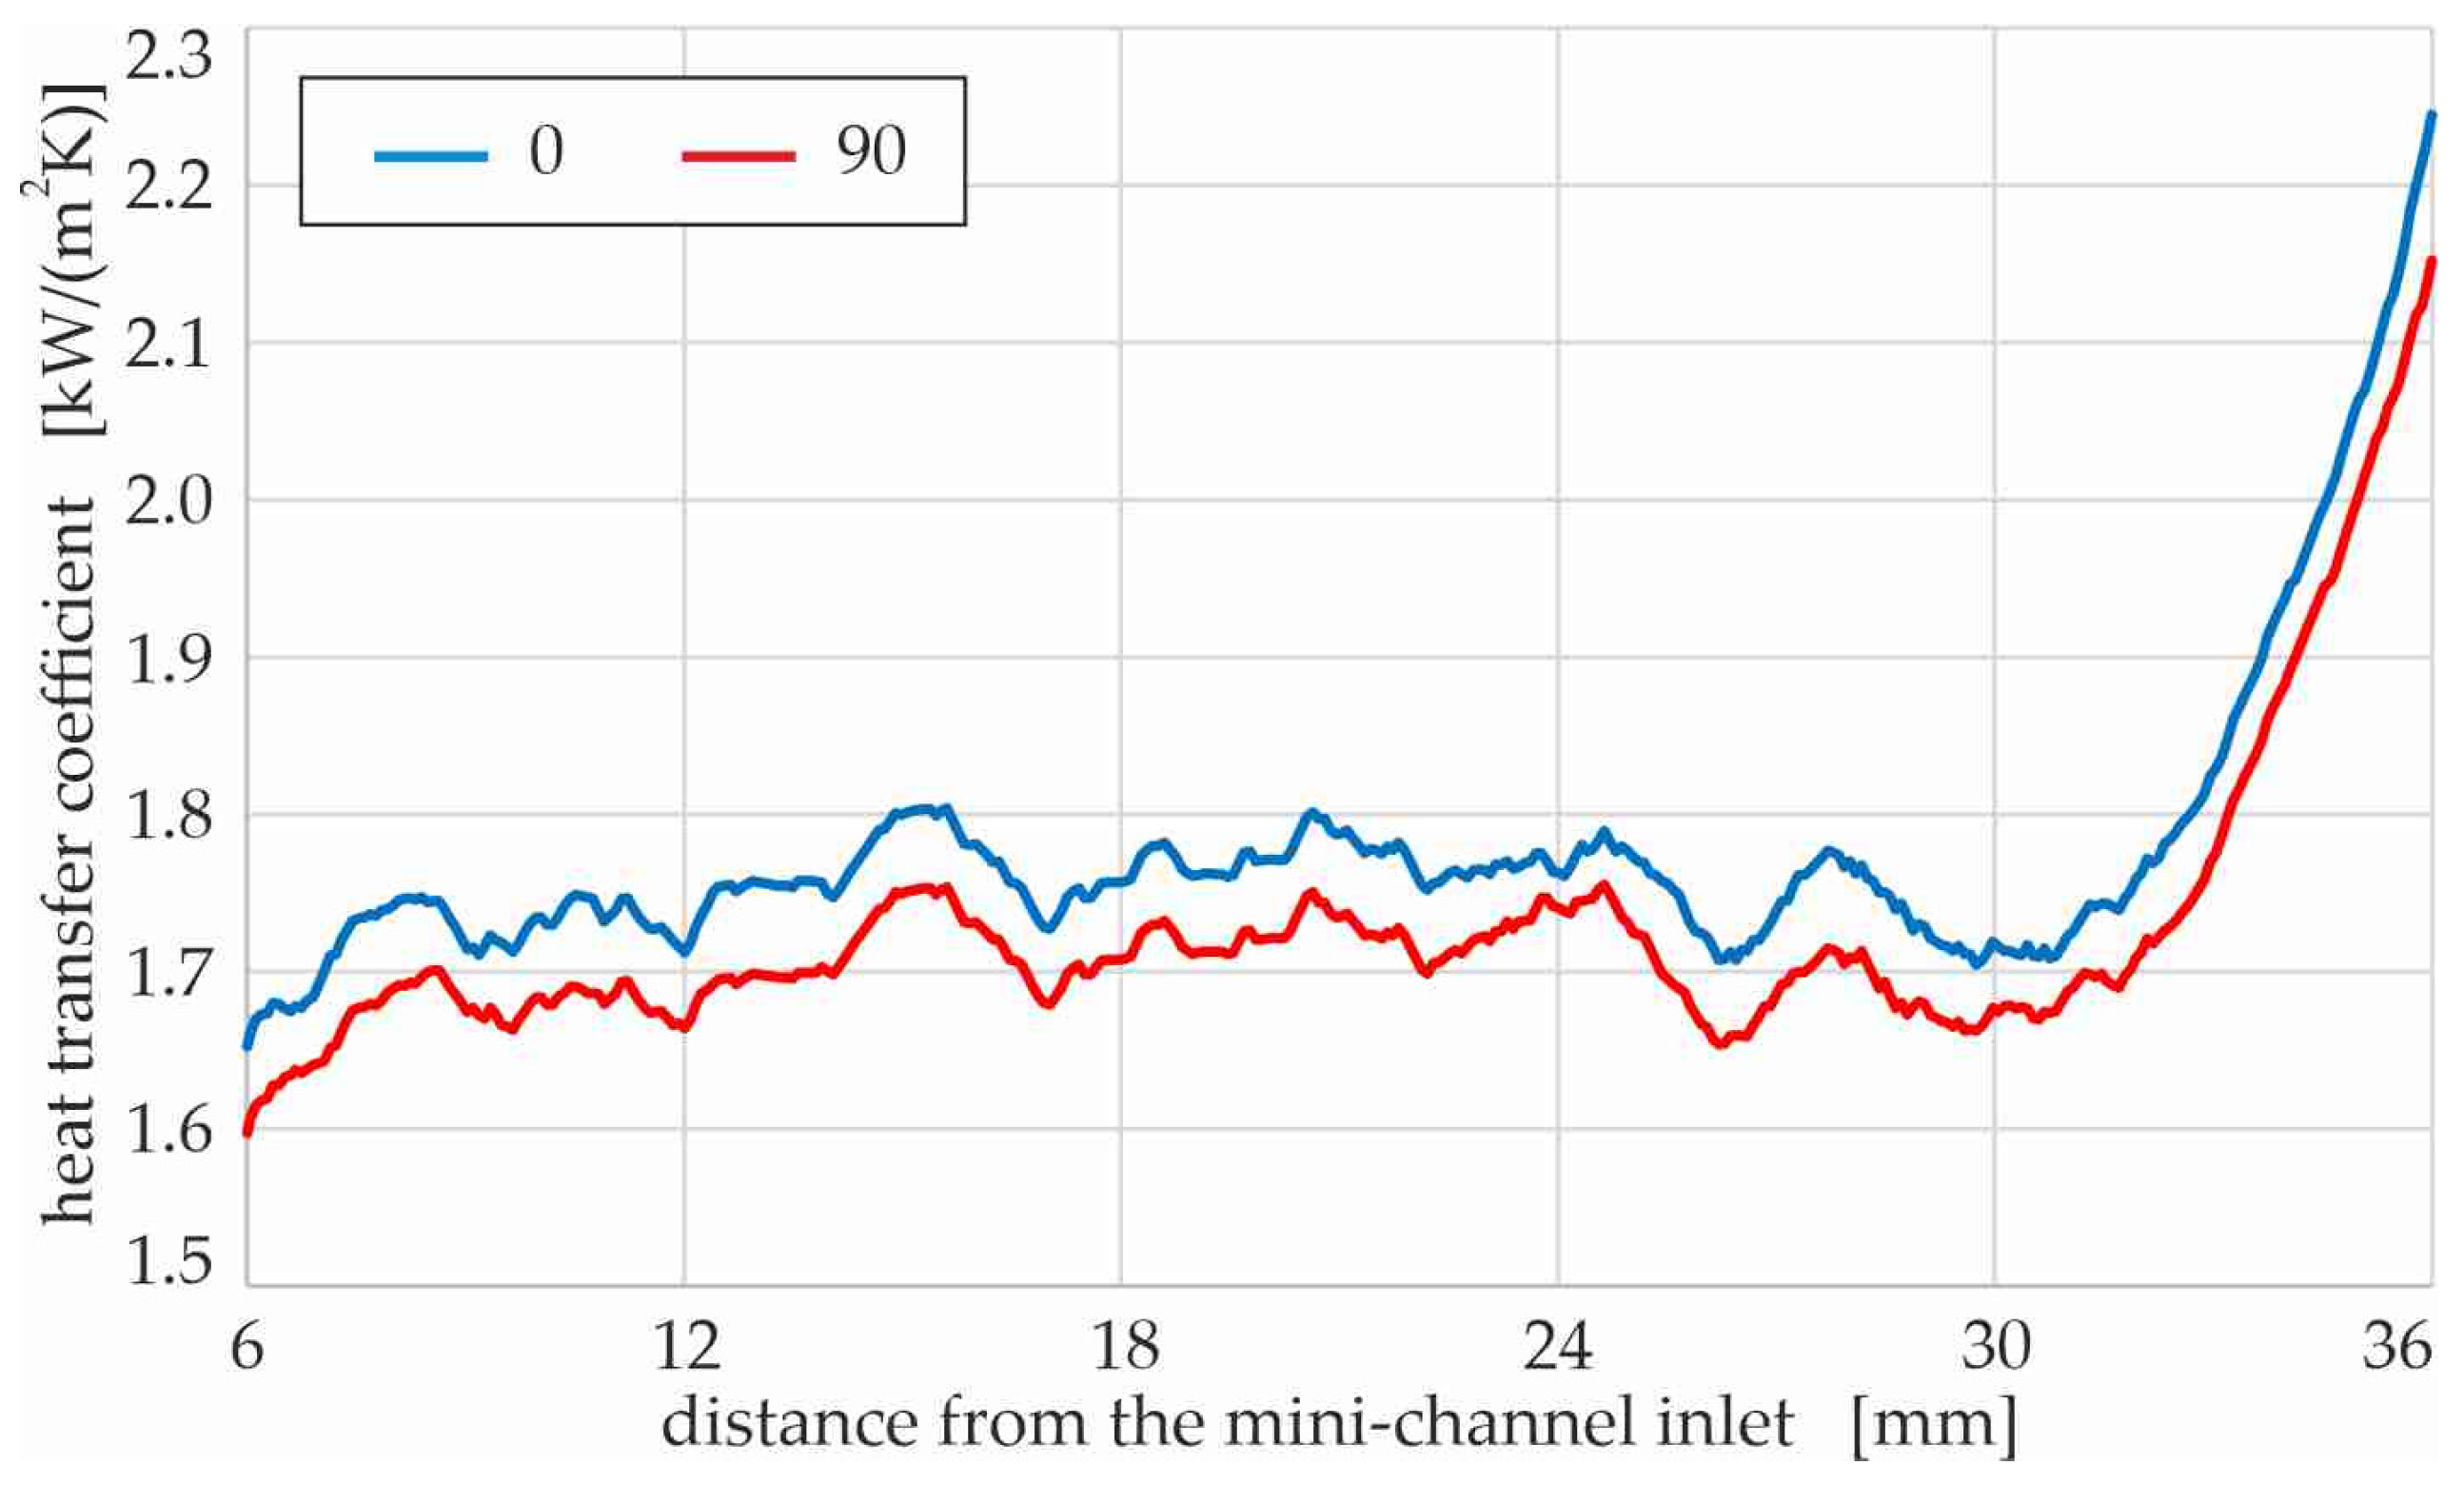
The heat transfer coefficient versus the distance from the mini-channel inlet, assuming two spatial orientations of the test section: vertical with fluid upflow (‘90’) and horizontal with fluid flow above a heater, are presented in
Figure 13.
Similar local values of the heat transfer coefficient were obtained, although the horizontal position of the test section seems to be slightly more favorable than the two tested positions. However, it should be noted that these two orientations were previously verified as the most effective for the operation of the test section with mini-channels in previous articles by Piasecka et al. [
10,
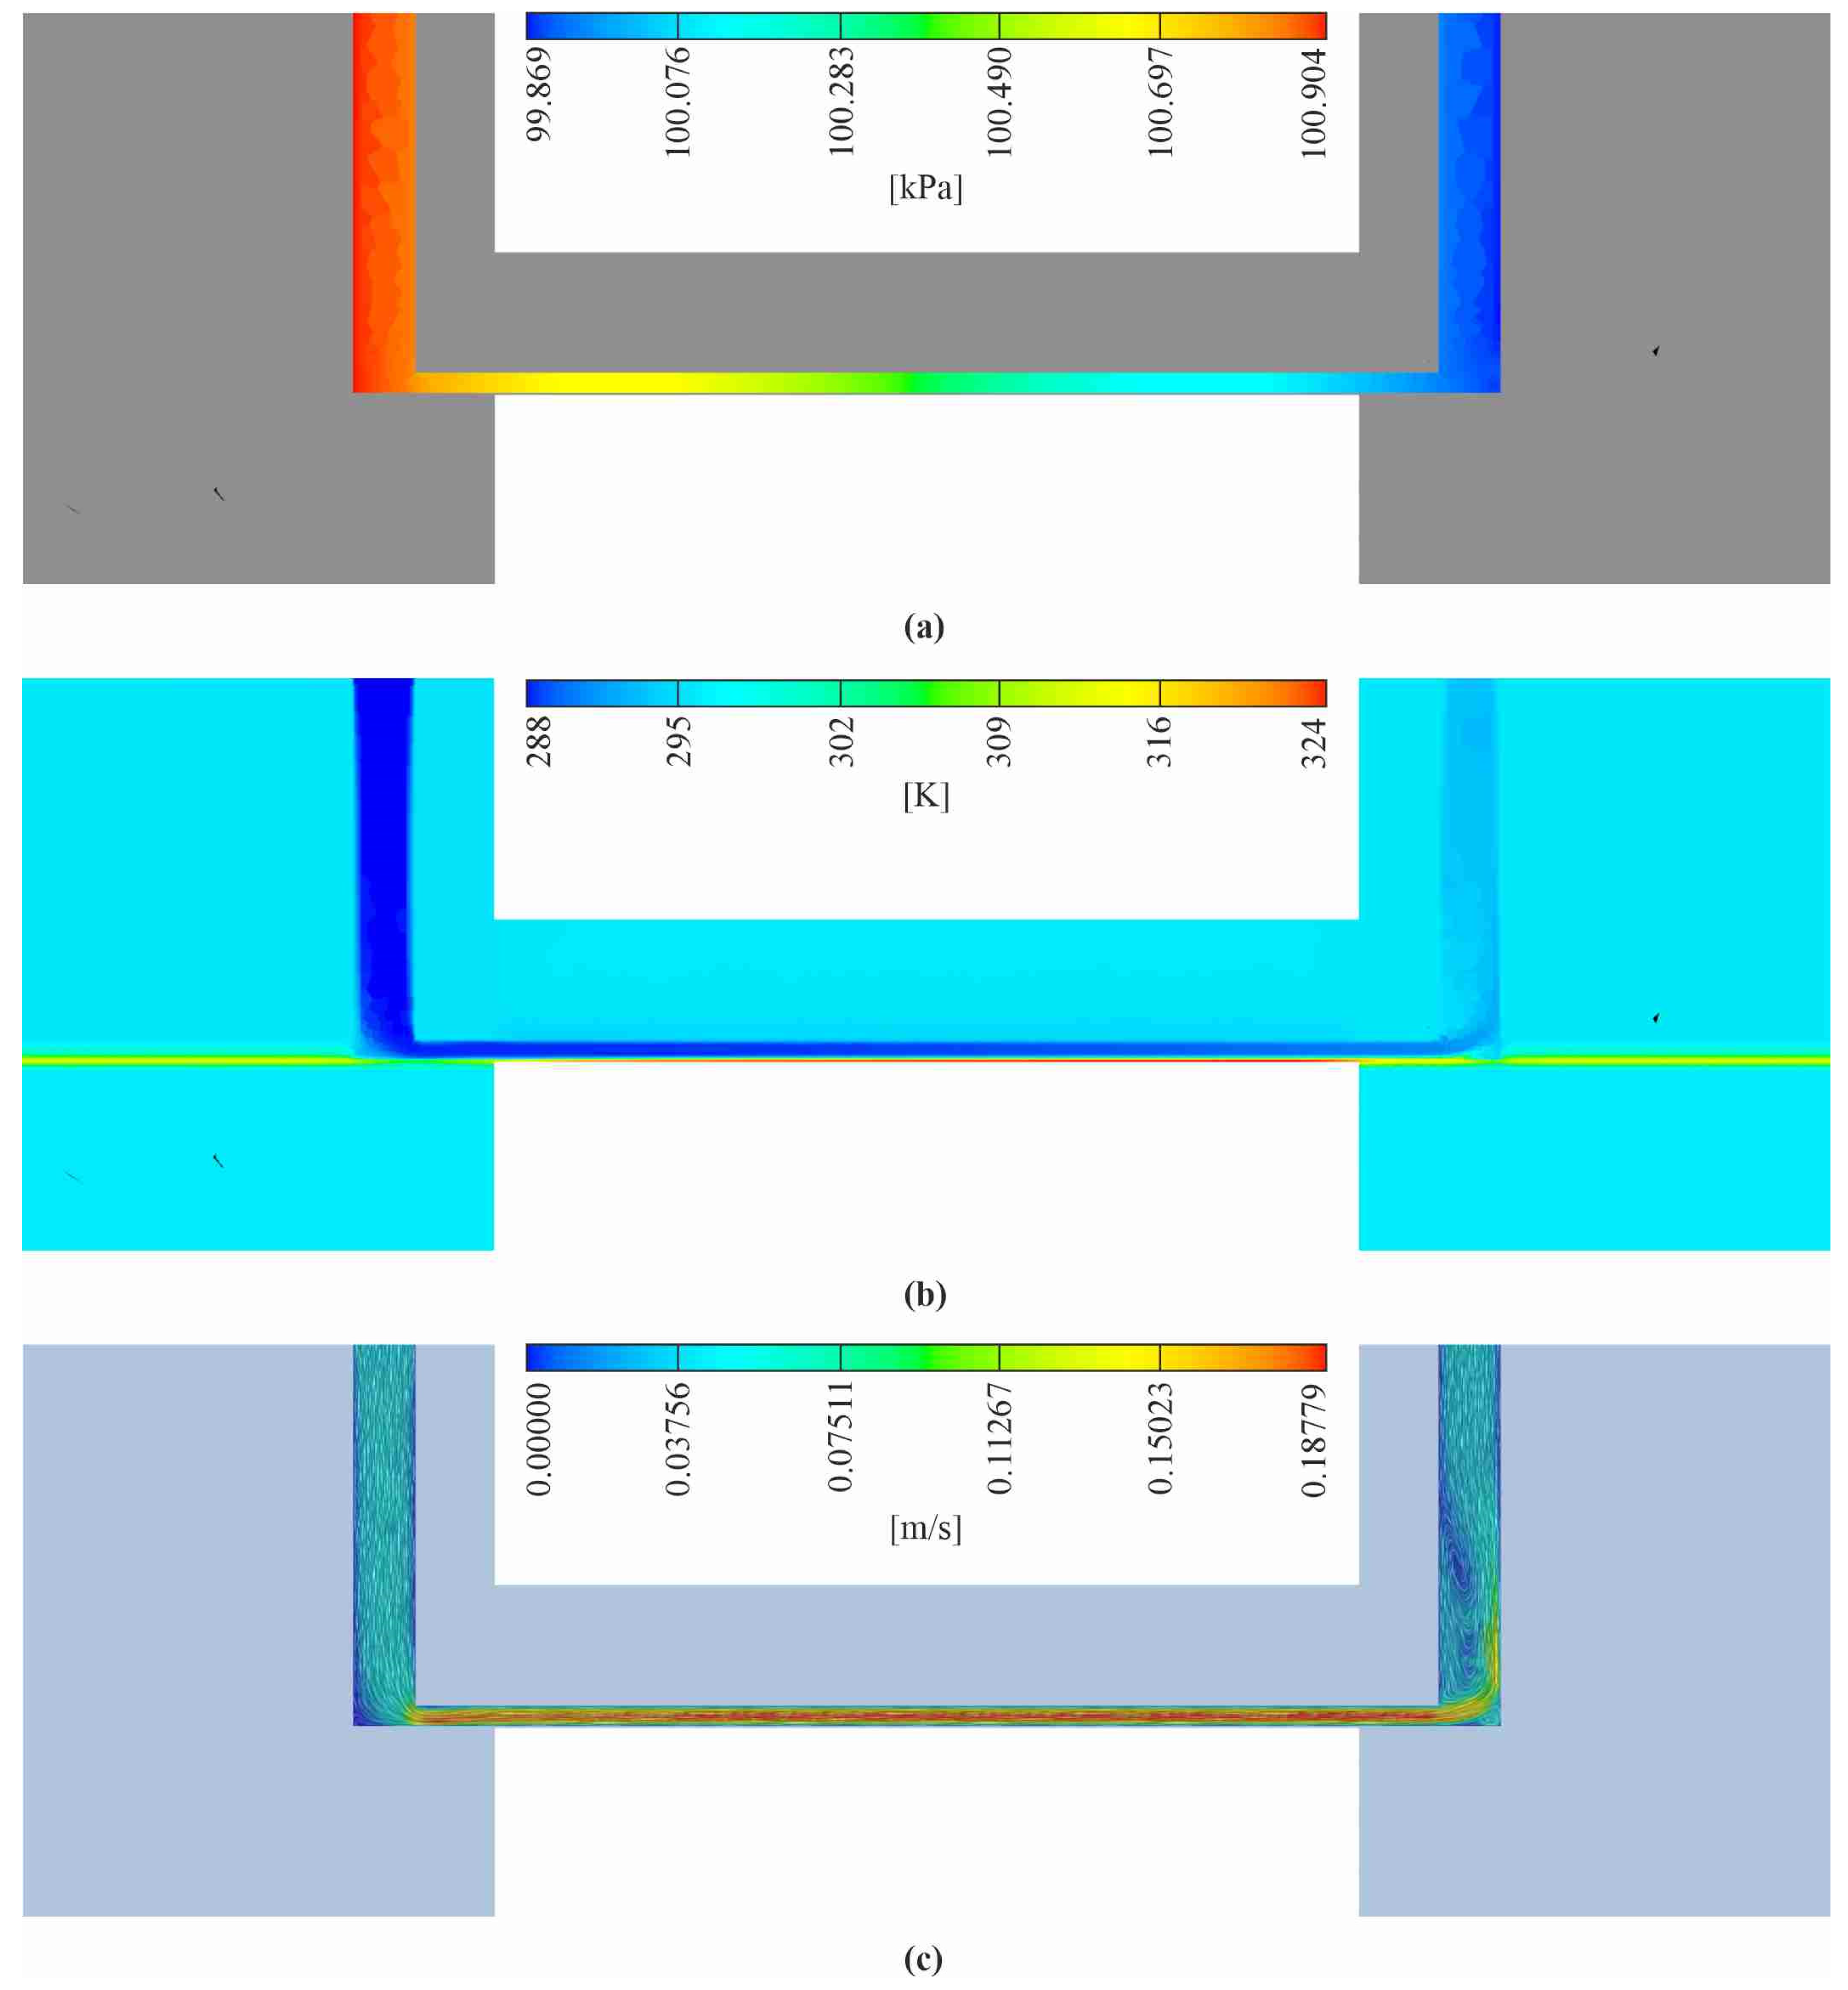
11]. An example distribution of velocity is shown in
Figure 6c. It could be taken into account that some differences should occur when various orientations of the test section are tested. The velocity field is non-uniform, and it changes with the flow orientation. In the case of subcooled boiling, the forces of gravity and buoyancy affecting the vapor bubbles have a very strong effect on the heat transfer during the flow in mini-channels.
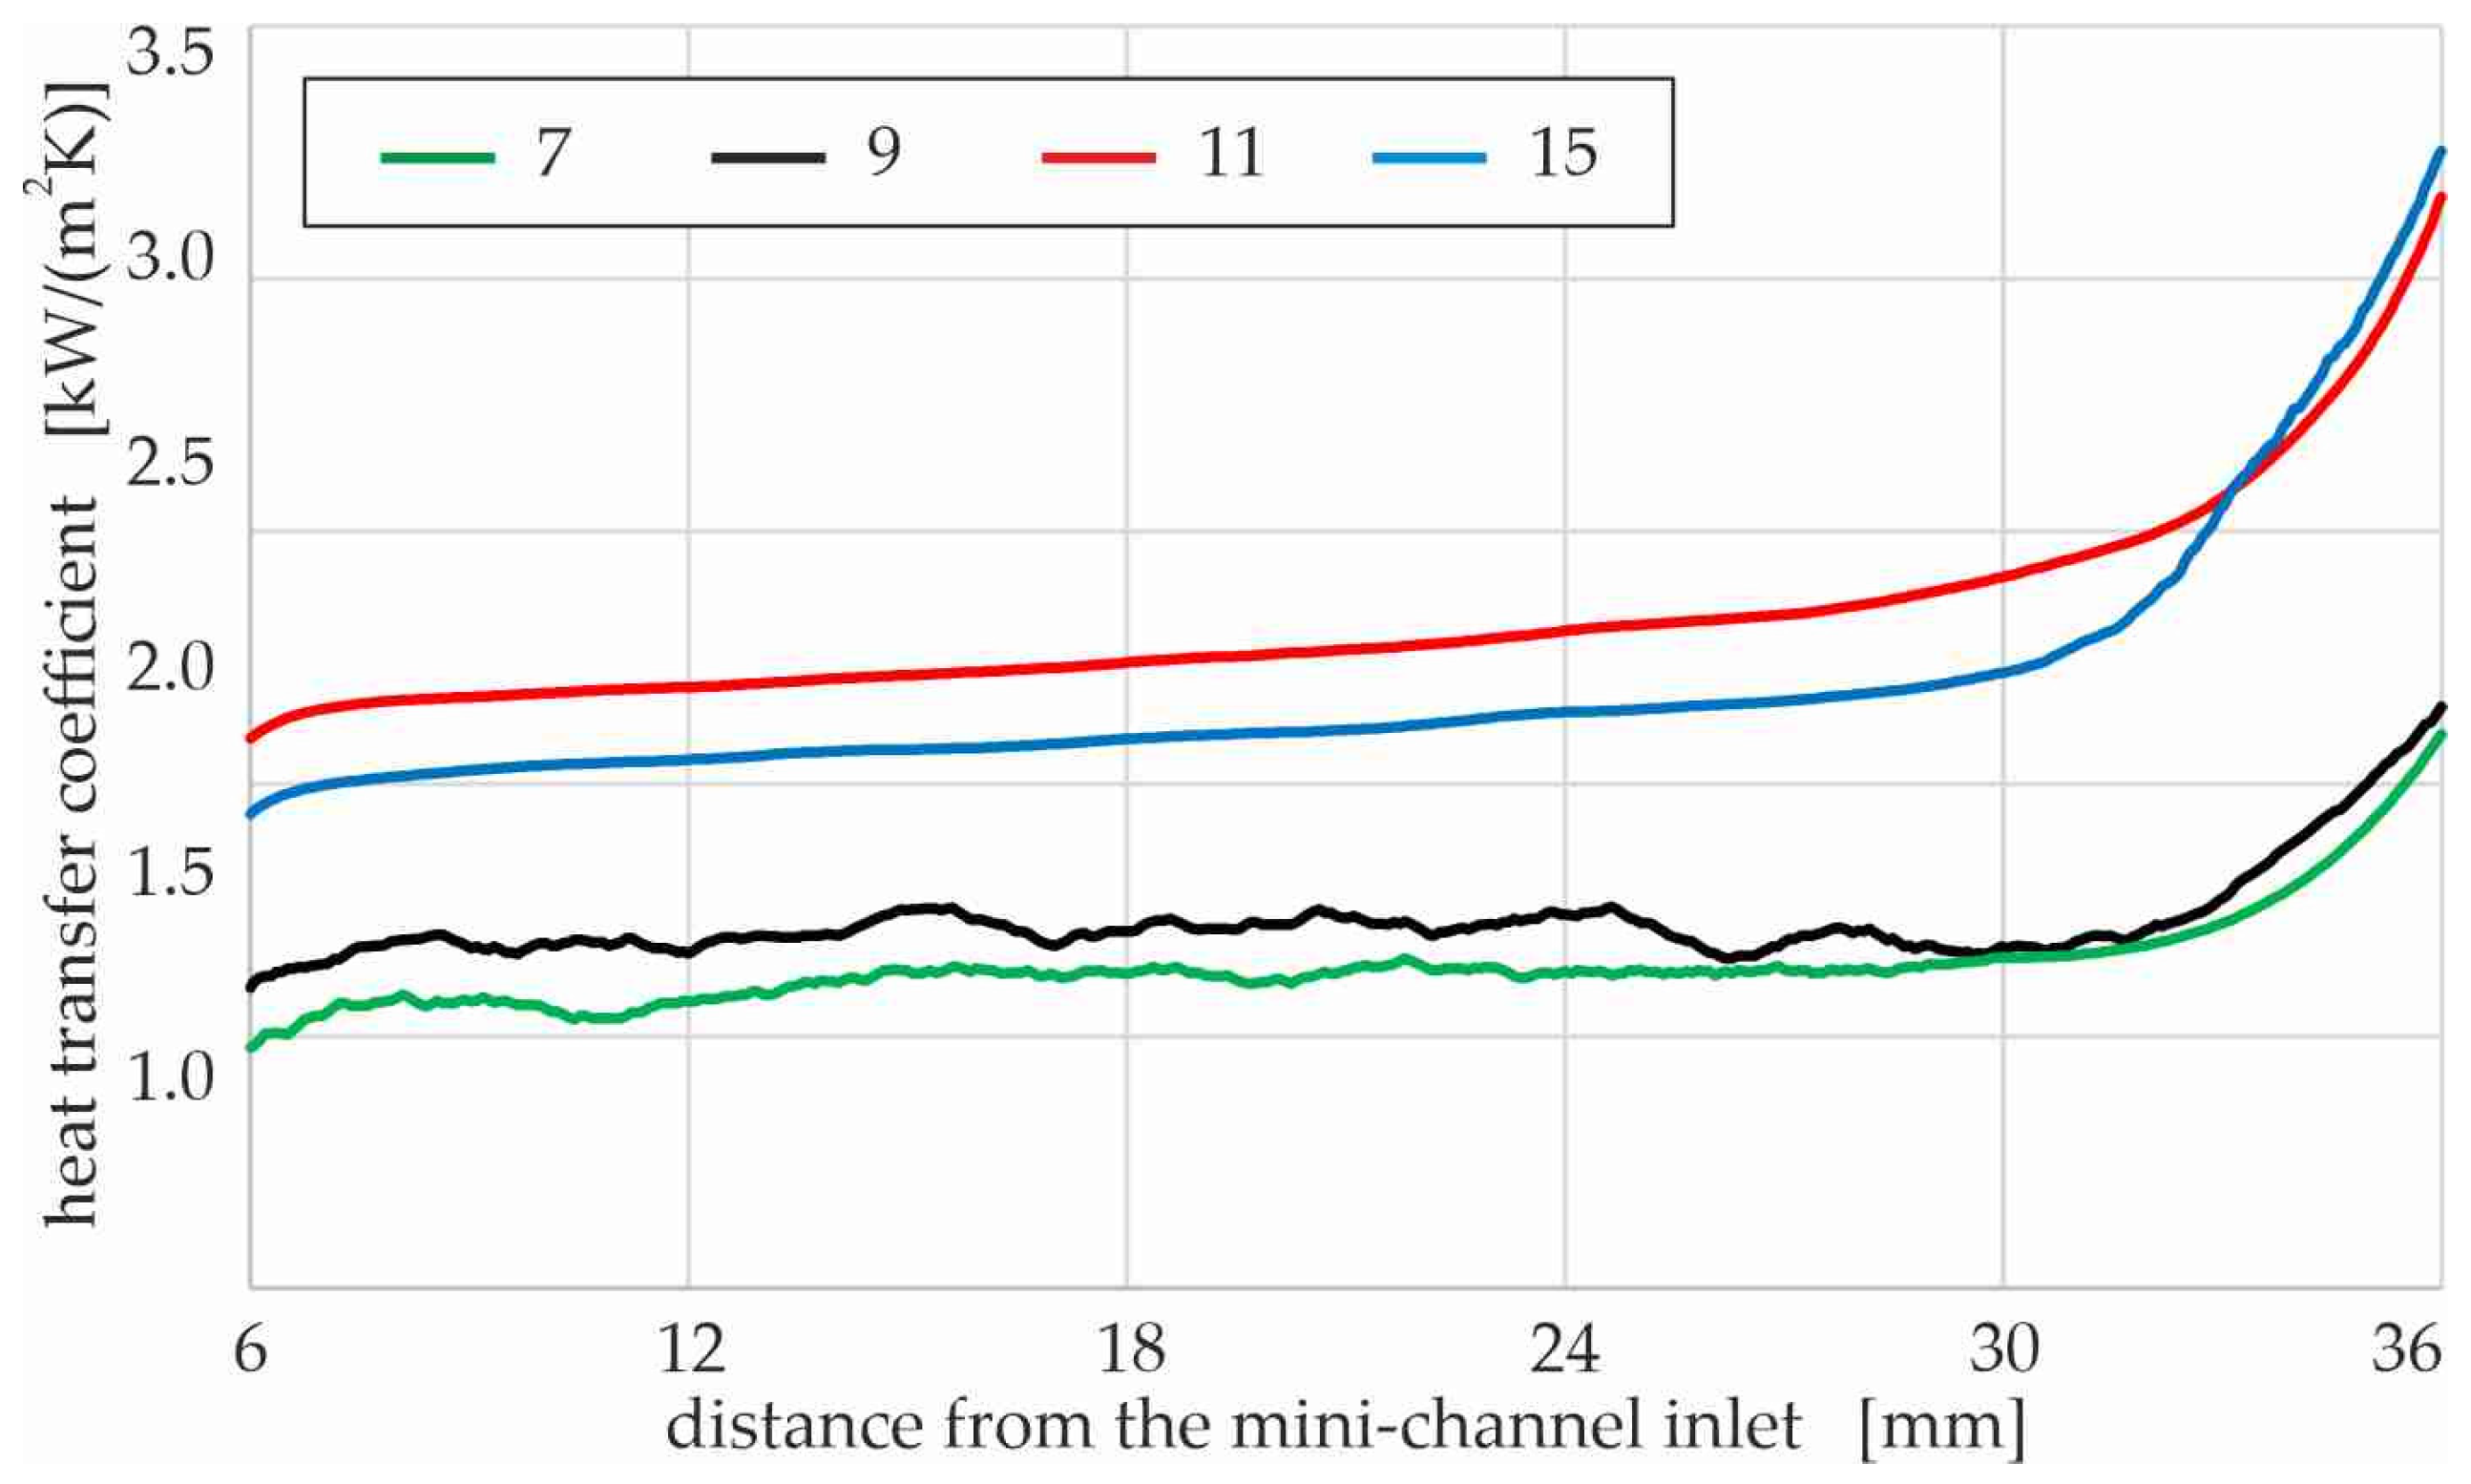
The heat transfer coefficient versus the distance from the mini-channel inlet, assuming four different numbers of mini-channels produced in the test section, i.e., 7, 9, 11, and 15, is illustrated in
Figure 14.
As can be seen from the simulation results presented in
Figure 14, among the tested numbers of mini-channels, it is more advantageous in terms of the intensity of heat exchange in the test section to design a higher number of mini-channels, that is, 11 or 15. The test section with 6 and 9 mini-channels caused the heat transfer coefficient values to be lower by up to 50% compared to 11 or 15 mini-channels. It should be underlined that when considering the influence of the number of channels on heat transfer, the influence of decreasing the mass flow rate in a singular mini-channel is assumed in the numerical computation. In each simulation, the constant value of the mass flow rate was considered for all cases in this study, for the entire test section. Therefore, increasing the number of channels directly corresponds to a decrease in the flow rate in a single mini-channel. The experimental results from research reported in the literature often differs, and are even sometimes contradictory. For laminar flow, when single-phase flow or subcooled boiling occurs, higher values of the heat transfer coefficient values are often obtained in the literature and were observed on the basis of the previous studies of the authors.
In [
29,
30], it was observed that for a constant Reynolds number, the heat transfer coefficient increases with an increasing mini-channel length / hydraulic diameter ratio. The authors of [
31] underlined that the mass flux plays different roles on the heat transfer coefficient. In the subcooled flow boiling region, increasing the mass flux slightly reduces the local heat transfer coefficients. In our case of the study, it is not possible to verify the relationship mass flux–channel length/hydraulic diameter ratio, because both mentioned parameters changed in each test. However, when analyzing the results obtained for previous experiment, such a relationship is predicted.
6. Conclusions
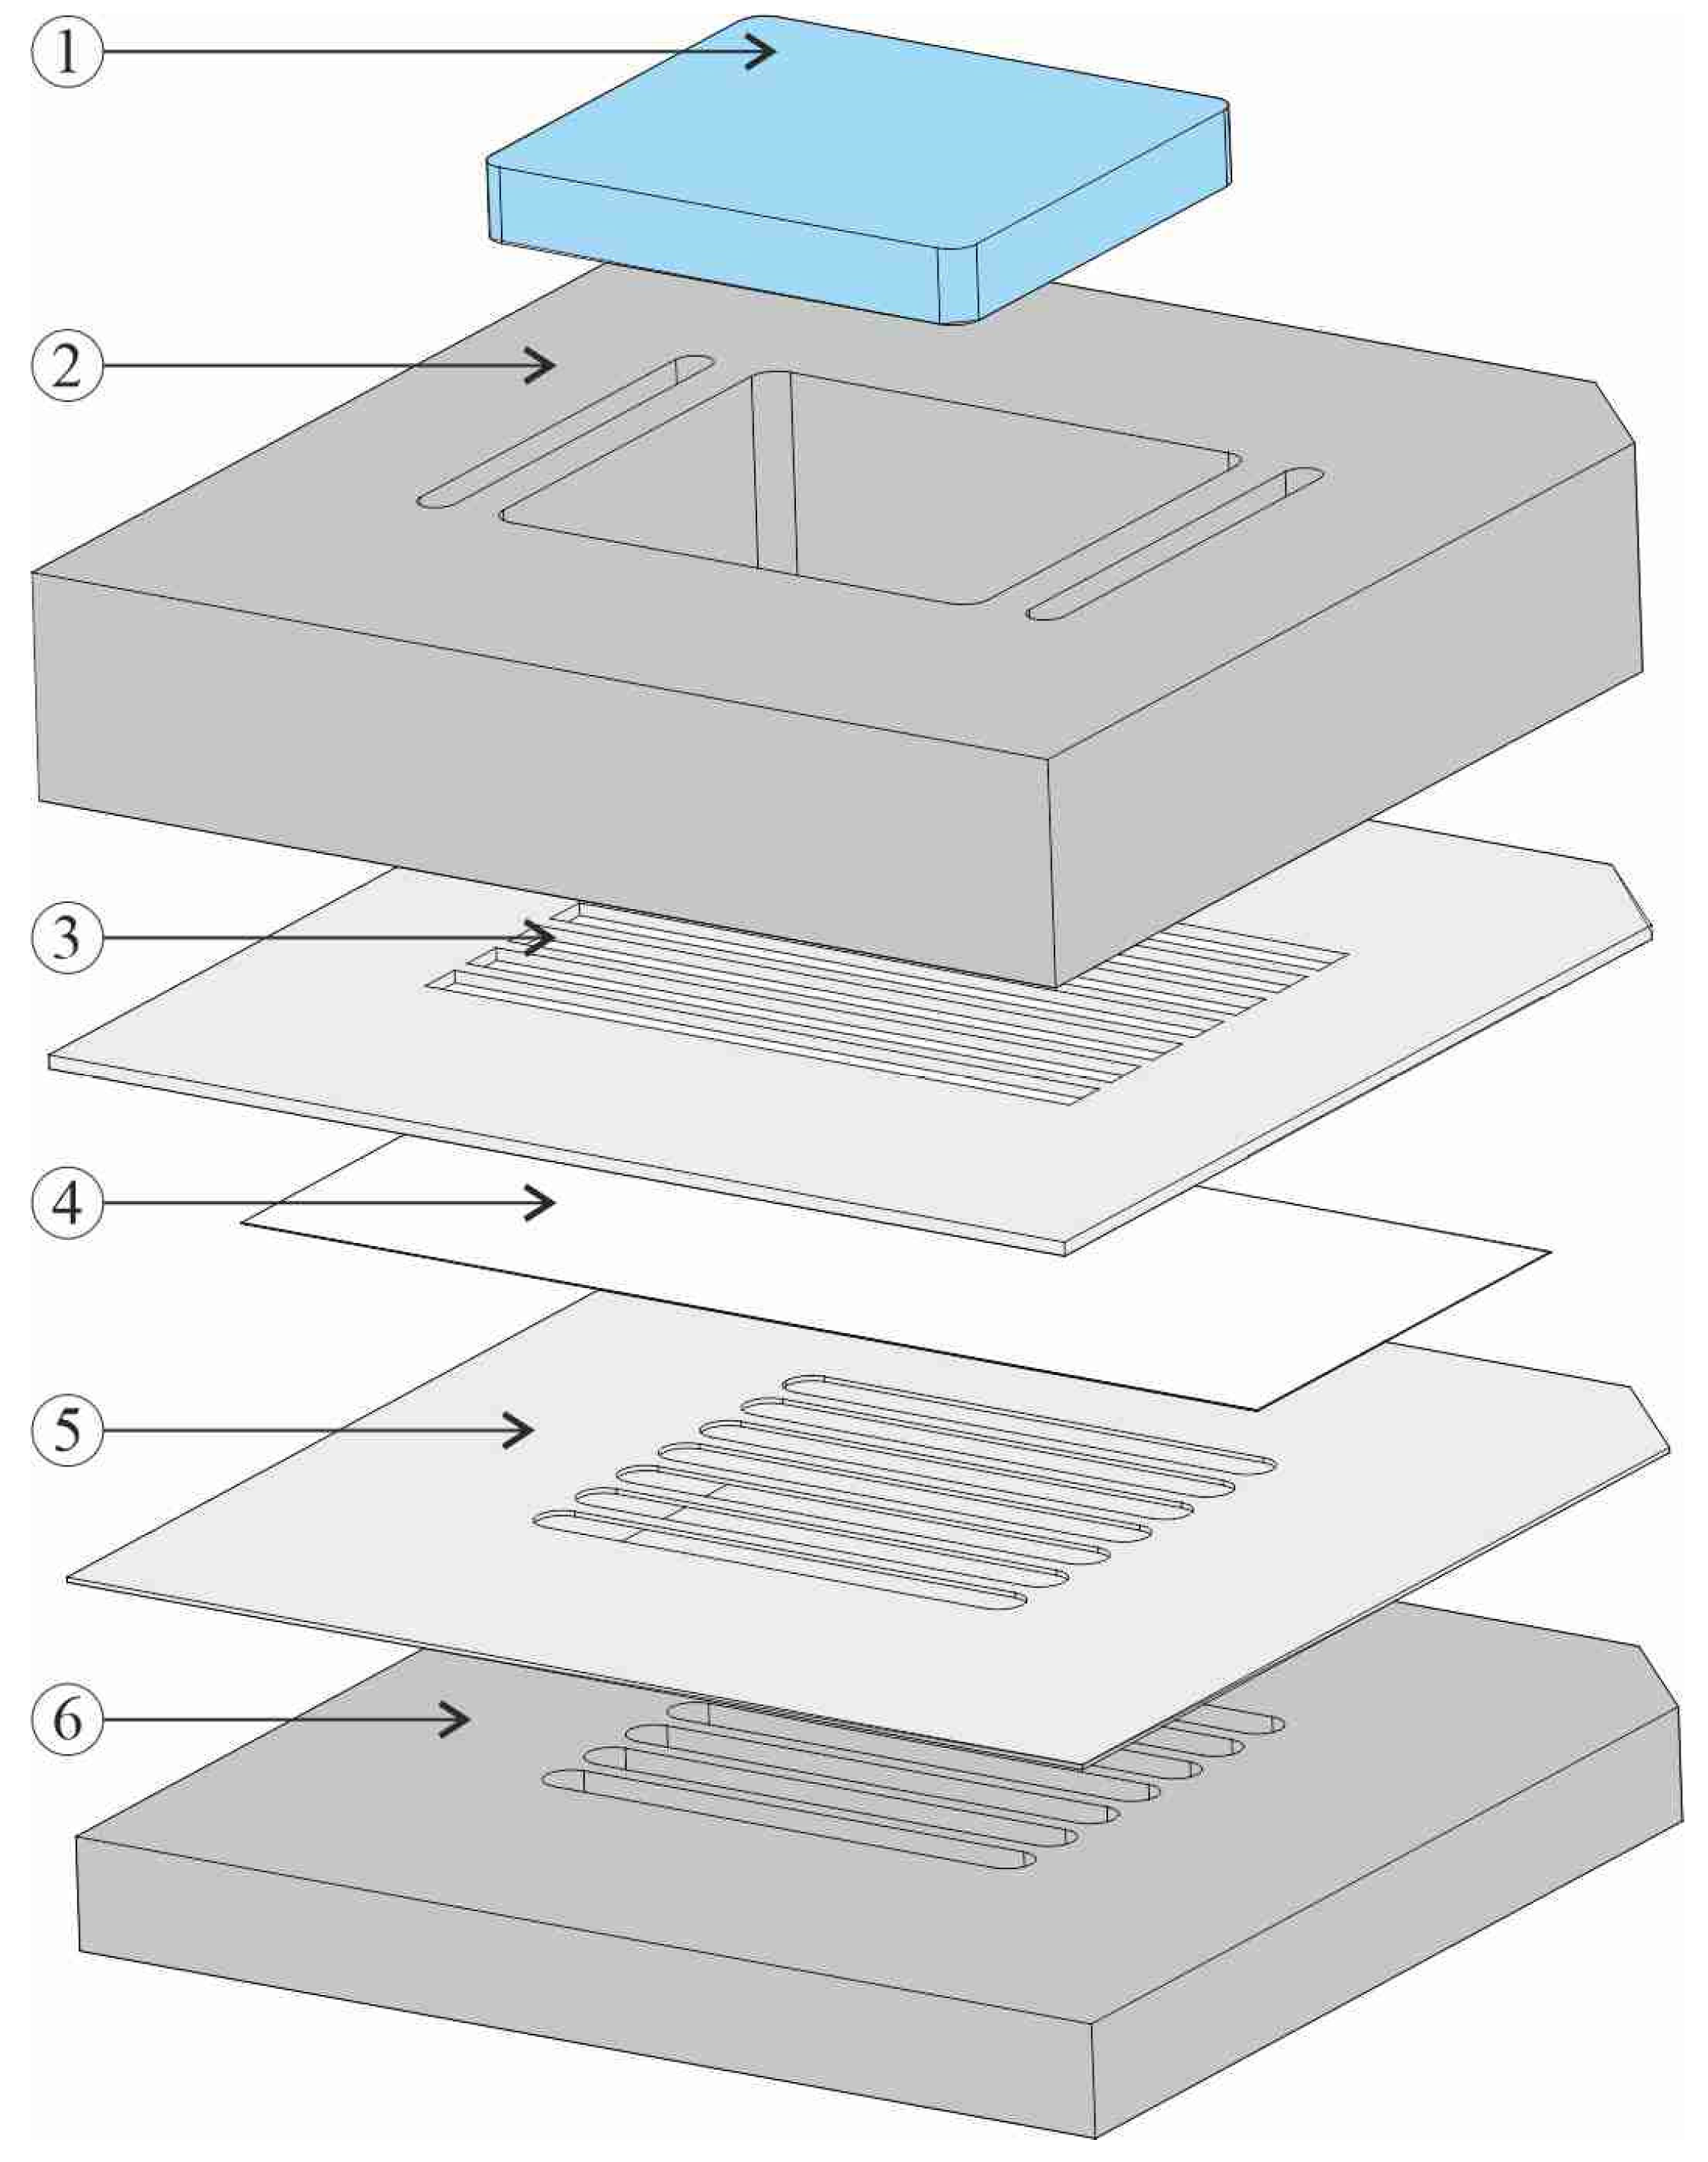
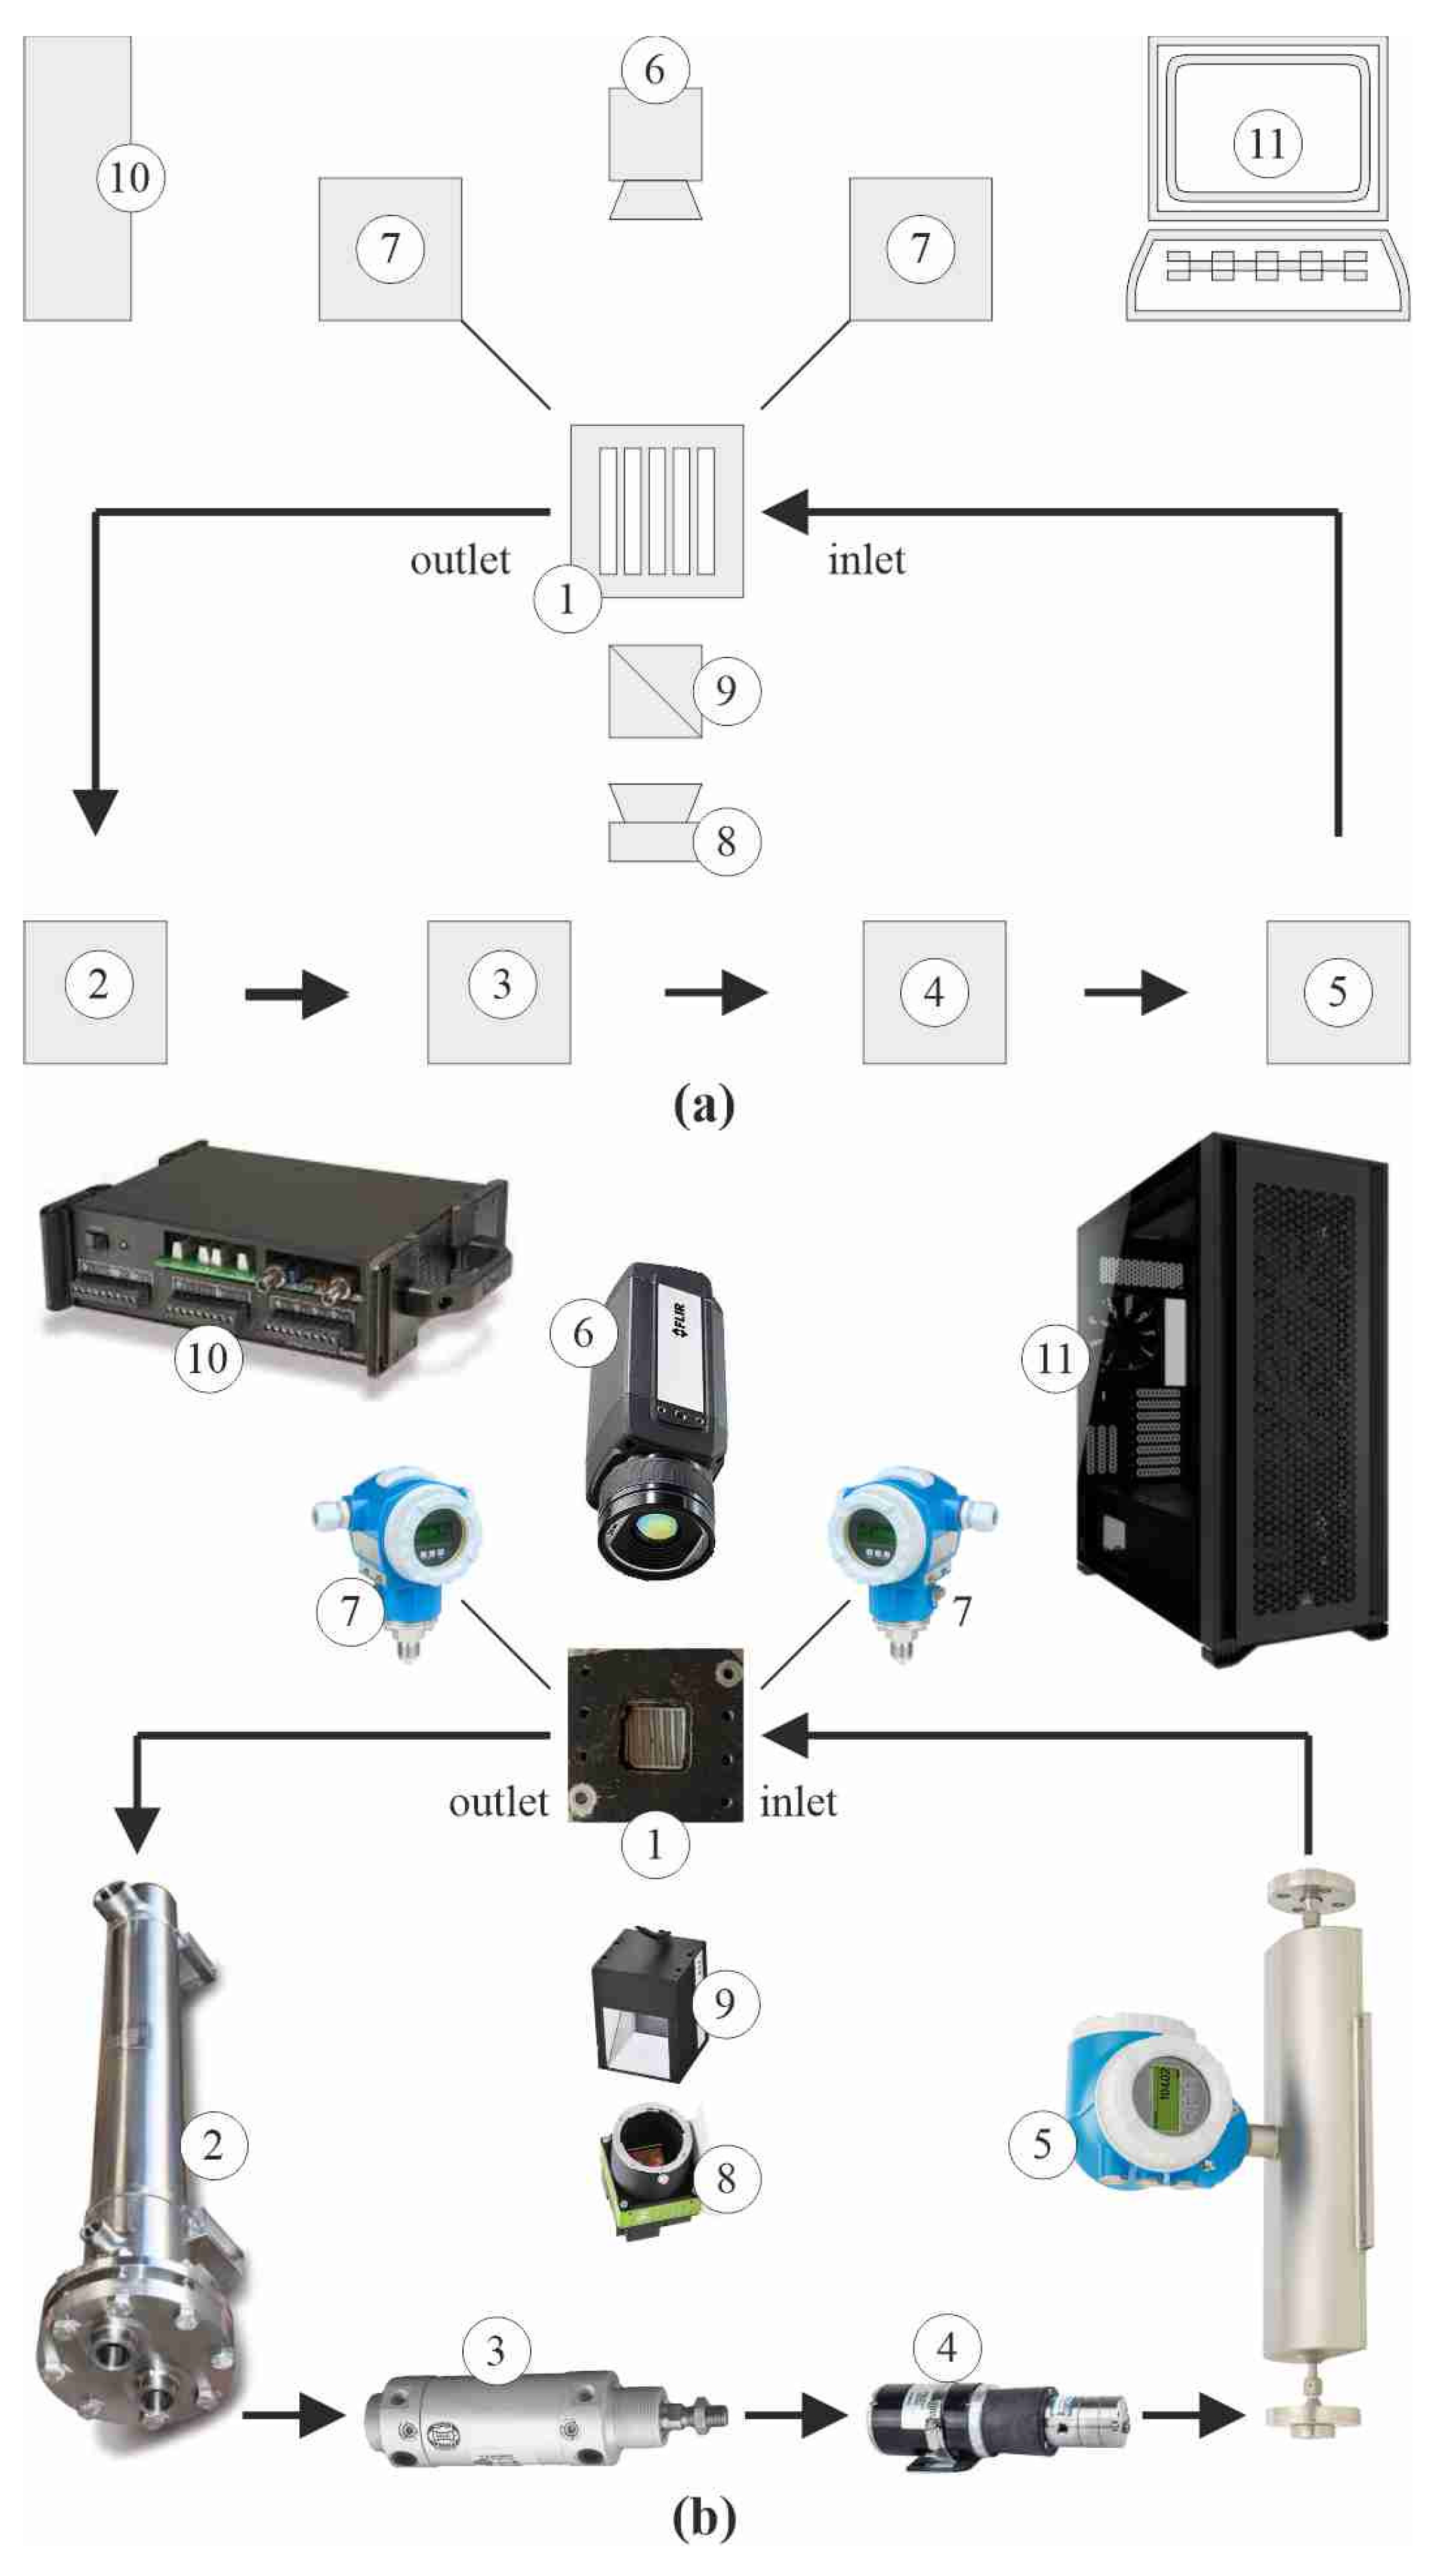
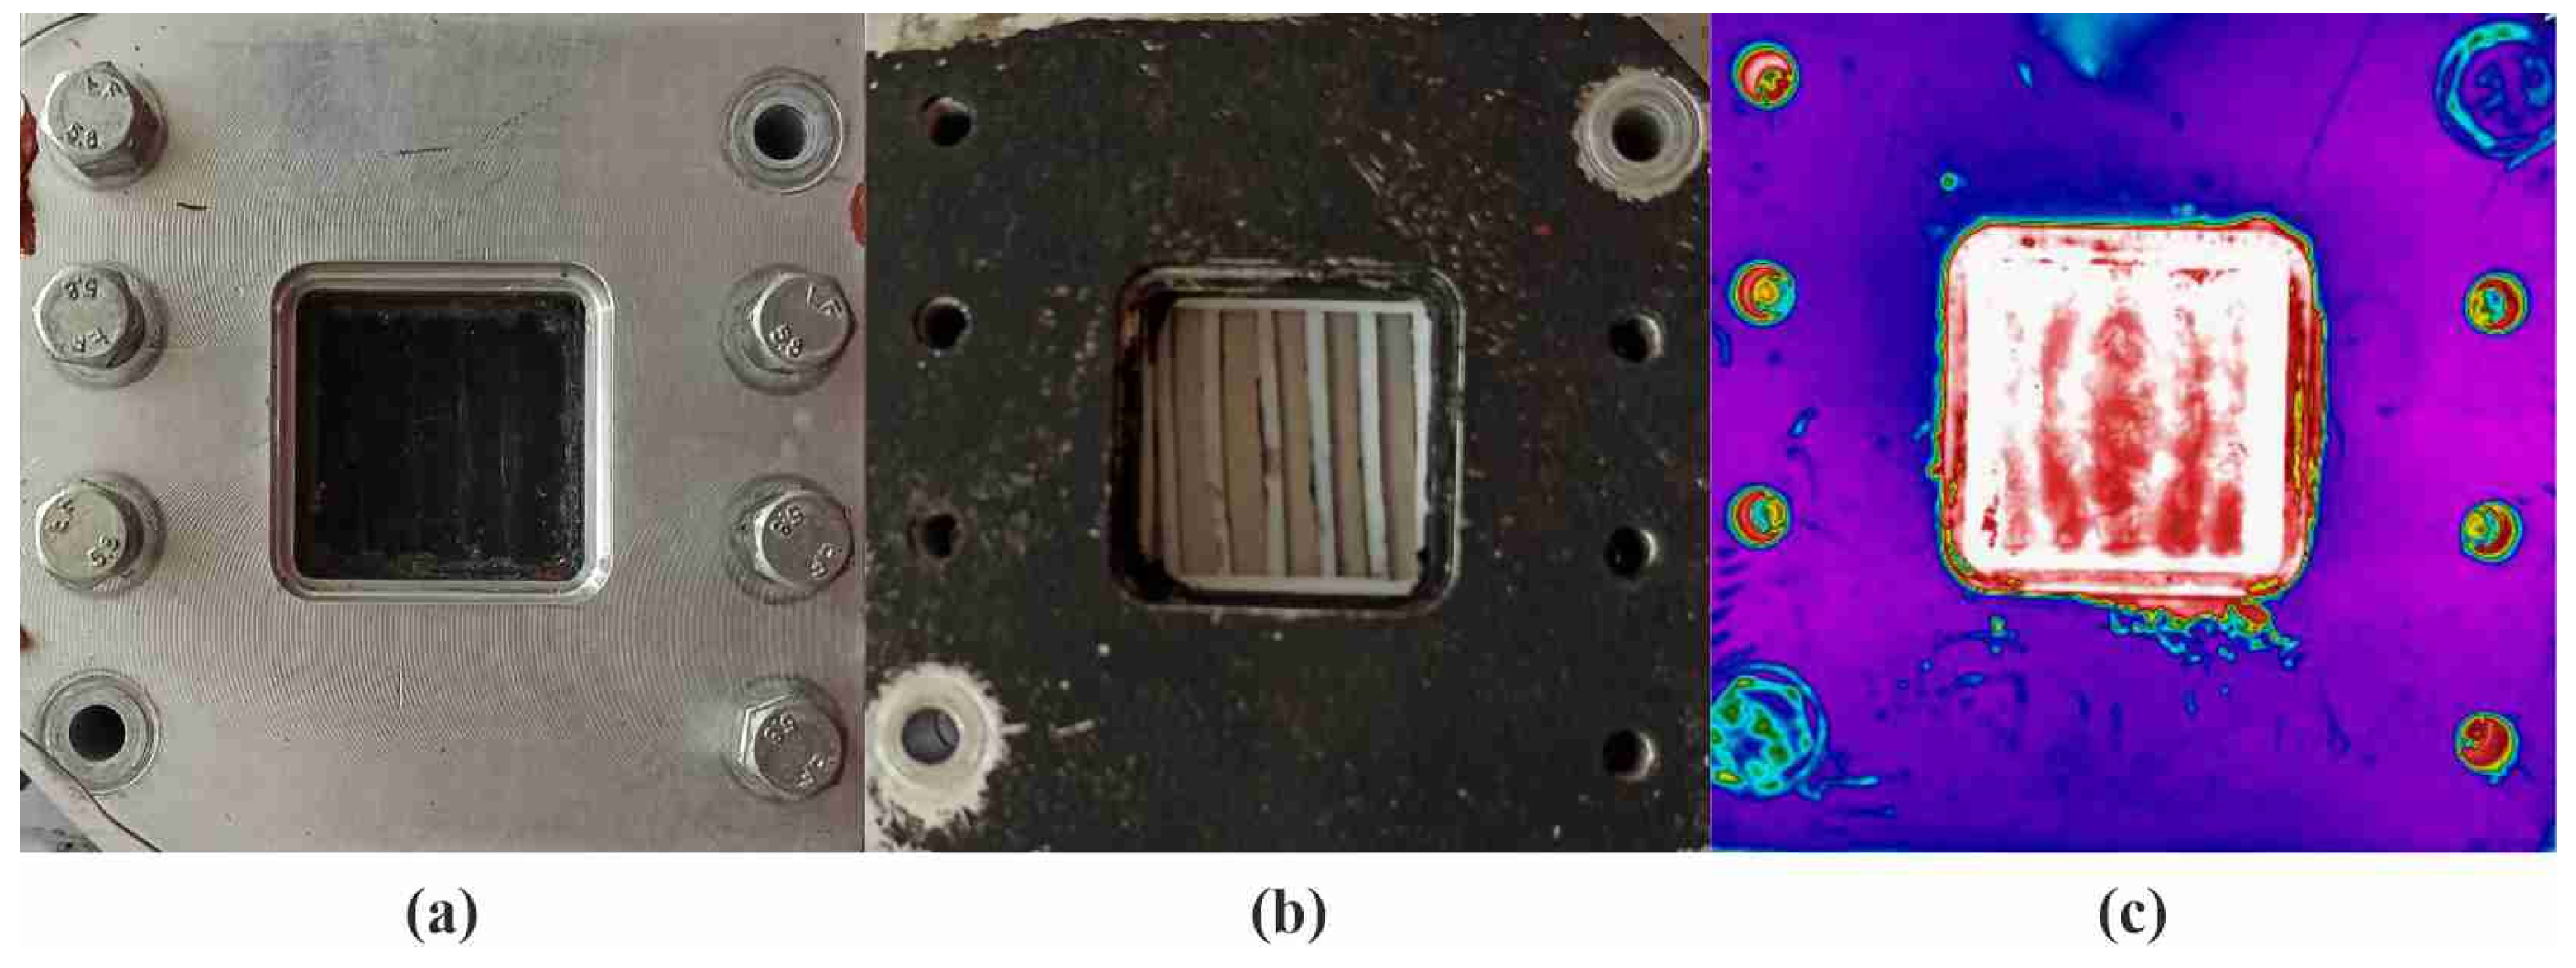
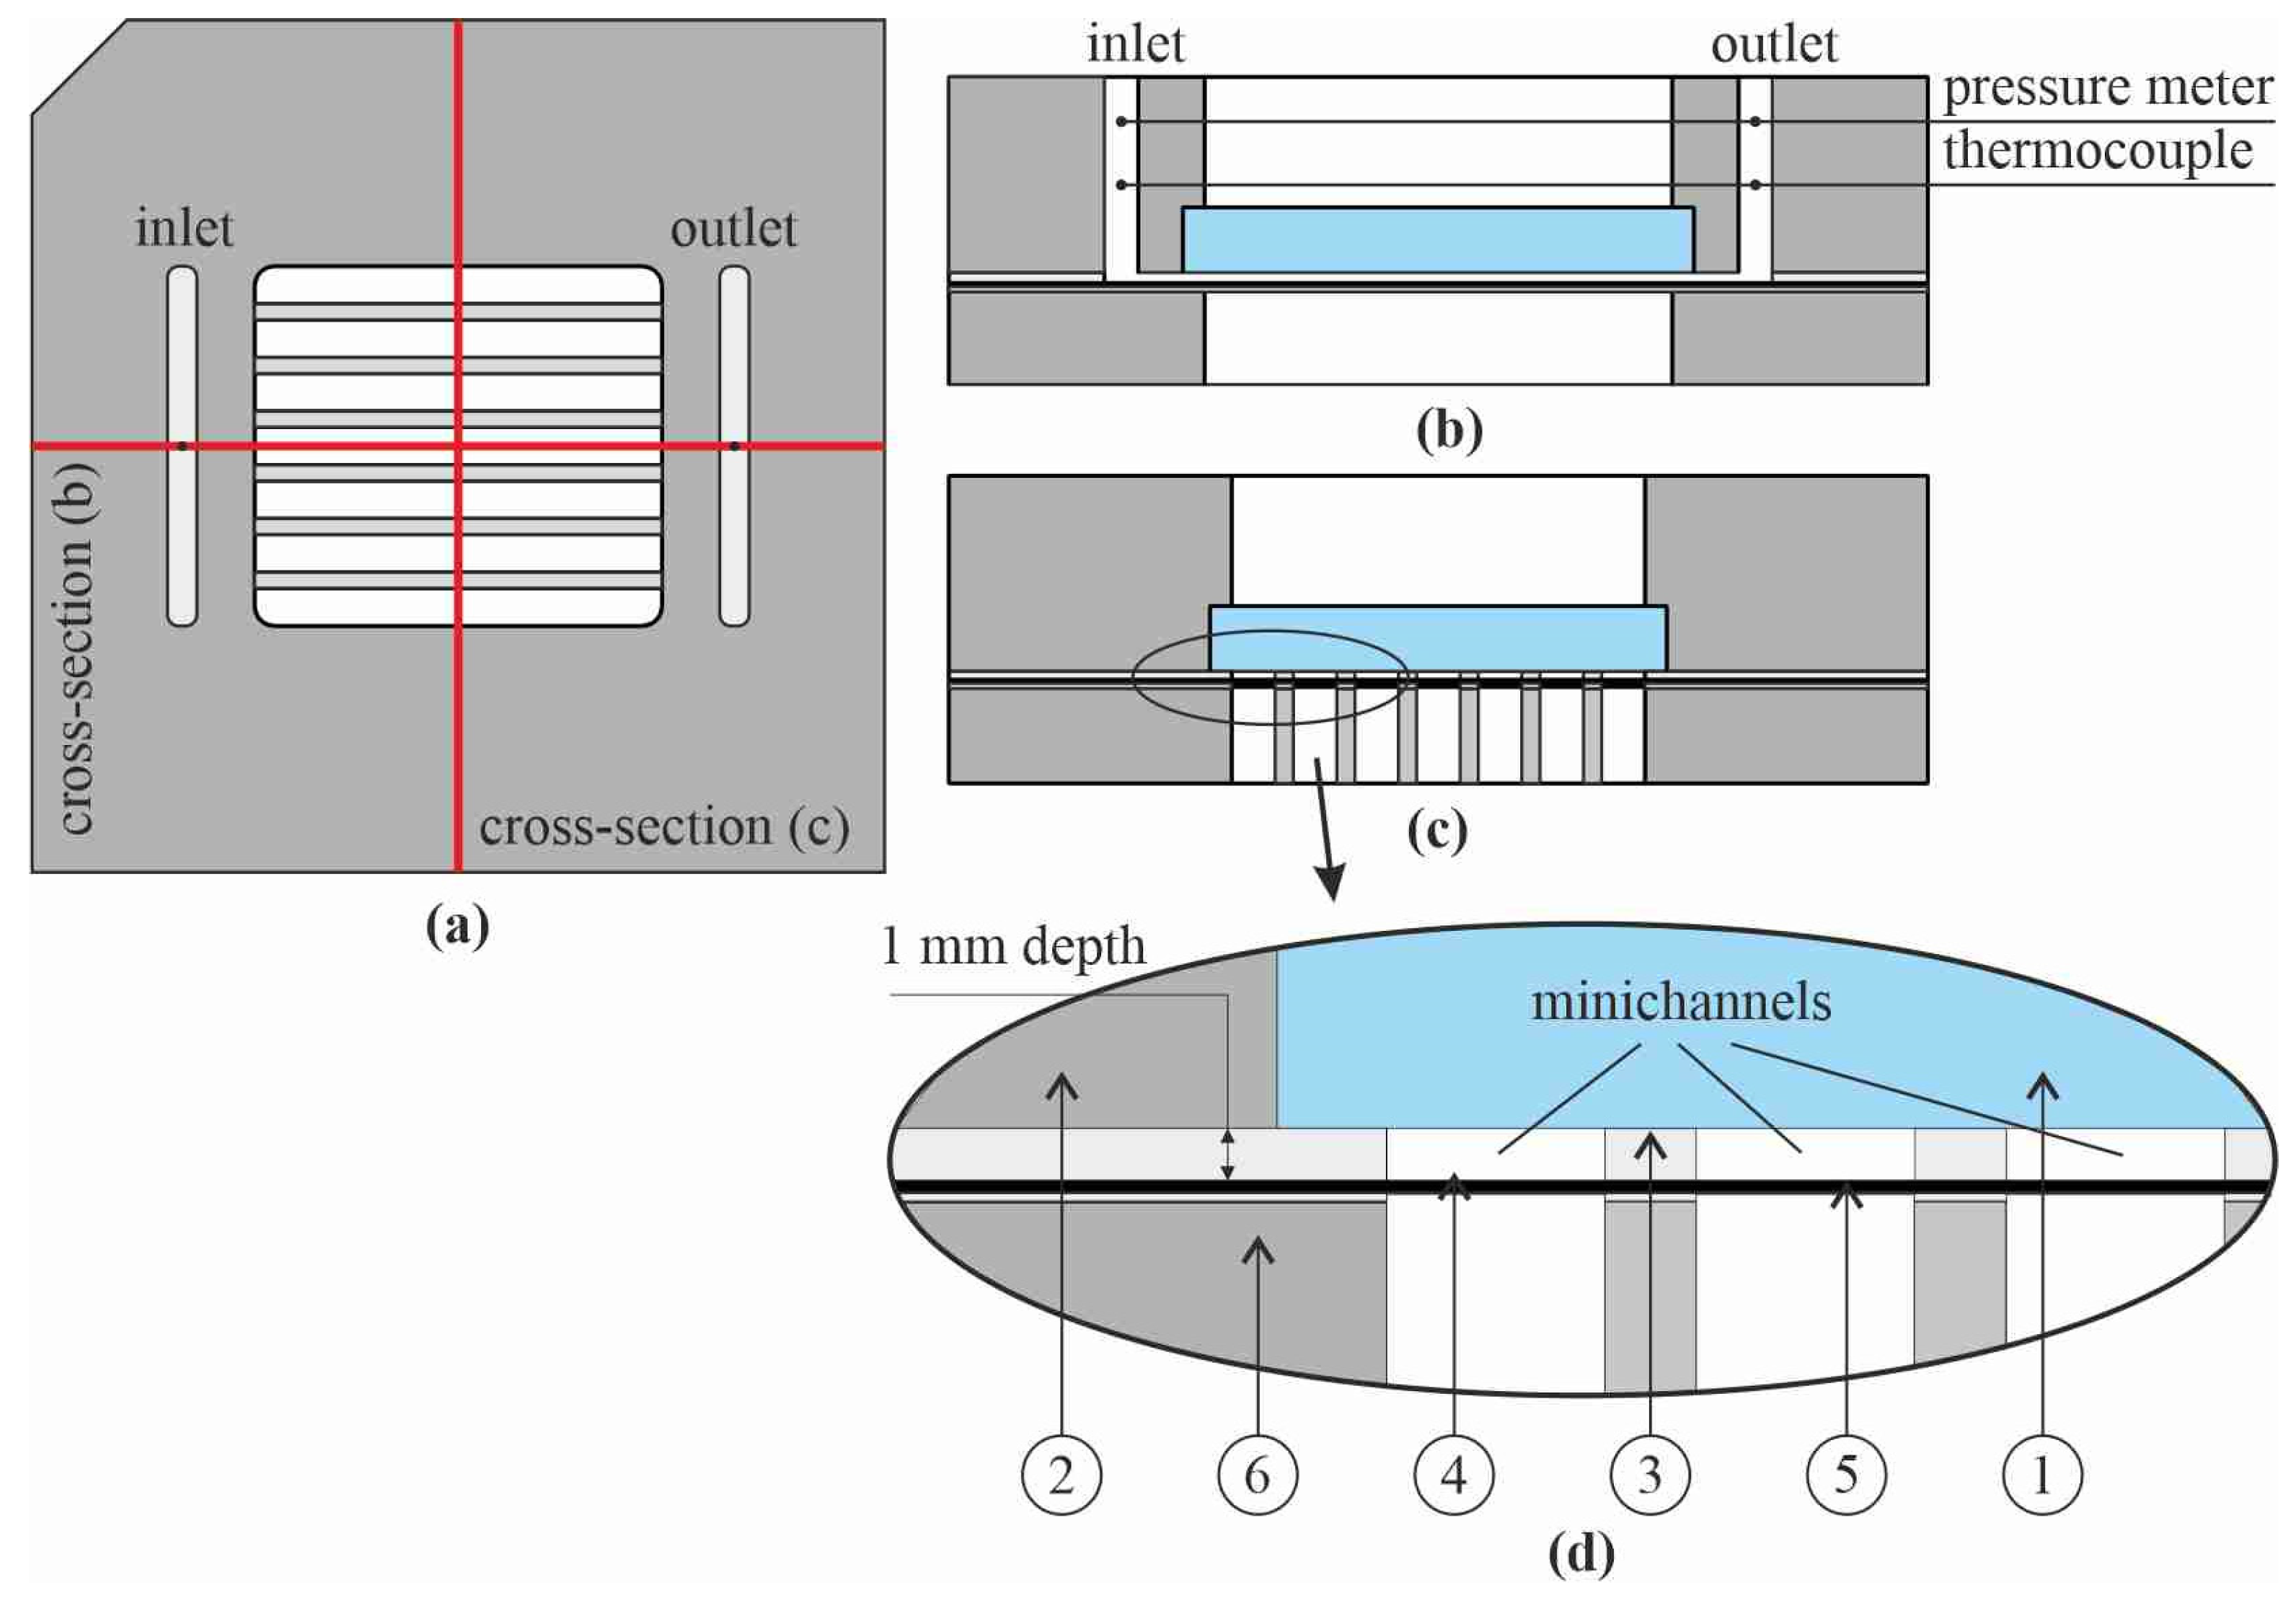
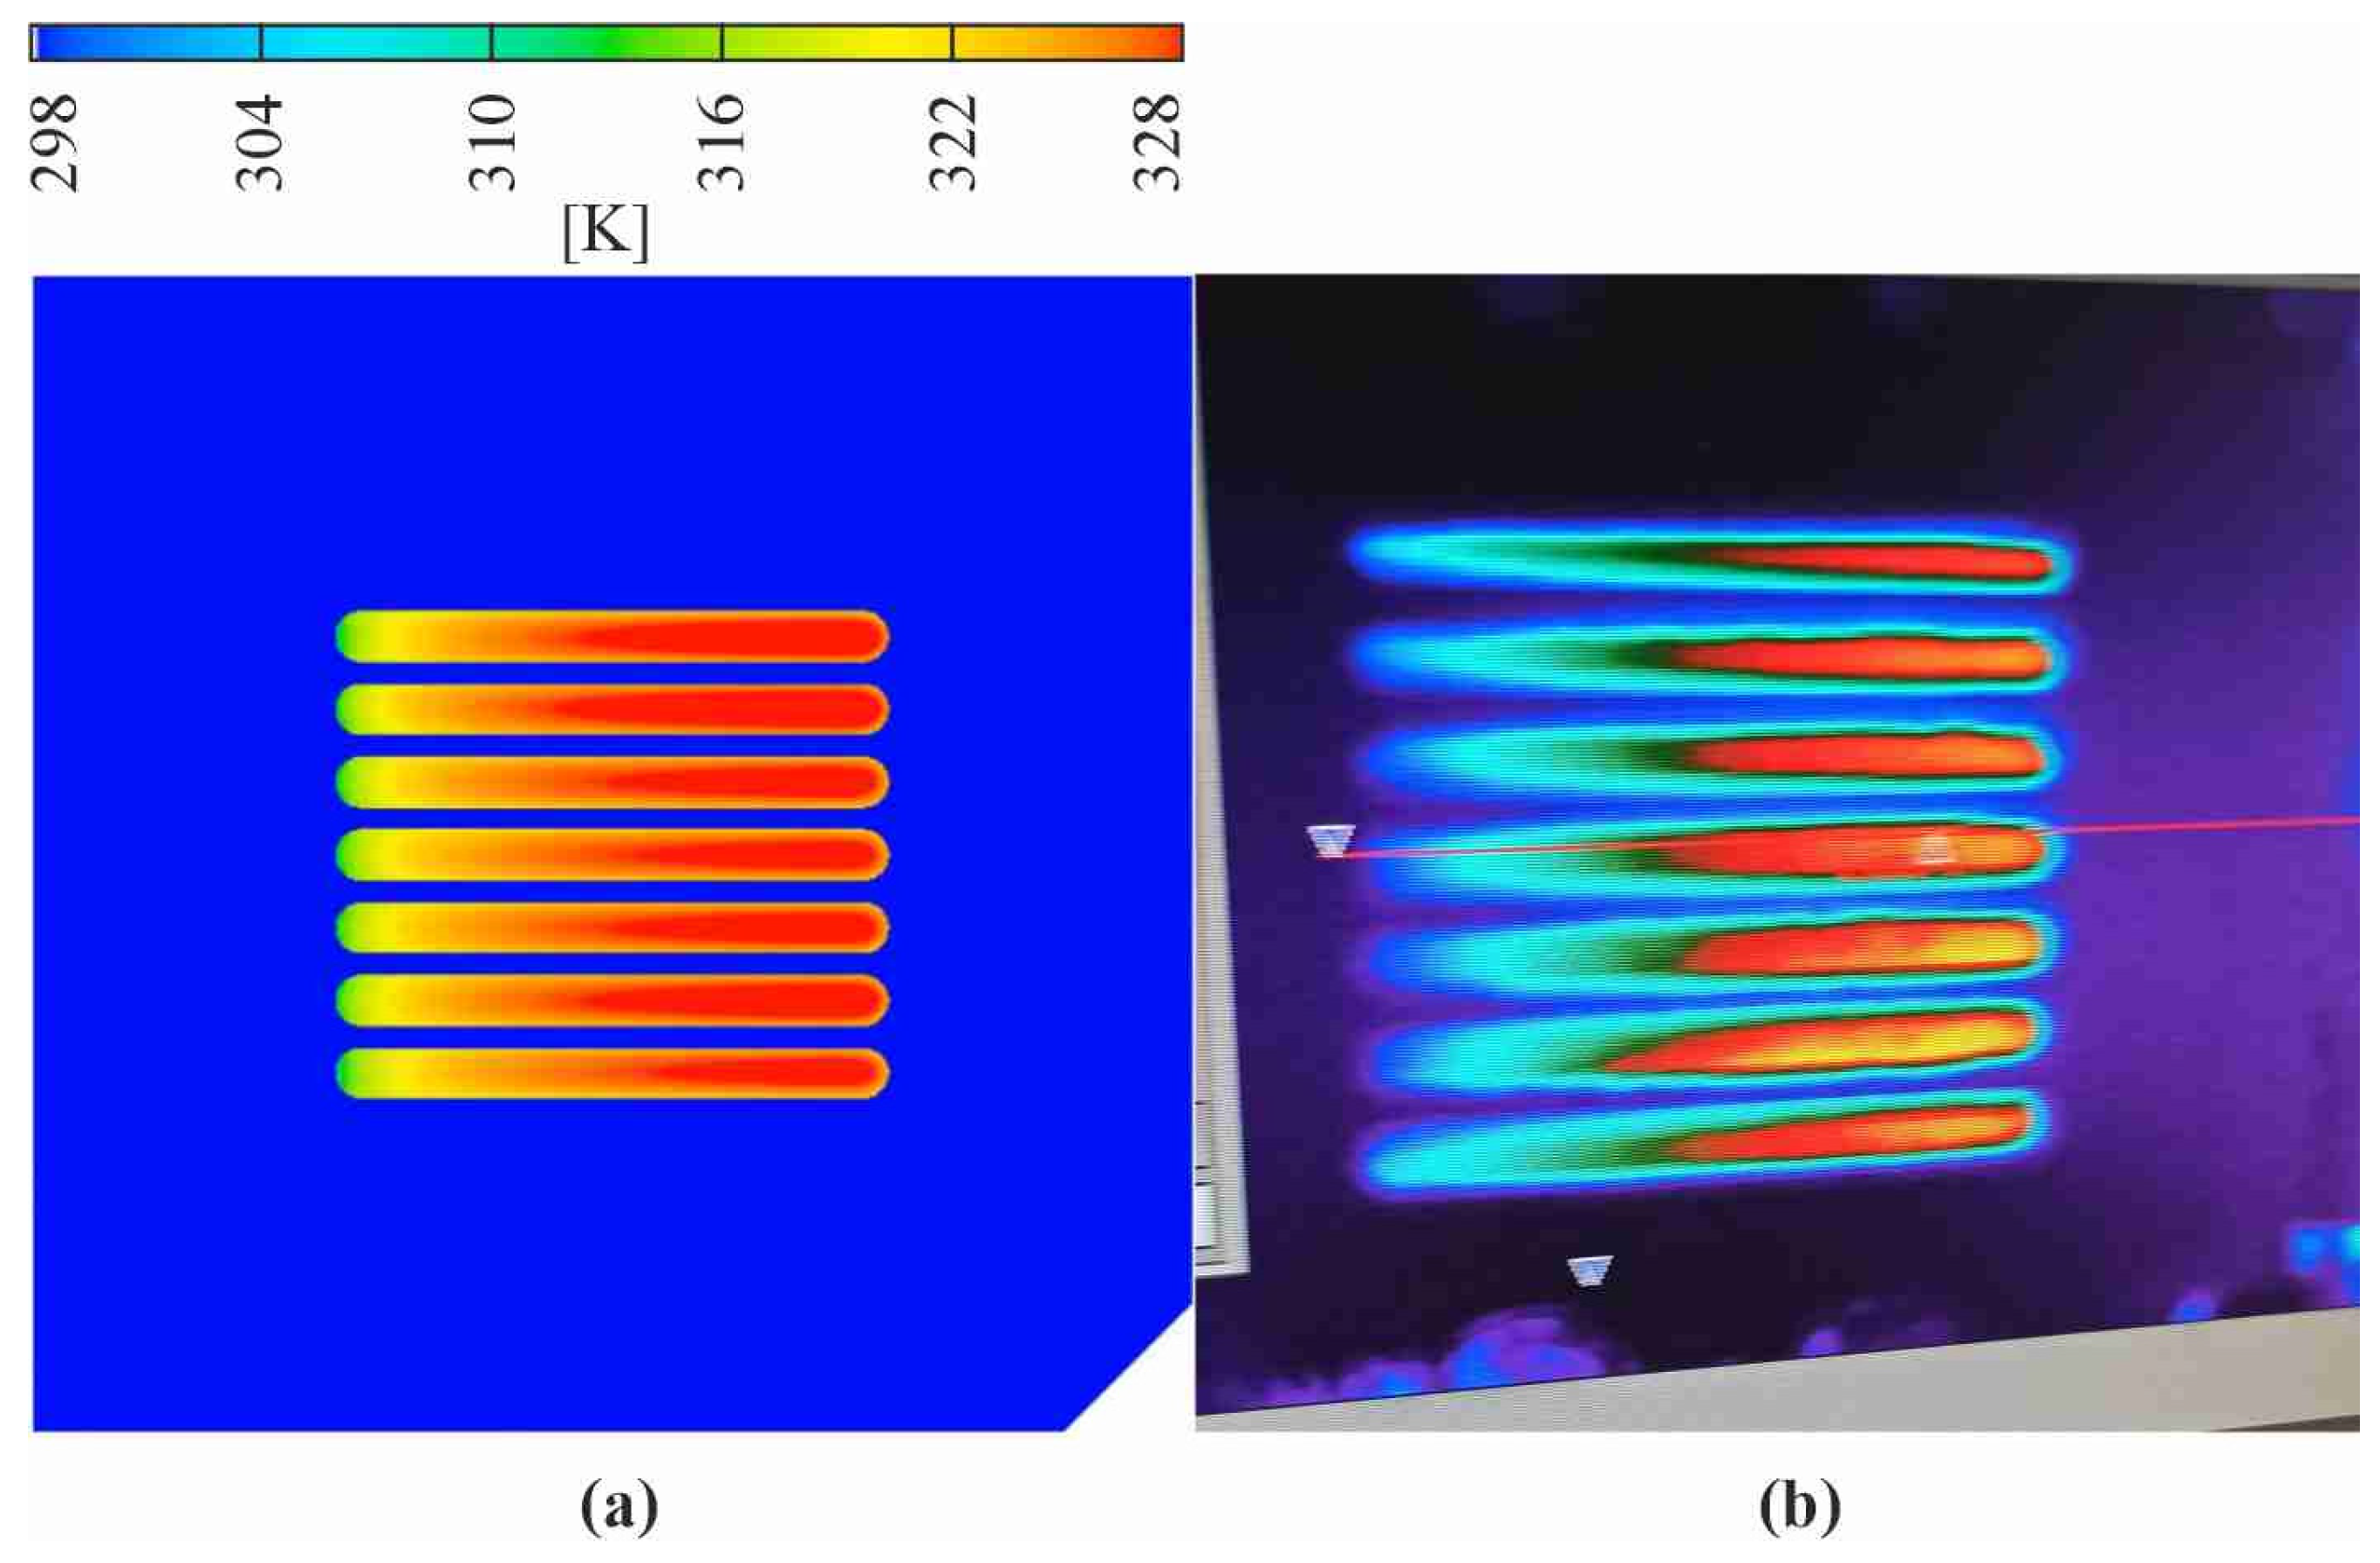
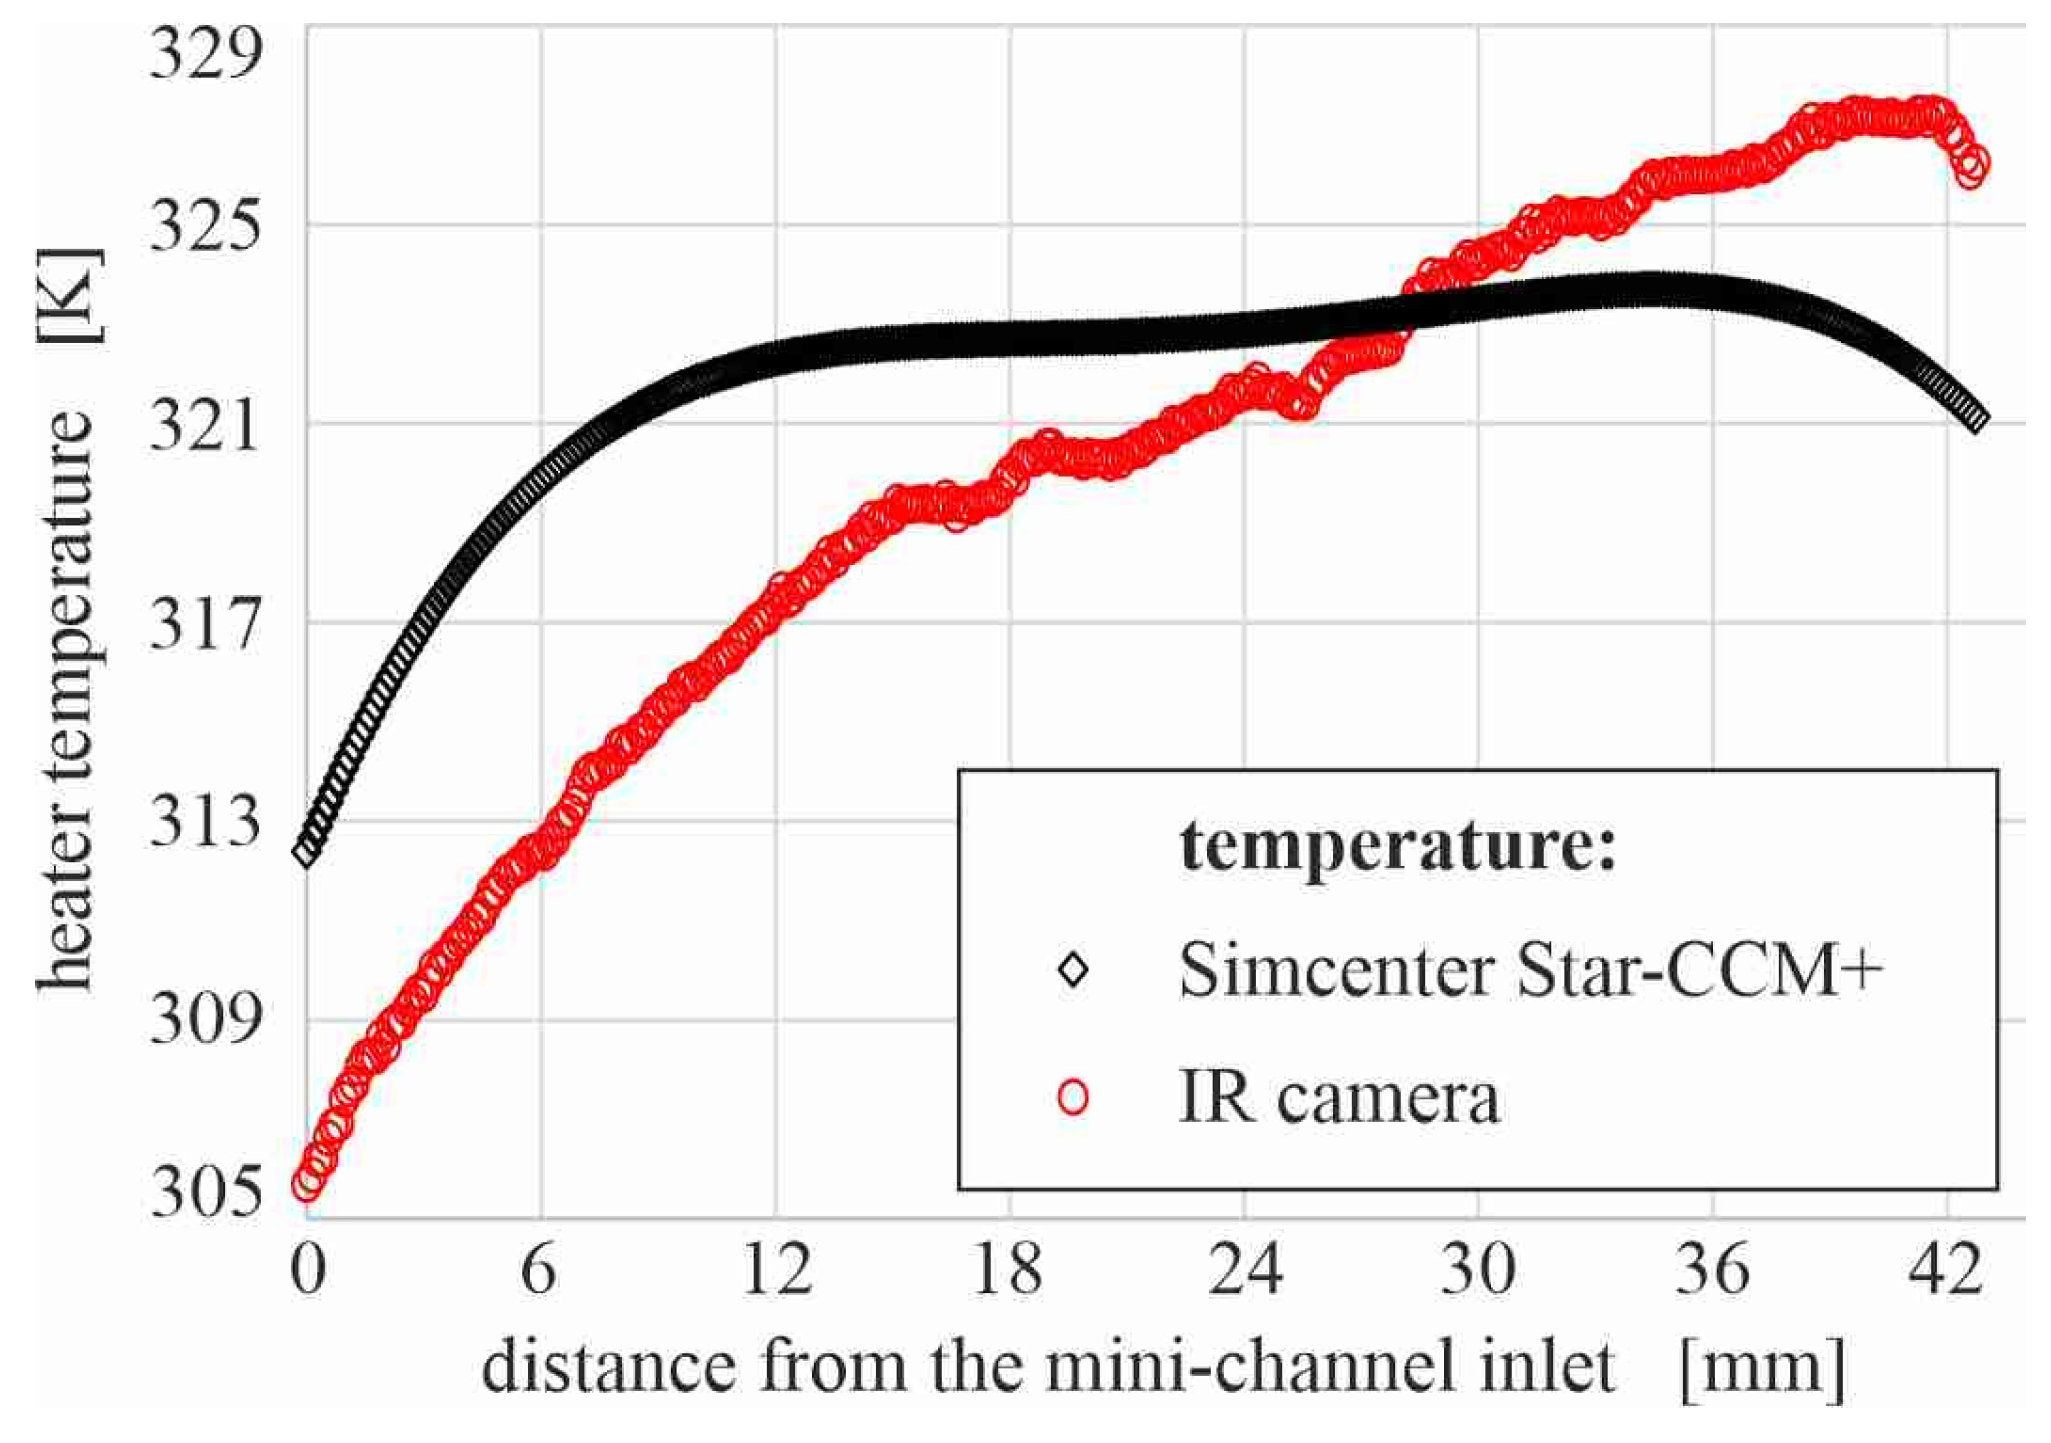
This work presents the results of CFD modeling of fluid flow and heat transfer performed in Simcenter STAR-CCM+ software. The results of the numerical simulations were confronted with the calculations using the data from the experiments. In the experimental rig, an essential element was a test section with mini-channels. The main parameters were measured during experiments, including measurement of the temperature distribution on the heater realized due to infrared thermography.
It is known that the heat transfer coefficient is primarily influenced by the fluid properties, mass flux, effective heat flux, channel geometry (cross-section area and aspect ratio), and spatial orientation of the flow. Finding the values of the parameters tested to evaluate the intensity of the heat transfer processes was the main goal of the numerical simulations. As the tested variables, the following were taken into consideration: the working fluid—two refrigerants (FC-72 and HFE-7100), heater material (Haynes-230 alloy, aluminum, and copper), the spatial orientation of the test section (vertical with fluid upflow and horizontal with fluid flow above the heater), and the number of mini-channels produced in the test section (7, 9, 11, and 15). The computations help indicate which parameters tested in terms of heat transfer turned out to be the most effective.
The results of the numerical computations were discussed. To ensure the convergence stability of the numerical computations of the selected problem, i.e., heat transfer during flow in mini-channels, a mesh dependency analysis based on the grid convergence index (GCI) was performed. Generally, the data presented showed satisfactory convergence of the results achieved as a result of the computational procedure.
The next investigation focuses on improving the proposed calculations with commercial software, i.e., to Simcenter STAR-CCM+ and also ANSYS CFX/Fluent and ADINA. The results of experimental research combined with the use of numerical computations including simulations are expected to expand the knowledge of heat transfer during the boiling of flows into mini-channel and micro-channel heat sinks within a wide range of parameters for various geometries and spatial orientations of the channels. Confronting the numerical simulations with the data from the experiments helps to verify the correctness of the numerical computations. The results of numerical simulations are useful for designing mini-channel heat exchangers. Their main advantage is that they do not require a large number of experiments, which makes them much cheaper and less time-consuming. If the validation of the numerical results by comparison with the experimental results is adequately ensured, it can be assumed that they are also reliable.


