Article

Performance Analysis of Integrated Photovoltaic-Thermal and Air Source Heat Pump System through Energy Simulation

Department of Architectural Engineering, Pusan National University, 2 Busandaehak-ro 63, Geomjeong-gu, Busan 46241, Korea
*
Author to whom correspondence should be addressed.
Energies 2022, 15(2), 528; https://doi.org/10.3390/en15020528
Submission received: 22 November 2021 / Revised: 10 January 2022 / Accepted: 10 January 2022 / Published: 12 January 2022
(This article belongs to the Special Issue Renewable Energy Systems for Buildings)

Abstract

:
The concept of zero energy buildings (ZEBs) has recently been actively introduced in the building sector, globally, to reduce energy consumption and carbon emissions. For the implementation of ZEBs, renewable energy systems, such as solar collectors, photovoltaic (PV) systems, and ground source heat pump (GSHP) systems, have been used. The system performance of solar collectors and PV systems are dependent on the weather conditions. A GSHP system requires a large area for boring machines and mud pump machines. Therefore, inhabitants of an existing small-scale buildings hesitate to introduce GSHP systems due to the difficulties in installation and limited construction area. This study proposes an integrate photovoltaic-thermal (PVT) and air source heat pump (ASHP) system for realizing ZEB in an existing small-scale building. In order to evaluate the applicability of the integrated PVT-ASHP system, a dynamic simulation model that combines the PVT-ASHP system model and the building load model based on actual building conditions was constructed. The heating and cooling performances of the system for one year were analyzed using the dynamic simulation model. As the simulation analysis results, the average coefficient of performance (COP) for heating season was 5.3, and the average COP for cooling season was 16.3., respectively. From April to June, the electrical produced by the PVT module was higher than the power consumption of the system and could realize ZEB.

1. Introduction

Recently, the reduction of carbon emissions, and energy consumption by heating and cooling requirements, have attracted urgent attention globally. Owing to this global trend, the policy of zero energy buildings (ZEBs) has shifted from the public to private sector. For the implementation of ZEBs, high-efficiency heating, and cooling air-conditioning systems based on heat pumps have been introduced together with renewable energy systems.
In the United States, heat pumps have been installed in more than 40% of new single-family dwellings, and approximately 50% of multi-family buildings. France, Italy, and Spain, account for half the European heat pump market; Sweden, Finland, and Norway, show high penetration rates corresponding to more than 24 units per 1000 households, annually [1]. In addition, heat pumps have been actively applied for building heating and cooling in northeast Asia: China, Japan, and the Republic of Korea.
The utilization and applications of heat pumps have accelerated, since heat pumps exhibit low carbon emissions and higher energy efficiencies than conventional heating and cooling systems based on fossil fuels.
The air source heat pump (ASHP) systems that use air as a heat source are the most widely used pumps for applications in buildings, owing to easy installation and maintenance. In mild climates, they are more economical than conventional heating and cooling systems, and they can provide a higher coefficient of performance (COP) [2]. However, it is difficult to obtain a high COP in very hot or cold climate using ASHP systems [3]. To overcome this, ground source heat pump (GSHP) systems, which provide a stable performance irrespective of the climatic conditions, have been introduced to buildings as space heating and cooling systems [4]. However, in this system, an imbalance between the heating and cooling demands of a building changes the underground temperature [5]. This negatively affects the subsurface environment, degrades the heating and cooling performance of GSHP, and causes system failure.
To overcome these limitations, integrated systems with other renewable energy sources have been developed: solar assisted ASHP (SAASHP) and GSHP (SAGSHP) systems can support the air and hot water demands of a building through solar collectors, as well as recover the ground temperature lowered by the GSHP operation during winter [6,7].
The energy efficiency of such integrated systems has been verified by many comparative studies between the performances of the integrated systems, and ASHP (and GSHP) systems. The heating COP of SAASHP and SAGSHP systems was reportedly improved by 10–65% [8,9,10]. Moreover, the improvement of equipment configuration and design method have been proposed for SAASHP and SAGSHP, in addition to performance analysis according to operation strategies [11,12,13].
However, to respond to the electricity demand required for maintenance, including the heating, cooling, and hot water demands of the building, the system must produce electricity by itself. In addition, the electrical production of the system is essential for ZEB realization. To this end, a photovoltaic-thermal (PVT) module (combination of PV panel and solar collector) that can produce heat and power, simultaneously, was developed. Since a PVT module cannot fully respond to the air conditioning and hot water demands of the building, the integrated systems combined with ASHP and GSHP systems have been studied extensively.
Kamel et al. [14] proposed the building integrated photovoltaic-thermal (BIPV/T) coupled with ASHP system for net ZEB. The warm air generated in the BIPV/T array was utilized as the source of the heat pump. Accordingly, the BIPV/T-ASHP coupling system indicated a high performance during the harsh winter season. The COP of the BIPV/T-ASHP coupling system could be increased to a maximum of 3.45. Further, the power consumption of the heat pump was reduced by 20%. Cao et al. [15] developed the PV/T-ASHP integrated heating system based on the characteristics of air–heat transfer media and solar radiation heat transfer mechanism. The performance of the integrated heating system was analyzed by the TRNSYS transient simulation tool. The simulation showed that the PV/T could supply a temperature of up to 77 °C, and the ASHP COP was 4.1, which improves the heating efficiency of the integrated heating system. Wang et al. [16] proposed PV/T-air composite heat pump hot water system. The system comprised a flat plate solar PV/T collector with a micro-channel heat pipe and an ASHP. The average heat pump COP was approximately 3.0, and the system COP ranged between 1.3–6.1. These results indicate the system to be a beneficial application for buildings.
On the other hand, Sommerfeldt and Madani [17] analyzed the technical and economic performance parameters of a GSHP system, with PVT collectors in series connection, for multi-family houses in a heating dominated climate. The ground heat exchanger (GHEX) length could be decreased, and installation area saved by PVT collector which could be up to 89%. Jeong et al. [18] comparatively analyzed the performance of the integrated system combined with PVT and GSHP, and a conventional GSHP system, using energy simulation. Based on these results, an economic analysis was conducted, considering various installation conditions such as weather condition and building load. The COP of the GSHP system was confirmed to be 2.76, and that of the integrated system was confirmed to be 6.26, during three days of a heating dominated cycle. The integrated system could decrease the power consumption through the PVT module. The initial investment cost of the integrated system was higher than the GSHP system. However, the annual energy cost was low, and the investment cost could be recovered after seven years. Abu-Rumman et al. [19] proposed a PVT-GSHP integrated system as a solution for electricity shortage and high electricity consumption while heating for buildings in Jordan. The performance analysis of the PVT-GSHP system through energy simulation revealed that the PVT-GSHP system reduced the temperature of the PV panel by more than 20 °C, and improved the electrical efficiency by 9.5%. Moreover, the average COP of the heat pumps increased from 4.6 to 6.2 during the heating dominated season because of the PVT module.
Kang et al. [20] developed and analyzed two systems with conventional (chiller and boiler) and tri-generation that consisted of a ground-to-air heat exchanger, PVT module and air-to-water heat pump through the energy simulation. The performance of the tri-generation system was compared to the conventional system. As the simulation result, the tri-generation system was saved maximum 45% of primary annual energy compared to conventional system. Moreover, the CO2 eq emission was reduced by 82%. The tri-generation system could successfully contribute to energy saving and decarbonization at the residential level. Conti et al. [21] proposed a design methodology for PVT module with a reversible heat pump based on the dynamic simulation considering building energy demand, thermal and electrical energy production and power consumption of the system. Kashan et al. [22] proposed the microchannel based hybrid PVT module (MCPVT) and was constructed mathematical models using energy simulation. Moreover, the water-to-water heat pump was combined with MCPVT. The performance of the system was compared with that of a conventional solar thermal collector-based system. The energy performance of the MCPVT system achieved a 10–35% higher than the conventional solar thermal system. Table 1 shows the summary of the previous studies analytical approach method and results.
In previous studies, the energy performance of the PVT-ASHP (or GSHP) integrated system was estimated and its applicability to buildings was evaluated through energy simulation. However, the accurate estimation of the energy performance and applicability of an integrated system requires the consideration of the overall energy situation of the building and installation condition for real application. Most of previous studies are simply at the analytical stage of individual system performance. There are no studies that comprehensively consider the local conditions, building load and actual building application of the system.
It is practically difficult to install large equipment such as boring machines and mud pump machines due to the limited construction area for applying GSHP to small-scale buildings. In addition, civil complaints may arise due to noise and traffic congestion during geothermal construction. Therefore, the inhabitants of small-scale buildings hesitate to introduce GSHP systems, owing to the additional cost to introduce such systems and efforts to resolve complaints.
Therefore, in this study, to encourage the use of renewable energy systems for the heating and cooling requirements of existing buildings, an integrated PVT-ASHP system was proposed, which is easier to install and apply than GSHP. In order to evaluate the applicability of the integrated PVT-ASHP system to existing small-scale building, a dynamic simulation model that combines the PVT-ASHP system model and the building load model based on actual building conditions was constructed. The dynamic simulation model was constructed using TRNSYS software, which can freely configure each component as defined by the user and measure the energy flow dynamically.
Moreover, the heating and cooling performance of the PVT module, ASHP and the system that was based on local condition and building load were dynamically analyzed using the dynamic simulation model. In particular, it was confirmed that the system including PVT module and ASHP was accurately operated based on local condition, building load and operation strategies through the heating and cooling representative day analysis. After the representative day analysis, the monthly COP of the integrated PVT-ASHP system was quantitatively evaluated using the electrical production, power consumption and heat exchange rate of each component. The quantitative energy performance analysis results of this study are expected to be used as basic data for related workers to apply the use of the integrated PVT-ASHP system, in actual buildings.
This paper is organized in four main sections. Section 1 and Section 2 describe the literature review, research gap, and construction process of the dynamic simulation model. In addition, Section 3 and Section 4 describe the heating and cooling performance results of the integrated PVT-ASHP system and conclusion.

2. Materials and Methods

2.1. Integrated PVT-ASHP System

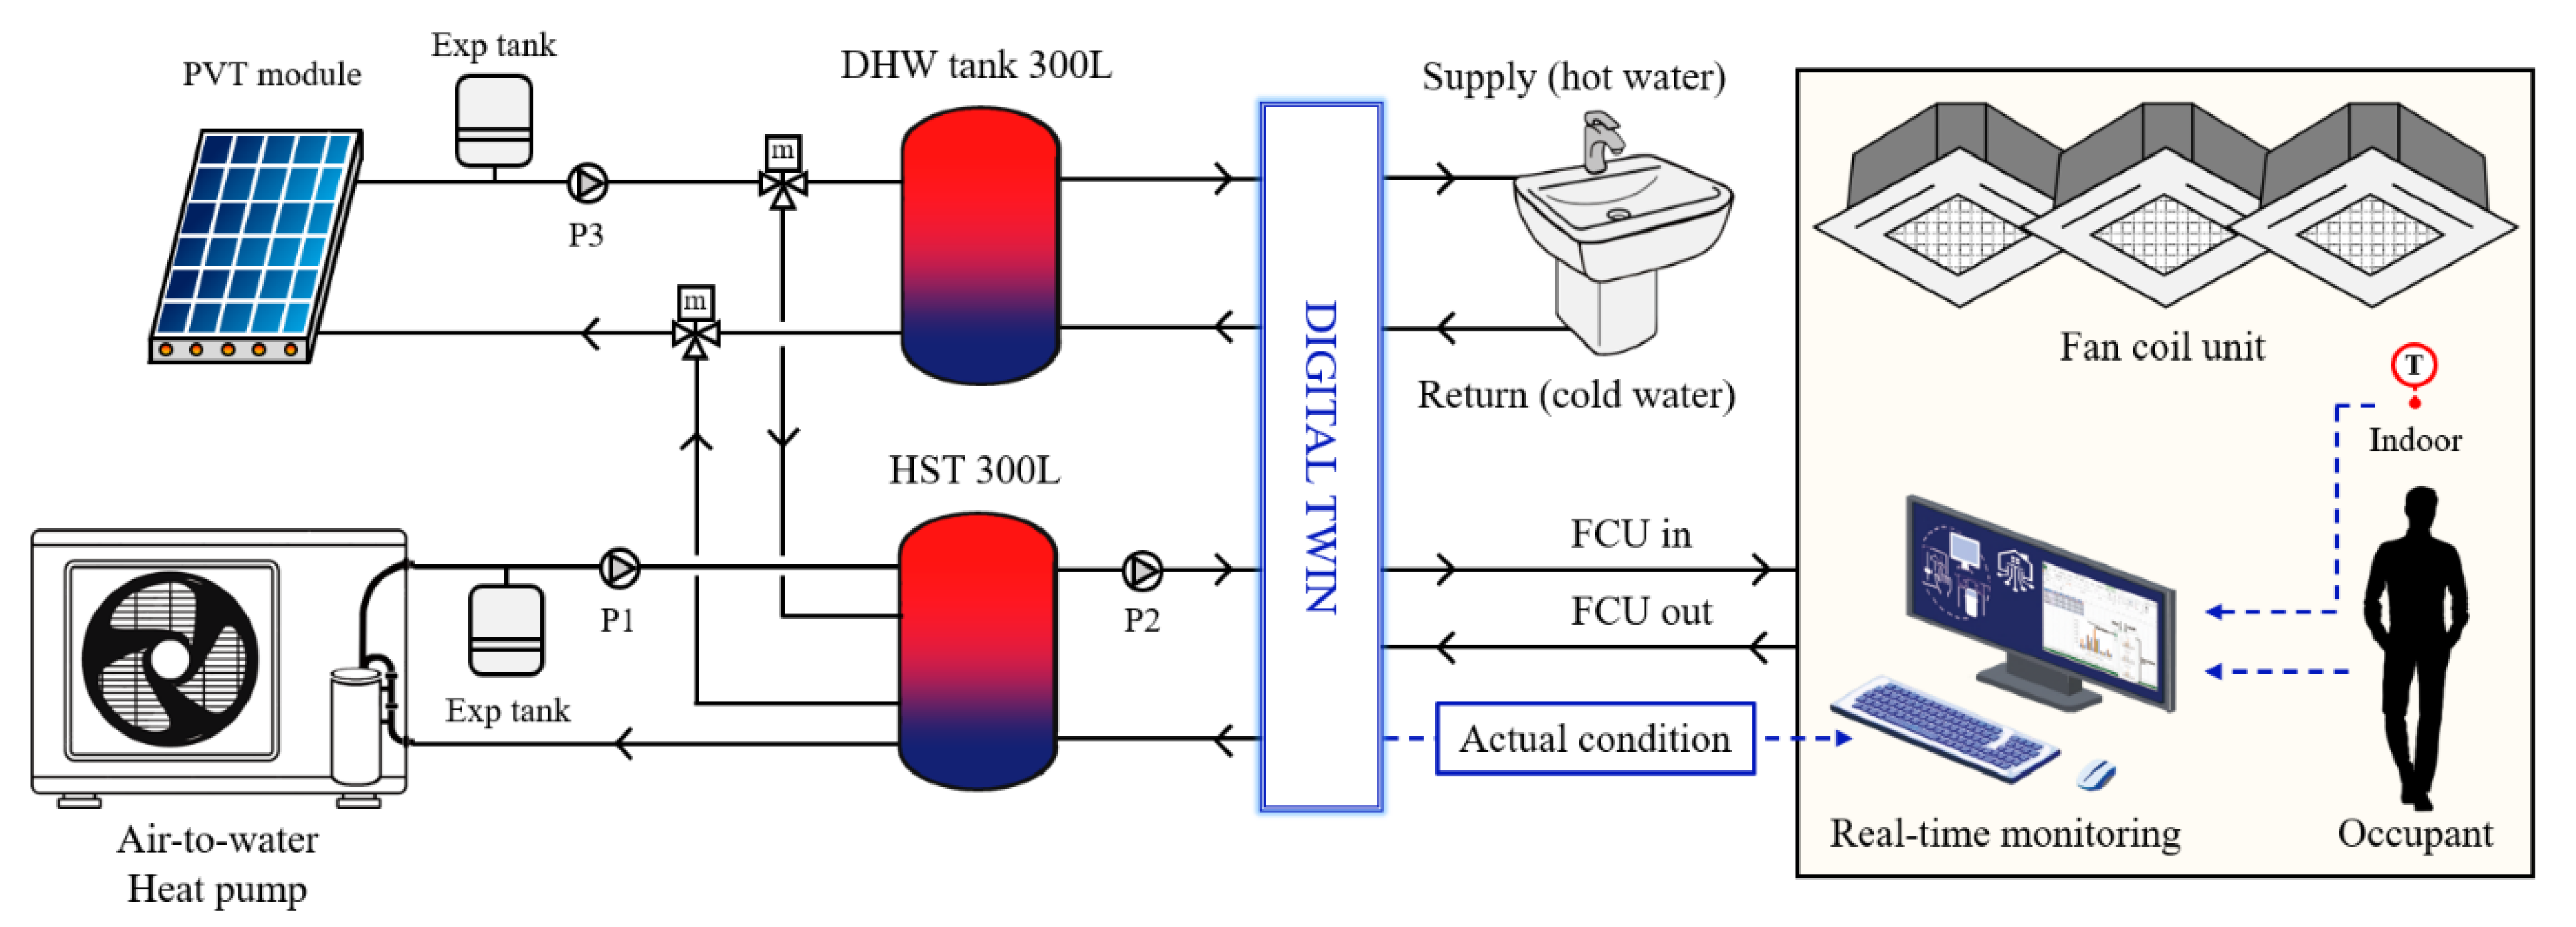
2.1.1. Overview of Integrated PVT-ASHP System

Figure 1 shows the schematic of the proposed integrated PVT-ASHP system. The system comprises a PVT module, a domestic hot-water (DHW) tank, a heat storage tank (HST), ASHP, a fan coil unit (FCU), and circulating pumps. Moreover, the real-time monitoring system is used to measure operation conditions such as weather condition, temperature and flow stream of equipment, and energy use and production condition.

2.1.2. Operation Strategies of Integrated PVT-ASHP System

The operation of the multi-source integrated PVT-ASHP system requires established operation strategies for the efficient use of heat sources. Therefore, in this study, operation strategies that utilize the PVT module extensively were established to respond to the simultaneous demands of heating, cooling, and hot water.
Figure 2 and Figure 3 show the operation strategies for the heating and cooling seasons. In the heating season, the integrated PVT-ASHP system performs both heating and heat storage operations. The heating operation begins when the indoor temperature is lower than 20 °C. If the temperature of the HST is 43 °C or higher, the heating operation conducts using HST.
However, when the temperature of the HST is lower than 42 °C, the heat storage operations start using PVT module and heat pump. Among the heat storage operations, the PVT module use preferentially. In order to utilize the PVT module, the outlet temperature of the PVT module should be higher than HST temperature. However, when the PVT module could not be used due to weather conditions, the heat storage operation is conducted using heat pump. Meanwhile, the heat storage of the DHW tank is performed only using the PVT module, for which the outlet temperature of the PVT module must be higher than 58 °C.
During the cooling season, the operations of cooling, cool storage, and heat storage, are performed simultaneously. If the indoor temperature lower than 24 °C, the cooling operation is conducted using HST. At this time, HST temperature should be higher than 12 °C. When the temperature of the HST is higher than 13 °C, the cool storage operation is started using heat pump. In the cooling season, the PVT module performs the heat storage of the DHW tank. The outlet temperature condition of the PVT module remains similar to the heating season.

2.2. Dynamic Simulation Model

2.2.1. Building Load Model

Figure 4 shows the building load model. The model was constructed by referring to the design of an actual building, for which the integrated PVT-ASHP system was considered. It was located in Busan city, Republic of Korea, its floor area was 110 m2, and the height from the floor to the ceiling was 3.9 m. The window to wall ratio according to the cardinal direction was 5.7% in the north, and 40% in the south. Table 2 shows the U-values of the building load model, which are based on the actual architectural drawing.
The building was considered to be a small-scale office, and the daily schedules of the occupants, lights, equipment, and integrated PVT-ASHP system were adopted from the ASHRAE Standard 90.1-2004 [23]. The ASHRAE Standards 55-2004, 90.1-2004, and 62.1-2004, were also referred to for indoor input conditions, for the calculation of the heating and cooling demands of the building load model [23,24,25]. Table 3 summarizes the input conditions of the building load model.
Figure 5 shows the monthly heating and cooling demands of the building load model. The annual heating and cooling demands were calculated to be 5543 and 1016 kWh, respectively. Moreover, the heating and cooling peak loads were found to be 15 and 3 kW, respectively. For the heating and cooling demand analyses, the weather data provided by the Korea Meteorological Administration for Busan city, Republic of Korea, were used. The annual average outdoor temperature was 14 °C, and the maximum and minimum temperatures were 26 °C and 2 °C, respectively.
The hot-water demand was adopted from the average daily DHW demand and daily DHW schedule of small-scale offices, proposed by ASHRAE [26]. The daily DHW demand was set to 26.6 L (3.8 L/person), considering the number of persons = 7 (Table 1).

2.2.2. Integrated PVT-ASHP System Model

The dynamic simulation model was constructed by referring to the components of the integrated PVT-ASHP system proposed in Section 2.1. Table 4 shows the component specifications of the integrated PVT-ASHP system. The PVT module comprised 10 panels measuring 1.012 × 1.972 m2. The reference condition of the photovoltaic cell was based on standard test condition suggested by IEC 60904 [27]. The air-to-water type heat pump was set to respond to the heating and cooling requirement of the heating and cooling demand of the building (Section 2.2.1). Therefore, the actual specification at the level of 11.36 kW was adopted for the heating and cooling design capacity of the heat pump, and FCU.
Figure 6 shows the dynamic simulation model developed for the integrated PVT-ASHP system. The TRNSYS 18 software was used for the dynamic analysis of the integrated PVT-ASHP system model. The integrated PVT-ASHP system model comprised a PVT module (type 560), ASHP (type 941), a DHW tank (type 4), HST (type 4), FCU (type 987), monitoring (type 65), and a coupled-controller, including the building load model (type 56), constructed in Section 3.1. In this study, the dynamic simulation model was constructed based on the integrated simulation model and analysis method of the previous study [28]. In previous study, the integrated simulation model and analysis method were verified through coefficient of variation of root mean square error proposed by ASHRAE Guideline 14 [29]. As a result, the integrated simulation model including building load model, PVT, and heat pump model was represented within 20% error under the real operation conditions.

2.2.3. Analysis Method

The PVT module (type 560) is an unglazed-water type module, in which the combination of a PV panel and solar absorber is used for the dual purpose of thermal and electrical generation. The PVT module uses the solar radiation incident on the surface of the PV panel for power generation, and the dissipated heat is transferred to the solar absorber in the form of heat energy. The solar absorber of this solar module was based on the algorithm presented in Chapter 6 of Duffie and Beckman’s ‘Solar Engineering of Thermal Processes’ [30]. The heat exchange rate and thermal efficiency by the solar absorber can be calculated from Equations (1) and (2), respectively, as follows:
Q ˙ P V T = m ˙ C p ( T P V T , o u t T P V T , i n )
η t h = Q ˙ P V T × A P V T G
The electrical efficiency of the PV panel is affected by linear factors related to the temperature and solar radiation [31]. The electrical production and efficiency of the PVT module can be expressed through Equations (3) and (4), respectively, as follows:
P ˙ P V T = ( τ α ) n I A M × G × A P V T × η e l
η e l = η n o m i n a l × X c e l l t e m p × X r a d i a t i o n
On the other hand, the ASHP component used in this study was modeled in single-stage, with a liquid stream on the load-side. The ASHP component could control the primary liquid stream by absorbing (heating season) or rejecting energy (cooling season) from an air-cooled condenser. The load-side was equipped with an optional auxiliary heater for heating a secondary liquid stream, which was not considered in this study. Moreover, this component is based on user-supplied data files, containing catalog data on capacity and power consumption, based on the inlet temperatures of source- and load-sides [32].
In the heating season, the power consumption by the compressor is calculated as the difference between the input from the data file and the power consumption of controller and blower. The compressor power, heat rejected by the condenser, and that absorbed by the evaporator are given by:
Q ˙ c o n d e n s = Q ˙ c a p
Q ˙ e v p = Q ˙ c a p P ˙ c o m p r e s s o r
Q ˙ l i q = Q ˙ c o n d e n s
In the cooling season, the compressor power, the heat absorbed by the evaporator, and that rejected by the condenser are related as:
Q ˙ c o n d e n s = Q ˙ c a p + P ˙ c o m p r e s s o r
Q ˙ e v p = Q ˙ c a p
Q ˙ l i q = Q ˙ e v p
Furthermore, the COP of the ASHP is given by:
C O P = Q ˙ l i q P ˙ c o m p r e s s o r + P ˙ b l o w e r + P ˙ c o n t r o l l e r
The integrated PVT-ASHP system model was controlled through a coupled-controller that combined circulating pumps (type 114), flow diverter (type 11), and differential temperature controller (type 2). The input of the coupled-controller comprised data from the signals of each controller, heating and cooling signals of ASHP and FCU, and the operation strategies of the heating and cooling seasons described in Section 2.2. The details of the flow diverter and differential temperature controller have been discussed in a previous study by the authors [29].

3. Results and Discussion

3.1. Thermal and Electrical Performance of PVT Module

Figure 7a shows the thermal performance of the PVT module on a representative day of the heating season. The daily total heat production of the PVT module was 1.2 kWh, and its maximum thermal efficiency was 6.5%. The PVT module supplied hot water at an average temperature of 21 °C to the DHW tank from 11 AM to 2 PM. In the Busan area, the maximum outlet temperature of the PVT module on the coldest day (representative day) was found to be 23 °C.
Figure 7b shows the thermal performance of the PVT module on the representative day of the cooling season. The daily total heat production of the PVT module was 6.8 kWh, and its maximum thermal efficiency was 25%. In the cooling season, the PVT module supplied hot water to the DHW tank for nine hours, and the temperature of the DHW tank reached 45 °C. The PVT module could maintain the DHW tank temperature at more than 40 °C from 1–5 PM.
In the cooling season, the PVT module could supply hot water to the DHW tank, at a temperature approximately 20 °C higher than that of the heating season. However, the PVT module could not meet the hot water temperature standard (60 °C), recommended by ASHRAE to prevent Legionella pneumophila [26]. Therefore, a low-capacity auxiliary heat source or heat pump for heat storage is required to response the hot water temperature standard.
Figure 8a,b show the electrical performance of the PVT module on the representative heating and cooling days. The daily total electrical production of the PVT module was 7.7 and 22.5 kWh in the heating and cooling seasons, respectively. The average electrical efficiency in the heating and cooling seasons were 14.1 and 13.3%, respectively.
In the cooling season, the temperature of the PVT module significantly increased owing to the high outdoor temperature (Figure 8). The increase in the temperature of the PVT module caused a reduction in electrical efficiency, however, exhibiting a large difference in electrical production, since the duration of sunlight was three hours longer in the cooling season than in the heating season.

3.2. Heating and Cooling Performance of Heat Pump

Figure 9a,b show the COP of the heat pump during the heating and cooling seasons. In the heating season and cooling seasons, the daily total heat production of the heat pump was 29 and 21 kWh, respectively, whereas the average COP was 3.4, and 4.0, respectively.
The heat production of the heat pump was determined by the setpoint temperature of HST, and the heating and cooling loads of the building. In the heating season, the temperature of HST fluctuated due to the fluctuating heating load requirement in the morning, and the heat storage by the heat pump. The HST temperature decreased gradually by approximately 0.12 °C/h owing to the ambient temperature and heat loss of HST. Although a heating load occurred at 6 PM, the HST temperature was maintained at 43 °C due to the heat storage by the heat pump.
In the cooling season, the heat production of the heat pump or the temperature of HST rapidly changed before 9 AM and at 7 PM. From 9 AM to 6 PM, the heat production of the heat pump remained constant, and the HST temperature decreased to 7.8 °C. This indicates that the heat pump performed cold storage for a large fraction of time, to meet the setpoint temperature of HST on the representative day of the cooling season, as there was only a marginal cooling load.

3.3. Monthly Performance of Integrated PVT-ASHP System

Figure 10 shows the monthly COP of the heat pump. The annual average COP of the heat pump was 4.2. The average COP of the heating period was 4.1 and that of the cooling period was 4.3. The COP of the heat pump was high in intermediate seasons, and it reached up to 5.0 in April. The COP of the heat pump increased with decreasing cooling and heating loads.
Figure 11 shows the monthly COP of the integrated PVT-ASHP system. The COP of the integrated PVT-ASHP system can be calculated using Equation (12), considering the total heat production and power consumption of the system, as it performed cooling, heating, and heat and cold storage operations, in addition to the electrical production by the PVT module.
C O P S Y S = Q ˙ H P + Q ˙ P V T P ˙ H P + P ˙ F C U + P ˙ P U M P P ˙ P V T
The annual average COP of the system was 10.2. The average COP of the heating period was 5.3, and that of the cooling period was 16.3. This was caused by the improvement of the heat production and electrical production by the PVT module, as the solar radiation and outdoor temperature were higher in the cooling season than in the heating season. From April to June, the electrical production of the PVT module was higher than the power consumption of the system. This confirmed that the installation of the integrated PVT-ASHP system makes it possible to realize ZEBs in intermediate seasons.

4. Conclusions

In this study, to encourage the use of renewable energy systems for the heating and cooling requirements of existing buildings, an integrated PVT-ASHP system was proposed, which is easier to install and apply than GSHP. In order to evaluate the applicability of the integrated PVT-ASHP system to existing small-scale building, the annual energy performance of the PVT module, heat pump, and system was dynamically analyzed using the simulation model. The following conclusions can be drawn from the study:
(1)
In the heating and cooling seasons, the average outlet temperatures of the PVT module for the DHW tank were 21 °C and 37 °C, respectively. It was difficult for the PVT module alone to compensate for the hot water load during the heating season. However, the hot water load can be sufficiently handled with a low-capacity auxiliary heat source or DHW tank heat storage by using a heat pump.
(2)
The total electrical production of the PVT module was calculated to be 7.7 and 22.5 kWh on the representative heating and cooling days, respectively. The average electrical efficiency was found to be 14.1 and 13.3%, respectively. The electrical production of the PVT module in the cooling season was 14.8 kWh higher than that in the heating season. This could be attributed to the higher outdoor temperature and solar radiation, and because the sunlight duration was three hours longer in the cooling season than in the heating season.
(3)
On the representative heating and cooling days, the average COP of the heat pump was calculated to be 3.4 and 4.0, respectively. On the representative heating day, the HST temperature fluctuated owing to the heating load requirement in the morning and the heat storage operation of the heat pump. On the representative cooling day, the heat pump performed cold storage operation for a large fraction of time to meet the setpoint temperature of HST, as there was only a marginal amount of cooling load.
(4)
The average COP of the system during the heating and cooling seasons were 5.3 and 16.3, respectively. This could be attributed to the higher heat and electrical productions of the PVT module, in the cooling season than in the heating season. From April to June, the electrical production of the PVT module was higher than the power consumption of the system, confirming the possibility of ZEBs.
The quantitative energy performance analysis results of this study can be used as basic data for introducing stakeholders to the integrated PVT-ASHP system in actual buildings. In the future study, we will conduct the techno-economic performance and sensitivity analysis. Moreover, the long-term energy performance of the integrated PVT-ASHP system will be evaluated through the real-scale experiment.

Author Contributions

Writing—original draft preparation, S.B.; Formal analysis, S.B. and S.C.; Writing—review and editing, Y.N.; Supervision, Y.N. All authors have read and agreed to the published version of the manuscript.

Funding

This work is supported by the Korea Agency for Infrastructure Technology Advancement (KAIA) grant funded by the Ministry of Land, Infrastructure and Transport (Grant 21CTAP-C163595-01) and was supported by the National Research Foundation of Korea (NRF) grant funded by the Korea government (MSIT). (No.2021R1A2C2014259).

Conflicts of Interest

The authors declare no conflict of interest.

Nomenclature

A P V T Gross area of the PVT module [m2]
A p Area of ground storage [m2]
B Spacing distance [m]
C p Specific heat [J/kg·K]
C O P S Y S Coefficient of performance of integrated PVT-ASHP system [-]
G Solar radiation [W/m2]
I A M Incidence angle modifier [-]
m ˙ Flow rate [kg/s]
P ˙ c o m p r e s s o r Power consumption of compressor [W]
P ˙ b l o w e r Power consumption of blower [W]
P ˙ c o n t r o l l e r Power consumption of controller [W]
P ˙ P V T Electrical production of PVT module [W]
P ˙ H P Power consumption of heat pump [W]
P ˙ F C U Power consumption of fan coil unit [W]
P ˙ P U M P Power consumption of circulating pump [W]
Q ˙ c o n d e n s Heat exchange rate of condenser [W]
Q ˙ e v p Heat exchange rate of evaporator [W]
Q ˙ l i q Heat exchange rate of liquid stream [W]
Q ˙ H P Heat exchange rate of heat pump [W]
Q ˙ P V T Heat exchange rate of PVT module [W]
T g Ground temperature [°C]
T G H E X , i n Inlet temperature of ground heat exchanger [°C]
T G H E X , o u t Outlet temperature of ground heat exchanger [°C]
T P V T , i n Inlet temperature of PVT module [°C]
T P V T , o u t Outlet temperature of PVT module [°C]
V D S T Volume of ground heat exchanger [m3]
X c e l l t e m p Multiplier for the power efficiency as a function of the module temperature [m3]
X r a d i a t i o n Multiplier for the power efficiency as a function of the solar radiation [m3]
Greek symbols
β damping factor [-]
η e l Electrical efficiency of the PVT module [%]
ταTransmittance-absorbance of the PVT module [-]
Acronyms and abbreviations
A/CAir-conditioning
ASHPAir source heat pump
COPCoefficient of performance
DHWDomestic hot water
FCUFan coil unit
GSHPGround source heat pump
HERHeat exchange rate
HSTHeat storage tank
SAAHPSolar assisted air source heat pump
SAGSHPSolar assisted ground source heat pump
PVTPhotovoltaic-thermal
ZEBZero energy building

References

  1. IEA. Heat Pumps. 2021. Available online: https://www.iea.org/reports/heat-pumps (accessed on 22 November 2021).
  2. Kelly, J.A.; Fu, M.; Clinch, P. Residential home heating: The potential for air source heat pump technologies as an alternative to solid and liquid fuels. Energy Policy 2016, 98, 431–442. [Google Scholar] [CrossRef] [Green Version]
  3. Ding, Y.; Chai, Q.; Ma, G.; Jiang, Y. Experimental study of an improved air source heat pump. Energy Convers. Manag. 2004, 45, 2393–2403. [Google Scholar] [CrossRef]
  4. Mattinen, M.K.; Nissinen, A.; Hyysalo, S.; Juntunen, J.K. Energy use and greenhouse gas emissions of air-source heat pump and innovative ground-source air heat pump in a cold climate. J. Ind. Ecol. 2014, 19, 61–70. [Google Scholar] [CrossRef]
  5. Daemi, N.; Krol, M.M. Impact of building thermal load on the developed thermal plumes of a multi-borehole GSHP system in different Canadian climates. Renew. Energy 2019, 143, 550–557. [Google Scholar] [CrossRef]
  6. Liang, C.; Zhang, X.; Li, X.; Zhu, X. Study on the performance of a solar assisted air source heat pump system for building heating. Energy Build. 2011, 43, 2188–2196. [Google Scholar] [CrossRef]
  7. Oh, J.H.; Nam, Y. Study on the effect of ground heat storage by solar heat using numerical simulation. Energies 2015, 8, 13609–13627. [Google Scholar] [CrossRef] [Green Version]
  8. Li, H.; Liu, Y.F.; Guo, M.; Zhang, R.; Du, J. Heating performance investigations on two applications of a solar assisted air source heat pump system. Adv. Mater. Res. 2011, 374–337, 284–287. [Google Scholar] [CrossRef]
  9. Hwang, J.; Song, D.; Lee, T. The effect of coupling solar thermal system and geothermal heat pump systems in areas with unbalanced heating and cooling demand. Energies 2021, 14, 31. [Google Scholar] [CrossRef]
  10. Yu, M.G.; Nam, Y.; Yu, Y.; Seo, J. Study on the system of a solar assisted ground heat pump system using dynamic simulation. Energies 2016, 9, 291. [Google Scholar] [CrossRef] [Green Version]
  11. Long, J.; Xia, K.; Zhong, H.; Lu, H.; Yongga, A. Study on energy-saving operation of a combined heating system of solar hot water and air source heat pump. Energy Convers. Manag. 2021, 229, 113624. [Google Scholar] [CrossRef]
  12. Meena, C.W.; Raj, B.P.; Saini, L.; Agarwal, N.; Ghosh, A. Performance optimization of solar-assisted heat pump system for hot-water applications. Energies 2021, 14, 3534. [Google Scholar] [CrossRef]
  13. Huan, C.; Li, S.; Wang, F.; Liu, L.; Zhao, Y.; Wang, Z.; Tao, P. Performance analysis of a combined solar-assisted heat pump heating system in Xi’an, China. Energies 2019, 12, 2515. [Google Scholar] [CrossRef] [Green Version]
  14. Kamel, R.; Ekrami, N.; Dash, P.; Fung, A.; Hailu, G. BIPV/T+ASHP: Technologies for NZEBs. Energy Procedia 2015, 78, 424–429. [Google Scholar] [CrossRef] [Green Version]
  15. Cao, C.; Li, H.; Feng, G.; Zhang, R.; Huang, K. Research on PV/T–air source heat pump integrated heating system in severe cold region. Procedia Eng. 2016, 146, 410–414. [Google Scholar] [CrossRef] [Green Version]
  16. Wang, G.; Quan, Z.; Zhao, Y.; Xu, P.; Sun, C. Experimental study of a novel PV/T-air composite heat pump hot water system. Energy Procedia 2015, 70, 537–543. [Google Scholar] [CrossRef] [Green Version]
  17. Sommerfeldt, N.; Madani, H. In-depth techno-economic analysis of PV/Thermal plus ground source heat pump systems for multi-family houses in a heating dominated climate. Sol. Energy 2019, 190, 44–62. [Google Scholar] [CrossRef]
  18. Jeong, Y.D.; Yu, M.G.; Nam, Y. Feasibility study of a heating, cooling and domestic hot water system combining a photovoltaic-thermal system and a ground source heat pump. Energies 2017, 10, 1243. [Google Scholar] [CrossRef] [Green Version]
  19. Abu-rumman, M.; Hamdan, M.; Ayadi, O. Performance enhancement of a photovoltaic-thermal (PVT) and ground-source heat pump system. Geothermics 2020, 85, 101809. [Google Scholar] [CrossRef]
  20. Kang, E.C.; Lee, E.J.; Ghorab, M.; Yang, L.; Entchev, E.; Lee, K.S.; Lyu, N.J. Investigation of energy and environmental potentials of a renewable trigeneration system in a residential application. Energies. 2016, 9, 760. [Google Scholar] [CrossRef] [Green Version]
  21. Conti, P.; Schito, E.; Testi, D. Cost-benefit analysis of hybrid photovoltaic/thermal collectors in a nearly zero-energy building. Energies 2019, 12, 1582. [Google Scholar] [CrossRef] [Green Version]
  22. Kashan, M.E.; Fung, A.S.; Swift, J. Integrating novel microchannel-based solar collectors with a water-to-water heat pump for cold-climate domestic hot water supply, including related solar systems comparisons. Energies 2021, 14, 4057. [Google Scholar] [CrossRef]
  23. Standard 90.1-2004; Energy Standard for Buildings Except Low-Rise Residential Buildings. ASHRAE: Atlanta, GA, USA, 2004.
  24. ASHRAE Standard 55-2004; Thermal Environment Conditions for Human Occupancy. ASHRAE: Atlanta, GA, USA, 2004.
  25. ASHRAE Standard 62.1-2004; Ventilation for Acceptable Indoor Air Quality. ASHRAE: Atlanta, GA, USA, 2004.
  26. ASHRAE. 2003 HVAC Applications Handbook; ASRHAE: Atlanta, GA, USA, 2003. [Google Scholar]
  27. International Electrotechnical Commission. Photovoltaic Device–Part 1: Measurement of Photovoltaic Current-Voltage Characteristics; IEC: Geneva, Switzerland, 2020. [Google Scholar]
  28. Bae, S.; Nam, Y. Comparison between experiment and simulation for the development of a Tri-generation system using photovoltaic-thermal and ground source heat pump. Energy Build. 2021, 231, 110623. [Google Scholar] [CrossRef]
  29. ASHRAE. Measurement of Energy, Demand, and Water Savings; ASHRAE Guideline 14-2014; ASHRAE: Atlanta, GA, USA, 2014. [Google Scholar]
  30. Duffie, J.A..; Beckman, W.A. Solar Engineering of Thermal Process, 4th ed.; John Wiley & Sons, Inc.: Hoboken, NJ, USA, 2013. [Google Scholar]
  31. TRNSYS 17. Electrical Library Mathematical Reference; TESS Libs 17: Milwaukee, WI, USA, 2012; Volume 3. [Google Scholar]
  32. TRNSYS 17. HVAC Library Mathematical Reference; TESS Libs 17: Milwaukee, WI, USA, 2012; Volume 6. [Google Scholar]
Figure 1. Schematic of the integrated system with photovoltaic-thermal and air source heat pump.
Energies 15 00528 g001
Figure 2. Operation strategies during the heating season.
Energies 15 00528 g002
Figure 3. Operation strategies during the cooling season.
Energies 15 00528 g003
Figure 4. Building load model.
Energies 15 00528 g004
Figure 5. Monthly heating and cooling demand of the building load model.
Energies 15 00528 g005
Figure 6. Dynamic simulation model of the integrated PVT-ASHP system.
Energies 15 00528 g006
Figure 7. Thermal performance of the PVT module; (a) heating season, (b) cooling season.
Energies 15 00528 g007
Figure 8. Electrical performance of the PVT module; (a) heating season, (b) cooling season.
Energies 15 00528 g008
Figure 9. Coefficient of performance (COP) of the heat pump; (a) heating season, (b) cooling season.
Energies 15 00528 g009aEnergies 15 00528 g009b
Figure 10. Monthly COP of the heat pump.
Energies 15 00528 g010
Figure 11. Monthly COP of the integrated PVT-ASHP system.
Energies 15 00528 g011
Table 1. Summary of the previous studies analytical approach method and results.
Ref.SystemApproachLocationResults
[14]BIPV/T-ASHPSimulationToronto, CanadaSeasonal COP could be increased from 2.7 to 3.5
[15]PVT-ASHPSimulationShenyang, ChinaHeating COP of the ASHP varied from 3.6 to 4.9
[16]PVT-ASHPExperimentalBeijing, ChinaSystem COP ranged from 1.33 to 6.07
[17]PVT-GSHPSimulationStockholm, SwedenSystem SPF ranged from 1.8 to 3.4
[18]PVT-GSHPSimulationSeoul, South KoreaSystem SPF of the System varied from 4 to 10
[19]PVT-GSHPSimulationAmman, JordanHeating COP of the ASHP varied from 4.6 to 6.2
[20]GAHX-PVT-AWHPSimulationIncheon, South KoreaAverage system COP was 2.87
Table 2. U-value of the building load model.
Construction TypeU-Value (W/m2·K)
External wall0.284
External roof0.181
Ground floor0.355
Window1.51
Table 3. Building load model conditions.
ParameterValueReference
Heat generated by people70 W/m2ASHRAE Standard 55-2004
Number of persons7 peopleASHRAE Standard 90.1-2004
Light12.9 W/m2
Equipment8.1 W/m2
Plug6.8 W/m2
Setpoint temperatureCooling: 24 °C, Heating: 21 °C
Ventilation0.42 air changes per hour (ACH)ASHRAE Standard 62.1-2004
Infiltration0.002 ACH
Table 4. Component specifications of the integrated PVT-ASHP system.
ComponentNameValue
PVT moduleSize1.012 × 19.72 m2
Thermal conductivity386 W/m·K (Copper tube)
Number of tubes21
Tube diameter0.0109 m
Electrical efficiency16%
Slope45°
DirectionSouth
Heat pumpTypeAir to water
Heating capacity11.36 kW
Heating power consumption2.02 kW
Cooling capacity7.55 kW
Cooling power consumption2.03 kW
Storage tankVolume0.3 m3
Height1.0 m
Fan coil unitHeating capacity11.63 kW
Cooling capacity7.38 kW
Fan power consumption0.12 kW
Publisher’s Note: MDPI stays neutral with regard to jurisdictional claims in published maps and institutional affiliations.

