1. Introduction
Currently, the seriousness of global warming is emerging around the world, and many countries are making various efforts to reduce CO
2 emissions, the cause of global warming, through the Kyoto Protocol and the Paris Agreement on Climate Change [
1]. Historically, nuclear power generation has been converted from the traditional fossil fuel-based energy system to reduce the burden of fossil fuel depletion and environmental problems and is playing a leading role in the global electricity market. However, after the Chernobyl and Fukushima nuclear accidents, public preference for the nuclear power plants has declined due to safety concerns. In 40 out of 42 countries surveyed, the preference for nuclear power decreased, and some European countries have decided not to build additional nuclear power plants [
2,
3]. Reducing the development of nuclear power plants has raised expectations and capacity for new and renewable energy sources as an alternative [
4]. New energy that uses hydrogen or changes existing fossil fuels to be environmentally friendly is being put to practical use in the form of IGCC (Integrated Gasification Combined Cycle) and hydrogen fuel cells, and CO
2 capture and storage technology is being developed [
5]. In addition, efforts are being made to convert traditional fossil-fuel-based energy systems to renewable-based energy systems such as hydro, wind and solar power. According to the statistics of the International Energy Agency (IEA), the proportion of new and renewable energy consumption has steadily increased, increasing by 41.59% from 10 years ago in 2017 [
6], and wind power accounts for 36% of the total increase. It is growing much faster than other renewable power generations such as solar power (27%), hydro (22%) and biomass (12%) [
7,
8]. In addition, according to a report by the IEA, it is predicted that renewable energy will account for nearly 30% of global electricity in 2023, of which wind will account for 6% of the total renewable energy [
9]. In particular, the proportion of offshore wind turbines that have excellent wind conditions and can mitigate problems such as noise pollution during operation is increasing [
10,
11,
12].
Wind turbines are exposed to highly variable weather conditions such as wind, tropical heat, hail and snow. In particular, offshore wind turbines are exposed to harsher weather conditions than onshore due to the salinity of the sea and strong winds. These weather conditions add loads to wind turbines and cause various types of failures due to extreme mechanical stress [
13,
14,
15]. In the case of a wind turbine failure, not only repair costs but also costs due to power generation interruption are burdened. The maintenance cost of offshore wind turbines, which have poor operating conditions compared to onshore ones, accounts for about 30% of the total energy production cost [
16]. Therefore, the importance of the maintenance of wind turbines is increasing [
17,
18,
19]. The maintenance consists of post-maintenance to repair failures of wind turbines and predictive and preventive maintenances to prevent failures. Preventive maintenance is the replacement of parts on a regular schedule. Predictive maintenance uses a condition monitoring technology to check the performance of machines in operation, detect failures, and make repairs before they occur. As a result, the predictive maintenance can prevent catastrophic failures by predicting failures early and can reduce the cost of parts and consumables compared to preventive maintenance. It also has the advantage of reducing downtime by shortening parts delivery time and repair preparation time, which in turn leads to improved reliability.
The predictive maintenance requires monitoring procedures to observe faults and identify changes to wind turbines in operation. The monitoring system can be used to measure and analyze the vibration and temperature of the wind turbine, identify the conditions before failure, and establish appropriate preventive measures, thereby reducing the overall maintenance process and cost [
20]. Recently, in various industrial fields such as rotating machines and cutting machines, many studies have been conducted on condition monitoring systems using machine learning that do not require complex physical equations between components and have high accuracy [
21,
22].
Along with the increase in power generation systems using renewable energy, a large-scale wind power generator condition monitoring system using machine learning is also being developed. The wind turbine condition monitoring system, which is currently being developed considering the priority of failure rate, is concentrated on the generator and gearbox among various components of the wind turbine [
23,
24]. Clifton, A. et al. [
23] performed a condition monitoring to predict the output of wind turbines using the regression tree method, which combines the regression method and the decision tree method among machine learning methods. For predictions, data from a 1.5 MW wind turbine simulator using the aero structural simulator FAST and the stochastic turbulence simulator Turbsim were used. Rashid et al. [
24] conducted a study on the condition monitoring of gearboxes using machine learning techniques. Among various machine learning techniques, bagging regression was used and the temperature of the gearbox oil was measured to predict gearbox failure. In terms of the failure rate and downtime of wind turbines, not only the generator and gearbox but also the yaw system and pitch-system-related components are becoming important monitoring targets [
25]. For example, Dao, C. et al. [
25] reported that the failure rate of offshore wind turbines was 25% for the pitch system, which was higher than for generators (16.7%) and gearboxes (8.3%). Therefore, for the proper maintenance of the wind turbine, not only the generator and gearbox but also other components of the wind turbine should be additionally considered in the condition monitoring system.
In this paper, a condition diagnosis model of the condition monitoring system for the generator, main bearing, yaw system, and pitch system, which is helpful in the maintenance of offshore wind turbines, has been developed, and the effectiveness was verified using real-time data. The condition diagnosis model consists of selecting the components of the wind turbine to be diagnosed, selecting the data required for diagnosis, designing a machine learning-based condition prediction procedure, and selecting the failure determination criteria. The criteria for the selecting wind turbine components are the failure rate and downtime. As a result of investigating the failure rate and downtime of each component of the wind turbine, the generator, main bearing, pitch system, and yaw system were selected for monitoring. The condition diagnosis model works by comparing the real-time and predictive operation data of the wind turbine, and the prediction of the operation data of the wind turbine utilizes the real-time operation data of the turbine. Supervisory Control and Data Acquisition (SCADA) data of about four years of 2 MW wind power generator was used as the operating data for constructing the condition prediction procedure of the condition diagnosis model. The type of SCADA data of the wind turbine to be input into the machine learning was selected by referring to the Pearson correlation coefficient between the operation data to be predicted [
26]. We used neural networks for machine learning to predict the condition of wind turbine components. In addition, a confusion matrix was used to set the abnormal operation criteria of the condition diagnosis model by referring to Programmable Logic Controller (PLC) state among the SCADA data and to measure the abnormal operation judgment accuracy of the diagnostic model [
27].
As a result of verifying the performance of the condition monitoring system using the condition diagnosis model proposed in this study with SCADA data for about four months, the failure determination accuracy for all components of the wind turbine was over 90%. The condition monitoring system will be effectively used for the maintenance of offshore wind turbines in the future.
2. Configurations of the Condition Monitoring System
2.1. Functionalities of the Condition Monitoring System
The wind turbine condition monitoring system consists of a real-time monitoring module and a condition diagnosis model. The real-time monitoring module collects environmental data such as wind speed and turbine ambient temperature, component status data such as generator temperature and blade pitch angle, and operating data such as output current and power of the wind turbine in real-time. The data used by the monitoring module is collected by using additionally installed sensors or SCADA systems for the condition monitoring system. SCADA systems are installed in most wind turbines and collect data to monitor the operation of wind turbines. Therefore, if the SCADA system is used for the real-time monitoring module, there is no need to install additional sensors, thereby reducing the construction cost of the condition monitoring system. The condition monitoring system in this paper was designed using data collected for about four years from a SCADA system of a 2 MW wind turbine that outputs an average of 1 data every 10 min.
The condition diagnosis model of the condition monitoring system uses the data of the wind turbine collected through the real-time monitoring module to determine the operating condition of the wind turbine. As methods used for condition diagnosis, a real-time order analysis, a filtering by frequency band, a machine learning, etc. are used. Recently, by utilizing machine learning, a condition diagnosis model with high prediction accuracy is being designed without the need for complex physical equations between data of wind turbines. The data with the condition of the wind turbine is predicted using machine learning, and the predicted data is used to diagnose the condition of the wind turbine. In order to diagnose the condition of a wind turbine, appropriate diagnostic criteria are required, and to select an appropriate diagnostic criterion, it is good to use data from the start of operation of the turbine to the occurrence of a failure. The PLC state represents the real-time operation condition of the wind turbine, and the operating condition includes failures, maintenances, and normal operations.
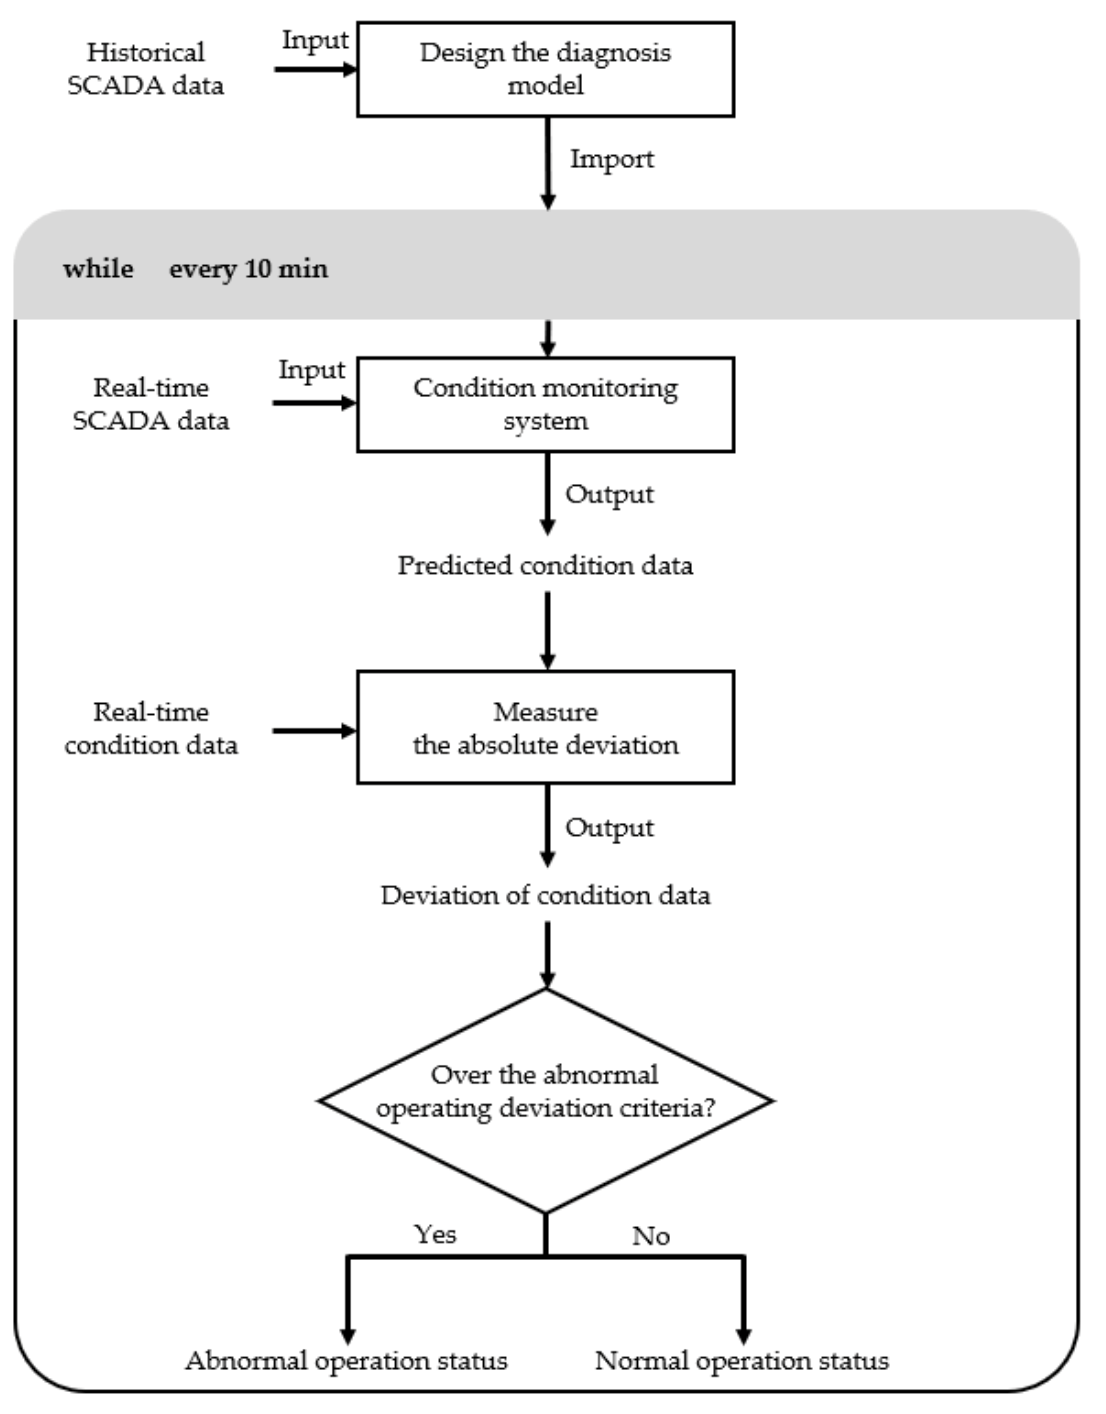
Figure 1 shows the working process of the designed condition monitoring system.
First, the condition diagnosis model designed with the SCADA data collected for four years is imported into the condition monitoring system. The condition monitoring model receives the real-time SCADA data and predicts and outputs the condition data of each component. At this point, the absolute deviation between the predicted condition data and the real-time condition data is measured. By comparing the deviation of the condition data with the abnormal operating deviation criteria, it is classified into the normal operation and the abnormal operation. The monitoring process is performed every 10 min by the SCADA data measured every 10 min.
2.2. Selection of the Wind Turbine Components for the Condition Monitoring System
A wind turbine consists of various components such as a generator, a drivetrain, and a pitch system. When all components are considered in the condition monitoring system, it is a great help for maintenance of a wind turbine. However, considering all components of a wind turbine, there is a limit to the cost due to the installation of sensors and the development of a condition monitoring system. Therefore, it is necessary to select the appropriate components to be considered in the condition monitoring system. To design an optimal condition monitoring system for maintenance, the failure rate and downtime of wind turbines were considered [
25]. Maintenance costs can be further reduced by selecting components with high failure rates and downtime.
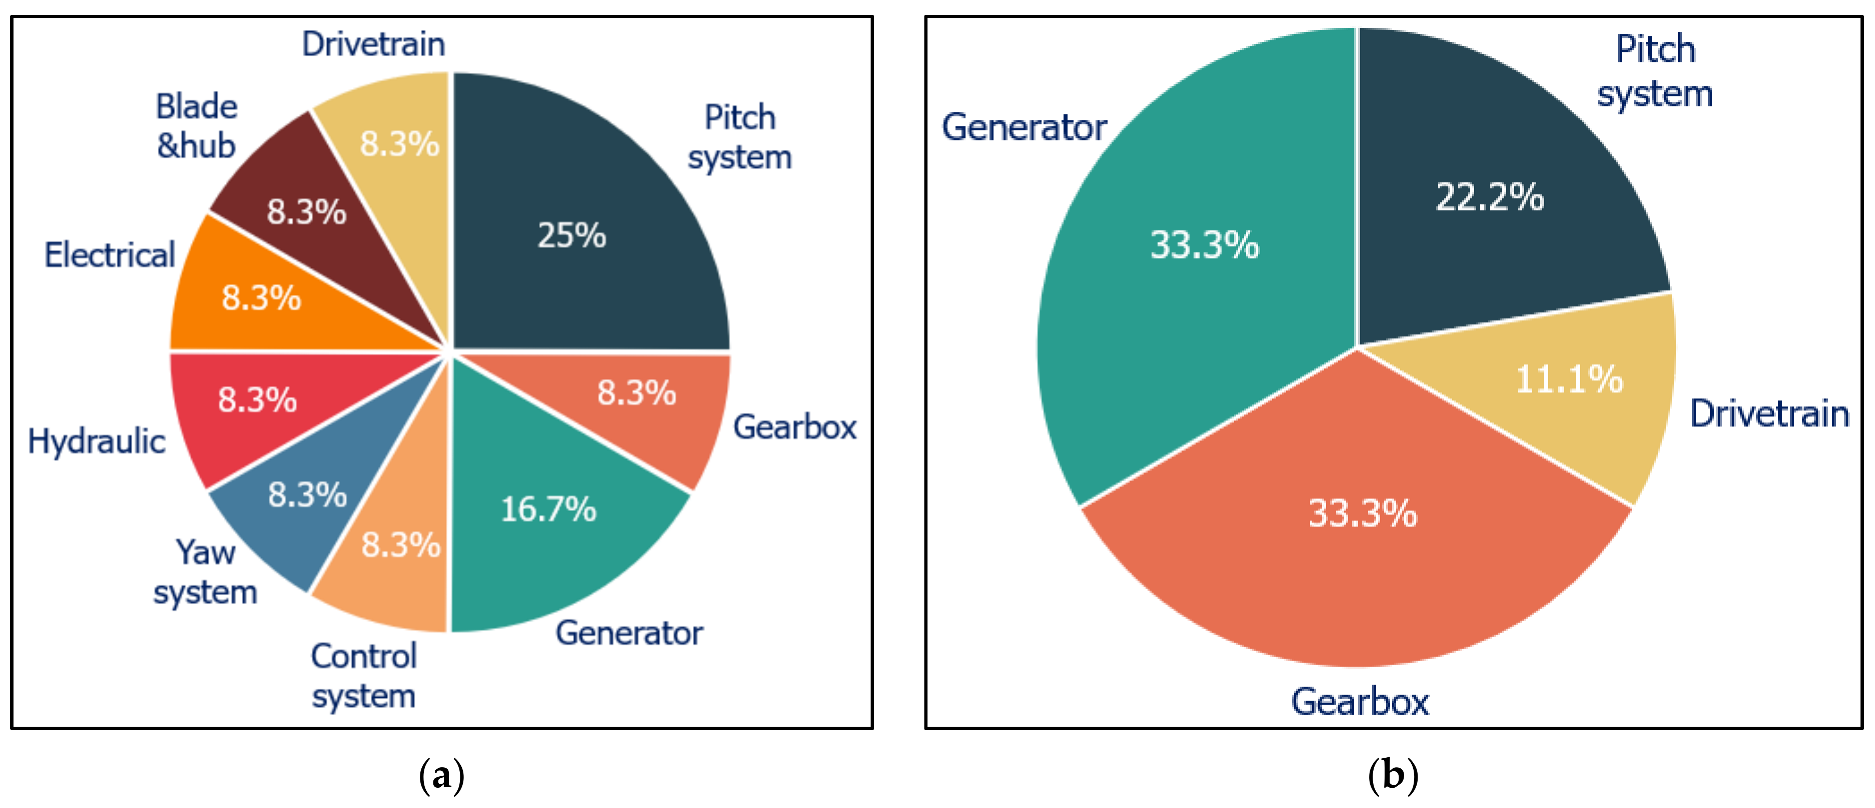
Figure 2 depicts the proportion of each component among the total failures occurring in offshore wind turbines and the proportion of each component in the downtime due to the failure.
In
Figure 2a, the pitch system accounted for 25% of all wind turbine failures, and the generator took the second place with 16.7%. The gearbox, yaw system, control system, blade, and drivetrain were the same with a failure rate of 8.3%. In
Figure 2b, among the wind turbine components, the gearbox and the generator accounted for the highest downtime rate of 33.3%. Next, the blades accounted for 22.2% and the drivetrains accounted for 11.1% of downtime. Considering the failure rate and downtime, the generator, main bearing, pitch system, and yaw system were selected as the target components of the condition monitoring system. Because the target of the condition monitoring system to be implemented in this study is a direct-driven offshore wind turbine in which the driving force of the rotor is transmitted directly to the generator, the gearbox was excluded from consideration, and the bearing of the main shaft was subject to monitoring because it would receive a high load.
2.3. Design of the Condition Diagnosis Model
The design of the condition diagnosis model proceeds with the selection of condition data of each component, the data preprocessing, the machine learning for condition data prediction, and the selection of abnormal operation judgment criteria.
2.3.1. Selection of Predictive Data for the Condition Diagnosis Model
It is the process of selecting data representing the condition of the wind turbine components. The SCADA data of a 2 MW wind turbine was used to design the wind turbine condition monitoring system. Each SCADA data consists of about 140 types of operation statuses. Among them, the SCADA data related to the status of generator, main bearing, pitch system, and yaw system handled by the condition monitoring system were selected.
Table 1 represents the SCADA data selected as the condition data of the components.
The output of the generator is mostly limited by the temperature rise, such as the temperature rise of the field winding and the armature winding, the temperature rise at the iron core edge of the armature, and the temperature rise due to the failure of the cooling device, so the temperature was selected as the condition data. Moreover, in the case of the main bearing, the temperature rises due to large loads and imbalances, which can cause cracks and damage, so the bearing temperature was selected as the condition data to prevent damage. The pitch system and the yaw system, which adjust the angle of the blade and nacelle according to the real-time wind speed and direction, are abnormally changed in the angle of the blade and the nacelle due to a malfunction of the pitch controller or wind vane during operation. Therefore, the blade pitch angle and wind direction angle deviation were selected as the condition data for the pitch and yaw system as shown in
Table 1.
2.3.2. Data Preprocessing of the Condition Diagnosis Model
The SCADA data of the condition diagnosis model should be preprocessed. Preprocessing proceeds with data selection under the normal operation status, the SCADA data selection related to condition data and data scaling. The PLC state was used to distinguish the normal operation status. The condition diagnosis model uses the SCADA data correlated with the condition data of each component. In order to improve the prediction accuracy of condition data through machine learning, it is necessary to select the SCADA data with high correlation with condition data. The Pearson correlation coefficient is a statistical method that measures the magnitude and direction of the linear relationship between the condition data of each component and the SCADA data, and the Pearson correlation coefficient is the formal method of measuring correlation and is still the most widely used [
26]. Thus, the Pearson correlation coefficient was used to measure the correlation in this study and is expressed in Equation (1) [
27].
In Equation (1),
is the Pearson correlation coefficient,
is the number of variables,
are each variable, and
are the average of each variable. The correlation coefficient is distributed between −1 and +1, and the closer the relationship between the two variables, the closer to the extreme value. The SCADA data with correlation coefficients close to −1 or 1 were used. The data scaling was performed on the SCADA data selected using the correlation coefficient.
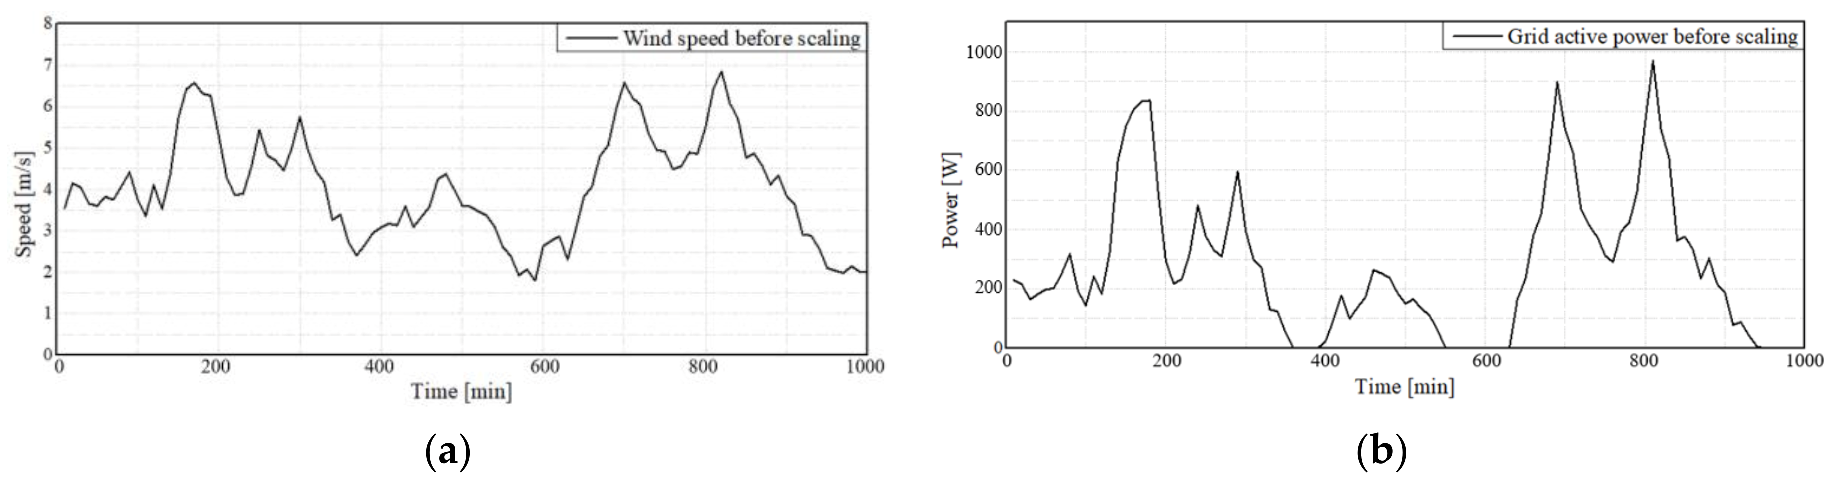
Figure 3 shows the SCADA data for 1000 min. As shown in
Figure 3a,b, the data range of wind speed is 1.79~6.85 m/s, and the range of system active power is 0~971.34 W, respectively.
If the range of the SCADA data is different, the accuracy of the condition prediction is affected, so the range of the SCADA data is adjusted to a certain level through data scaling. For data scaling, there are scalers such as Normalizer, Standard scaler, and MinMax scaler, and a scaler suitable for the data type and machine learning technique is used in general.
2.3.3. Machine Learning for the Prediction of Condition Data
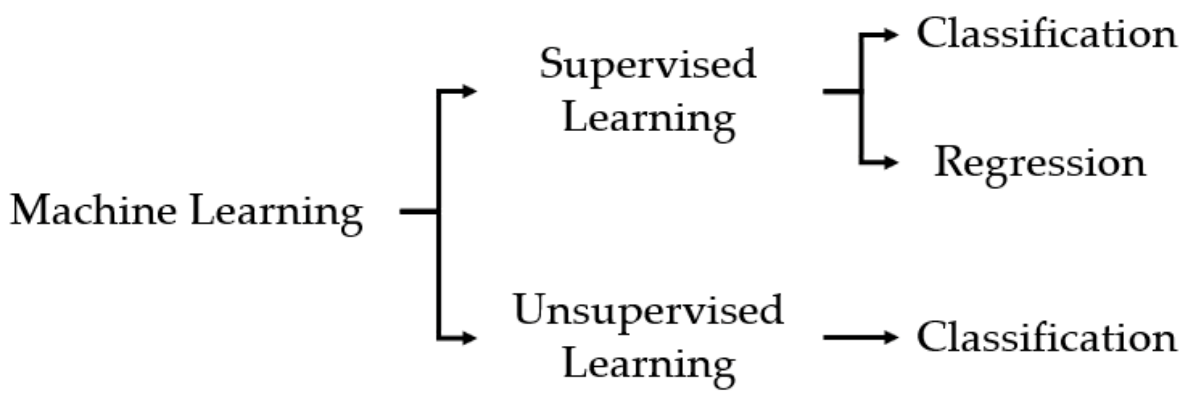
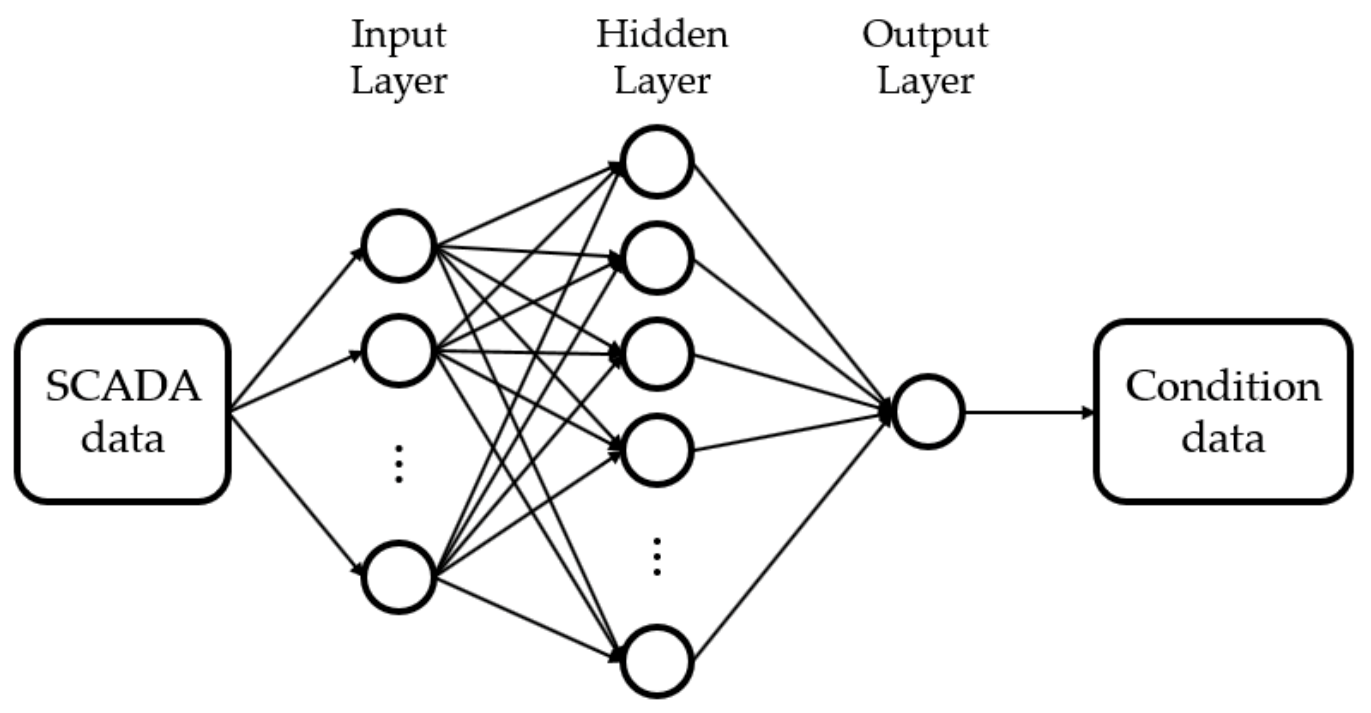
The machine learning predicts the condition data using the preprocessed SCADA data. The configuration of machine learning is shown in
Figure 4.
The machine learning uses supervised learning when there are output variables for input variables, and unsupervised learning when there are no output variables for input variables. In addition, supervised learning is divided into regression and classification based on whether the type of the output variable is a numeric variable or a categorical variable. The input variable used for the machine learning of the condition diagnosis model is the SCADA data, and the output variable is the condition data, which is a numerical variable, so the machine learning used a regression model of supervised learning. The regression models include methods such as a regression tree, bagged regression technique, and neural network. Among them, the neural network was used to design the condition diagnosis model. The neural network is the machine learning technique created by referring to the way the human brain processes information, and given sufficient computation time, data, and parameter tuning, it outperforms other machine learning methods. According to the number of the hidden layers, the neural networks are divided into an artificial neural network (ANN) composed of a single layer and a deep neural network (DNN) composed of two or more layers.
Figure 5 shows the structure of the neural network used to predict the condition data [
28].
The neural network of the condition diagnosis model uses the SCADA data as the input variables and predicts the condition data as the output variables. The parameters of a neural network include the number of hidden layers, activation functions, and epochs. As shown in
Figure 5, the hidden layer between the input layer and the output layer is composed of nodes and neurons, enabling the prediction of complex data. At least one hidden layer is required for a neural network, and a neural network with multiple hidden layers is called a deep neural network. A training accuracy changes according to the number of hidden layers. In order to determine the number of hidden layers with the highest training accuracy, the training accuracy was measured by changing the number of hidden layers from one to five. The activation function creates nonlinearities in the training process of the neural network, making it possible to train complex patterns.
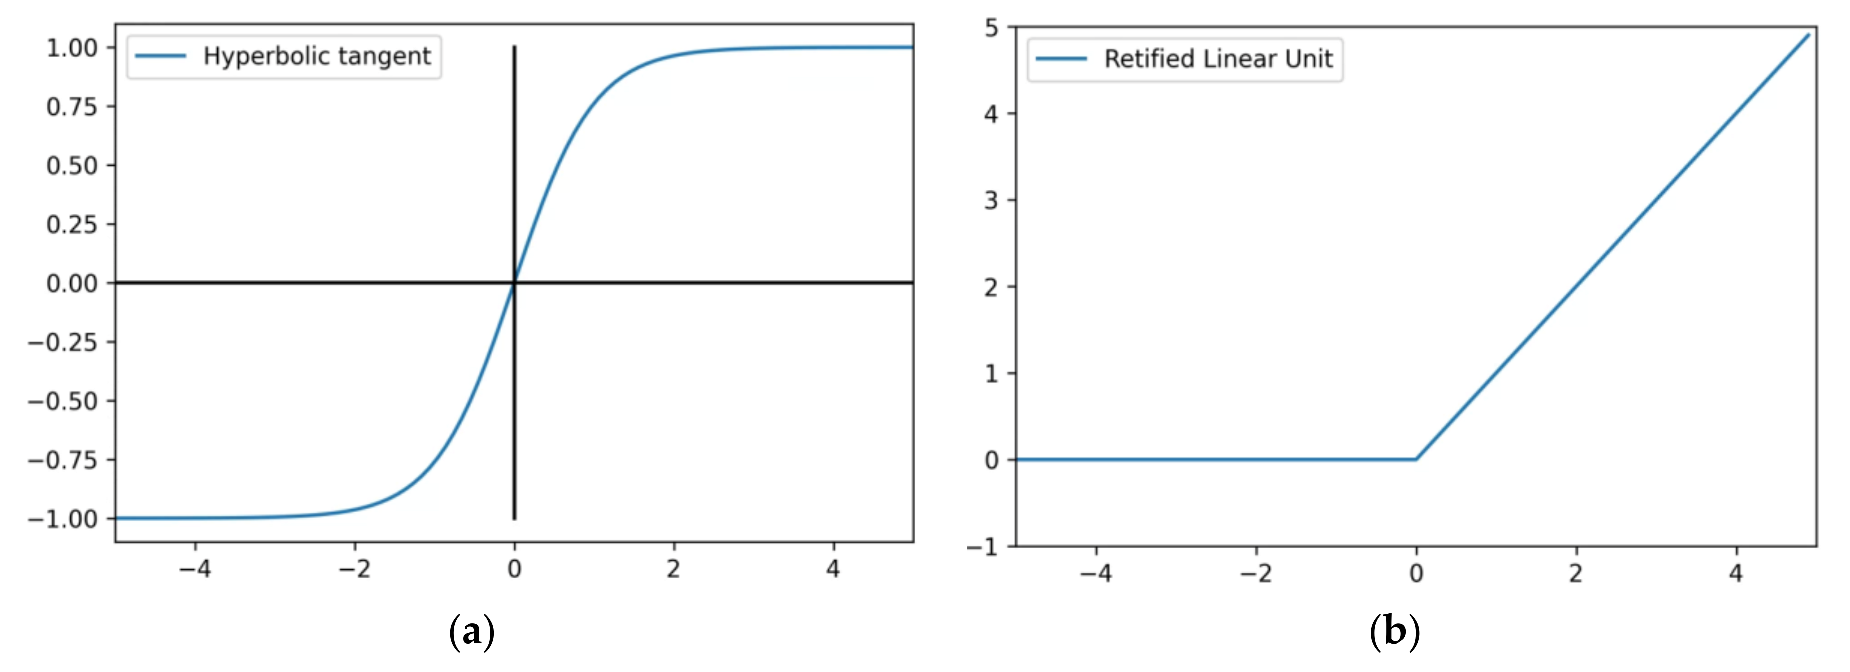
Figure 6 depicts activation functions. Activation functions were compared with a hyperbolic tangent (Tanh) and a rectified linear unit (ReLU). The Tanh is in the form of
Figure 6a, has the same characteristics as sigmoid, and the output value is between −1 and 1 depending on the input variable. The ReLU is in the form of
Figure 6b, which is a linear function for positive input variables and zero for negative input variables.
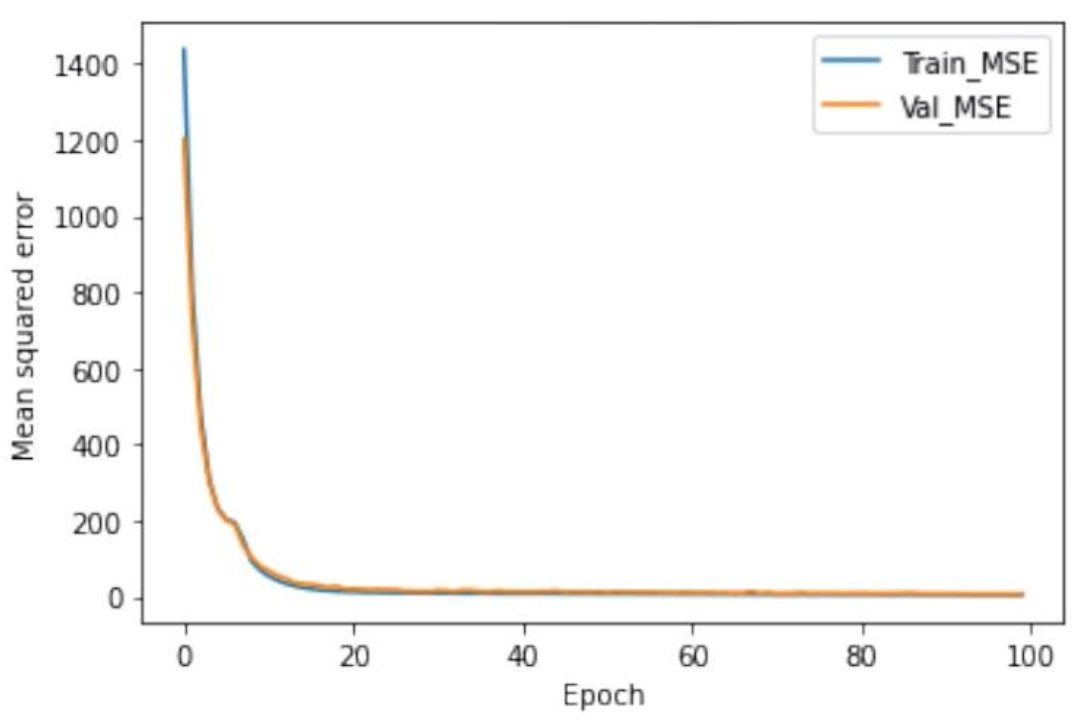
The epoch represents the number of learning iterations, and as the epoch increases, the number of iterations of learning increases.
Figure 7 shows the learning loss when the epoch is increased from 0 to 100.
When the epoch increases, the training loss decreases, but the training loss remains constant from a certain epoch or more. In the epoch, there is little change in the training loss, and the value of the moment similar to the training loss of validation is used.
2.3.4. Selection of Abnormal Operation Criteria for the Condition Diagnosis Model
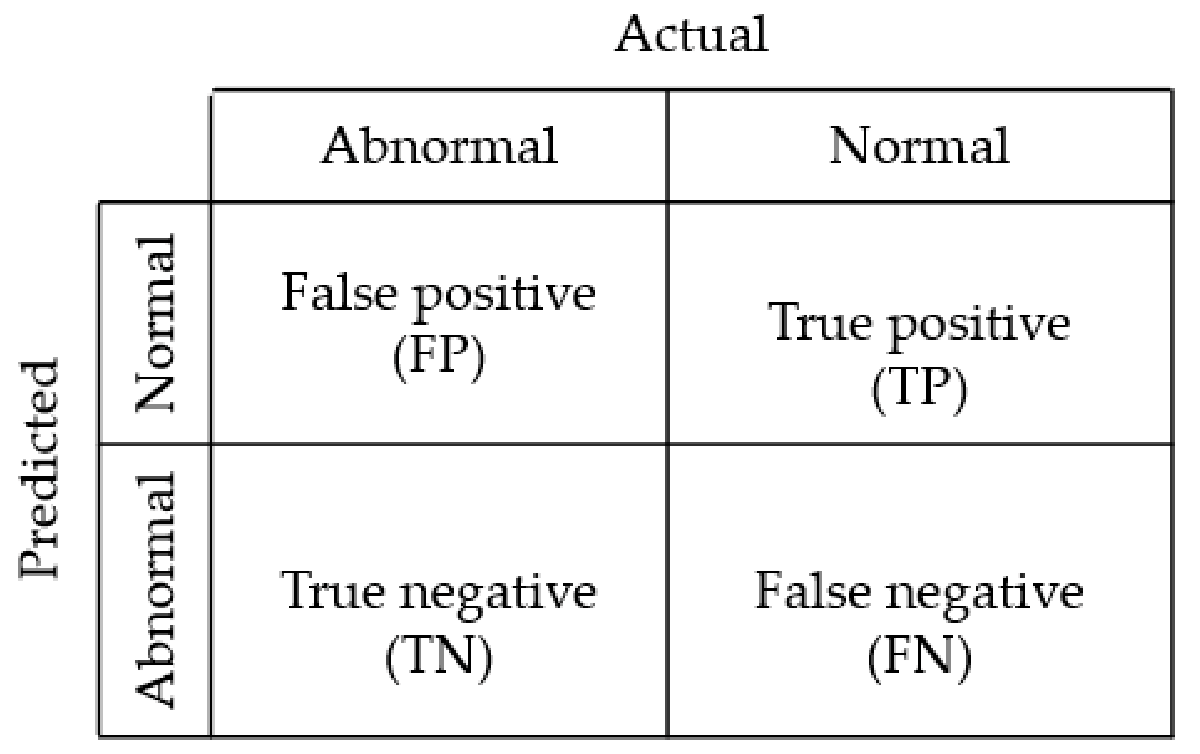
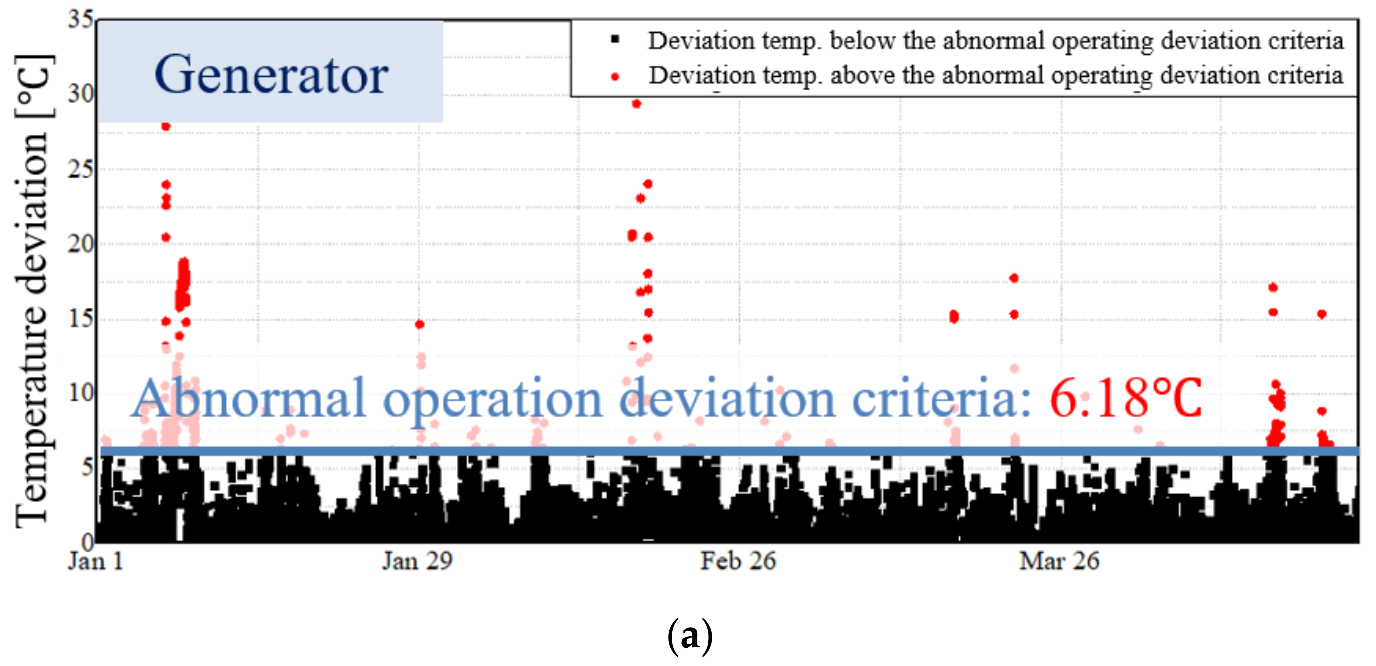
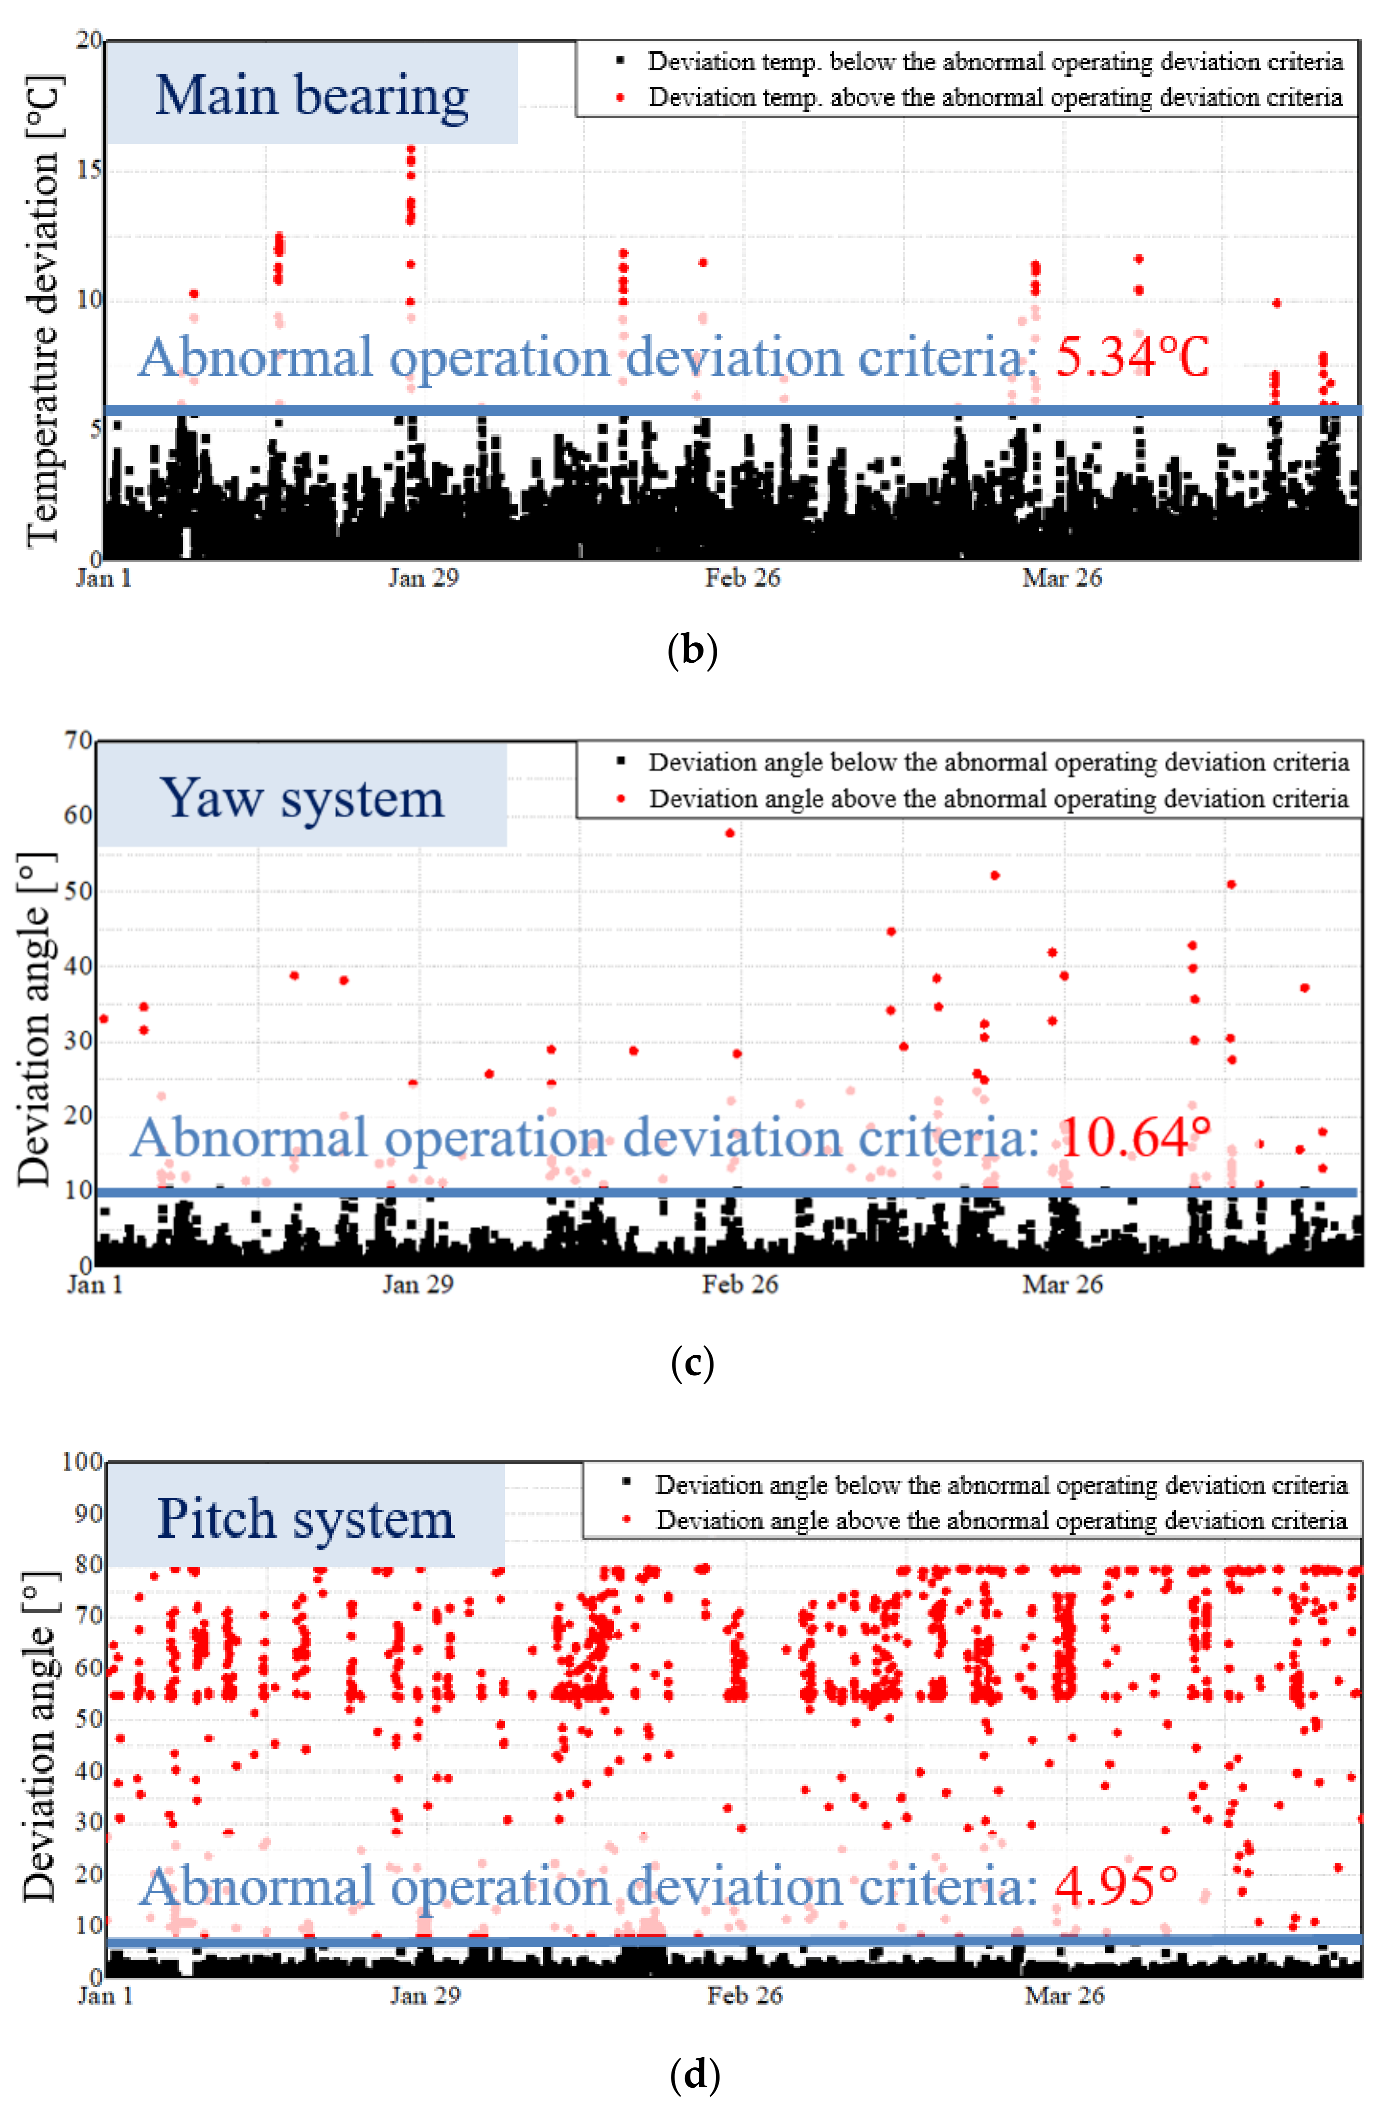
The abnormal operation of the condition diagnosis model is determined by comparing the real-time condition data with the predicted condition data. The real-time condition data and the predicted condition data are measured using the SCADA data that is put out every 10 min. Therefore, the abnormal operation of the condition diagnosis model is judged every 10 min. When the deviation value between the real-time condition data and the predicted condition data increases by more than the abnormal operation criteria, it is determined as abnormal operation of the wind turbine. The abnormal operation criteria were selected using the condition data and PLC state. The abnormal operation criteria were set by adjusting the standard deviation of the real-time condition data and the predicted condition data by an integer multiple until the moment when the condition diagnosis accuracy is high. The condition diagnosis accuracy was measured using a confusion matrix. The confusion matrix is a measure for judging the accuracy of data classification, and its structure is as shown in
Figure 8.
The confusion matrix consists of two dimensions, including the dimension of the real-time operation state and the dimension of the predicted operation state. In the confusion matrix, when the real-time operation is normal, it consists of True positive (
TP), which is a diagnosis success, and False negative (
FN), which is a diagnosis failure. If the real-time operation is abnormal, it is composed of True negative (
TN), which is a successful diagnosis, and False positive (
FP), which is a diagnosis failure. The method of measuring the accuracy of the condition diagnosis using the confusion matrix is as shown in Equation (2) [
29].
The accuracy of the condition diagnosis model is judged by the ratio of true positive and true negative among the total operating state of the wind turbine.
5. Conclusions
In this paper, a real-time condition monitoring system for operation condition diagnosis of offshore wind turbines has been dealt with. For the components subject to condition monitoring, the generator, main bearing, pitch system, and yaw system were selected in consideration of the failure rate and downtime of the wind turbine, and the condition diagnosis model was designed using the SCADA data of 2 MW wind power generator for about four years. Among the SCADA data, the data with high correlation with condition data was selected using the Pearson correlation coefficient. A neural network was applied as a machine learning method to predict the condition data of each component of the diagnosis model, and the neural network was designed by selecting parameters such as activation function, number of hidden layers, and epoch. For high prediction accuracy, the ANN with a single hidden layer for the main bearing, the DNN with three hidden layers for the yaw system and pitch system, and the DNN with five hidden layers for the generator have been designed. As the activation function used in the neural network of each component, the activation function of the generator, yaw system, and pitch system was selected as Tanh, and the activation function of the main bearing was selected as ReLU. The deviation criteria for judging abnormal operation were selected using the PLC state of the SCADA data and the condition data. The deviation criteria were selected 6.18 °C for the generator, 5.34 °C for the main bearing, 10.64° for the yaw system, and 4.95° for the pitch system, respectively. The condition monitoring of the SCADA data for four months was conducted using the selected deviation criteria. As a result, the monitoring accuracy of the main bearing was the lowest at 93.51%, and the monitoring accuracy of the generator was measured the highest at 94.93%. The condition monitoring system of the offshore wind turbine proposed in this study collects data of the real-time wind turbine and predicts the operating condition of components. The predicted results are provided to the operator, which will be a good reference for the operator to carry out the predictive maintenance of the wind turbine. This notifies the operator of the situation before a serious failure of the wind turbine occurs, and it can reduce downtime through components supply and repair planning. It can also reduce the impact on surrounding components due to severe failure. As a result, it is expected that the operational reliability of the offshore wind turbines will be improved, and the economical maintenance will be possible through the condition monitoring system.


