Article

Performance Analysis of the Coupled Heating System of the Air-Source Heat Pump, the Energy Accumulator and the Water-Source Heat Pump

School of Environmental and Municipal Engineering, Lanzhou Jiaotong University, Lanzhou 730070, China
*
Author to whom correspondence should be addressed.
Energies 2022, 15(19), 7305; https://doi.org/10.3390/en15197305
Submission received: 2 September 2022 / Revised: 28 September 2022 / Accepted: 29 September 2022 / Published: 4 October 2022

Abstract

:
In the remote areas of northern China without central heating and gas supply, for users intending to replace coal-boilers, the air-source heat pump system is always questionable due to the contradiction between its heating capacity and user’s heating demand, especially in very cold areas, whose COP and economy is very poor. The accumulator with phase change materials would be a promising one to solve this problem. With the help of TRNSYS software, a heating system coupled with air-source heat pump, accumulator, and water-source heat pump and its operation mode are provided and analyzed based on the heat source renovation demand of a middle school in Tianshui City suburb which has 5560 m2 area to be heated. The average COP simulated during the heating period of the coupled heating system is 2.23. Based on the simulation model and results, the heat source renovation of the middle school in Tianshui City suburb was carried out, its tested and simulated COP over the day was 2 and 2.05, respectively, which also reveals the validity of the numerical method for this problem.

1. Introduction

Building energy consumption has accounted for one-third of the terminal energy consumption and is expected to reach 40% by 2030 in China [1,2], of which the energy consumption for heating, ventilation, and air conditioning (HVAC) account for 50% [3]. China is struggling to cut carbon emissions in each field [4] and a heating system based on coal-boilers will be prohibited in coming years. Located in the suburb of 35° N and 106° E, the middle school in Tianshui City suburb is very cold and was encouraged by government to replace the heating coal-boiler with equipment in clean energy. However, its gas supply and central heating are blank, and the transformation fund is insufficient for a geothermal heat pump. The same problem is facing many users in northern China [5,6,7].
Heat pumps are often recommended as an alternative to coal-boilers for clean heating [8,9,10,11]. A geothermal heat pump is efficient and stable at the initial stage, but its initial investment for well drilling is too high for some users to be able to afford it and its performance would deteriorate gradually [12,13,14,15]. The advantages of air-source heat pump (ASHP) include easy installation and lower initial investment [16,17,18,19,20,21], but it would be uneconomical in cold areas, and it’s defrost is another fatal flaw [22,23,24,25,26]. What type of heat pump is suitable for the users such as the school in Tianshui City suburb?
Wei Wang et al. combined ASHP and water-source heat pump (WSHP) for heating in a low-temperature environment [27]. Xu studied the performance of the two-stage heat pump in cold areas [28]. Lin et al. proposed an ASHP system combined with a latent heat storage unit [29]. Qu manufactured an ASHP energy storage system prototype, and tested it at various operating modes [30]. Redon et al. conducted parameter optimization and theoretical research on dynamic operation characteristics of a two-stage compression ASHP system with different refrigerants [31]. Chen et al. studied a new solar-assisted heat pump system with phase-change energy storage function, established a numerical model of key parts, and experimentally met the cold-day heating demand in rural areas of Yanbian City, Jilin Province, China [32]. Zhang et al. proposed a novel solar photovoltaic/heat-assisted gas engine-driven energy storage heat pump system, and studied the obtained independent variables (solar radiation, outdoor dry bulb temperature and wind speed) and dependent variables (building heating load, SESGEHP heating capacity, heat gain and power generation from PV/T systems) [33]. Seevers J.-P. establish a numerical model of a heat pump and storage system using the Monte Carlo method. Results show that relatively small heat pumps and energy storage can ensure reliable heating and cooling of manufacturing systems [34]. The energy efficiency of the heating system was improved when the phase change accumulator was introduced [35,36,37,38].
It is clear that the clean heating is difficult to implement in the poor and remote areas. As one promising solution, a heating system coupled with ASHP, heat accumulator, and WSHP has been little discussed. To satisfy the heating demand of the users such as the middle school in Tianshui City suburb, this paper proposes a coupled heating system. Then, a numerical analysis by TRNSYS software is followed to indicate the system performance. Finally, the practical effect of the coupled heating system is shown.

2. The Project Background

The heating period is from 16 November to 31 March of the following year in Tianshui city, but for the school, the period could be from 16 November to 20 January of the following year and 1 March to 31 March. The outdoor design temperature for heating is −7 °C and the indoor design temperature for heating is 18 °C during the occupied period. Figure 1 shows the hourly outdoor temperature of a typical meteorological year in Tianshui city recorded in ASHRAE (American Society of HVAC Engineers) database [39], in which the highest temperature, the lowest temperature, and the average temperature are 23.5 °C, −9.3 °C, and 1.4 °C, respectively. The conditioned area of the middle school is 5560 m2 and Figure 2 shows its regional layout. In order to cater to the national goal of carbon reduction, the middle school aims to transform the coal-boiler system into a heat pump system based on the existing pipe network and radiators due to lack of natural gas and central heating, but the transform fund is insufficient. The question of whether the heating system based on ASHP is practical has arisen for the middle school, and numerical prediction could be necessary.
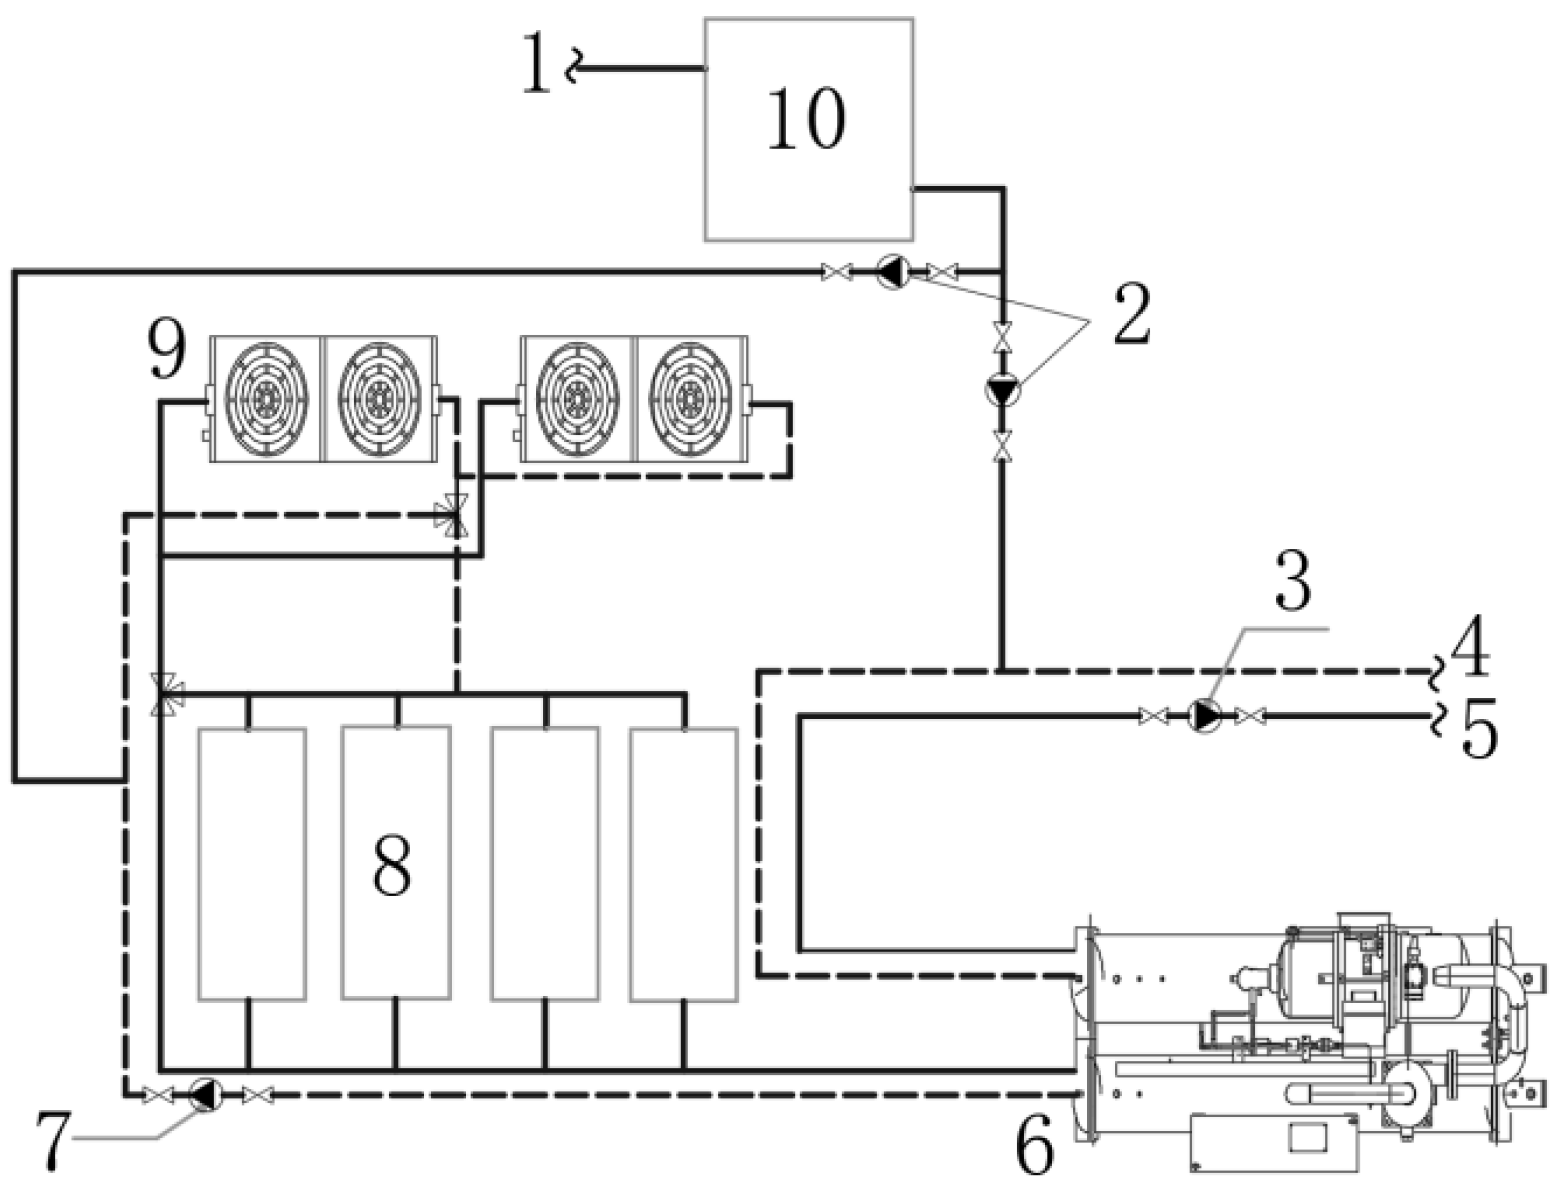
Figure 3 shows the predesigned heat pump system, which is mainly composed of 9—ASHP at low temperature side, 8—the middle part of energy accumulator, and 6—WSHP at high temperature side. Other sections include 1—make-up water, 2—make-up pump, 3—circulating pump for heating, 4—return water of heating, 5—supply water of heating, 7—circulating pump at WSHP evaporator side and 10—make-up water tank. R410a and R134a are used as the refrigerants for ASHP and WSHP, respectively.
The operation mode for the heating system is the key factor of its component capacities and its energy and cost. In Gansu province, the peak and valley electricity price policy is implemented, and it will be counted at the valley electricity price at 10:00 p.m. to 8:00 a.m. when the user uses clean and renewable energy. Considering improving the COP of ASHP and the peak and valley electricity price policy, the operation mode for the heating system proposed in this paper mainly includes four stages shown as Table 1. During stage 1, ASHP supplies 17–25 °C water to energy accumulator and WSHP evaporator simultaneously, then, the WSHP condenser supplies about 55 °C water to the buildings. During stage 2, the ASHP stops, the accumulator supplies warm water to the WSHP, and the WSHP heats the buildings. The process in stage 3 and stage 4 are the same as that in the stage 1 and stage 2 respectively. Whenever the heat capacity of the accumulator is less than the demanded heating load, the ASHP will put into operation.

3. Simulation Analysis

3.1. Evaluation Index

COP shown in Equation (1) is used to evaluate the energy efficiency of the heat pump and its system.
C O P = Q ˙ P h p + P p
where, Php is the power consumption of the heat pump. Pp is the power consumption of the water pump, and it is equal to zero when COP is for the heat pump only. Q ˙   is the heating capacity of the heat pump, and it is the heating capacity of WSHP when the COP is for the heating system. Q ˙   can be calculated according to Equation (2).
Q ˙ = m ˙ c p t 2 t 1  
where, m ˙ is the mass flow rate. cp is specific heat capacity of water. t1 and t2 are the water temperature at inlet and outlet of the heat pump or the heating system, respectively.

3.2. Heating Load and Component Capacity

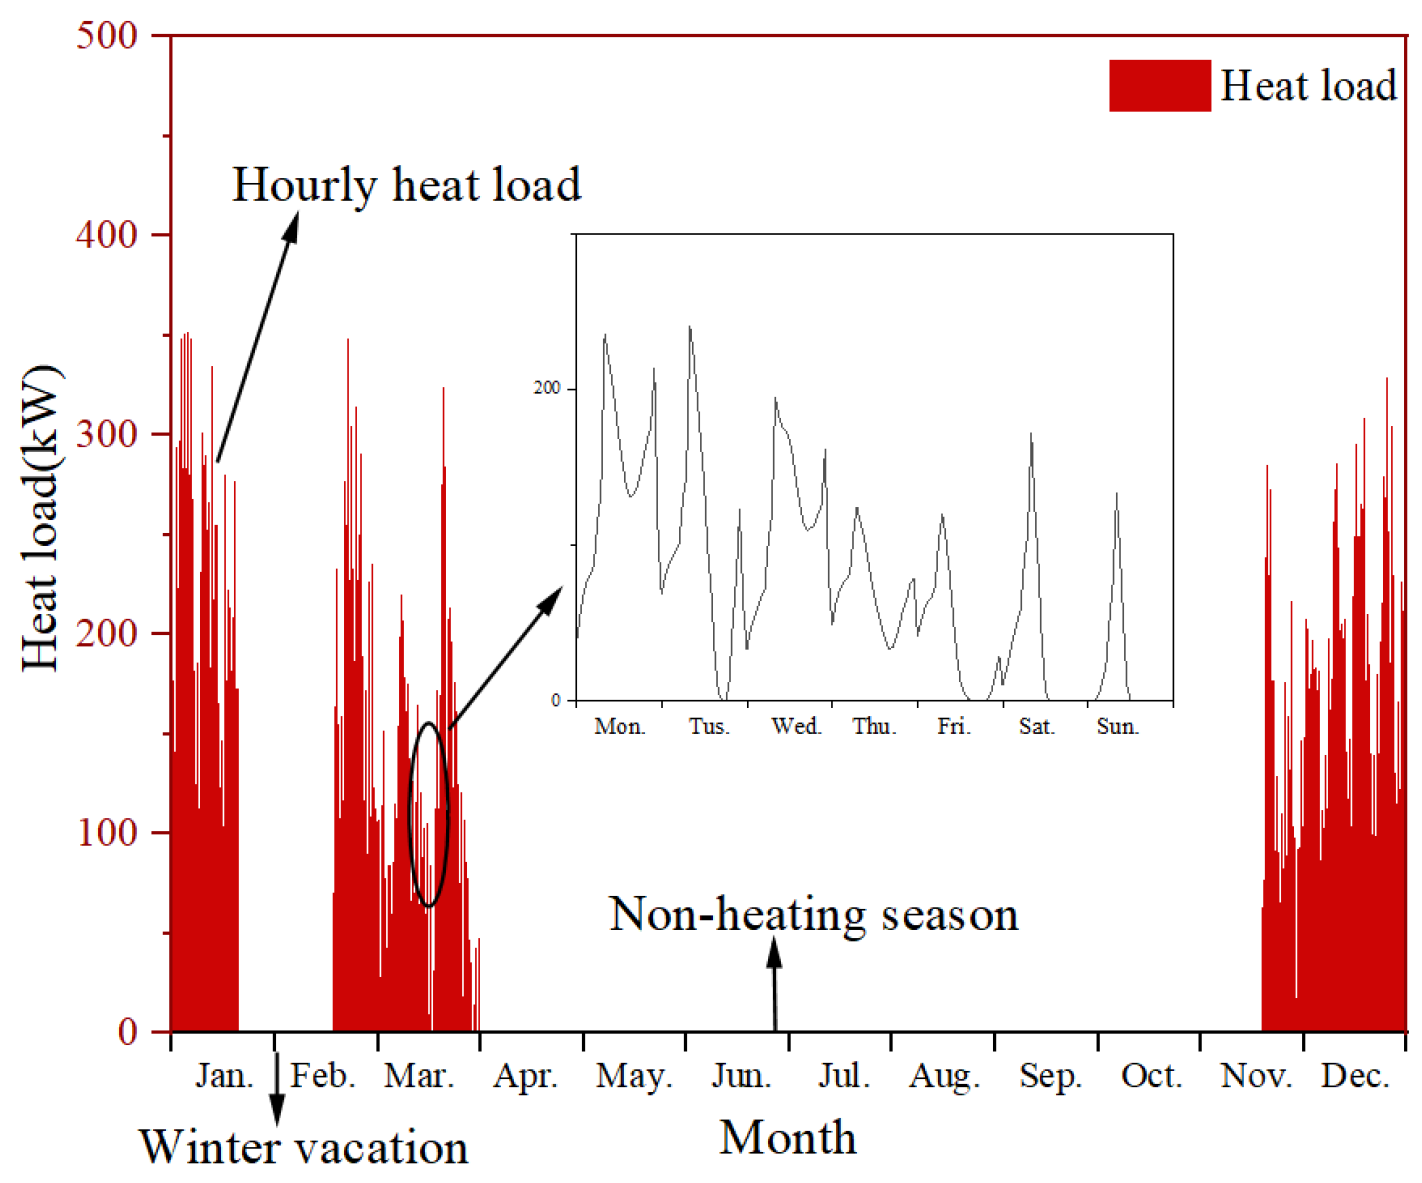
Based on the building information of the school and the meteorological data of the typical year in ASHRAE database, the school hourly heating load is calculated by OpenStudio software (Golden, USA) and shown in Figure 4. The maximum heating load is 353.3 kW and the average heating load is 253.72 kW. The designed load for heating the school is 325.4 kW according to the design parameters, which should be satisfied by the WSHP. If the accumulator spends 8 h in thermal storing and 4 h in thermal releasing, the accumulator capacity should be larger than 976.2 kWh and the ASHP heating capacity should be larger than 366.1 kW. If the factor 1.2 is considered for the capacity redundancy of the system, the main equipment and their parameters are determined as Table 2 shown.

3.3. System Simulation Model

The simulated system shown in Figure 5 will be used to analyze the performance of the system, which is developed in TRNSYS 16.0 software (Ouagadougou, Burkina Faso). The model includes key components, such as the ASHP, WSHP, accumulator, several pumps, and the pipeline. Numerical model includes the formulas established by reference [40]. Each operating parameter of the heating system is monitored in real time.

3.4. Numerical Results and Analysis

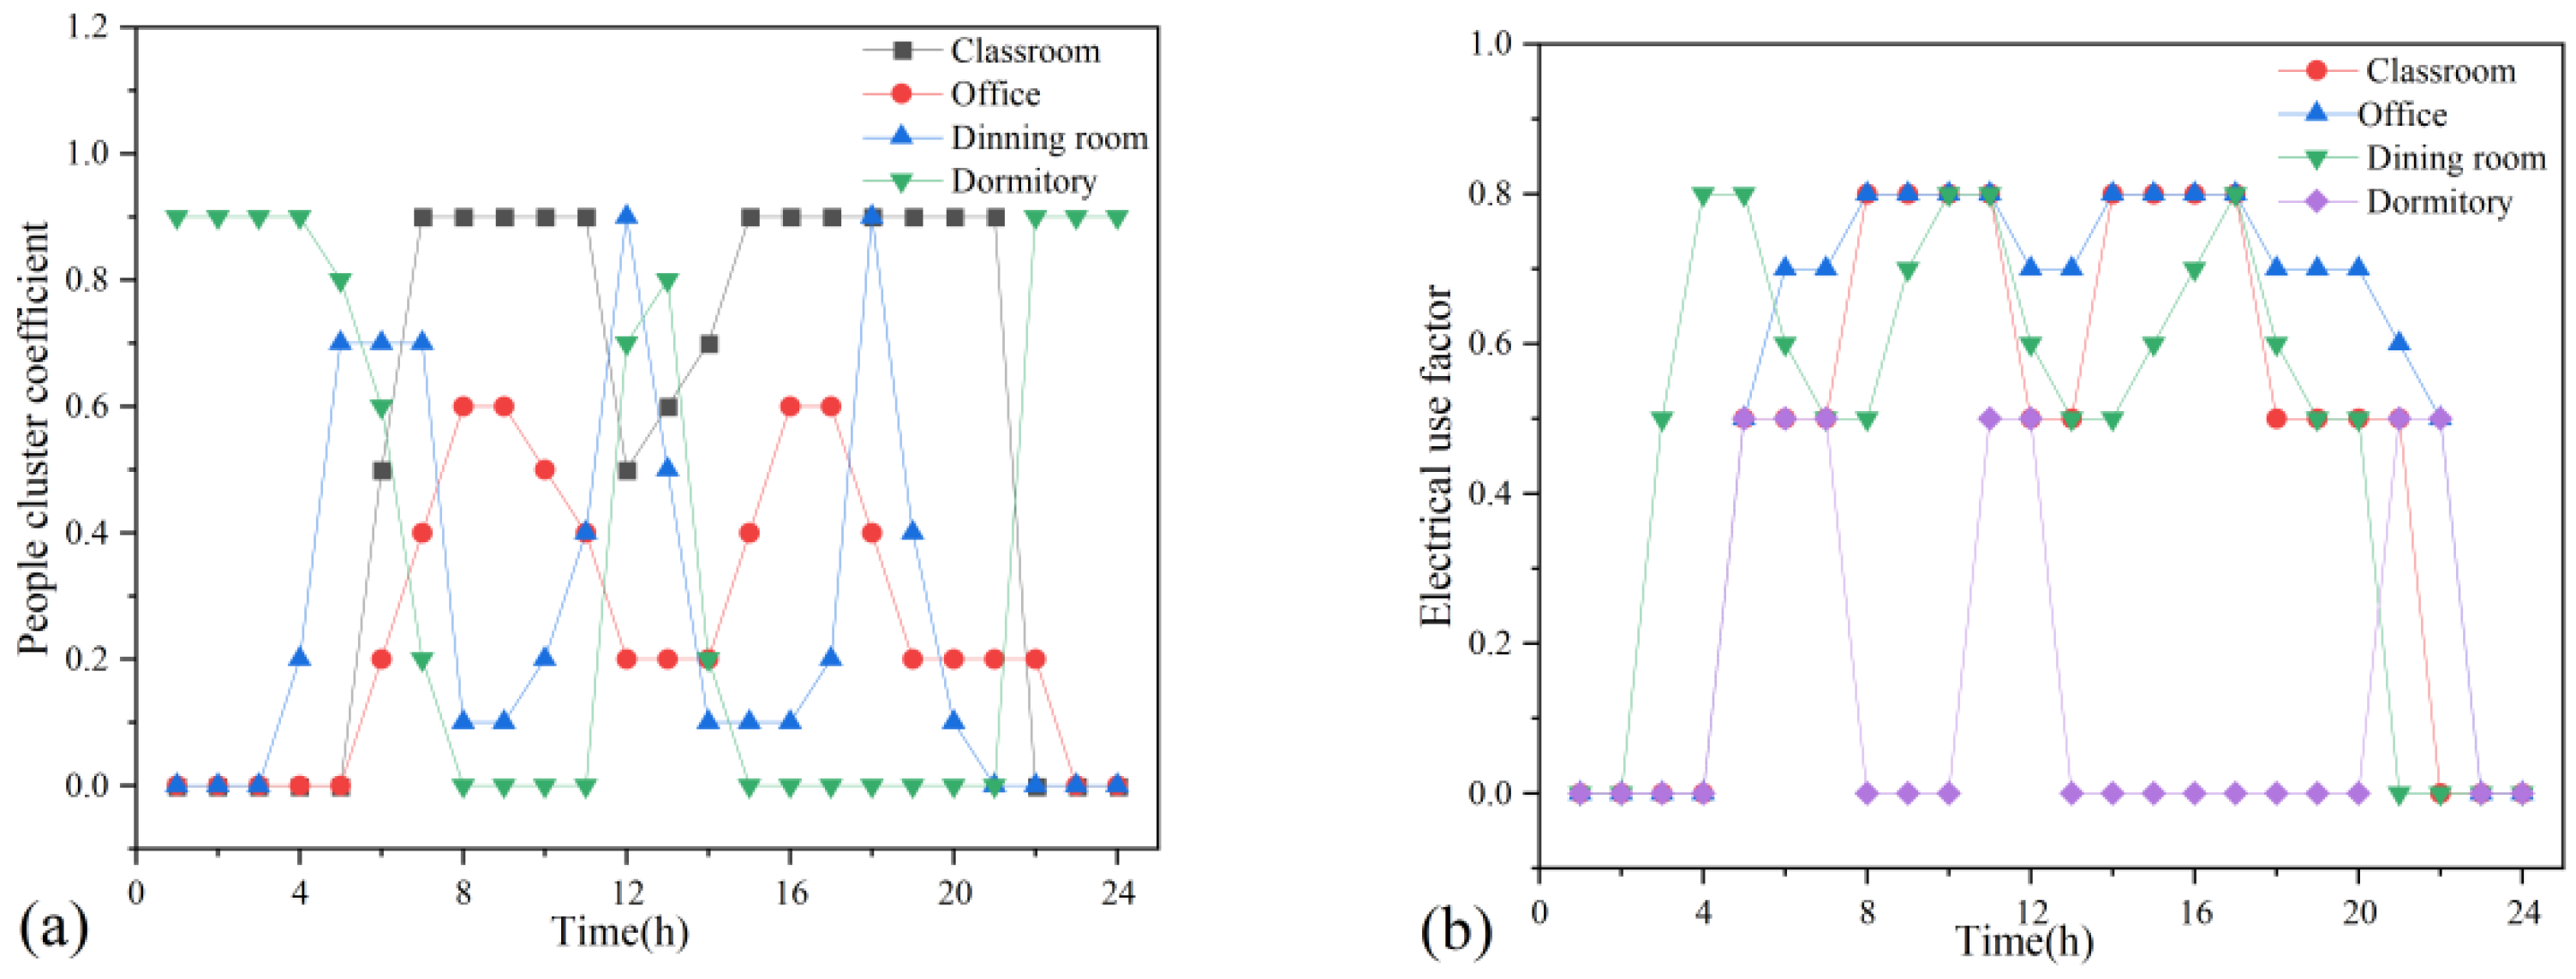
In order to numerically analyze the hourly heating capacity, Figure 6a,b give the hourly utilization coefficients of different rooms to consider the heat obtained from the human body and electrical equipment along each day respectively, including the classroom, the office, the dining room and the dormitory.
As the known conditions, the outdoor ambient temperature, the water temperatures at ASHP condenser inlet, and WSHP evaporator inlet and WSHP condenser outlet (i.e., the water temperature for heating users) are input. The phase change temperature in the accumulator is set to 20 °C.

3.4.1. COPs Simulated in the Heating Period

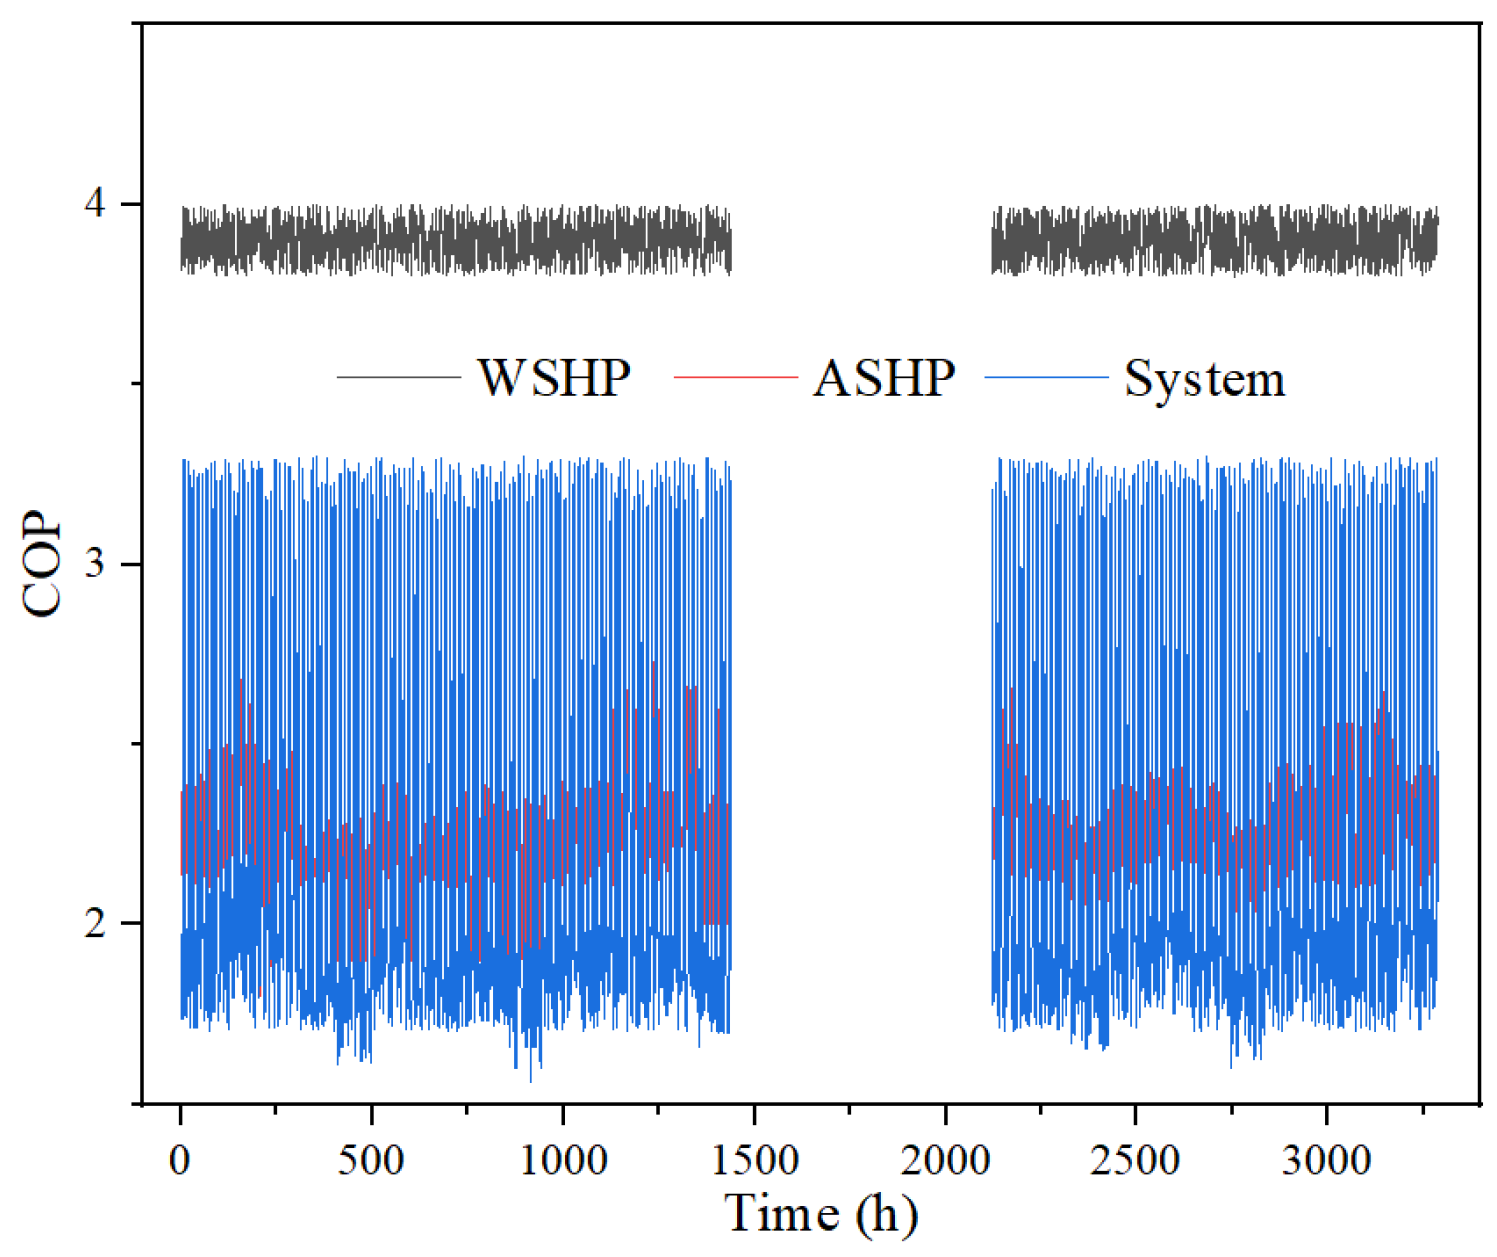
Figure 7 shows the hourly COP of the WSHP, the ASHP, and the coupled heating system (including water pumps and heat pumps) simulated during the heating season, except for winter vacation. The WSHP COP is stable during heating period and its average value is 3.9. The ASHP COP fluctuates with outdoor temperature and its average value is 2.33. A small fluctuation of COP of the coupled heating system is caused by ASHP and its average value is 2.2. The result could be satisfied compared to the heating system composed by ASHP only, whose COP is usually far less than 2.0 during cold period.

3.4.2. Benefit Predict

Based on the meteorological parameters of typical year and operation mode in this paper, annual energy consumption of the coupled heating system provided by this paper is about 223,164 kWh, of which, 53.14% belongs to ASHP and 43.4% to WSHP. Because the working time of the coupled heating system was 22:00 p.m. to 8:00 a.m., it will be counted at the valley electricity price (about 50%), which is ¥0.32 ($0.046)/kWh (¥0.54 ($0.077)/kWh in rest time). The operating costs for heating during heating period is about ¥105,330 ($15,021.61) total or ¥18.9 ($2.70)/(y·m2), which is a lower level in China.

4. The Project

Based on the above simulation analysis, the heating system was put into practice in the middle school in 2019. The system and its main equipment was run according to the mode shown in Table 1. The WSHP can automatically adjust working power level to 60 kW or 75 kW according to the heating water temperature, and ASHP1 can automatically adjust total working power level to 90 kW or 120 kW according to environment temperature. The tested parameters and instruments are shown in Table 3.

4.1. Outdoor Temperature and Heating Load

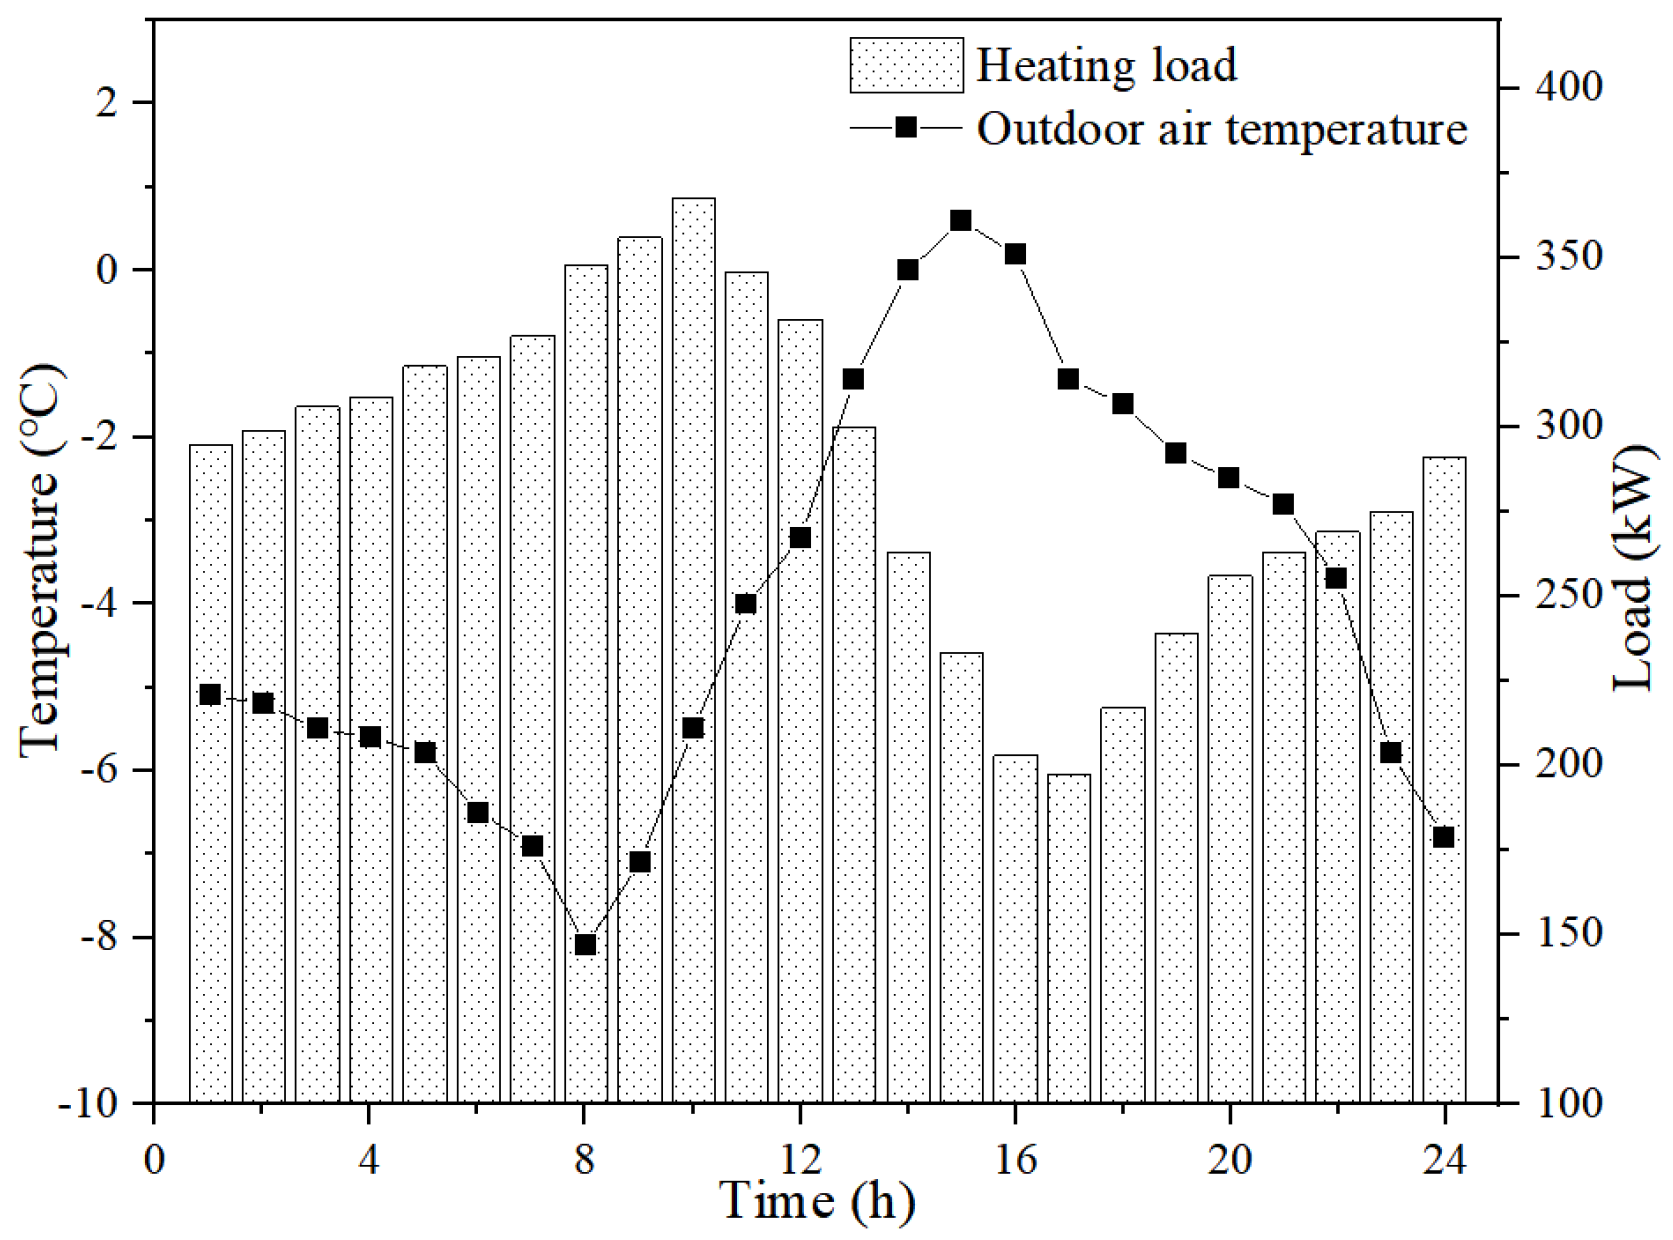
The test was carried out in the same year before vacation. Due to its low temperature, 11 January was selected as the typical day to specifically indicate the performance of the coupled heating system and the validity of the numerical model and method. Figure 8 shows the outdoor temperature of the typical day and the corresponding heating load, which is inversely proportional. The heating load is a little delayed compared to the outside temperature. The highest and lowest outdoor temperatures are 0.8 °C and –8.2 °C respectively. The maximum heating load of the typical day is 368.4 kW at 9 o’clock, which is larger than the designed load for heating school (325.4 kW), and the average heating load is 281.6 kW.

4.2. Water Temperature at Each Node

Figure 9a,b give the water temperatures simulated and tested at five nodes of the system along the typical day, respectively. Tested results show that the phase transition temperature in the accumulator is 17–21 °C, which is some deviation from 20 °C set in the simulation.
In the simulation, the water temperature at the WSHP condenser outlet to users is 55 °C, and that at the WSHP condenser inlet returning from users is 49.4–51.5 °C depending on the outdoor temperature. Tested results show that the water temperature supplying users is stable and always about 54 °C, except for the afternoon (about 50.5 °C) when the WSHP runs at a lower level automatically, which is similar to the results simulated.
In the simulation, according to the operation strategy in Section 2, the water temperature at ASHP condenser outlet to WSHP evaporator is always higher than 20 °C, even when the ASHP stops, whose average value is 23.4 °C during the working period. The average water temperature at WSHP evaporator outlet to ASHP condenser is 16 °C. Tested results show that the average water temperature at ASHP condenser outlet to WSHP evaporator is about 22.8 °C during the ASHP working period and the water temperature at the WSHP evaporator inlet fluctuates between 18–21 °C. The heat loss along the pipeline leads to a gap between the water temperature at ASHP condenser outlet to WSHP evaporator and that at WSHP evaporator inlet.

4.3. Power Consumed

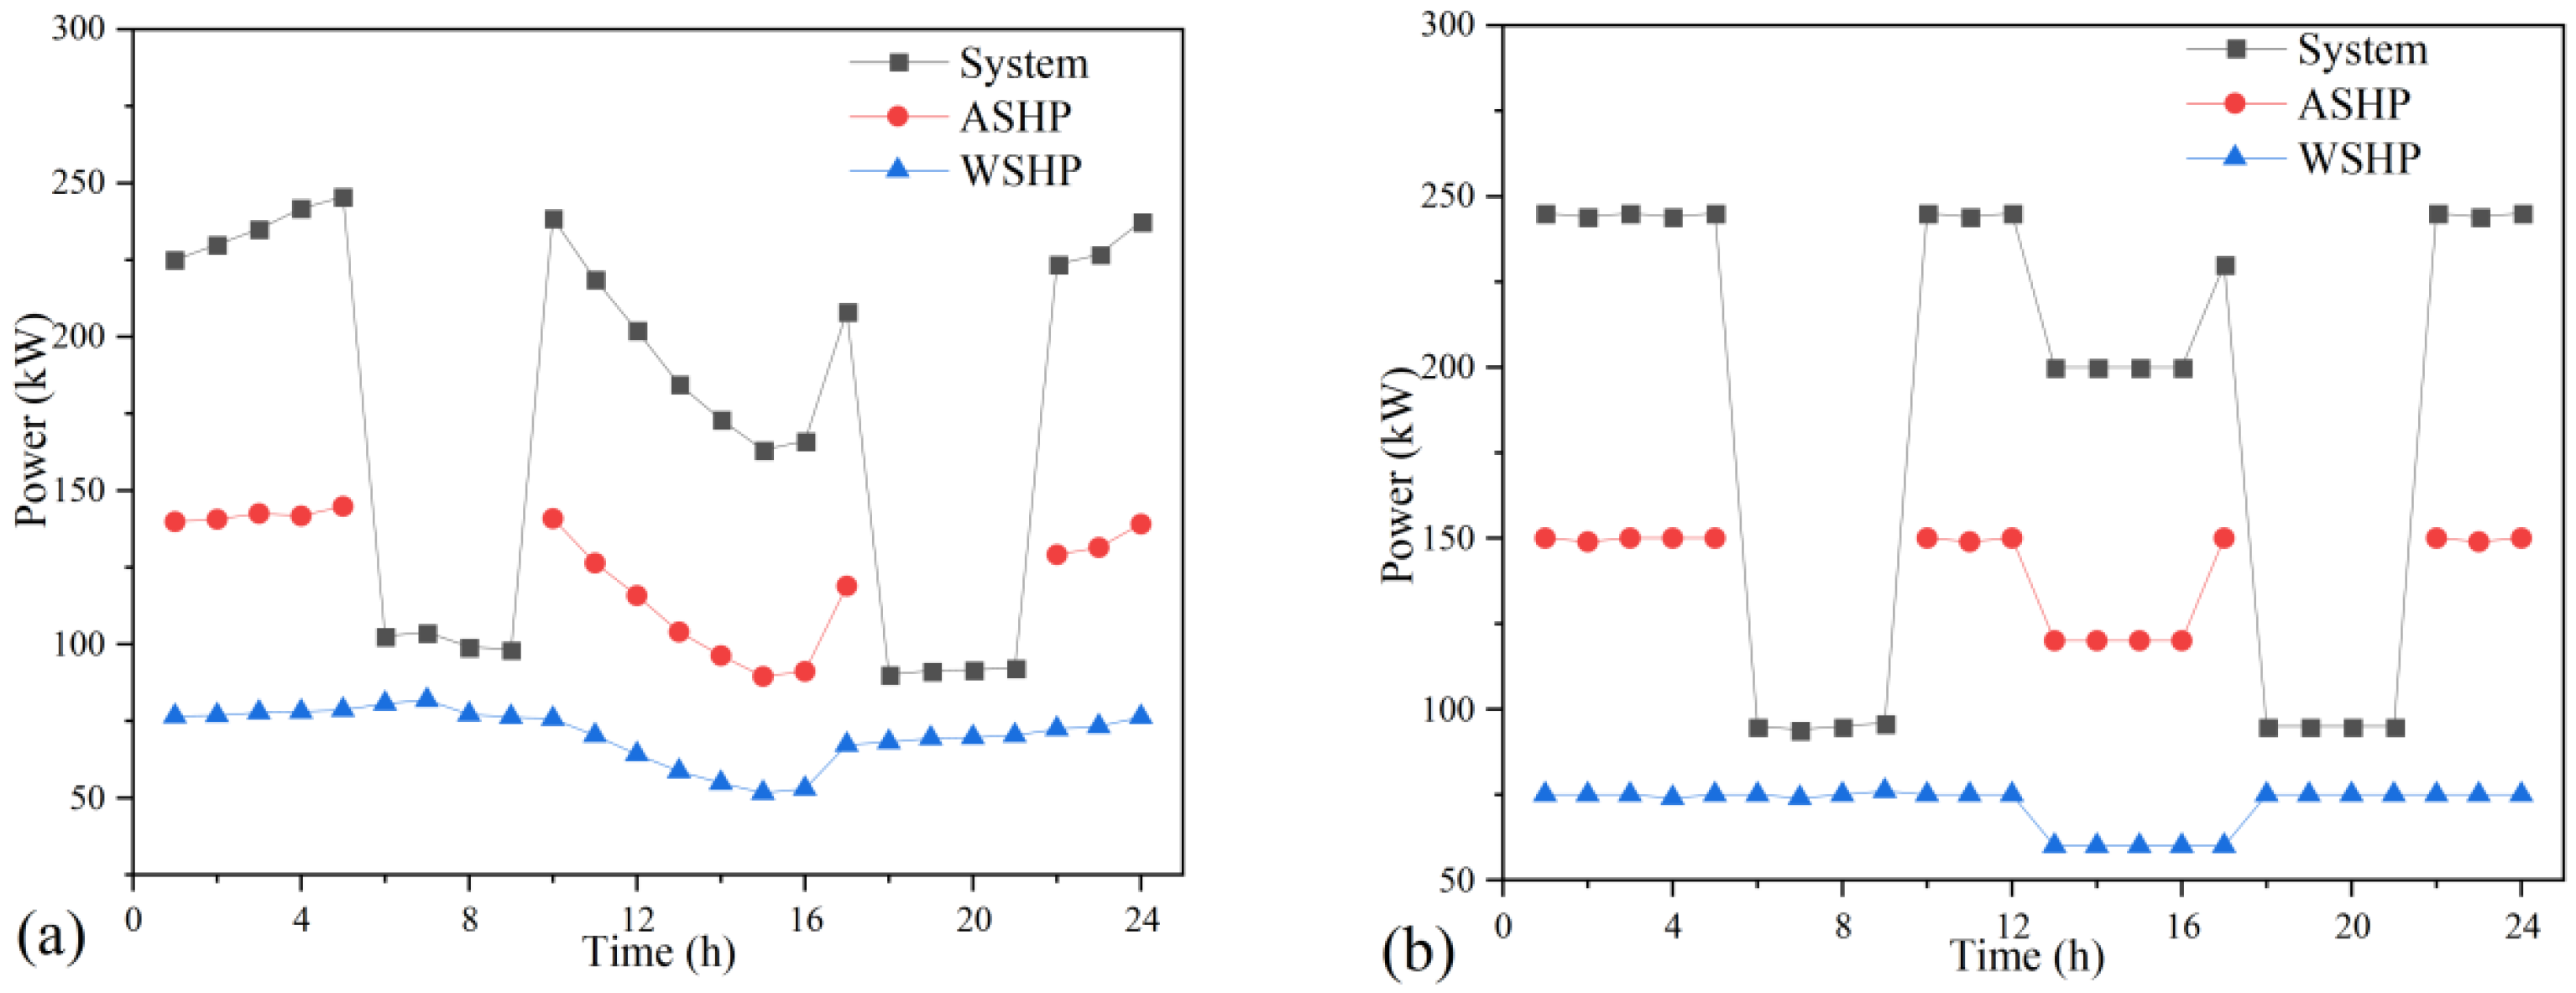
Figure 10a shows the simulated operating power of the ASHP, the WSHP and the system along the typical day, whose average values are 131.6 kW, 73.8 kW, and 168.5 kW, respectively. Figure 10b shows the power consumption tested of the ASHP, the WSHP, and the system, whose average values are 142 kW, 72 kW, and 188 kW respectively. Both simulated results and tested results are very similar, and as the outdoor temperature rises, the operating power of WSHP is reduced due to the lower heating demand and the improved ASHP performance. Some deviations between simulation and test could be because some disadvantage factors on the system performance are neglected in the simulation, such as ASHP frost. Here, the system operating power consumed includes the ASHP, WSHP, and water pumps located in the heat source house.

4.4. COPs

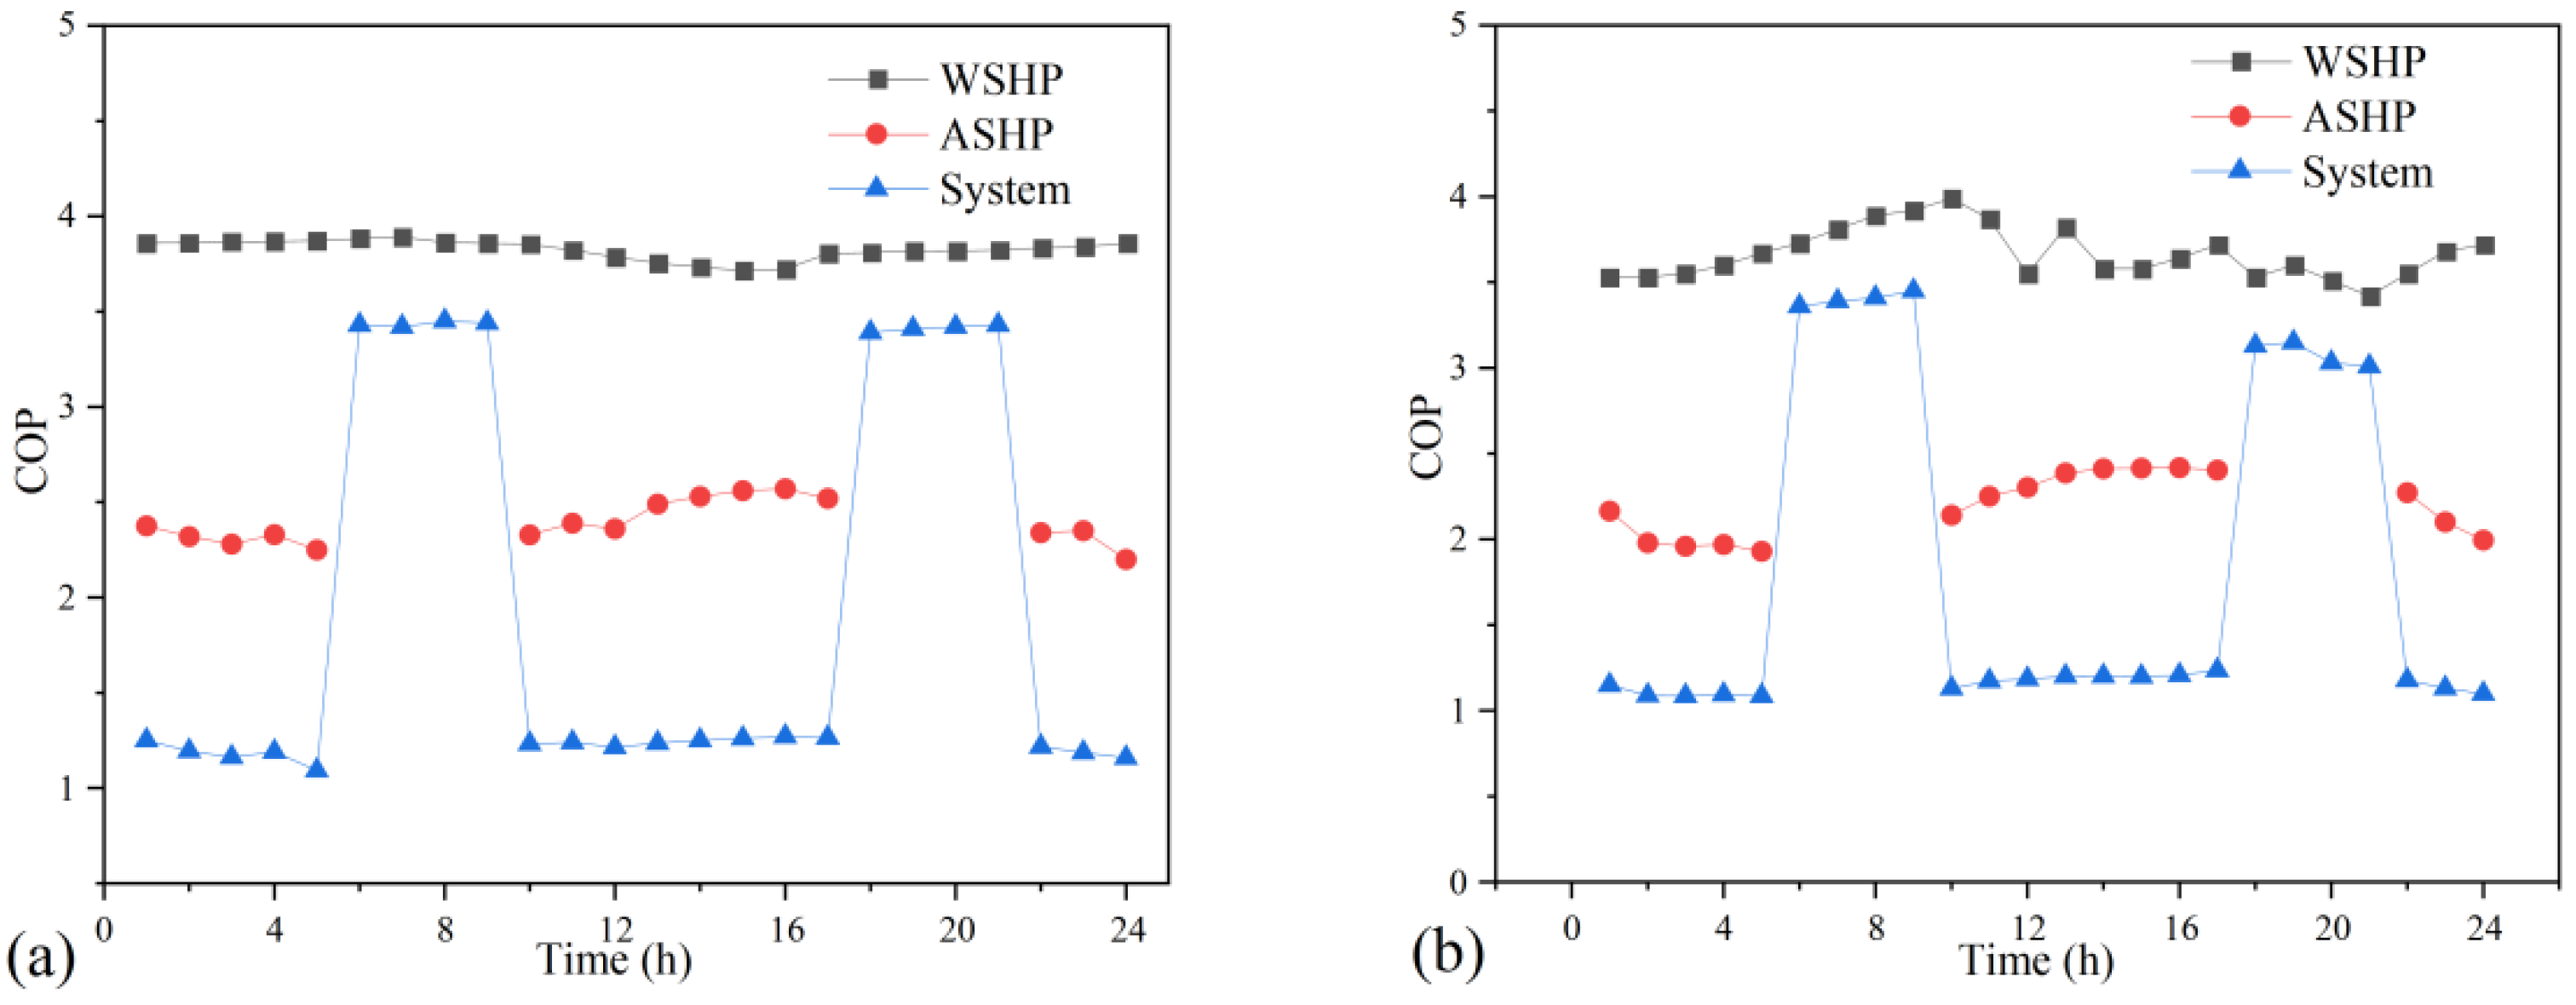
Figure 11 gives COPs simulated and tested over a the typical day. COPs are inversely proportional to corresponding powers consumed. Figure 11a shows the simulated COPs of the ASHP, the WSHP, and the system over a typical day, whose average values are 2.38, 3.82, and 2.05, respectively. Figure 11b shows the tested COPs over a typical day. The ASHP COP is 1.97–2.41 with the outdoor temperature. Because of the fluctuation of the inlet water temperature of the WSHP evaporator and the heating load along the test day, the maximum WSHP COP is 3.99 at 8:00 a.m. and the minimum is 3.58 at 12:00 p.m. When the ASHP stops, the system COP is larger than 3.3 during 6:00–10:00 a.m. and 3.0 during 6:00–10:00 p.m. The average value of the system COP is 2.0.
It is clear that the COPs of the ASHP and the system are improved a lot because the accumulators are introduced, and resulting in operating cost saving as well. The simulated results and the tested results are similar.

4.5. Comparison between Numerical Results with Test

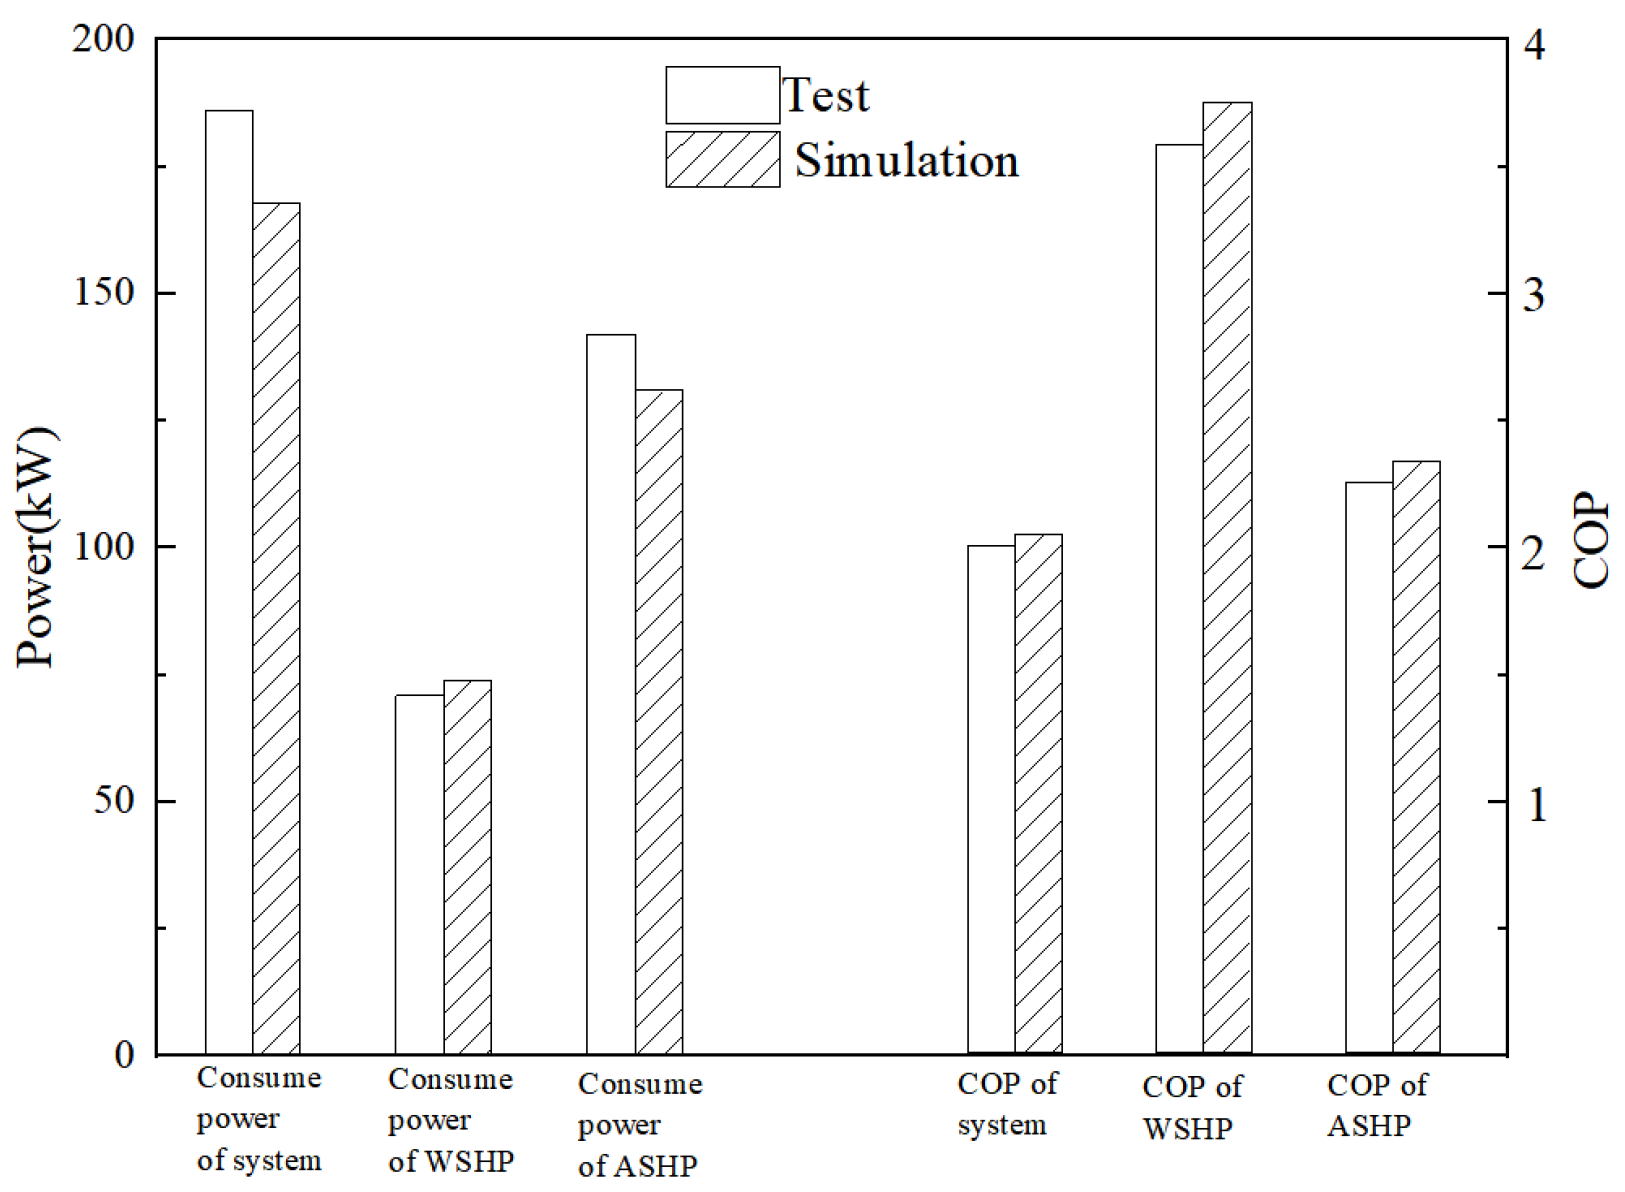
In order to illustrate reliability of the simulation method, Figure 12 shows the comparison between the numerical results with corresponding average values tested. Because some disadvantage factors on performance are neglected in the simulation, such as ASHP frost and the input simulated powers changing with the load, there are some gaps between the simulation and the test. The maximum relative error occurs in the power consumed by the system, which is 9.67%. The relative errors of powers consumed by ASHP and WSHP are 7.5% and 2.78%, respectively. The relative error of ASHP COP is 8.67%. The relative error of the WSHP COP and the system COP are 6.7% and 2.5% respectively. It is clear that the results and analysis based on the numerical model and method could be credible.
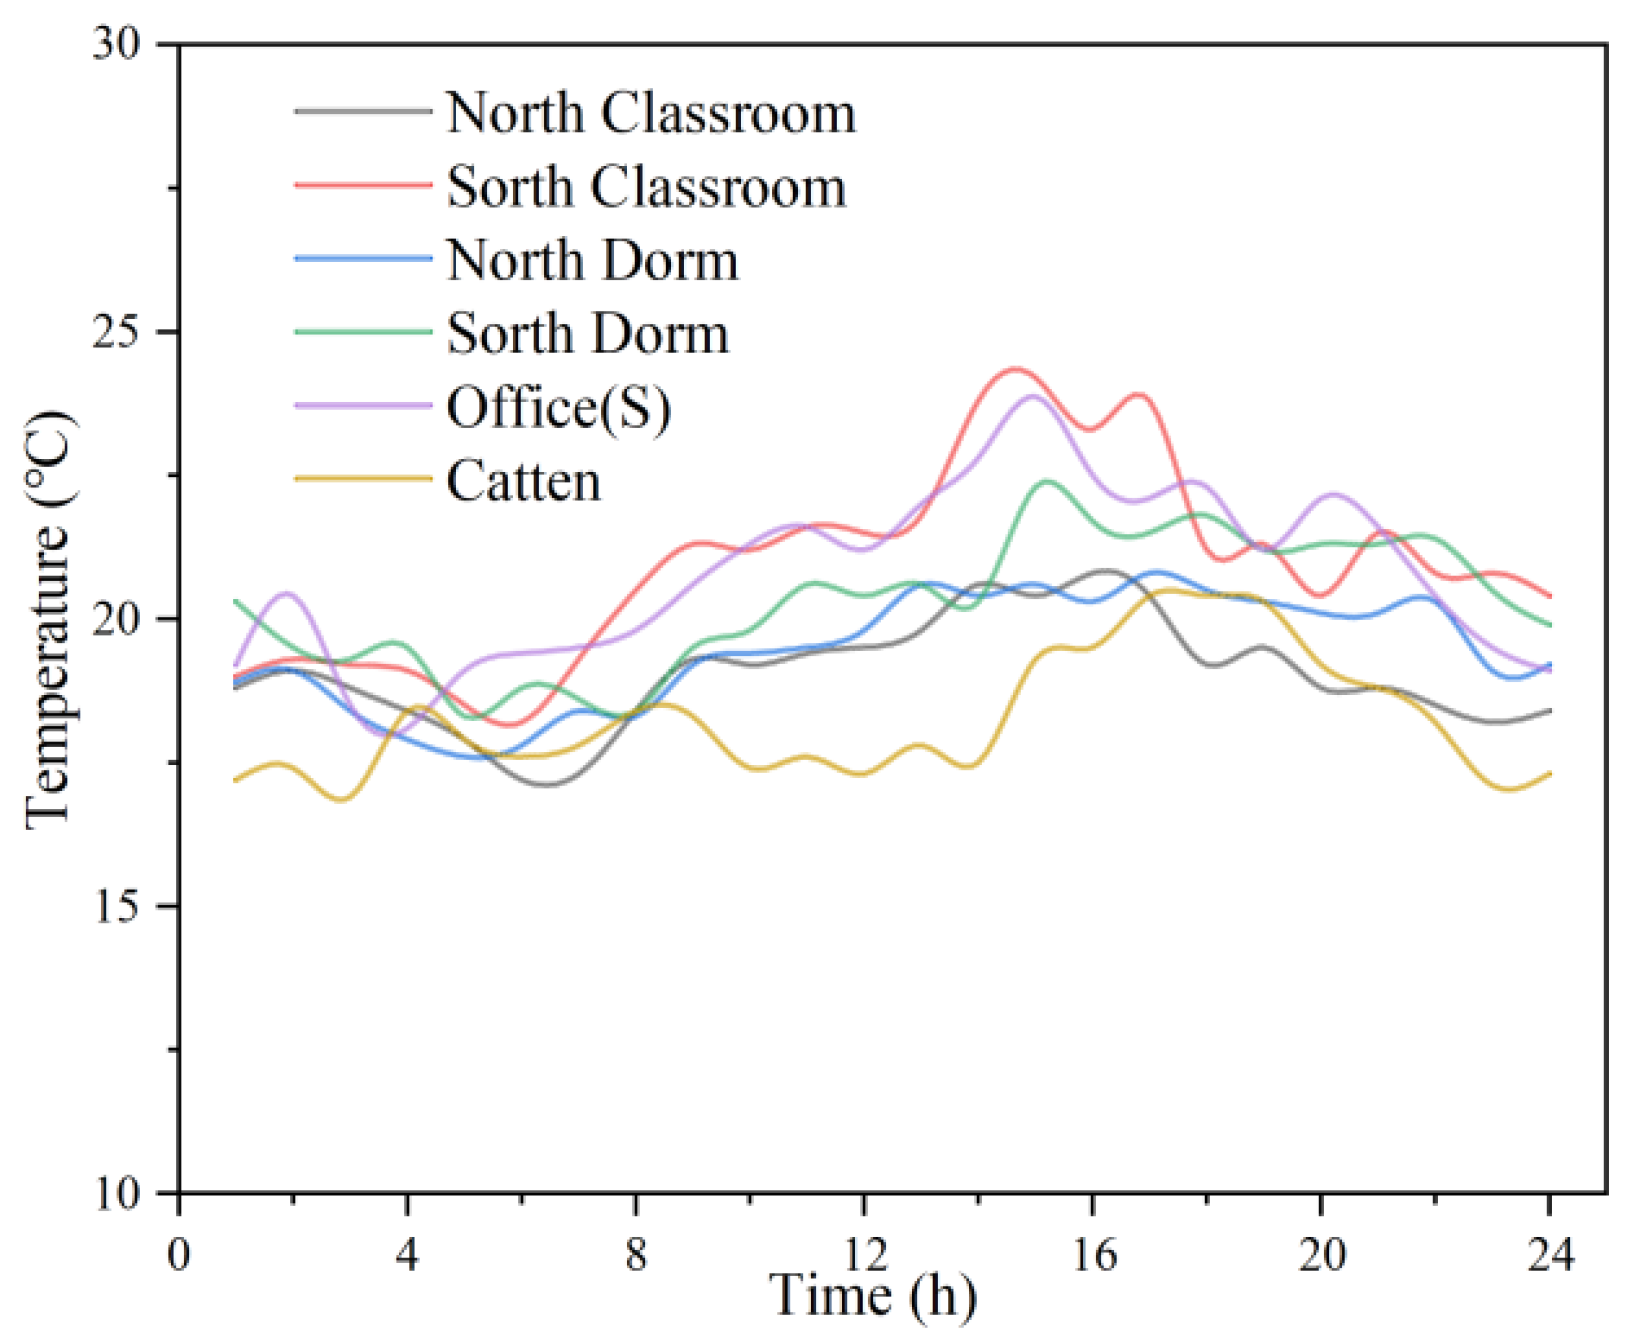
In order to illustrate the heating effect of the system, five rooms in different buildings were selected as the typical rooms and their indoor temperatures were tested over a typical day. Figure 13 shows the tested results and the average temperatures of the five typical rooms were 19.0 °C, 20.9 °C, 19.4 °C, 20.4 °C, 20.5 °C, and 18.2 °C, which indicates the heating system effect.

5. Conclusions

By introducing an accumulator, this article innovatively provides a heating system coupled with ASHP, accumulator and WSHP, and the system performance was numerically predicted with the help of TRANSYS software, which was verified by the field test that followed. The conclusions can be drawn as follows:
(1)
The numerical model and method developed in TRANSYS is practical and validated to calculate the performance of the heating system, even the coupled heat pump system.
(2)
Compared to the ASHP and WSHP system, the initial investment, energy and running cost saving effect of the coupled heating system is significantly improved by the introduced accumulator.
(3)
The heating system provided would be the promising one to cater to the clean transformation demand for some users such as the middle school mentioned in this paper.

Author Contributions

Conceptualization, methodology, and writing—review and editing, W.Z.; software, investigation, and writing—original draft preparation B.W.; validation and formal analysis, M.W.; data curation, Y.C. All authors have read and agreed to the published version of the manuscript.

Funding

This research was funded by Gansu Provincial Department of Education: Excellent Postgraduate “Innovation Star” Project grant number 2022CXZX-560.

Institutional Review Board Statement

Not applicable.

Informed Consent Statement

Not applicable.

Conflicts of Interest

The authors declare no conflict of interest.

References

  1. Abduljalil, A.; Al, A.; Mat, S.B.; Sopian, K.; Sulaiman, M.Y.; Lim, C.H.; Abdulrahman, T. Review of thermal energy storage for air conditioning systems. Renew Sust. Energ. Rev. 2012, 16, 5802–5819. [Google Scholar]
  2. Wu, Y.F. Investigation and analysis of the status quo and trend of building energy efficiency in China. Low Carbon World 2017, 17, 151–152. [Google Scholar]
  3. Chua, K.J.; Chou, S.K.; Yang, W.M.; Yan, J. Achieving better energy-efficient air conditioning–A review of technologies and strategies. Appl Energ. 2013, 104, 87–104. [Google Scholar] [CrossRef]
  4. Jiang, Y. China Building Energy Research Report 2020. Build. Energy Effic. 2021, 49, 1–6. [Google Scholar]
  5. Chua, K.J.; Chou, S.K.; Yang, W.M. Field test investigation of a double-stage coupled heat pumps heating system for cold regions. Int. J. Refrig. 2005, 28, 672–679. [Google Scholar]
  6. Ozgener, O.; Hepbasli, A. A review on the energy and exergy analysis of solar assisted heat pump systems. Renew Sustain. Energy Rev. 2007, 11, 482–496. [Google Scholar] [CrossRef]
  7. Ma, J.F.; Qian, Q.K.; Visscher, H.; Song, K. Homeowners’ Participation in Energy Efficient Renovation Projects in China’s Northern Heating Region. Sustainability 2021, 13, 9037. [Google Scholar] [CrossRef]
  8. Wu, Y.; Meng, Q.; Li, L.; Mu, J.Y. Interaction between Sound and Thermal Influences on Patient Comfort in the Hospitals of China’s Northern Heating Region. Appl. Sci. 2019, 9, 5551. [Google Scholar] [CrossRef] [Green Version]
  9. Zheng, Z.H.; Zhou, J.; Xu, F.; Zhang, R.; Guang, D. Integrated operation of PV assisted ground source heat pump and air source heat pump system: Performance analysis and economic optimization. Energy Convers. Manag. 2022, 269, 116091. [Google Scholar] [CrossRef]
  10. Chen, Q.; Li, N. Energy, emissions, economic analysis of air-source heat pump with radiant heating system in hot-summer and cold-winter zone in China. Energy Sustain. Dev. 2022, 70, 10–22. [Google Scholar] [CrossRef]
  11. Ermel, C.; Bianchi, M.V.A.; Cardoso, A.P.; Schneider, P.S. Thermal storage integrated into air-source heat pumps to leverage building electrification: A systematic literature review. Appl. Therm. Eng. 2022, 215, 118975. [Google Scholar] [CrossRef]
  12. Lu, S.L.; Feng, W.; Kong, X.F.; Wu, Y. Analysis and case studies of residential heat metering and energy-efficiency retrofits in China’s northern heating region. Renew Sust. Energy Rev. 2014, 38, 765–774. [Google Scholar] [CrossRef]
  13. Li, S.Y.; Lu, J.; Li, W.Y.; Zhang, Y.Q.; Huang, S.; Tian, L.; Lv, Y.F.; Hu, Y.F.; Zeng, Y.J. Thermodynamic analyses of a novel ejector enhanced dual-temperature air source heat pump cycle with self-defrosting. Appl. Therm. Eng. 2022, 215, 118944. [Google Scholar] [CrossRef]
  14. Gao, B.; Xiao, Y.Z.; Xiao, J.Y.; Yan, P.Y.; Nan, Y.Y.; Ji, N. Operation performance test and energy efficiency analysis of ground-source heat pump systems. J. Build. Eng. 2021, 41, 102446. [Google Scholar] [CrossRef]
  15. Shi, F.H. ASHP Technology and Application. HVAC 2019, 49, 86–95. [Google Scholar]
  16. Xu, W.; Liu, C.P.; Li, A.G.; Li, J.; Qiao, B. Feasibility and performance study on hybrid air source heat pump system for ultra-low energy building in severe cold region of China. Renew. Energy 2020, 146, 2124–2133. [Google Scholar] [CrossRef]
  17. Ling, J.H.; Tong, H.; Xing, J.C.; Zhao, Y.X. Simulation and optimization of the operation strategy of ASHP heating system: A case study in Tianjin. Energy Build. 2020, 226, 110349. [Google Scholar] [CrossRef]
  18. Li, X.Y. The Theory and Application of Compressor Intermediate Air-supplement Heat Pump Technology for Heating in Severe Cold Regions of Inner Mongolia. J. Beijing Jiaotong Univ. 2018, 42, 131–136. [Google Scholar]
  19. Meng, Y.; Sheng, L.; Xue, J.Z.; Yang, Z. Techno-economic analysis of air source heat pump combined with latent thermal energy storage applied for space heating in China. Appl. Therm. Eng. 2021, 185, 116434. [Google Scholar]
  20. Xu, Z.W.; Zhao, W.Y.; Shao, S.Q.; Wang, Z.C.; Xu, W.; Li, H.; Wang, Y.C.; Wang, W.; Yang, Q.; Xu, C. Analysis on key influence factors of air source heat pumps with field monitored data in Beijing. Sustain. Energy Technol. 2021, 48, 101642. [Google Scholar] [CrossRef]
  21. Sandra, R.L.C.; José, L.B.A. Phase change materials and energy efficiency of buildings: A review of knowledge. J. Energy Storage 2020, 27, 101083. [Google Scholar]
  22. Mohanrajab, M.; Karthicka, L.; Dhivagar, R. Performance and economic analysis of a heat pump water heater assisted regenerative solar still using latent heat storage. Appl. Therm. Eng. 2021, 196, 117263. [Google Scholar] [CrossRef]
  23. Badescu, V. Model of a thermal energy storage device integrated into a solar assisted heat pump system for space heating. Energy Convers. Manag. 2003, 44, 1589–1604. [Google Scholar] [CrossRef]
  24. Lizana, J.; Friedrich, D.; Renaldi, R.; Chacartegui, R. Energy flexible building through smart demand-side management and latent heat storage. Appl. Energy 2018, 230, 471–485. [Google Scholar] [CrossRef] [Green Version]
  25. Chu, S.; Wei, J.H.; Liu, Q.M. Scheme design and economic analysis of ground-source heat pump composite water storage system with buried pipes. Build. Energy Effic. 2020, 48, 58–67. [Google Scholar]
  26. Tang, R.; Wang, F.; Wang, Z.H.; Yang, W.W. Division of Frosting Type and Frosting Degree of the Air Source Heat Pump for Heating in China. Front. Energy Res. 2021, 9, 708478. [Google Scholar] [CrossRef]
  27. Li, Z.Y.; Wang, W.; Sun, Y.Y.; Wang, S.Q.; Shiming, D.; Yao, L. Applying image recognition to frost built-up detection in air source heat pumps. Energy 2021, 2022, 121004. [Google Scholar] [CrossRef]
  28. Xu, L.F.; Li, E.T.; Xu, Y.J.; Mao, N.; Shen, X.; Wang, X.L. An experimental energy performance investigation and economic analysis on a cascade heat pump for high-temperature water in cold region. Renew. Energy 2020, 152, 674–683. [Google Scholar] [CrossRef]
  29. Lin, Y.; Fan, Y.B.; Yu, M.; Jiang, L.; Zhang, X.J. Performance investigation on an air source heat pump system with latent heat thermal energy storage. Energy 2022, 239, 121898. [Google Scholar] [CrossRef]
  30. Qu, D.H. Research on Characteristics of Solar-Assisted ASHP Energy Storage System. Master’s Thesis, Harbin Institute of Technology, Harbin, China, 2017. [Google Scholar]
  31. Redón, A.; Navarro-Peris, E.; Pitarch, M.; Gonzálvez-Macia, J.; Corberán, J.M. Analysis and optimization of subcritical two-stage vapor injection heat pump systems. Appl. Energy 2014, 124, 231–240. [Google Scholar] [CrossRef] [Green Version]
  32. Chen, X.; Yang, H. Performance analysis of a proposed solar assisted ground coupled heat pump system. Appl. Energy 2012, 97, 888–896. [Google Scholar] [CrossRef]
  33. Zhang, J.M.; Yang, H.; Luo, D.W. The operation strategy of the combined system of ground-source heat pump and water storage is redesigned. Gas Heat 2019, 39, 15–25. [Google Scholar]
  34. Seevers, J.P.; Schlosser, F. Integration of heat pump storage systems in manufacturing systems via data farming and Monte Carlo simulation. Chem. Eng. Trans. 2019, 76, 373–378. [Google Scholar]
  35. Hirmiz, R.; Teamah, H.M.; Lightstone, M.F.; Cotton, J.S. Performance of heat pump integrated phase change material thermal storage for electric load shifting in building demand side management. Energy Build. 2019, 190, 103–118. [Google Scholar] [CrossRef]
  36. Chen, H.F.; Li, G.Q.; Ling, Y.Y.; Fu, J.; Wang, Y.J.; Yang, J.; Jiang, L.Y.; Badiei, A.; Zhang, Y. Experimental Analysis of a Solar Energy Storage Heat Pump System. J. Therm. Sci. 2021, 30, 1491–1502. [Google Scholar] [CrossRef]
  37. Zhang, Q.; Zhao, Y.; Li, N.; Feng, F.; Shi, P.F. A novel solar photovoltaic/thermal assisted gas engine driven energy storage heat pump system (SESGEHPs) and its performance analysis. Energy Convers. Manag. 2019, 184, 301–314. [Google Scholar] [CrossRef]
  38. Christoph, Z.; Bernd, W.; Michael, L.; Gerwin, D.S. Thomas Leitgeb. Development of an Energy Efficient Extrusion Factory employing a latent heat storage and a high temperature heat pump. Appl. Energy 2020, 259, 114114. [Google Scholar]
  39. American Society of Heating; Refrigerating and Air-Conditioning Engineers; US Green Building Council; National Association of Home Builders of the United States. National Green Building Standard: ANSI/ASHRAE/NAHB/ICC Standard ICC/ASHRAE 700-2015; National Association of Home Builders of the United States: Washington, DC, USA, 2016; pp. 1–76. [Google Scholar]
  40. Wang, Y.B.; Quan, Z.H.; Jing, H.R.; Wang, L.C.; Zhao, Y.H. Performance and operation strategy optimization of a new dual-source building energy supply system with heat pumps and energy storage. Energy Convers. Manag. 2021, 239, 114204. [Google Scholar] [CrossRef]
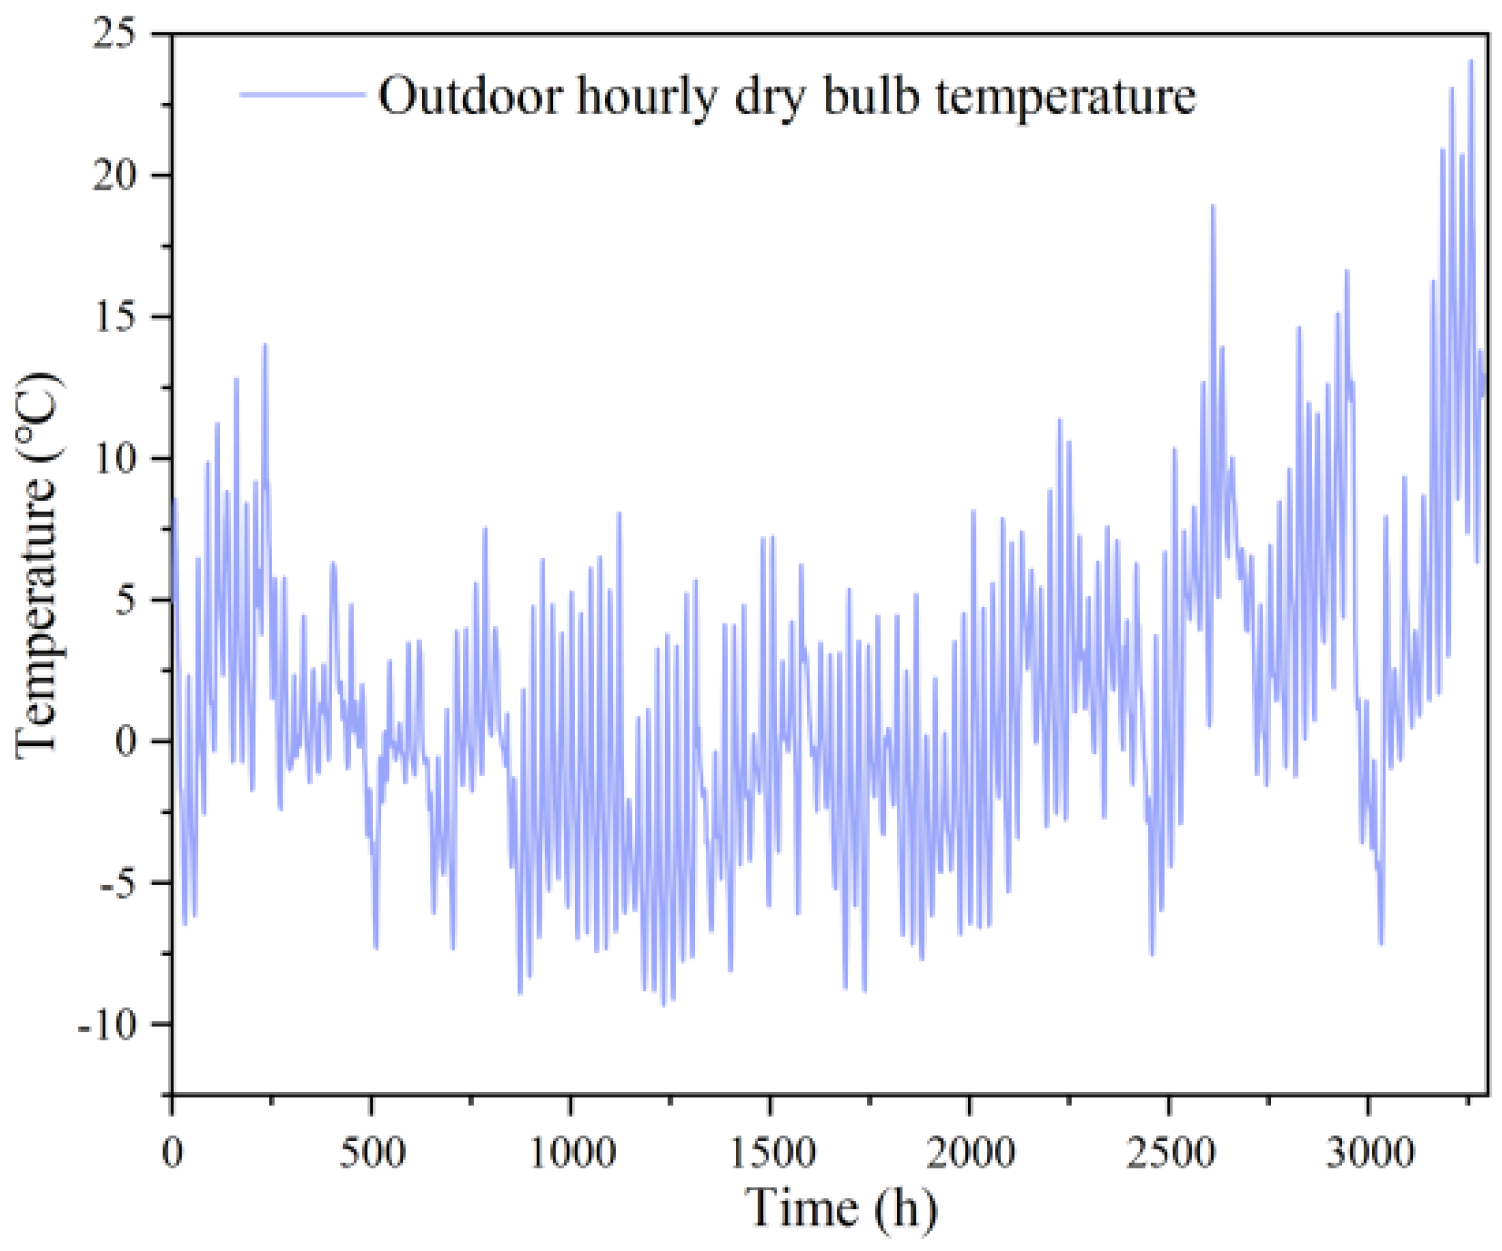
Figure 1. Hourly outdoor temperature.
Energies 15 07305 g001
Figure 2. Regional layout of the school.
Energies 15 07305 g002
Figure 3. The heat pump heating system.
Energies 15 07305 g003
Figure 4. Heat load during heating period.
Energies 15 07305 g004
Figure 5. The simulated model.
Energies 15 07305 g005
Figure 6. Hourly utilization coefficient (a) for people, (b) for electrical equipment.
Energies 15 07305 g006
Figure 7. The hourly COPs during heating period.
Energies 15 07305 g007
Figure 8. Heating load on typical day.
Energies 15 07305 g008
Figure 9. Water temperatures (a) simulated, (b) tested.
Energies 15 07305 g009
Figure 10. Power of ASHP, WSHP and system. (a) simulated, (b) tested.
Energies 15 07305 g010
Figure 11. COPs of the ASHP, the WSHP, and the system: (a) simulated, (b) tested.
Energies 15 07305 g011
Figure 12. Comparison between simulation and test.
Energies 15 07305 g012
Figure 13. Indoor temperatures in the tested room.
Energies 15 07305 g013
Table 1. Operation strategy.
ModelASHPAccumulatorWSHPPeriod
1workingHeat rechargeworking10:00 a.m.–6:00 p.m.
2stopHeat releaseworking6:00 p.m.–10:00 p.m.
3workingHeat rechargeworking10:00 p.m.–6:00 a.m.
4stopHeat releaseworking6:00 a.m.–10:00 a.m.
Table 2. Main equipment and their parameters.
No.Device NameParameterQuantity
1WSHPmax heating capacity: 390 kW,
max input power: 80 kW
1
2ASHP 1max heating capacity: 300 kW,
max input power: 120 kW
1
3ASHP 2max heating capacity: 150 kW,
max input power: 60 kW
1
4circulating pump of ASHPrated input power: 10 kW2
5circulating pump of WSHPrated input power: 10 kW2
6accumulatorcapacity: 293 kW4
Table 3. Test parameters and instruments.
ParametersInstrumentsTypesAccuracyQuantity
Outdoor temperatureThermometerLGR-WD01u±0.2–0.5 °C1
Thermal resistance sensorWZP-230PT100,
Level A
1
Indoor temperatureThermometerLGR-WD01u±0.2–0.5 °C6
Flow rate and water temperatureUltrasound calorimeter (temperature probe and flow probe)TDS-1002–3%6
TDS-1002–3%
Power consumptionSmarter meterCHTK900E-3S41 W1
Publisher’s Note: MDPI stays neutral with regard to jurisdictional claims in published maps and institutional affiliations.