
An AI-Layered with Multi-Agent Systems Architecture for Prognostics Health Management of Smart Transformers: A Novel Approach for Smart Grid-Ready Energy Management Systems

 ,
,  ,
,  ,
,  ,
, 
Abstract
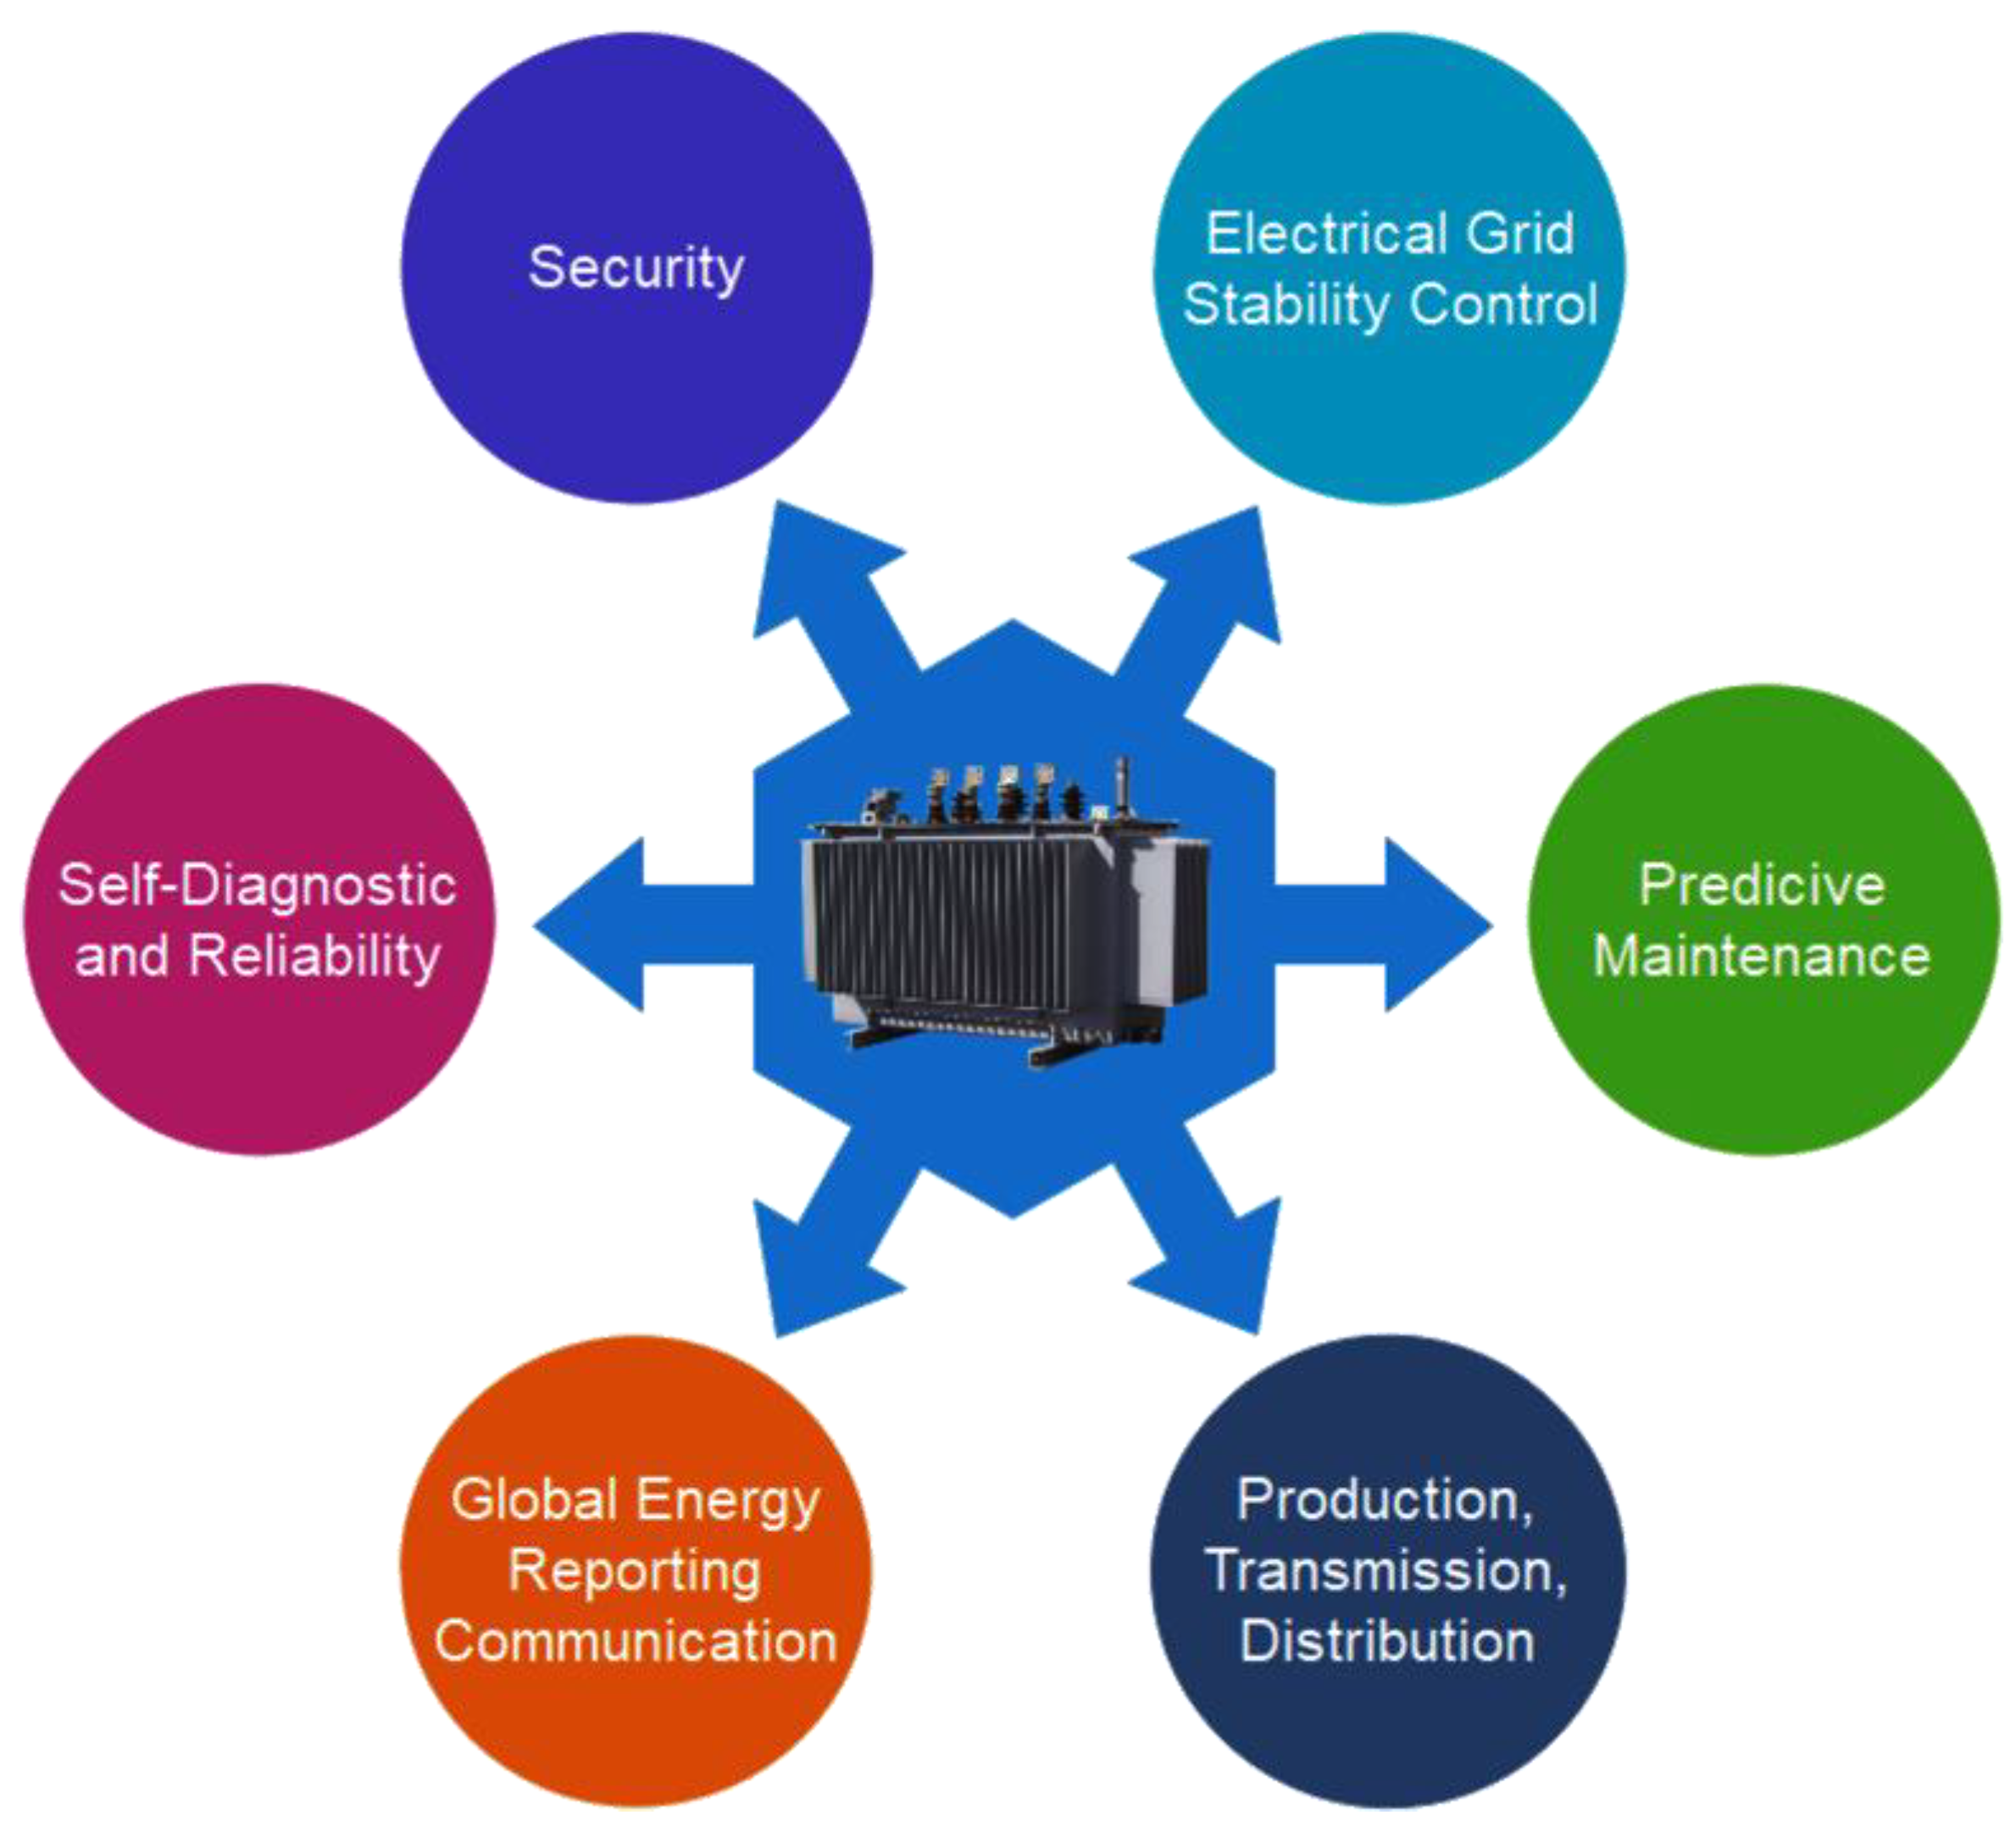
1. Introduction
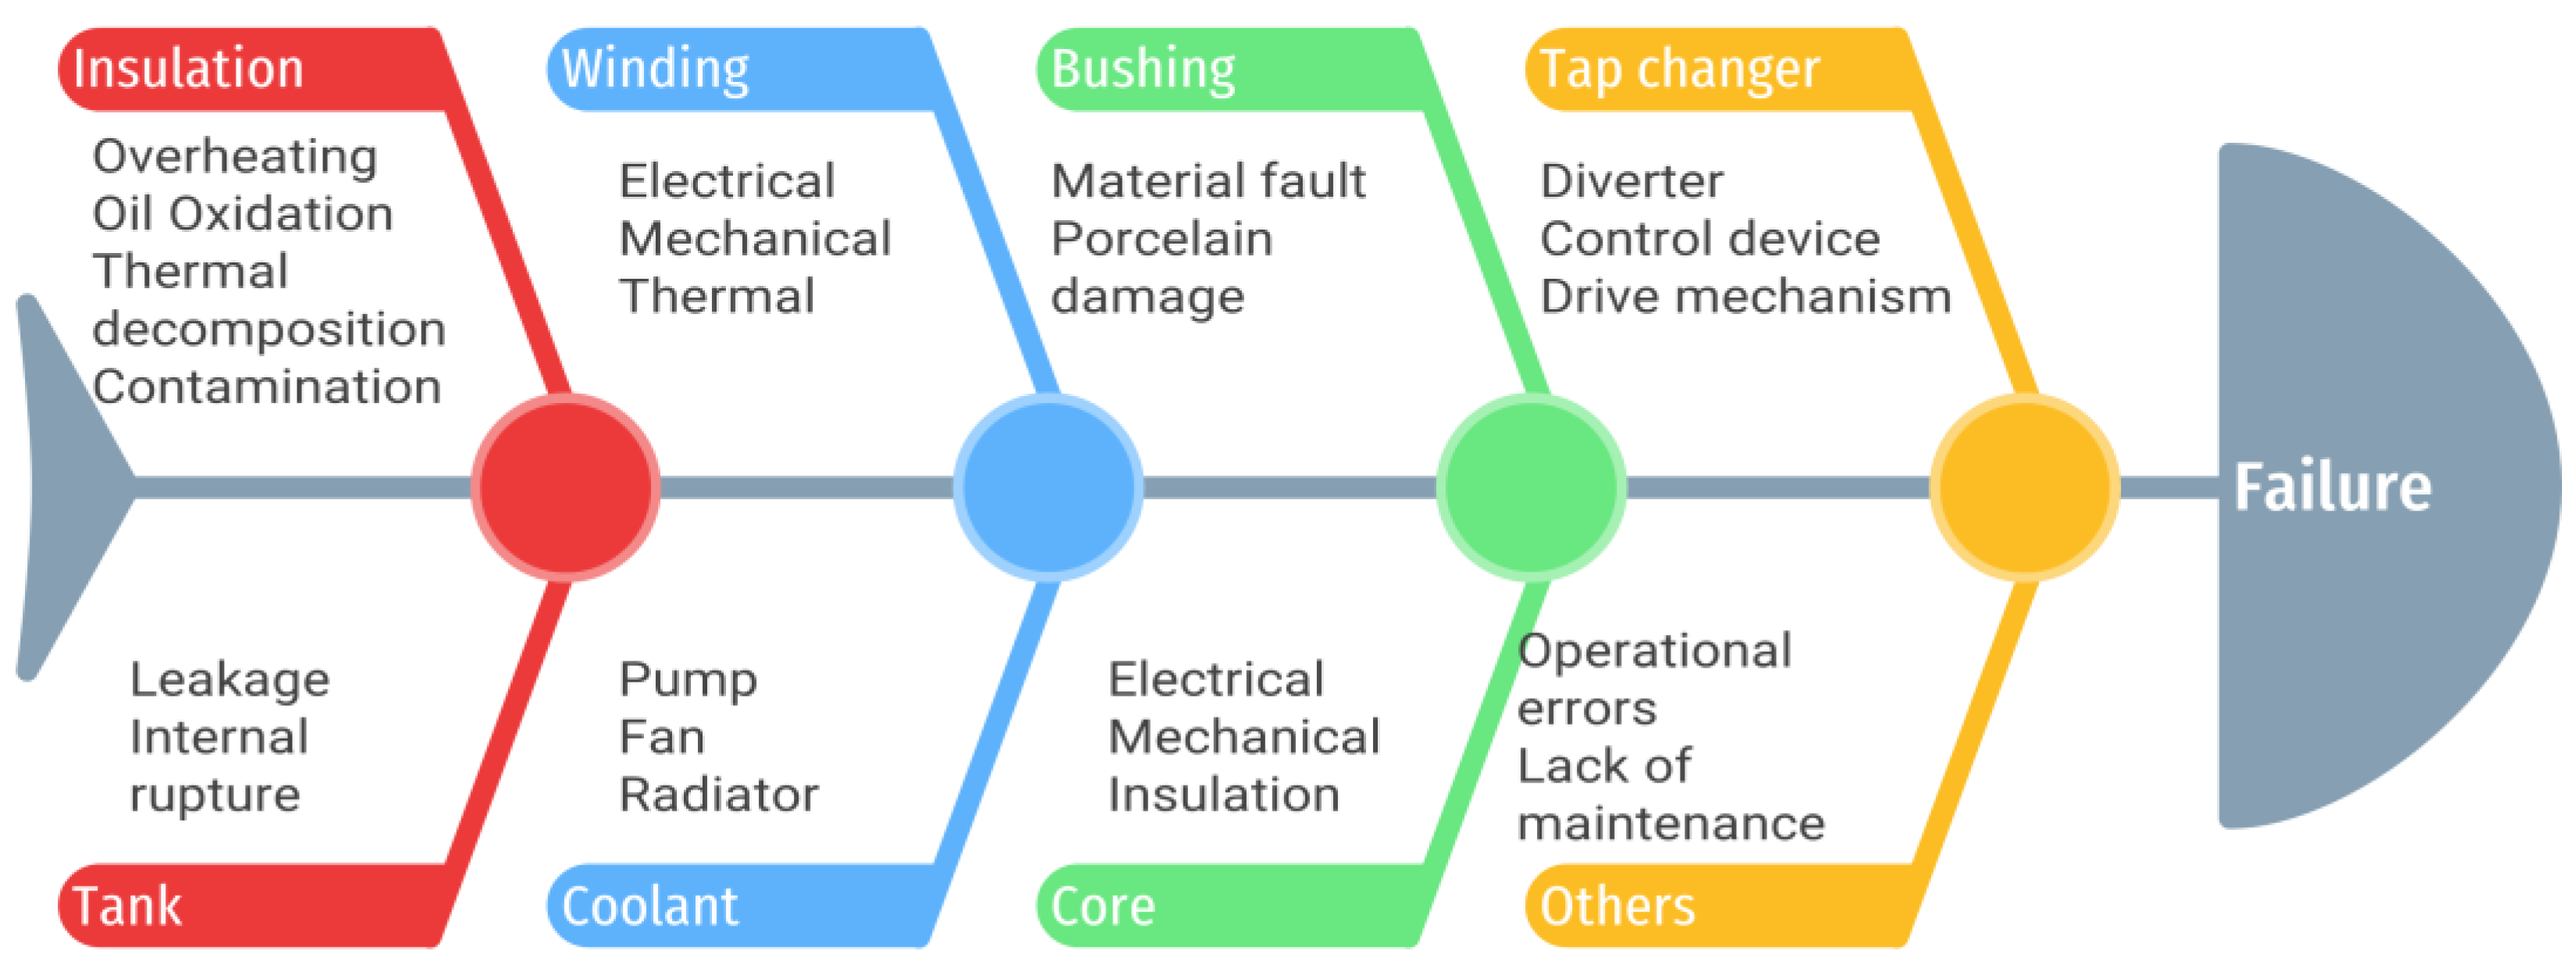
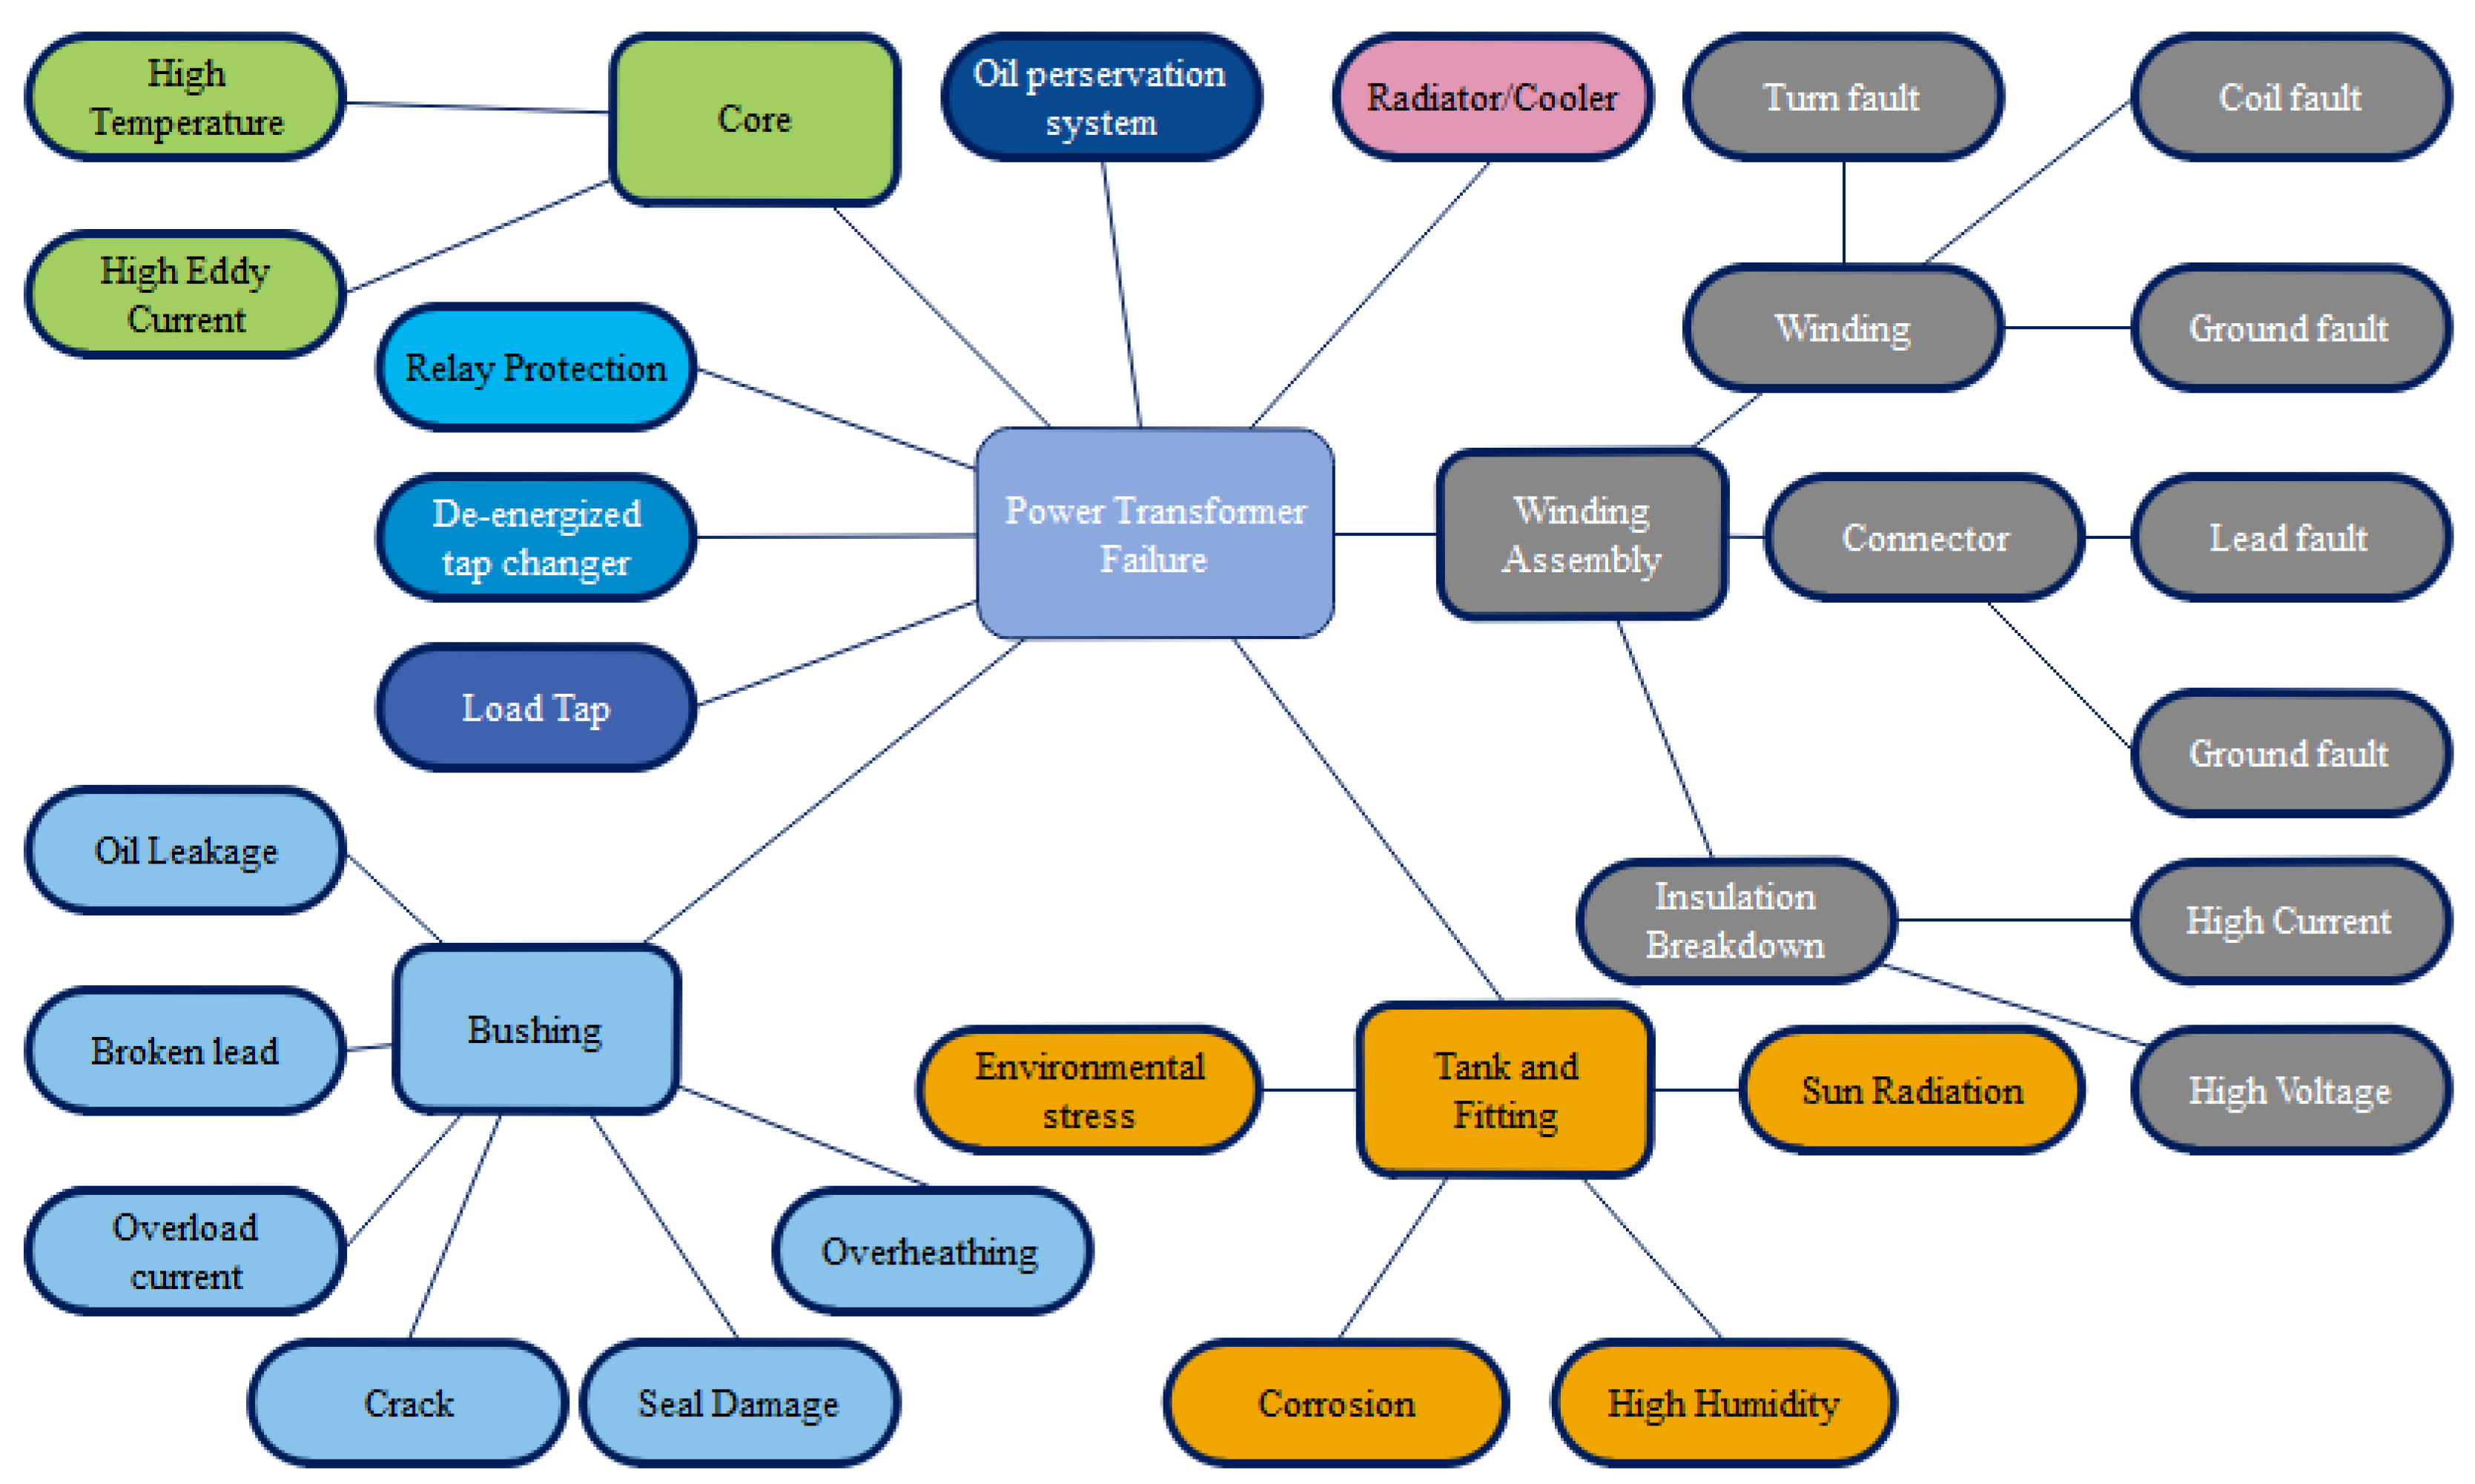
2. Power Transformer Failures
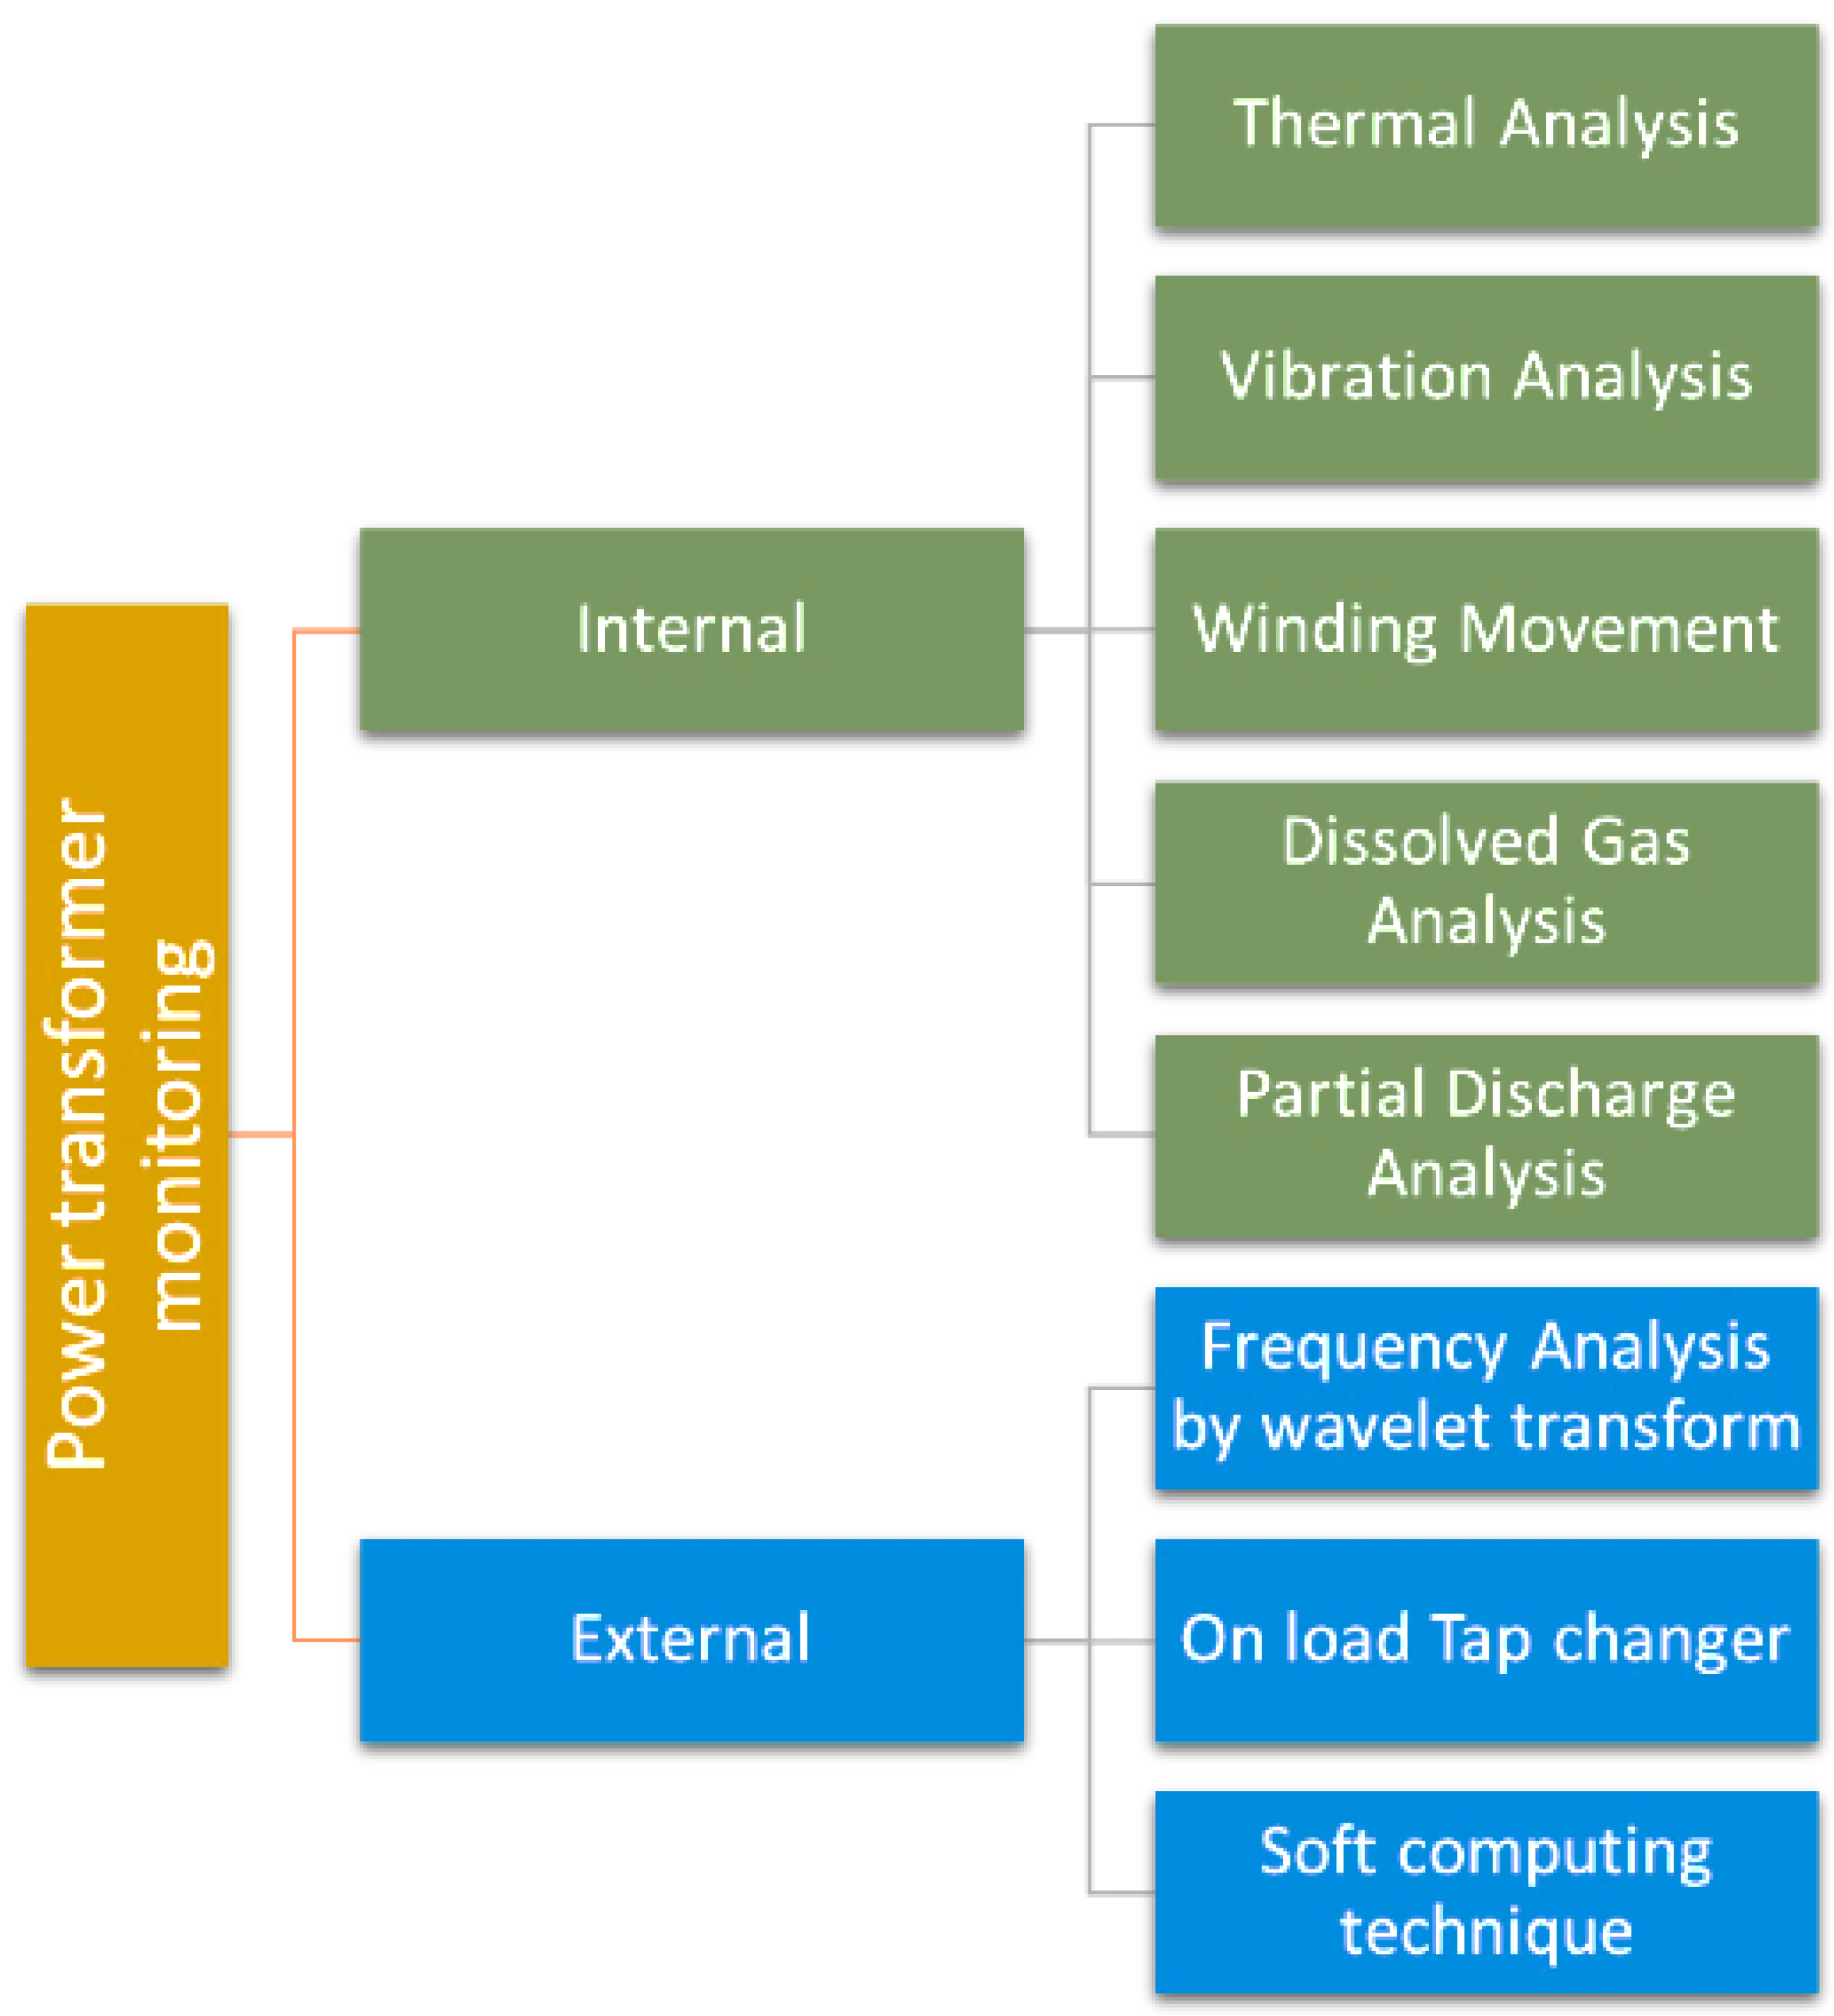
3. Power Transformer Monitoring Techniques
3.1. Temperature-Overheating
3.2. Discharges
4. State-of-the-Art Machine Learning-Based Methodologies for Power Transformers
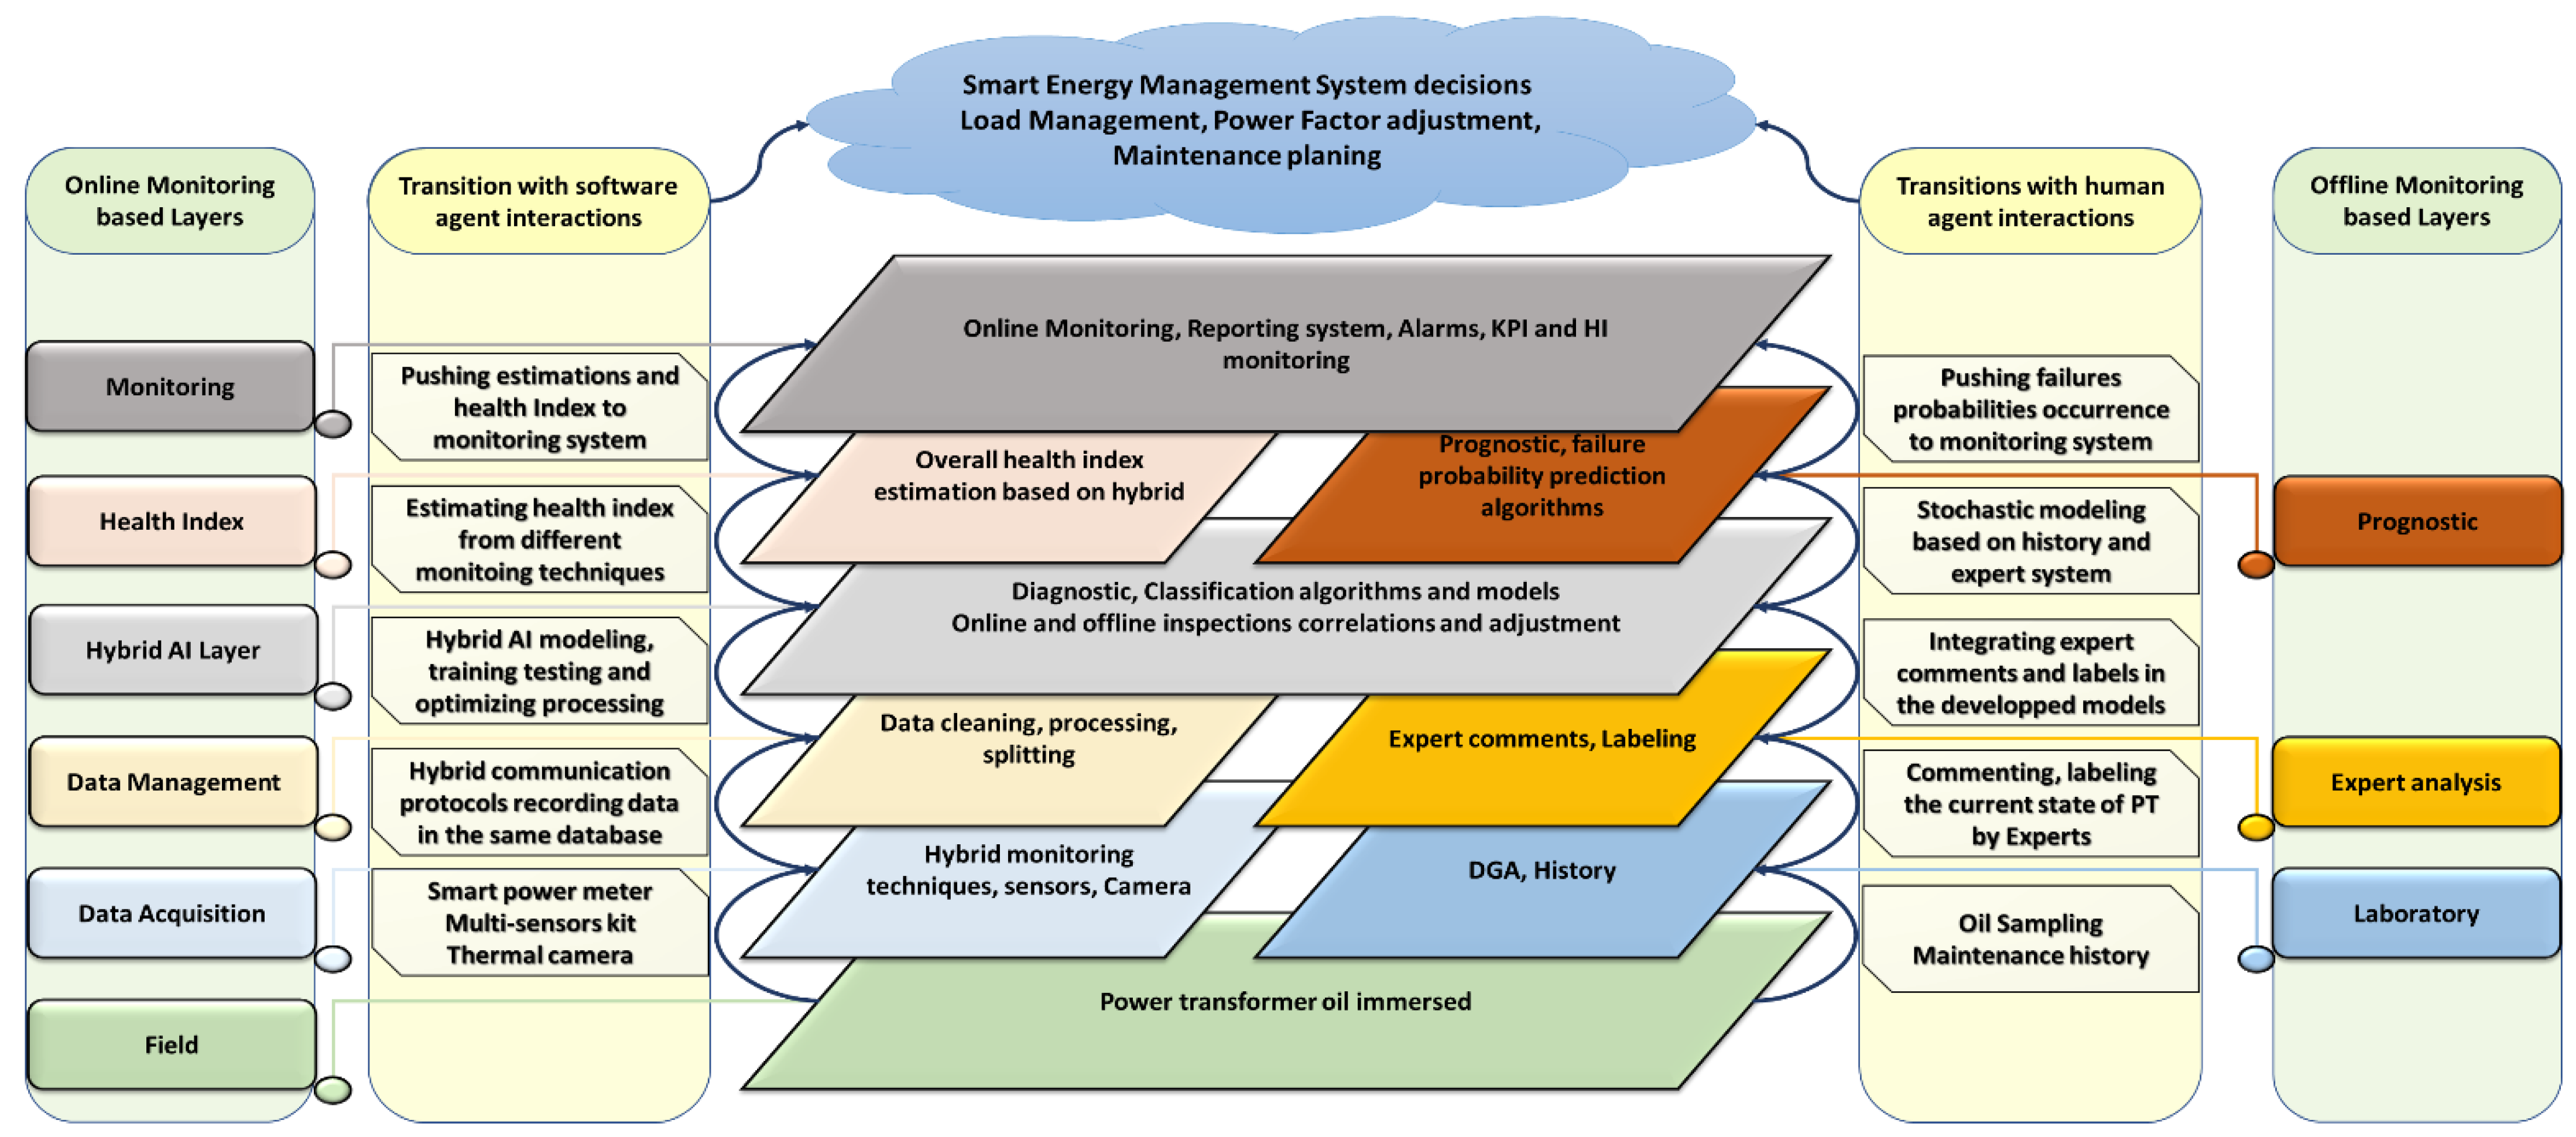
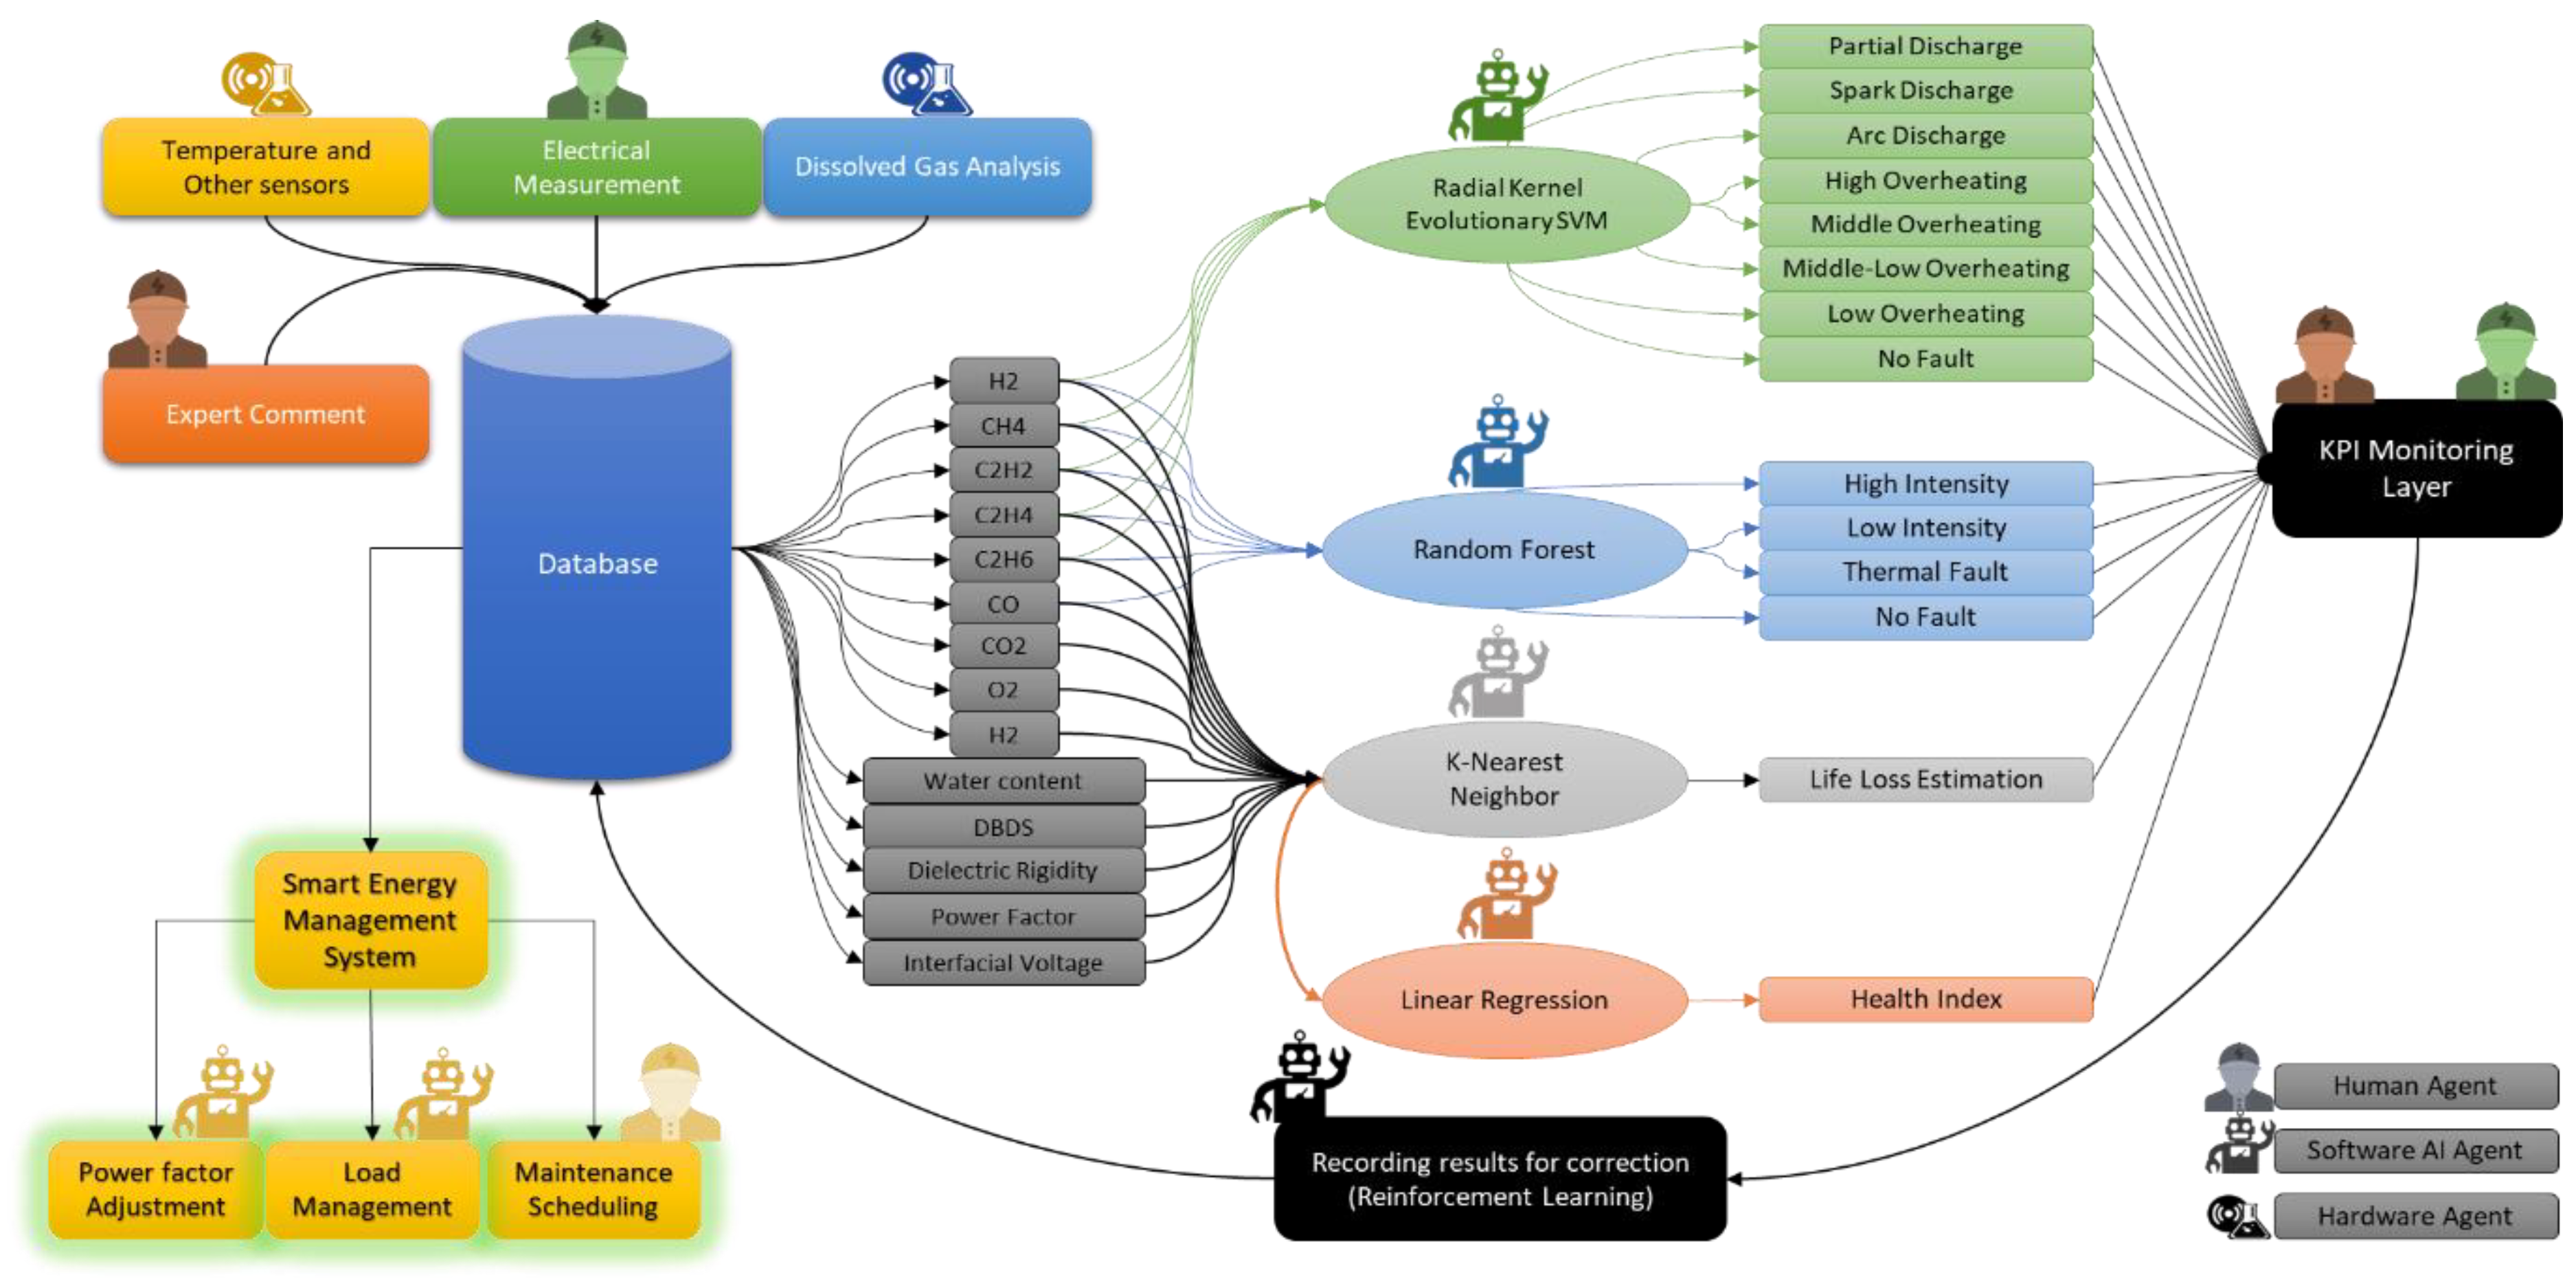
5. Hybrid Artificial Intelligence System Architecture
5.1. Online Monitoring Based Layers
5.1.1. Field
5.1.2. Data Acquisition
5.1.3. Data Management
5.1.4. Hybrid Artificial Intelligence
5.1.5. Health Index
5.1.6. Monitoring
5.2. Offline Monitoring Based Layers
5.2.1. Laboratory
5.2.2. Expert Analysis
5.2.3. Prognostic
5.2.4. Smart Energy Management System Decisions
6. Methodology
6.1. Classification Approach (RapidMiner Approach)
6.2. Life Loss and Health Index Estimation Approach (RapidMiner Approach)
7. Results and Discussion
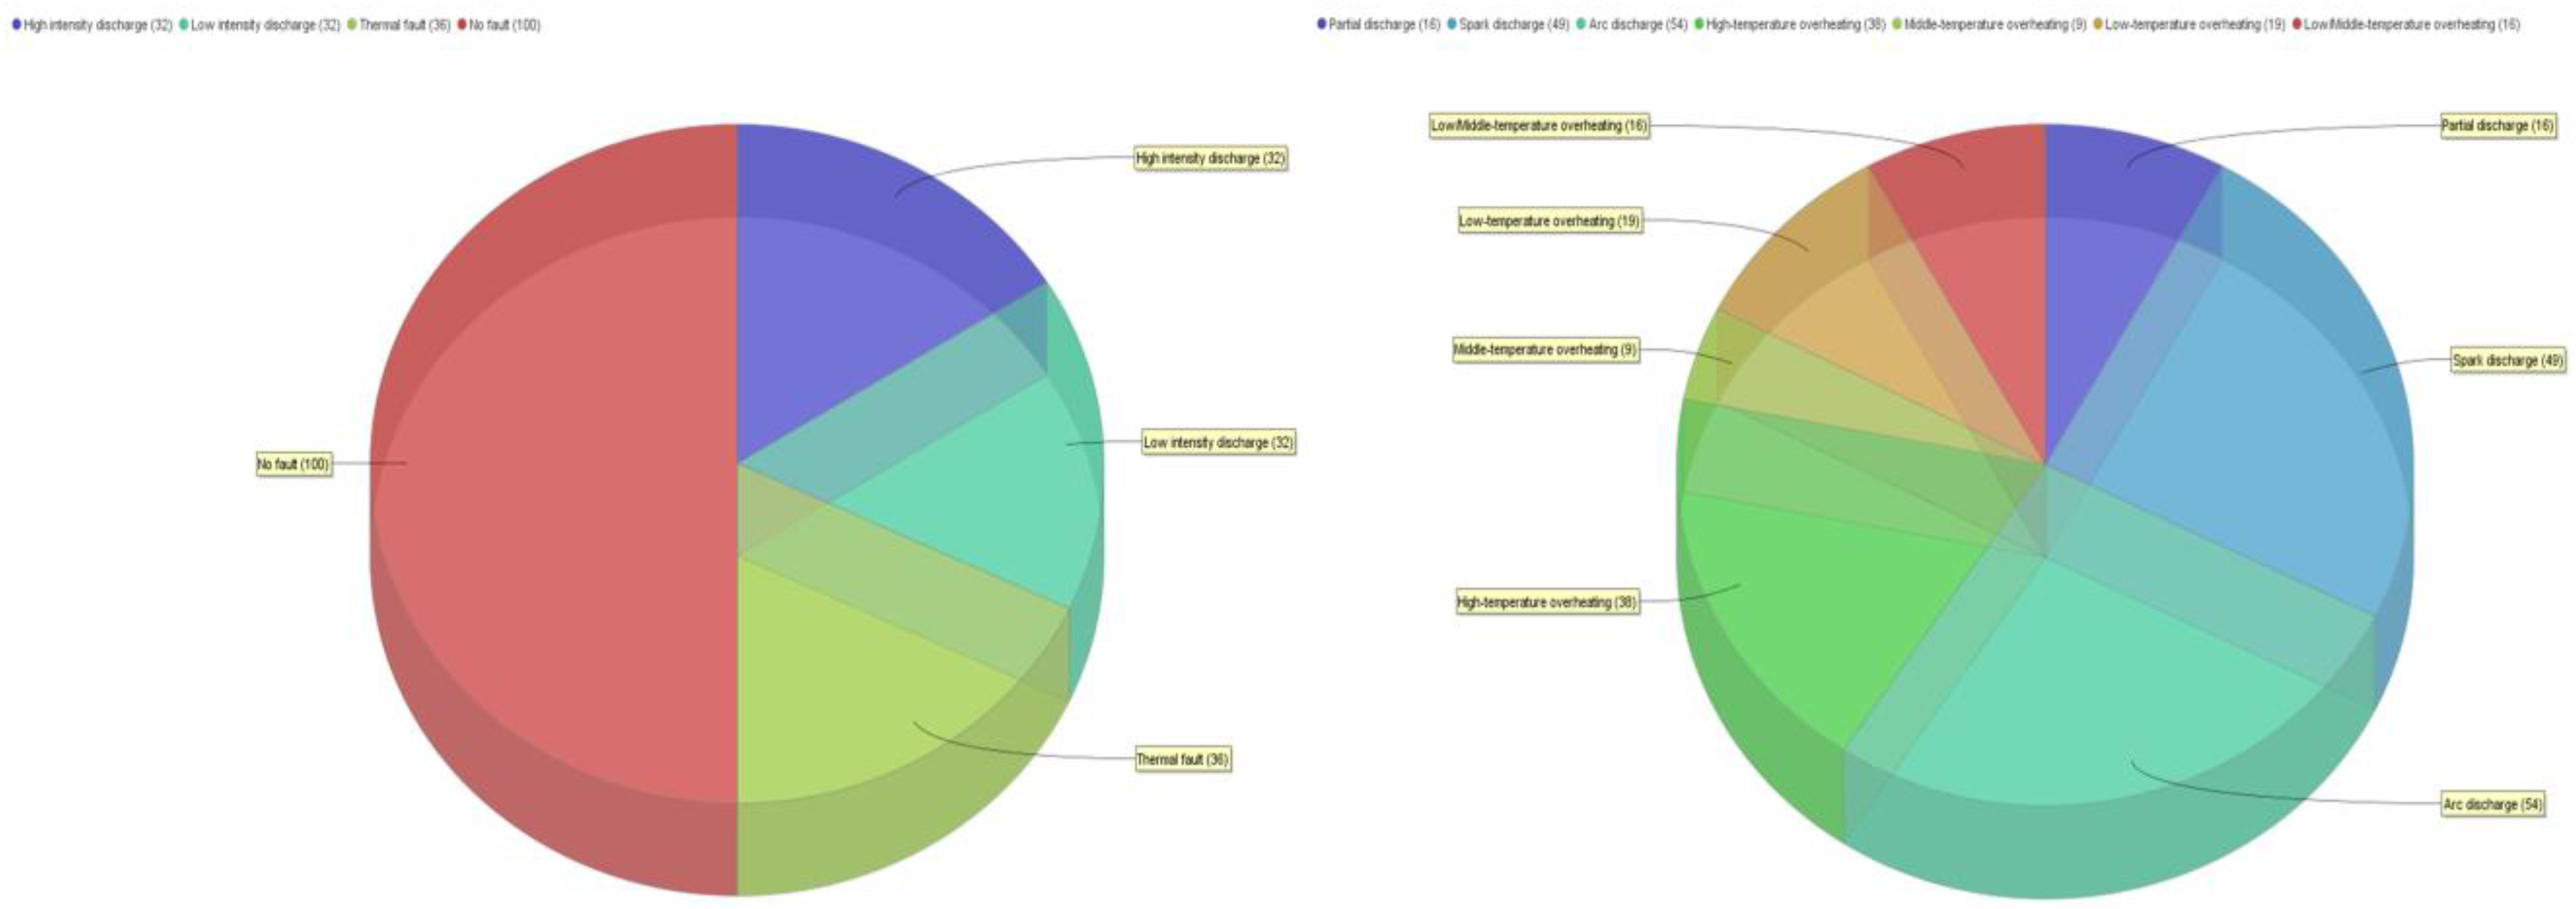
7.1. Datasets Description
7.1.1. Classification Failures Dataset and Labels
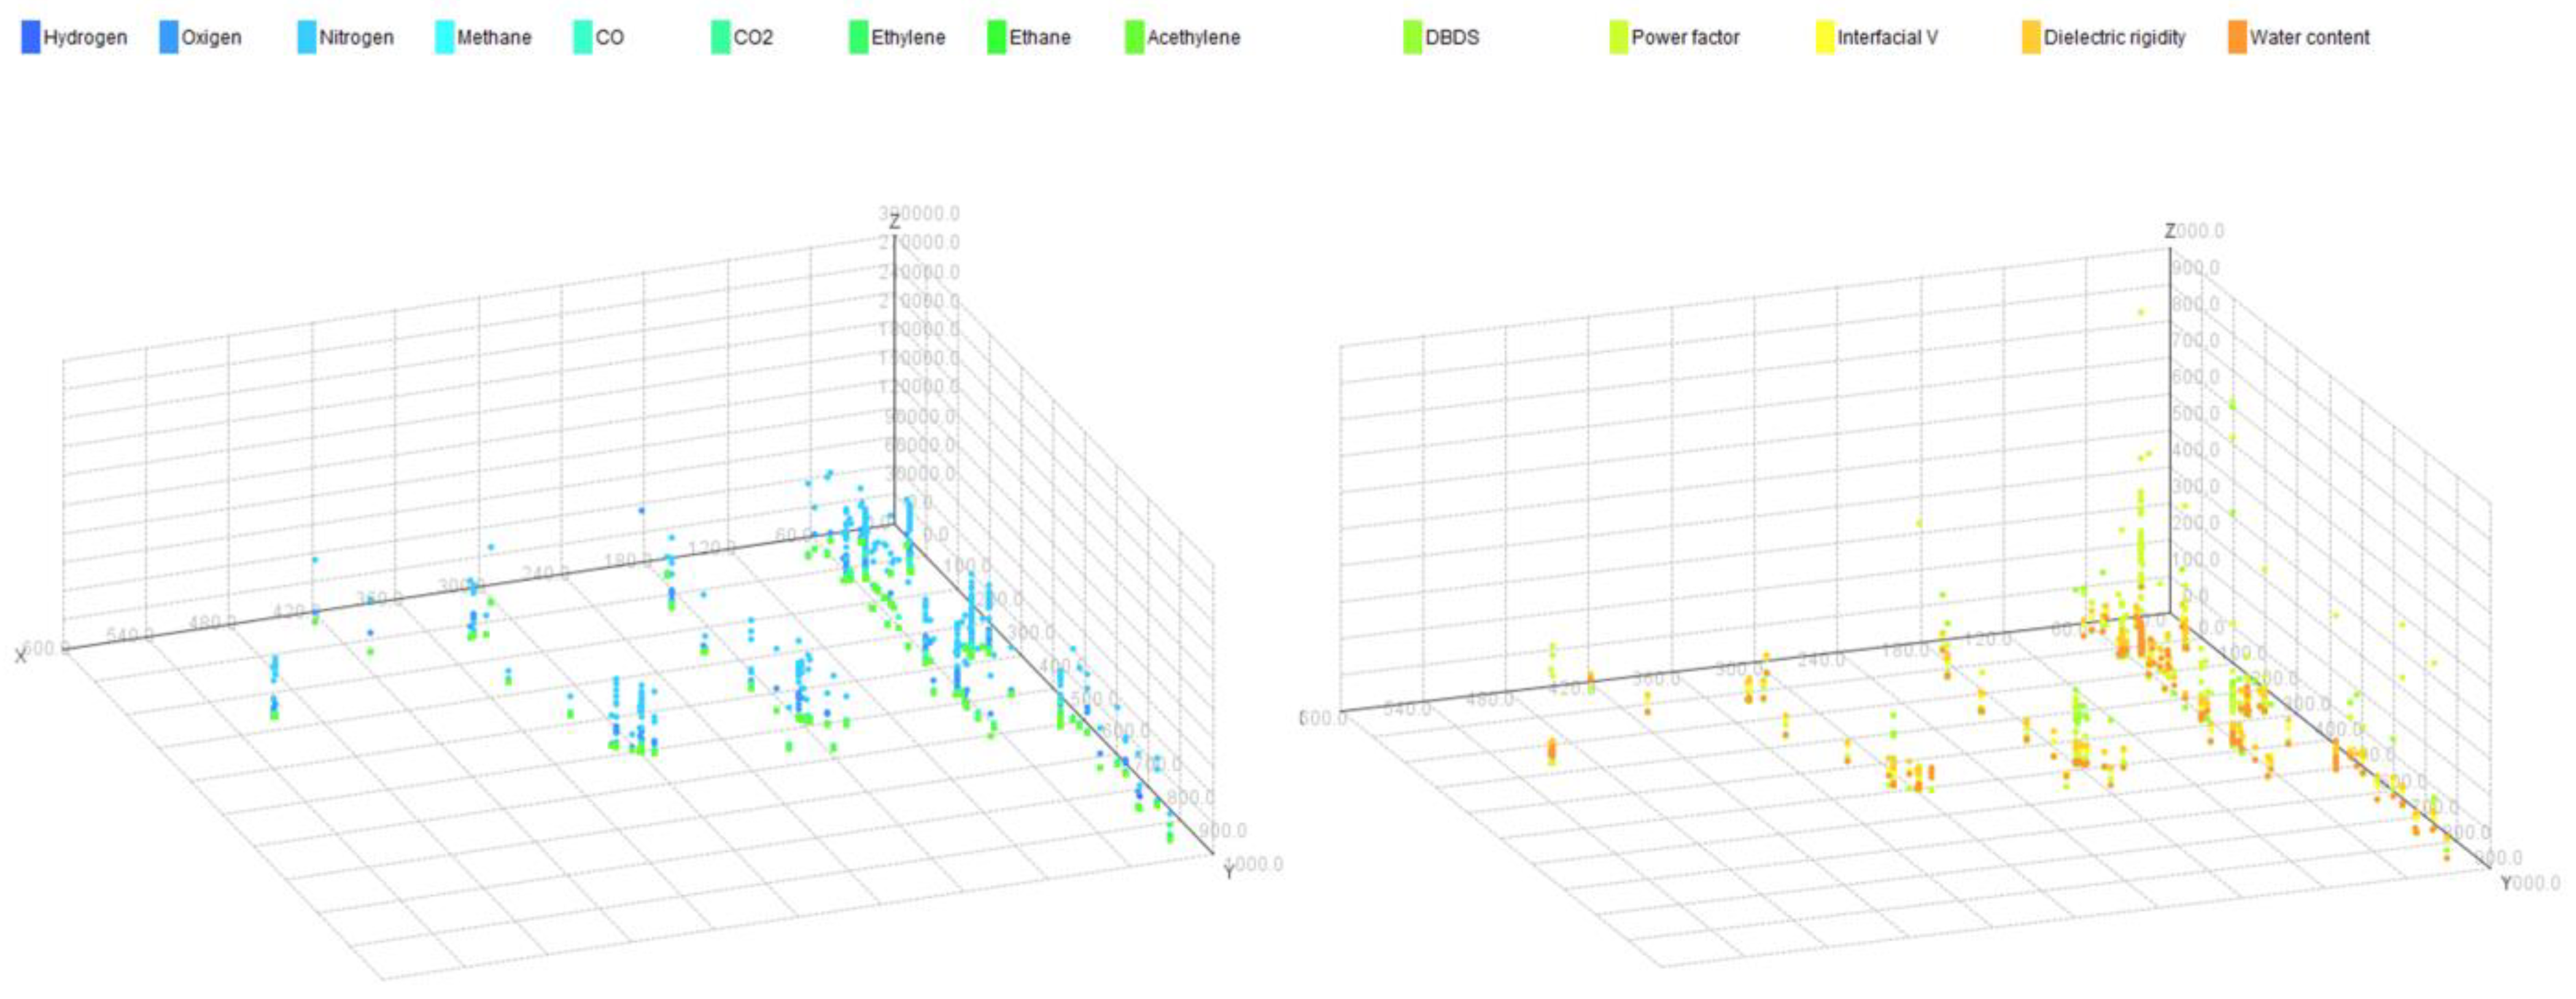
7.1.2. Health Index and Life-Loss Estimation Dataset
7.2. Algorithms Performance of 5 Gas Dataset
7.2.1. Results and Discussion
7.2.2. Selected Algorithm: SVM Evolutionary Radial Kernel
7.3. Algorithms Performance of 6 Gas Dataset
7.3.1. Results and Discussion
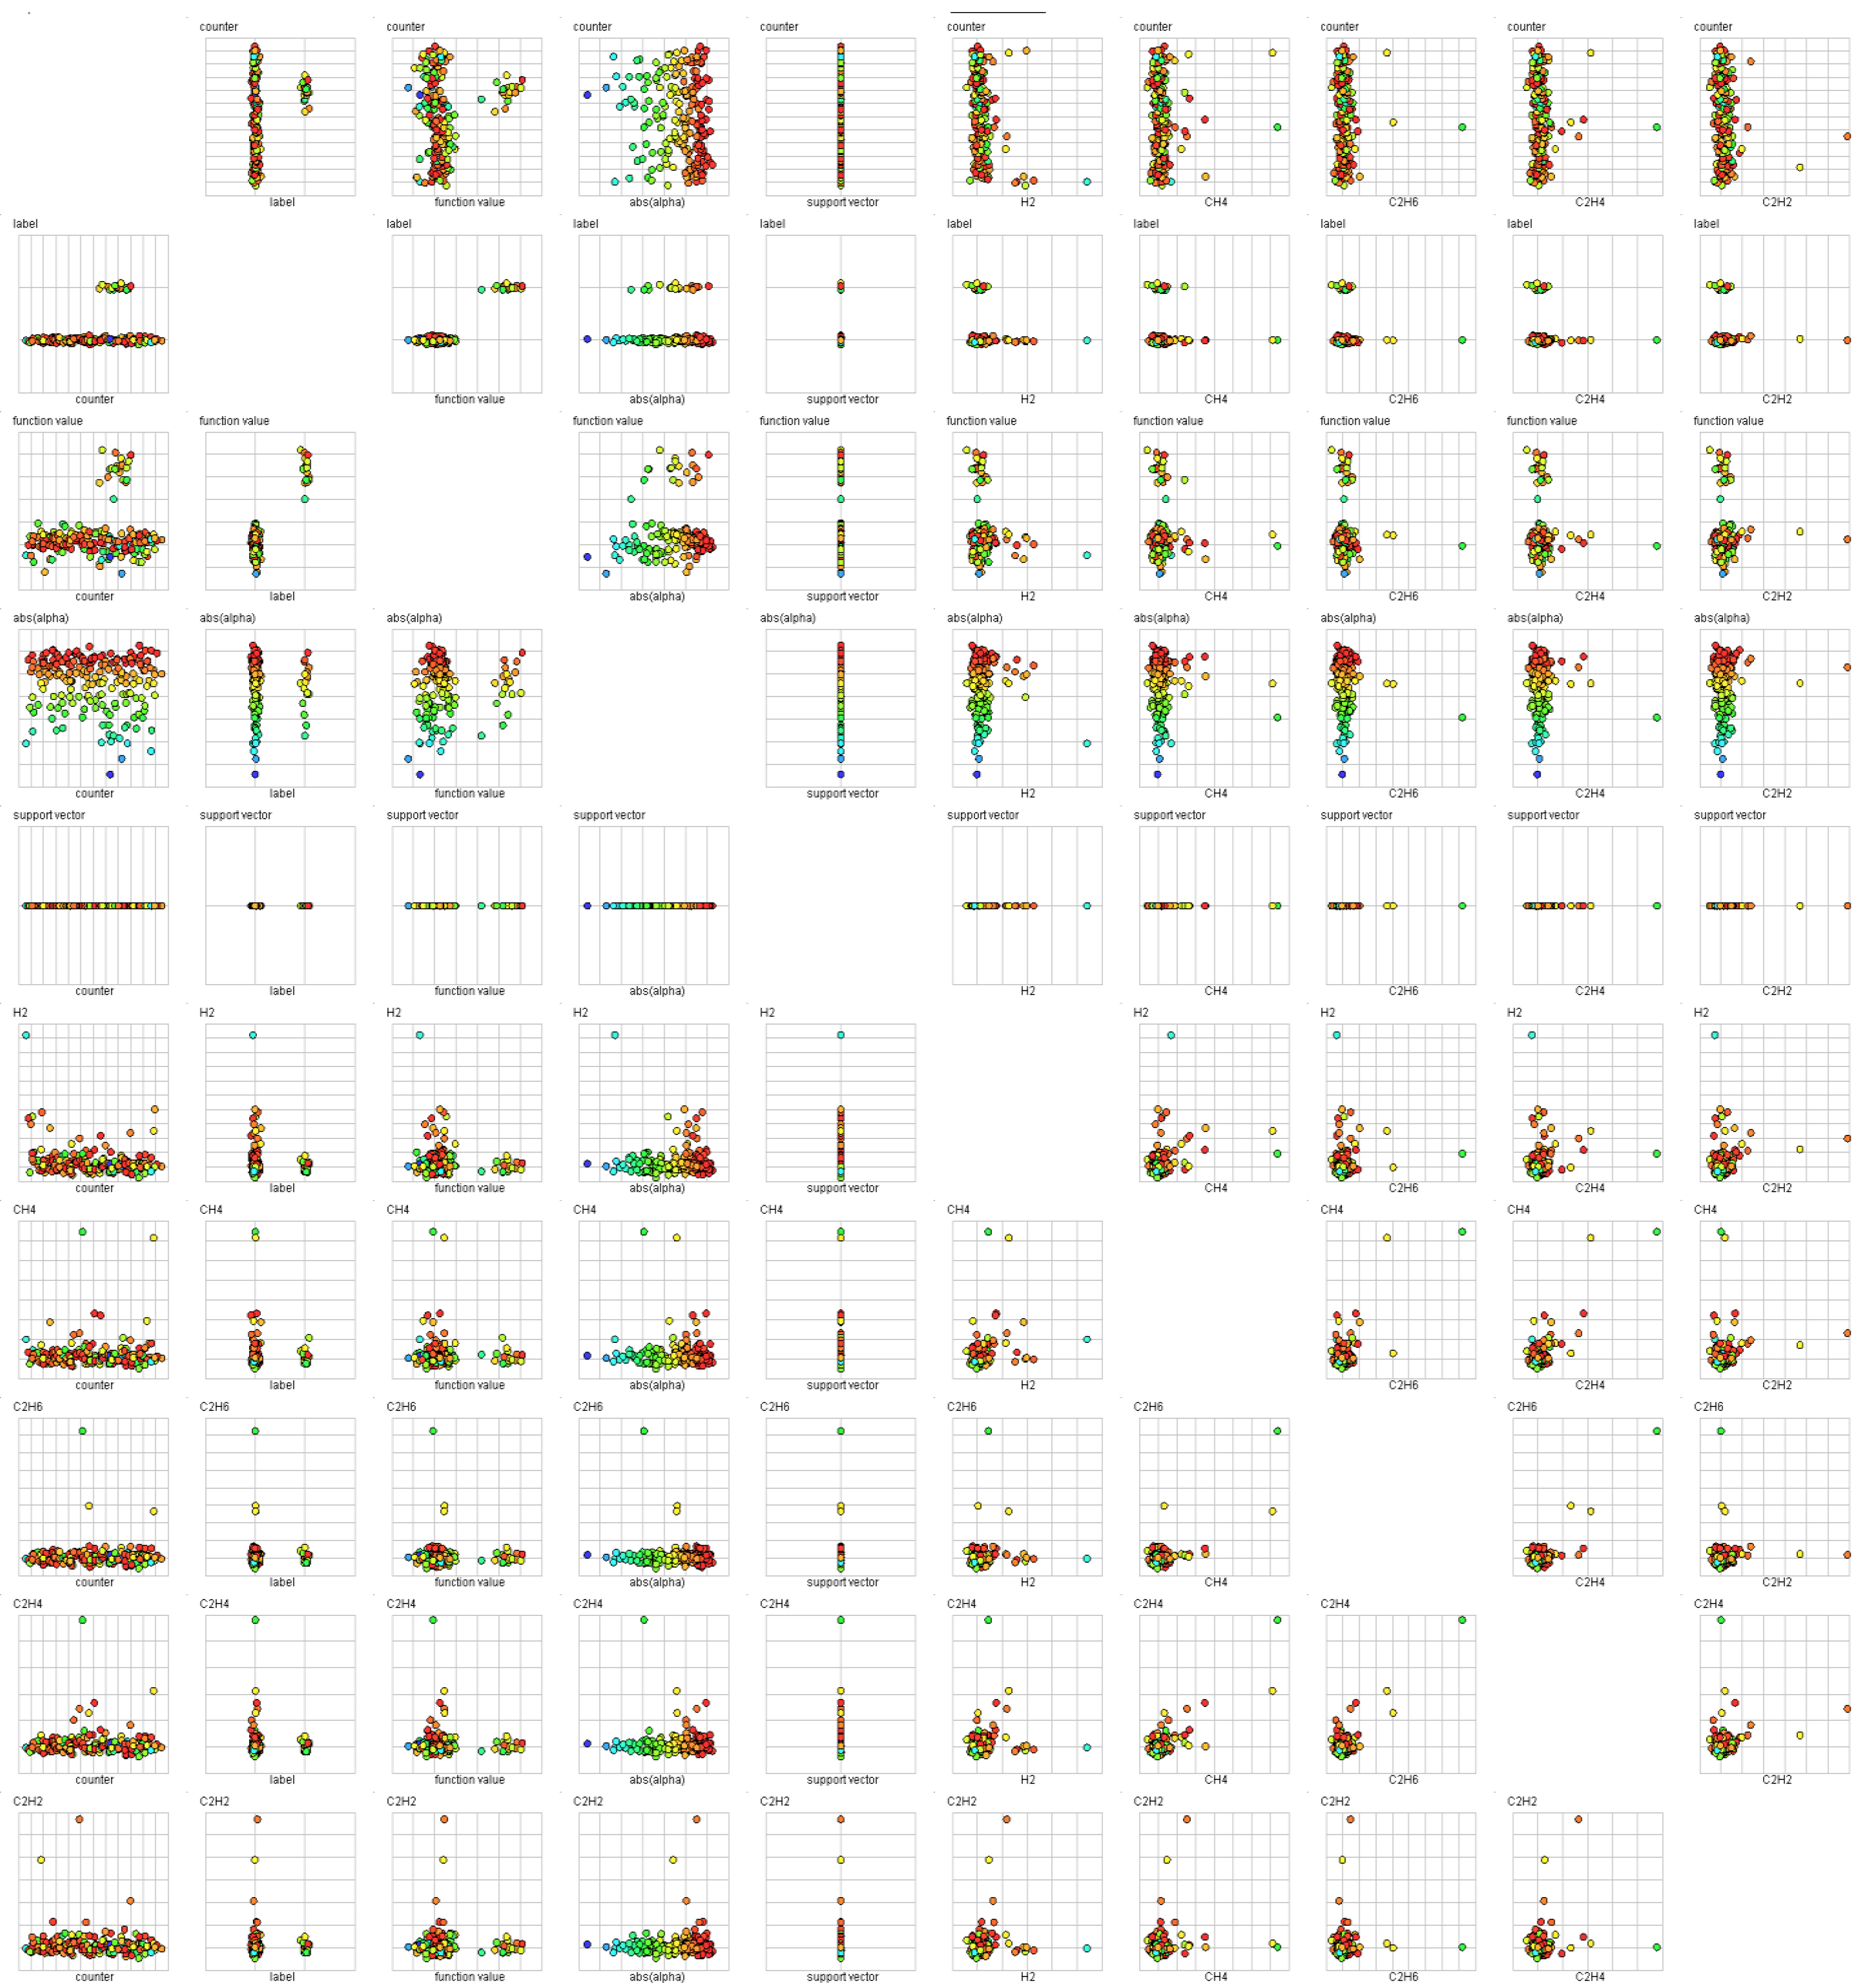
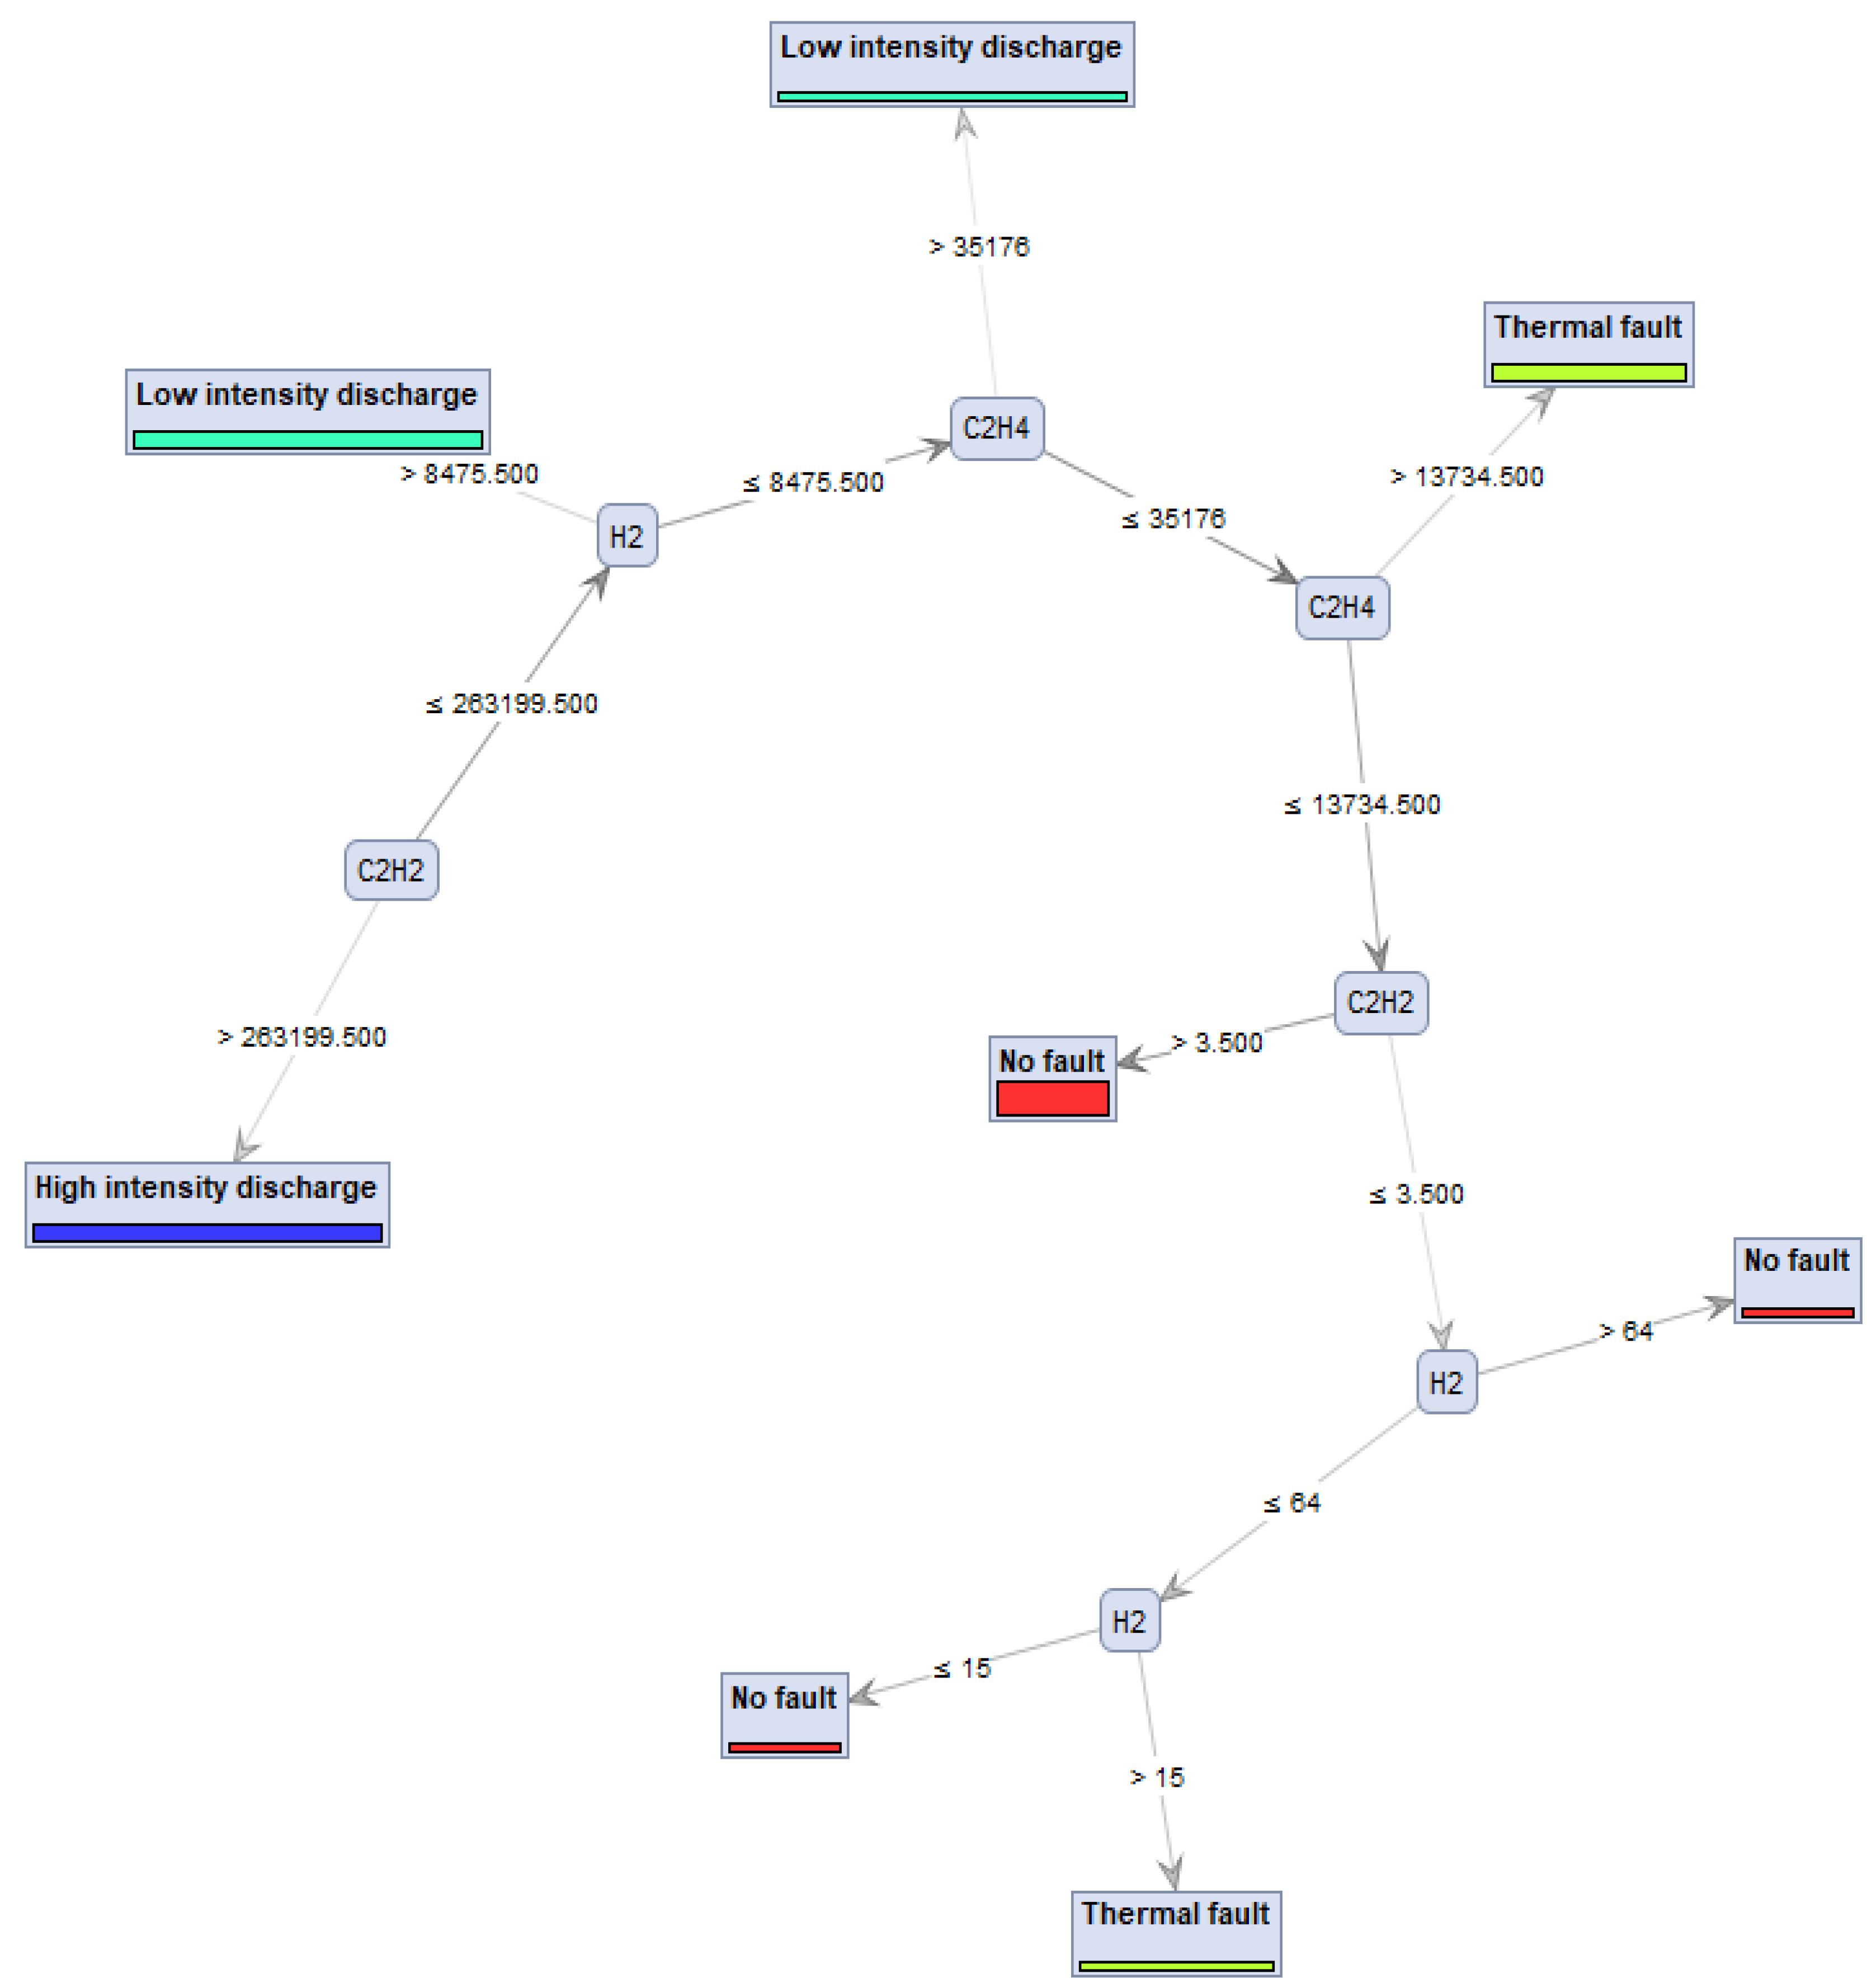
7.3.2. Model Description: Random Forest
7.4. Life Loss Estimation
7.4.1. Results and Discussion
7.4.2. Model Description: K-NN
7.5. Health Index Estimation
7.5.1. Results and Discussion
7.5.2. Model Description: Linear Regression
8. Hybrid System Proposition
8.1. Power Transformer KPI and Monitoring Dashboard
8.1.1. Health Index
8.1.2. Life Loss
8.1.3. Voltage
8.1.4. Current
8.1.5. Power Factor
8.1.6. DGA Graph
8.1.7. Water Content Graph
8.1.8. Temperature Graph
8.1.9. Alarms
8.1.10. Maintenance Schedule
8.2. Agents Interactions in the Proposed Architecture
9. Conclusions
Supplementary Materials
Author Contributions
Funding
Data Availability Statement
Acknowledgments
Conflicts of Interest
References
- Godina, R.; Rodrigues, E.M.G.; Paterakis, N.G.; Erdinc, O.; Catalão, J.P.S. Innovative Impact Assessment of Electric Vehicles Charging Loads on Distribution Transformers Using Real Data. Energy Convers. Manag. 2016, 120, 206–216. [Google Scholar] [CrossRef]
- Jimenez, H.; Calleja, H.; González, R.; Huacuz, J.; Lagunas, J. The Impact of Photovoltaic Systems on Distribution Transformer: A Case Study. Energy Convers. Manag. 2006, 47, 311–321. [Google Scholar] [CrossRef]
- Godina, R.; Rodrigues, E.M.G.; Matias, J.C.O.; Catalão, J.P.S. Smart Electric Vehicle Charging Scheduler for Overloading Prevention of an Industry Client Power Distribution Transformer. Appl. Energy 2016, 178, 29–42. [Google Scholar] [CrossRef]
- Da Silva, D.G.T.; Braga Da Silva, H.J.; Marafão, F.P.; Paredes, H.K.M.; Gonçalves, F.A.S. Enhanced Health Index for Power Transformers Diagnosis. Eng. Fail. Anal. 2021, 126, 105427. [Google Scholar] [CrossRef]
- Yahaya, M.; Azis, N.; Ab Kadir, M.; Jasni, J.; Hairi, M.; Talib, M. Estimation of Transformers Health Index Based on the Markov Chain. Energies 2017, 10, 1824. [Google Scholar] [CrossRef]
- El Hadraoui, H.; Zegrari, M.; Chebak, A.; Laayati, O.; Guennouni, N. A Multi-Criteria Analysis and Trends of Electric Motors for Electric Vehicles. World Electr. Veh. J. 2022, 13, 65. [Google Scholar] [CrossRef]
- El Hadraoui, H.; Zegrari, M.; Hammouch, F.-E.; Guennouni, N.; Laayati, O.; Chebak, A. Design of a Customizable Test Bench of an Electric Vehicle Powertrain for Learning Purposes Using Model-Based System Engineering. Sustainability 2022, 14, 10923. [Google Scholar] [CrossRef]
- Gorgan, B.; Notingher, P.; Badicu, L.-V.; Gabriel, T. Calculation of Power Transformers Health Indexes. Ann. Univ. Craiova Electr. Eng. Ser. 2010, 34, 13–18. [Google Scholar]
- Foros, J.; Istad, M. Health Index, Risk and Remaining Lifetime Estimation of Power Transformers. IEEE Trans. Power Deliv. 2020, 35, 2612–2620. [Google Scholar] [CrossRef]
- Naderian, A.; Cress, S.; Piercy, R.; Wang, F.; Service, J. An Approach to Determine the Health Index of Power Transformers. In Proceedings of the Conference Record of the 2008 IEEE International Symposium on Electrical Insulation, Vancouver, BC, Canada, 9–12 June 2008; pp. 192–196. [Google Scholar]
- Laayati, O.; Bouzi, M.; Chebak, A. Design of an Oil Immersed Power Transformer Monitoring and Self Diagnostic System Integrated in Smart Energy Management System. In Proceedings of the 2021 3rd Global Power, Energy and Communication Conference (GPECOM), Antalya, Turkey, 5–8 October 2021; pp. 240–245. [Google Scholar] [CrossRef]
- Leonori, S.; Martino, A.; Frattale Mascioli, F.M.; Rizzi, A. Microgrid Energy Management Systems Design by Computational Intelligence Techniques. Appl. Energy 2020, 277, 115524. [Google Scholar] [CrossRef]
- Fofana, I.; Hadjadj, Y. Electrical-Based Diagnostic Techniques for Assessing Insulation Condition in Aged Transformers. Energies 2016, 9, 679. [Google Scholar] [CrossRef]
- Laayati, O.; Bouzi, M.; Chebak, A. Smart Energy Management System: Design of a Monitoring and Peak Load Forecasting System for an Experimental Open-Pit Mine. Appl. Syst. Innov. 2022, 5, 18. [Google Scholar] [CrossRef]
- El Maghraoui, A.; Ledmaoui, Y.; Laayati, O.; El Hadraoui, H.; Chebak, A. Smart Energy Management: A Comparative Study of Energy Consumption Forecasting Algorithms for an Experimental Open-Pit Mine. Energies 2022, 15, 4569. [Google Scholar] [CrossRef]
- Agung, A.A.G.; Handayani, R. Blockchain for Smart Grid. J. King Saud Univ.-Comput. Inf. Sci. 2020, 34, 666–675. [Google Scholar] [CrossRef]
- Laayati, O.; El Hadraoui, H.; Bouzi, M.; El-Alaoui, A.; Kousta, A.; Chebak, A. Smart Energy Management System: Blockchain-Based Smart Meters in Microgrids. In Proceedings of the 2022 4th Global Power, Energy and Communication Conference (GPECOM), Nevsehir, Turkey, 14–17 June 2022; pp. 580–585. [Google Scholar] [CrossRef]
- Umar, A.; Kumar, D.; Ghose, T. Blockchain-Based Decentralized Energy Intra-Trading with Battery Storage Flexibility in a Community Microgrid System. Appl. Energy 2022, 322, 119544. [Google Scholar] [CrossRef]
- Laayati, O.; El Hadraoui, H.; Guennoui, N.; Bouzi, M.; Chebak, A. Smart Energy Management System: Design of a Smart Grid Test Bench for Educational Purposes. Energies 2022, 15, 2702. [Google Scholar] [CrossRef]
- Li, E. Dissolved Gas Data in Transformer Oil---Fault Diagnosis of Power Transformers with Membership Degree. IEEE Access 2019, 7, 28791–28798. [Google Scholar] [CrossRef]
- Illias, H.A.; Chai, X.R.; Abu Bakar, A.H.; Mokhlis, H. Transformer Incipient Fault Prediction Using Combined Artificial Neural Network and Various Particle Swarm Optimisation Techniques. PLoS ONE 2015, 10, e0129363. [Google Scholar] [CrossRef]
- Sample Power Transformers Health Condition Dataset. Available online: https://www.kaggle.com/datasets/easonlai/sample-power-transformers-health-condition-dataset (accessed on 25 July 2022).
- Institute of Electrical and Electronics Engineers. IEEE Guide for the Evaluation and Reconditioning of Liquid Immersed Power Transformers; Institute of Electrical and Electronics Engineers: New York, NY, USA, 2007; ISBN 978-0-7381-5268-4. [Google Scholar]
- Eslamian, M.; Vahidi, B.; Hosseinian, S.H. Analytical Calculation of Detailed Model Parameters of Cast Resin Dry-Type Transformers. Energy Convers. Manag. 2011, 52, 2565–2574. [Google Scholar] [CrossRef]
- Laayati, O.; Bouzi, M.; Chebak, A. Smart Energy Management System: SCIM Diagnosis and Failure Classification and Prediction Using Energy Consumption Data. In Digital Technologies and Applications; Motahhir, S., Bossoufi, B., Eds.; Lecture Notes in Networks and Systems; Springer International Publishing: Cham, Switzerland, 2021; Volume 211, pp. 1377–1386. ISBN 978-3-030-73881-5. [Google Scholar] [CrossRef]
- Murugan, R.; Ramasamy, R. Understanding the Power Transformer Component Failures for Health Index-Based Maintenance Planning in Electric Utilities. Eng. Fail. Anal. 2019, 96, 274–288. [Google Scholar] [CrossRef]
- Chandran, L.R.; Ajith Babu, G.S.; Nair, M.G.; Ilango, K. A Review on Status Monitoring Techniques of Transformer and a Case Study on Loss of Life Calculation of Distribution Transformers. Mater. Today: Proc. 2020, 46, 4659–4666. [Google Scholar] [CrossRef]
- Meng, J.; Singh, M.; Sharma, M.; Singh, D.; Kaur, P.; Kumar, R. Online Monitoring Technology of Power Transformer Based on Vibration Analysis. J. Intell. Syst. 2021, 30, 554–563. [Google Scholar] [CrossRef]
- Jazebi, S.; Vahidi, B.; Jannati, M. A Novel Application of Wavelet Based SVM to Transient Phenomena Identification of Power Transformers. Energy Convers. Manag. 2011, 52, 1354–1363. [Google Scholar] [CrossRef]
- Shutenko, O.; Kulyk, O. Recognition of Low-Temperature Overheating in Power Transformers by Dissolved Gas Analysis. Electr. Eng. 2022, 104, 2109–2121. [Google Scholar] [CrossRef]
- Singh, J.; Singh, S. Transformer Failure Analysis: Reasons and Methods. Int. J. Eng. Res. 2016, 4, 5. [Google Scholar]
- Hu, H.; Ma, X.; Shang, Y. A Novel Method for Transformer Fault Diagnosis Based on Refined Deep Residual Shrinkage Network. IET Electr. Power Appl. 2022, 16, 206–223. [Google Scholar] [CrossRef]
- Raichura, M.B.; Chothani, N.G.; Patel, D.D. Identification of Internal Fault against External Abnormalities in Power Transformer Using Hierarchical Ensemble Extreme Learning Machine Technique. IET Sci. Meas. Technol. 2020, 14, 111–121. [Google Scholar] [CrossRef]
- Zhang, X.; Fang, R.; Zhang, G.; Fang, Y.; Zhou, X.; Ma, Y.; Wang, K.; Chen, K. Research on Transformer Fault Diagnosis: Based on Improved Firefly Algorithm Optimized LPboost–Classification and Regression Tree. IET Gener. Transm. Distrib. 2021, 15, 2926–2942. [Google Scholar] [CrossRef]
- Zhang, L.; Sheng, G.; Hou, H.; Zhou, N.; Jiang, X. An Adaptive Fault Diagnosis Method of Power Transformers Based on Combining Oversampling and Cost-Sensitive Learning. IET Smart Grid 2021, 4, 623–635. [Google Scholar] [CrossRef]
- Kazemi, Z.; Naseri, F.; Yazdi, M.; Farjah, E. An EKF-SVM Machine Learning-Based Approach for Fault Detection and Classification in Three-Phase Power Transformers. IET Sci. Meas. Technol. 2021, 15, 130–142. [Google Scholar] [CrossRef]
- Madavan, R.; Saroja, S. Decision Making on the State of Transformers Based on Insulation Condition Using AHP and TOPSIS Methods. IET Sci. Meas. Technol. 2020, 14, 137–145. [Google Scholar] [CrossRef]
- Patel, D.; Chothani, N.G.; Mistry, K.D.; Raichura, M. Design and Development of Fault Classification Algorithm Based on Relevance Vector Machine for Power Transformer. IET Electr. Power Appl. 2018, 12, 557–565. [Google Scholar] [CrossRef]
- Hernandez, G.; Ramirez, A. Dielectric Response Model for Transformer Insulation Using Frequency Domain Spectroscopy and Vector Fitting. Energies 2022, 15, 2655. [Google Scholar] [CrossRef]
- Kim, M.; Lee, S. Power Transformer Voltages Classification with Acoustic Signal in Various Noisy Environments. Sensors 2022, 22, 1248. [Google Scholar] [CrossRef]
- Odongo, G.; Musabe, R.; Hanyurwimfura, D. A Multinomial DGA Classifier for Incipient Fault Detection in Oil-Impregnated Power Transformers. Algorithms 2021, 14, 128. [Google Scholar] [CrossRef]
- Senoussaoui, M.E.A.; Brahami, M.; Fofana, I. Transformer Oil Quality Assessment Using Random Forest with Feature Engineering. Energies 2021, 14, 1809. [Google Scholar] [CrossRef]
- Ghoneim, S.S.M. Determination of Transformers’ Insulating Paper State Based on Classification Techniques. Processes 2021, 9, 427. [Google Scholar] [CrossRef]
- Lee, C.-T.; Horng, S.-C. Abnormality Detection of Cast-Resin Transformers Using the Fuzzy Logic Clustering Decision Tree. Energies 2020, 13, 2546. [Google Scholar] [CrossRef]
- Zou, J.; Chen, W.; Wan, F.; Fan, Z.; Du, L. Raman Spectral Characteristics of Oil-Paper Insulation and Its Application to Ageing Stage Assessment of Oil-Immersed Transformers. Energies 2016, 9, 946. [Google Scholar] [CrossRef]
- Laayati, O.; Hadraoui, H.E.; Bouzi, M.; Chebak, A. Smart Energy Management System: Oil Immersed Power Transformer Failure Prediction and Classification Techniques Based on DGA Data. In Proceedings of the 2022 2nd International Conference on Innovative Research in Applied Science, Engineering and Technology (IRASET), Meknes, Morocco, 3–4 March 2022; pp. 1–6. [Google Scholar] [CrossRef]
- Shintemirov, A.; Tang, W.; Wu, Q.H. Power Transformer Fault Classification Based on Dissolved Gas Analysis by Implementing Bootstrap and Genetic Programming. IEEE Trans. Syst. Man Cybern. Part C (Appl. Rev.) 2009, 39, 69–79. [Google Scholar] [CrossRef]
- Hao, X.; Cai-Xin, S. Artificial Immune Network Classification Algorithm for Fault Diagnosis of Power Transformer. Power Deliv. IEEE Trans. 2007, 22, 930–935. [Google Scholar] [CrossRef]
- Xing, M.; Ding, W.; Li, H.; Zhang, T. A Power Transformer Fault Prediction Method through Temporal Convolutional Network on Dissolved Gas Chromatography Data. Secur. Commun. Netw. 2022, 2022, e5357412. [Google Scholar] [CrossRef]
- Abdo, A.; Liu, H.; Zhang, H.; Guo, J.; Li, Q. A New Model of Faults Classification in Power Transformers Based on Data Optimization Method. Electr. Power Syst. Res. 2021, 200, 107446. [Google Scholar] [CrossRef]
- Shamlou, A.; Reza Feyzi, M.; Behjat, V. Winding Deformation Classification in a Power Transformer Based on the Time-Frequency Image of Frequency Response Analysis Using Hilbert-Huang Transform and Evidence Theory. Int. J. Electr. Power Energy Syst. 2021, 129, 106854. [Google Scholar] [CrossRef]
- Babnik, T.; Gubina, F. Two Approaches to Power Transformer Fault Classification Based on Protection Signals. Int. J. Electr. Power Energy Syst. 2002, 24, 459–468. [Google Scholar] [CrossRef]
- Sudha, B.; Praveen, L.S.; Vadde, A. Classification of Faults in Distribution Transformer Using Machine Learning. Mater. Today Proc. 2022, 58, 616–622. [Google Scholar] [CrossRef]
- Arias Velásquez, R.M. Support Vector Machine and Tree Models for Oil and Kraft Degradation in Power Transformers. Eng. Fail. Anal. 2021, 127, 105488. [Google Scholar] [CrossRef]
- Fang, J.; Yang, F.; Tong, R.; Yu, Q.; Dai, X. Fault Diagnosis of Electric Transformers Based on Infrared Image Processing and Semi-Supervised Learning. Glob. Energy Interconnect. 2021, 4, 596–607. [Google Scholar] [CrossRef]
- Rucconi, V.; Maria, L.D.; Garatti, S.; Bartalesi, D.; Valecillos, B.; Bittanti, S. Deep Learning For Fault Detection In Transformers Using Vibration Data. IFAC-Pap. 2021, 54, 262–267. [Google Scholar] [CrossRef]
- de Lopes, S.M.A.; Flauzino, R.A.; Altafim, R.A.C. Incipient Fault Diagnosis in Power Transformers by Data-Driven Models with over-Sampled Dataset. Electr. Power Syst. Res. 2021, 201, 107519. [Google Scholar] [CrossRef]
- Zeng, B.; Guo, J.; Zhang, F.; Zhu, W.; Xiao, Z.; Huang, S.; Fan, P. Prediction Model for Dissolved Gas Concentration in Transformer Oil Based on Modified Grey Wolf Optimizer and LSSVM with Grey Relational Analysis and Empirical Mode Decomposition. Energies 2020, 13, 422. [Google Scholar] [CrossRef]
- Prasojo, R.A.; Gumilang, H.; Suwarno; Maulidevi, N.U.; Soedjarno, B.A. A Fuzzy Logic Model for Power Transformer Faults’ Severity Determination Based on Gas Level, Gas Rate, and Dissolved Gas Analysis Interpretation. Energies 2020, 13, 1009. [Google Scholar] [CrossRef]
- Zhang, W.; Yang, X.; Deng, Y.; Li, A. An Inspired Machine-Learning Algorithm with a Hybrid Whale Optimization for Power Transformer PHM. Energies 2020, 13, 3143. [Google Scholar] [CrossRef]
- Kirkbas, A.; Demircali, A.; Koroglu, S.; Kizilkaya, A. Fault Diagnosis of Oil-Immersed Power Transformers Using Common Vector Approach. Electr. Power Syst. Res. 2020, 184, 106346. [Google Scholar] [CrossRef]
- Malik, H.; Sharma, R.; Mishra, S. Fuzzy Reinforcement Learning Based Intelligent Classifier for Power Transformer Faults. ISA Trans. 2020, 101, 390–398. [Google Scholar] [CrossRef]
- Arias Velásquez, R.M.; Mejía Lara, J.V. Root Cause Analysis Improved with Machine Learning for Failure Analysis in Power Transformers. Eng. Fail. Anal. 2020, 115, 104684. [Google Scholar] [CrossRef]
- Almoallem, Y.D.; Taha, I.B.M.; Mosaad, M.I.; Nahma, L.; Abu-Siada, A. Application of Logistic Regression Algorithm in the Interpretation of Dissolved Gas Analysis for Power Transformers. Electronics 2021, 10, 1206. [Google Scholar] [CrossRef]
- Aciu, A.-M.; Nicola, C.-I.; Nicola, M.; Nițu, M.-C. Complementary Analysis for DGA Based on Duval Methods and Furan Compounds Using Artificial Neural Networks. Energies 2021, 14, 588. [Google Scholar] [CrossRef]
- Poonnoy, N.; Suwanasri, C.; Suwanasri, T. Fuzzy Logic Approach to Dissolved Gas Analysis for Power Transformer Failure Index and Fault Identification. Energies 2020, 14, 36. [Google Scholar] [CrossRef]
- Wu, Z.; Zhou, M.; Lin, Z.; Chen, X.; Huang, Y. Improved Genetic Algorithm and XGBoost Classifier for Power Transformer Fault Diagnosis. Front. Energy Res. 2021, 9, 745744. [Google Scholar] [CrossRef]
- Mao, W.; Wei, B.; Xu, X.; Chen, L.; Wu, T.; Peng, Z.; Ren, C. Fault Diagnosis for Power Transformers through Semi-Supervised Transfer Learning. Sensors 2022, 22, 4470. [Google Scholar] [CrossRef] [PubMed]
- Zhou, Y.; Yang, X.; Tao, L.; Yang, L. Transformer Fault Diagnosis Model Based on Improved Gray Wolf Optimizer and Probabilistic Neural Network. Energies 2021, 14, 3029. [Google Scholar] [CrossRef]
- Elbazi, N.; Mabrouki, M.; Chebak, A.; Hammouch, F. Digital Twin Architecture for Mining Industry: Case Study of a Stacker Machine in an Experimental Open-Pit Mine. In Proceedings of the 2022 4th Global Power, Energy and Communication Conference (GPECOM), Cappadocia, Turkey, 14–17 June 2022; pp. 232–237. [Google Scholar]
- Ouahabi, N.; Chebak, A.; Zegrari, M.; Kamach, O.; Berquedich, M. A Distributed Digital Twin Architecture for Shop Floor Monitoring Based on Edge-Cloud Collaboration. In Proceedings of the 2021 Third International Conference on Transportation and Smart Technologies (TST), Tangier, Morocco, 27–18 May 2021; pp. 72–78. [Google Scholar]
- Maghraoui, A.E.; Hammouch, F.-E.; Ledmaoui, Y.; Chebak, A. Smart Energy Management System: A Comparative Study of Energy Consumption Prediction Algorithms for a Hotel Building. In Proceedings of the 2022 4th Global Power, Energy and Communication Conference (GPECOM), Cappadocia, Turkey, 14–17 June 2022; pp. 529–534. [Google Scholar]
- Harrold, D.J.B.; Cao, J.; Fan, Z. Renewable Energy Integration and Microgrid Energy Trading Using Multi-Agent Deep Reinforcement Learning. Appl. Energy 2022, 318, 119151. [Google Scholar] [CrossRef]
- Homod, R.Z.; Togun, H.; Kadhim Hussein, A.; Noraldeen Al-Mousawi, F.; Yaseen, Z.M.; Al-Kouz, W.; Abd, H.J.; Alawi, O.A.; Goodarzi, M.; Hussein, O.A. Dynamics Analysis of a Novel Hybrid Deep Clustering for Unsupervised Learning by Reinforcement of Multi-Agent to Energy Saving in Intelligent Buildings. Appl. Energy 2022, 313, 118863. [Google Scholar] [CrossRef]
- Padmanaban, S.; Khalili, M.; Nasab, M.A.; Zand, M.; Shamim, A.G.; Khan, B. Determination of Power Transformers Health Index Using Parameters Affecting the Transformer’s Life. IETE J. Res. 2022, 1–22. [Google Scholar] [CrossRef]
- Zukowski, P.; Kierczynski, K.; Koltunowicz, T.N.; Rogalski, P.; Subocz, J.; Korenciak, D. AC Conductivity Measurements of Liquid-Solid Insulation of Power Transformers with High Water Content. Measurement 2020, 165, 108194. [Google Scholar] [CrossRef]
- de Faria, H.; Costa, J.G.S.; Olivas, J.L.M. A Review of Monitoring Methods for Predictive Maintenance of Electric Power Transformers Based on Dissolved Gas Analysis. Renew. Sustain. Energy Rev. 2015, 46, 201–209. [Google Scholar] [CrossRef]
- Batista, N.C.; Melício, R.; Mendes, V.M.F. Layered Smart Grid Architecture Approach and Field Tests by ZigBee Technology. Energy Convers. Manag. 2014, 88, 49–59. [Google Scholar] [CrossRef]
- Hua, Z.; Zheng, Z.; Pahon, E.; Péra, M.-C.; Gao, F. Remaining Useful Life Prediction of PEMFC Systems under Dynamic Operating Conditions. Energy Convers. Manag. 2021, 231, 113825. [Google Scholar] [CrossRef]
- Karavas, C.-S.; Kyriakarakos, G.; Arvanitis, K.G.; Papadakis, G. A Multi-Agent Decentralized Energy Management System Based on Distributed Intelligence for the Design and Control of Autonomous Polygeneration Microgrids. Energy Convers. Manag. 2015, 103, 166–179. [Google Scholar] [CrossRef]
- Rahman, M.S.; Oo, A.M.T. Distributed Multi-Agent Based Coordinated Power Management and Control Strategy for Microgrids with Distributed Energy Resources. Energy Convers. Manag. 2017, 139, 20–32. [Google Scholar] [CrossRef]


| Team | Date | Goal | Methodology | Algorithm | Accuracy |
|---|---|---|---|---|---|
| Hao [32] | 2021 | General Health | Temperature and Dissolved Gas Analysis | Timeseries | 98% |
| Maulik [33] | 2020 | Internal fault | Discrete wavelets transform | Hierarchical Ensemble Extreme Learning Machine | 99.91% |
| Xiaoxing [34] | 2021 | General Diagnosis | Dissolved Gas Analysis | Improved Firefly Algorithm Linear Programming Boosting | 95.172% |
| Lijing [35] | 2021 | Insulation Condition Assessment | Dissolved Gas Analysis | Deep Belief Network | 91.59% |
| Zahra [36] | 2021 | Internal faults | Faults history | Extended Kalman Filter- Support vector Machine | 98.42% |
| Rengaraj [37] | 2020 | State Determination | Insulation condition | Analytical Hierarchy Process-Technique for Order Preference by Similarity to ideal Solution | 90% |
| Dharmesh [38] | 2018 | Magnetising Inrush, CT saturation and high resistance internal fault | Simulation PSCAD/EMTDCT | Relevance Vector Machine | 99.97% |
| Giovanni [39] | 2022 | Insulation Dielectric Response Model | Modelling | Frequency domain spectroscopy | 99% |
| Mintai [40] | 2021 | Voltages classification | Acoustic signal acquisition | Convolutional Neural Network | 94% |
| George [41] | 2021 | Incipient Fault Detection | Multinomial Dissolved Gas Analysis | KosaNet (Based on Decision Trees) | 95% |
| Mohammed [42] | 2021 | Oil Quality assessment | Oil Quality dataset | J48 Decision tree and Random Forest | 83% |
| Sherif [43] | 2021 | Insulating paper state | Degree of polymerization | Decision Tree | 96.2% |
| Chin-Tan [44] | 2020 | Cast-resin Abnormality detection | Failure History | Fuzzy Logic Clustering Decision Tree | 87.75% |
| Jingxin [45] | 2016 | Ageing Stage Assessment of oil paper insulation | Raman Spectral characteristics | Principal Component Analysis-Support Vector machine | 99.73% |
| Oussama [46] | 2022 | Failures Classification | Dissolved Gas Analysis | Artificial Neural Network | 94.76% |
| Almas [47] | 2008 | Fault Classification | Dissolved Gas Analysis | Bootstrap-Genetic Algorithm-Support Vector Machine | 92.11% |
| Xiong [48] | 2007 | Fault Diagnosis | Dissolved Gas Analysis | Artificial Immune Network | 93.2% |
| Mengda [49] | 2021 | Fault prediction | Dissolved Gas Chromatography | Mish-SN Temporal Convolutional Network | 99% |
| Ali [50] | 2021 | Fault classification | Dissolved Gas Analysis | C-Set Fuzzy C-Means | 88.9% |
| Alireza [51] | 2021 | Winding deformation classification | Time-Frequency Response Analysis | Hilbert-Huang transform-evidence theory | 80% |
| Tadeja [52] | 2002 | Fault Classification | Protection signal | Bayes theory-Norms Generating | 76.4% |
| Sudha [53] | 2022 | Fault Classification | Short circuit resistance testing | K-Nearest Neighbour | 62% |
| Ricardo [54] | 2021 | Oil and Kraft Degradation | Dissolved Gas Analysis | Support Vector Machine | 97.55% |
| Jian [55] | 2021 | Discharge and overheating faults | Infrared Image Processing | Generative Adversarial Network | 86.2% |
| Rucconi [56] | 2021 | Deformation, Shift, Loss of clamping pressure | Vibration Data | Artificial Neural network | 91.63% |
| Sofia [57] | 2021 | Incipient fault diagnosis | Dissolved Gas Analysis | Synthetic minority oversampling technique Deep learning | 85% |
| Bing Zeng [58] | 2019 | Health Index | Dissolved Gas Analysis | Least Square Support Vector Machine | 98.9% |
| Rahman [59] | 2020 | Faults severity | Dissolved Gas Analysis | Support vector machine-based Duval Pentagon Method | 97% |
| Wei zhang [60] | 2020 | Power transformer health | Dissolved Gas Analysis | Neural Network Whale Optimization | 91% |
| Ali kirkbas [61] | 2020 | Heath index | Dissolved Gas Analysis | Support Vector Machine Particle Swarm Optimizer | 94.67% |
| Hasmat malik [62] | 2020 | Energy discharge, Partial discharge | Dissolved Gas Analysis | Fuzzy Reinforcement learning | 99.7% |
| Ricardo [63] | 2020 | Health Index | Dissolved Gas Analysis | Artificial Neural Network | 84.45% |
| Yousuf [64] | 2021 | Aging, sparking, Overheating | Dissolved Gas Analysis | Logistic Regression | 85.6% |
| Aciu [65] | 2021 | Overheating | Dissolved Gas Analysis | Artificial Neural Network | 93.5% |
| Nitchamon [66] | 2021 | Failure Index | Dissolved Gas Analysis | Fuzzy logic | 75.73% |
| Zhanhong [67] | 2021 | Partial Discharge | Dissolved Gas Analysis | Imroved Genitic algorithm and XGBoost | 99.2% |
| Weiyun [68] | 2021 | Multiple Fault Diagnosis | Dissolved Gas Analysis | Semi supervised Transfer learning | 95% |
| Yichen [69] | 2021 | Health Index | Dissolved Gas Analysis | Artificial Neural Network | 99.71% |
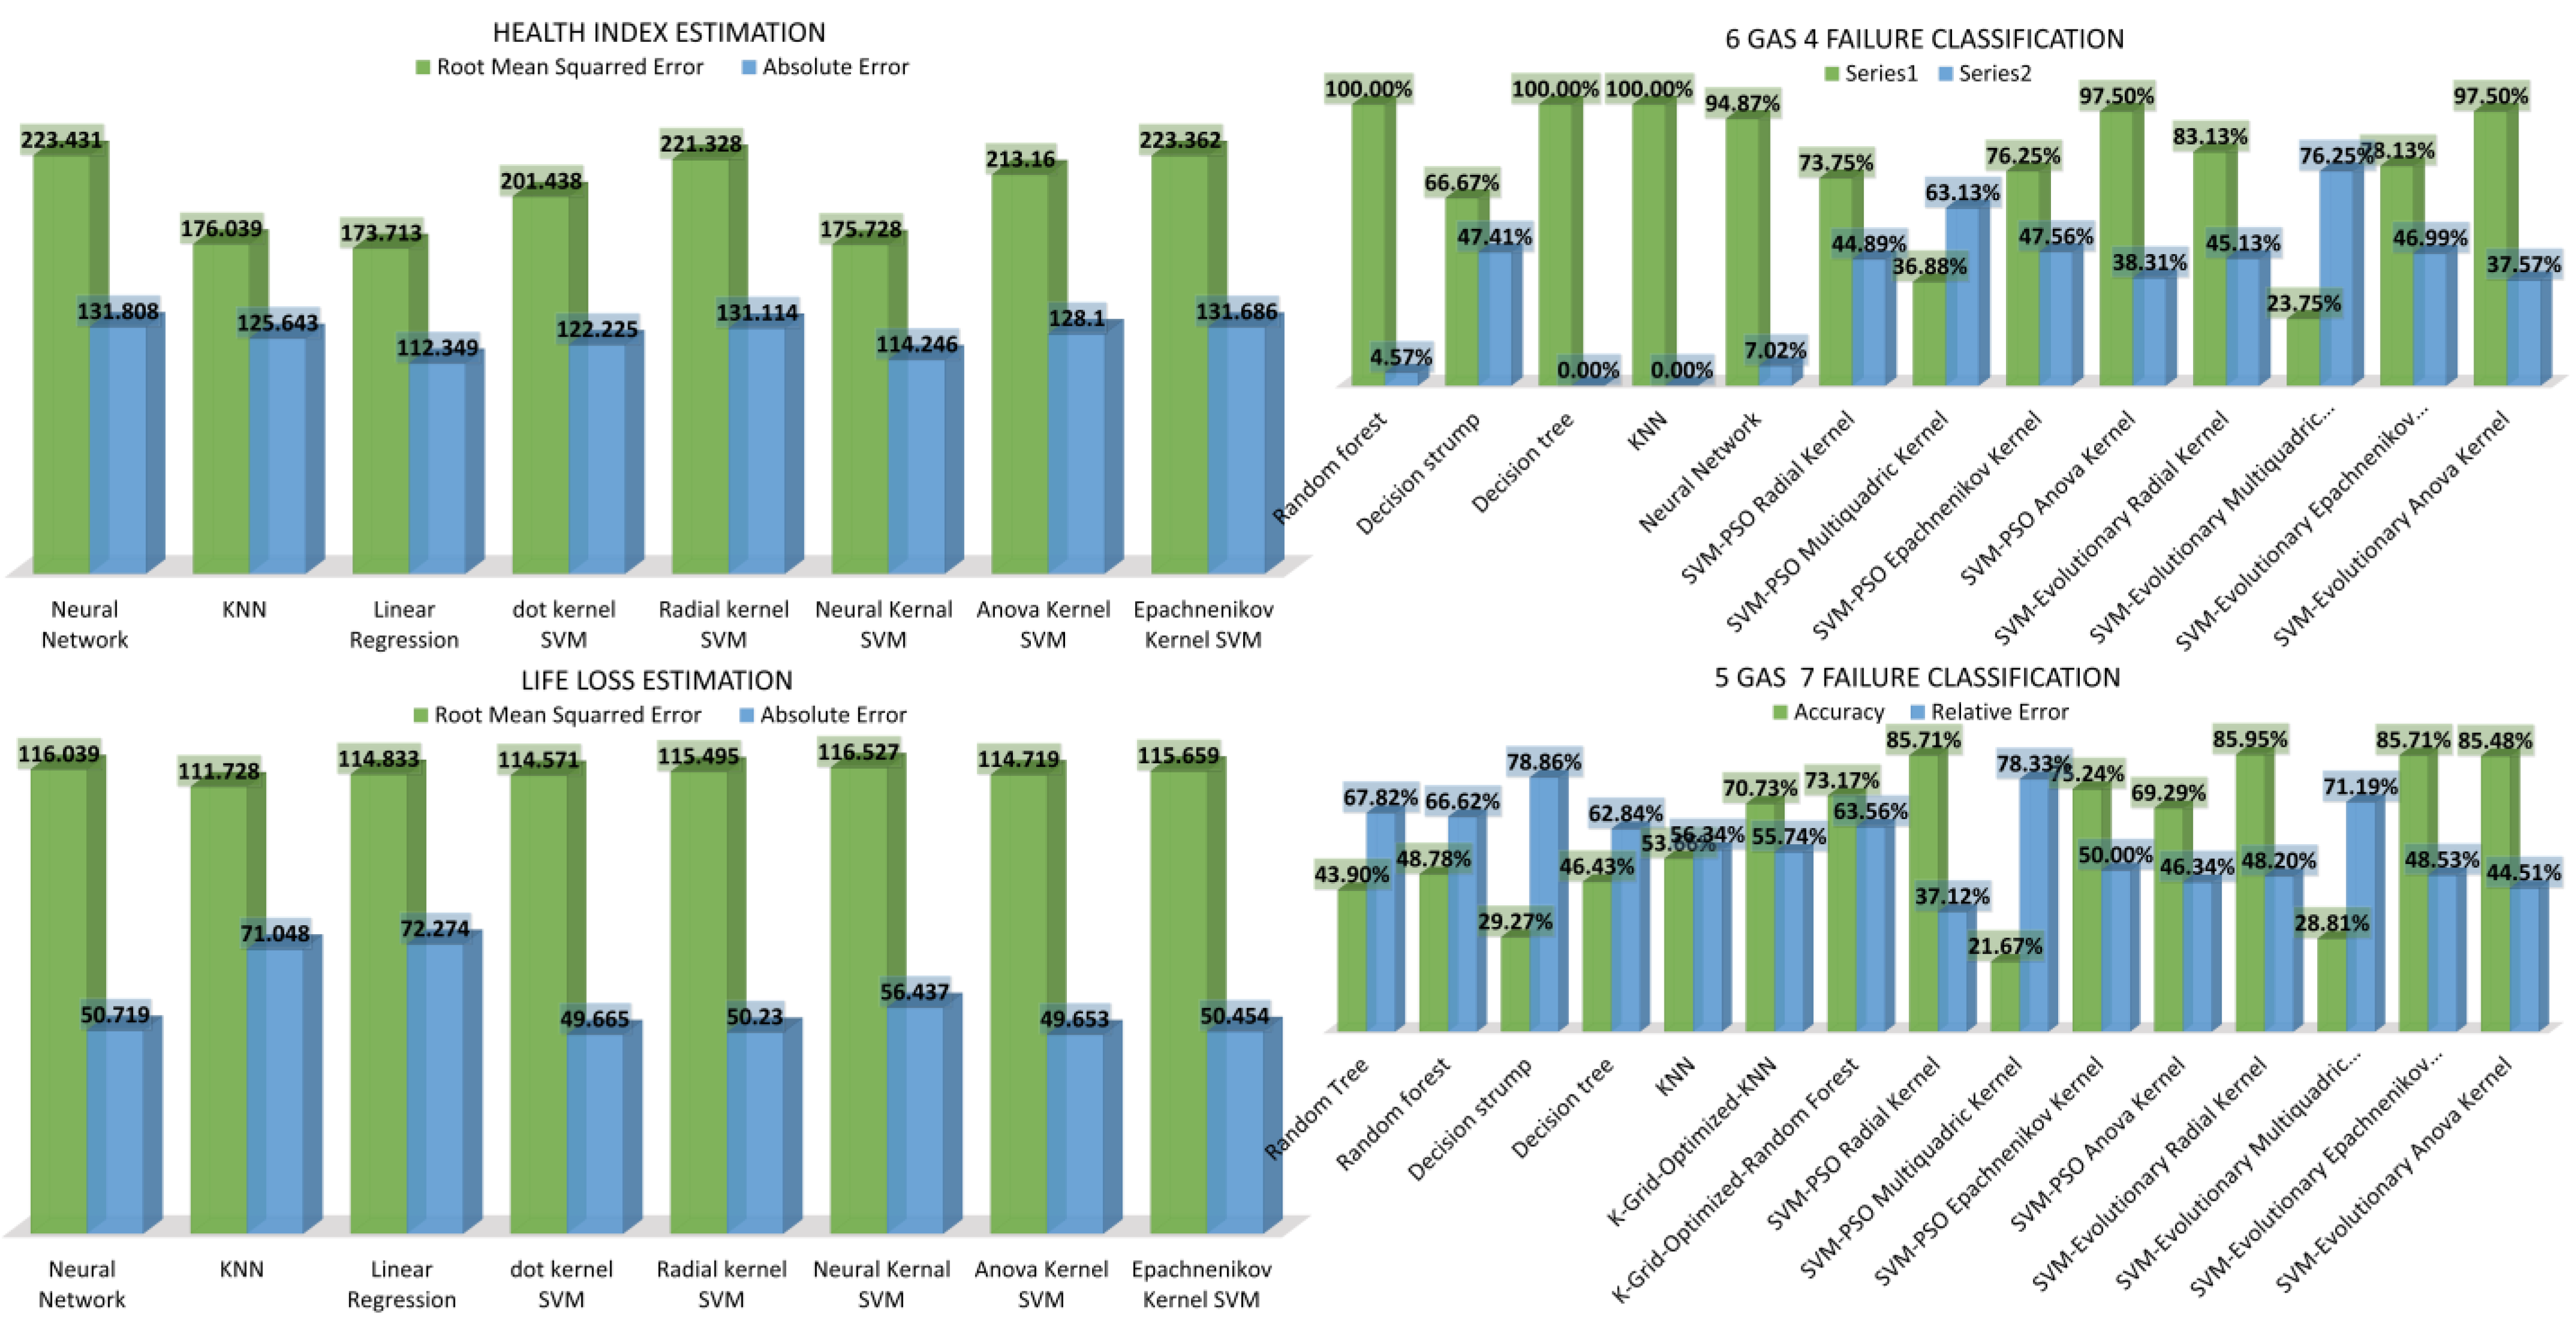
| Tested Algorithms 5GAS-7Labels | Accuracy | Relative Error | Root Mean Squared Error | Root Relative Squared Error | Squared Error |
|---|---|---|---|---|---|
| Random Tree | 43.90% | 67.82% | 0.701 | 0.471 | 0.492 |
| Random forest | 48.78% | 66.62% | 0.699 | 0.47 | 0.489 |
| Decision stump | 29.27% | 78.86% | 0.803 | 0.54 | 0.644 |
| Decision tree | 46.43% | 62.84% | 0.715 | 0.481 | 0.512 |
| KNN | 53.66% | 56.34% | 0.681 | 0.458 | 0.463 |
| K-Grid-Optimized-KNN | 70.73% | 55.74% | 0.588 | 0.395 | 0.346 |
| K-Grid-Optimized-Random Forest | 73.17% | 63.56% | 0.65 | 0.437 | 0.423 |
| SVM-PSO Radial Kernel | 85.71% | 37.12% | 0.39 | 0.9 | 0.15 |
| SVM-PSO Multiquadric Kernel | 21.67% | 78.33% | 0.88 | 2.21 | 0.73 |
| SVM-PSO Epachnenikov Kernel | 75.24% | 50.00% | 0.5 | 1.22 | 0.25 |
| SVM-PSO Anova Kernel | 69.29% | 46.34% | 0.48 | 1.14 | 0.22 |
| SVM-Evolutionary Radial Kernel | 85.95% | 48.20% | 0.48 | 1.17 | 0.23 |
| SVM-Evolutionary Multiquadric Kernel | 28.81% | 71.19% | 0.84 | 2.11 | 0.71 |
| SVM-Evolutionary Epachnenikov Kernel | 85.71% | 48.53% | 0.49 | 1.18 | 0.24 |
| SVM-Evolutionary Anova Kernel | 85.48% | 44.51% | 0.45 | 1.09 | 0.2 |
| Tested Algorithms 6Gas-4Labels | Accuracy | Relative Error | Root Mean Squared Error | Root Relative Squared Error | Squared Error |
|---|---|---|---|---|---|
| Random Tree | 89.74% | 10.81% | 0.381 | 0.302 | 0.101 |
| Random forest | 100.00% | 4.57% | 0.093 | 0.088 | 0.009 |
| Decision stump | 66.67% | 47.41% | 0.544 | 0.518 | 0.296 |
| Decision tree | 100.00% | 0.00% | 0 | 0 | 0 |
| KNN | 100.00% | 0.00% | 0 | 0 | 0 |
| Neural Network | 94.87% | 7.02% | 0.222 | 0.211 | 0.049 |
| SVM-PSO Radial Kernel | 73.75% | 44.89% | 0.45 | 1.25 | 0.21 |
| SVM-PSO Multiquadric Kernel | 36.88% | 63.13% | 0.77 | 2.43 | 0.63 |
| SVM-PSO Epachnenikov Kernel | 76.25% | 47.56% | 0.48 | 1.33 | 0.23 |
| SVM-PSO Anova Kernel | 97.50% | 38.31% | 0.39 | 1.09 | 0.15 |
| SVM-Evolutionary Radial Kernel | 83.13% | 45.13% | 0.46 | 1.25 | 0.21 |
| SVM-Evolutionary Multiquadric Kernel | 23.75% | 76.25% | 0.87 | 2.57 | 0.76 |
| SVM-Evolutionary Epachnenikov Kernel | 78.13% | 46.99% | 0.47 | 1.31 | 0.23 |
| SVM-Evolutionary Anova Kernel | 97.50% | 37.57% | 0.38 | 1.06 | 0.15 |
| Tested Algorithms Life Loss | Root Mean Squared Error | Absolute Error | Normalized Absolute Error | Squared Error |
|---|---|---|---|---|
| Neural Network | 116.039 | 50.719 | 0.737 | 13,465.07 |
| KNN | 111.728 | 71.048 | 1.033 | 12,483.2 |
| Linear Regression | 114.833 | 72.274 | 1.05 | 13,186.68 |
| dot kernel SVM | 114.571 | 49.665 | 0.722 | 13,126.6 |
| Radial kernel SVM | 115.495 | 50.23 | 0.73 | 13,339.08 |
| Neural Kernal SVM | 116.527 | 56.437 | 0.82 | 13,578.48 |
| Anova Kernel SVM | 114.719 | 49.653 | 0.722 | 13,160.44 |
| Epachnenikov Kernel SVM | 115.659 | 50.454 | 0.733 | 13,376.93 |
| Tested Algorithms Health Index | Root Mean Squared Error | Absolute Error | Normalized Absolute Error | Squared Error |
|---|---|---|---|---|
| Neural Network | 223.431 | 131.808 | 0.863 | 49,921.43 |
| KNN | 176.039 | 125.643 | 0.822 | 30,989.86 |
| Linear Regression | 173.713 | 112.349 | 0.735 | 30,176.4 |
| dot kernel SVM | 201.438 | 122.225 | 0.8 | 40,577.39 |
| Radial kernel SVM | 221.328 | 131.114 | 0.858 | 48,986.25 |
| Neural Kernal SVM | 175.728 | 114.246 | 0.748 | 30,880.36 |
| Anova Kernel SVM | 213.16 | 128.1 | 0.838 | 45,437.39 |
| Epachnenikov Kernel SVM | 223.362 | 131.686 | 0.862 | 49,890.74 |
Publisher’s Note: MDPI stays neutral with regard to jurisdictional claims in published maps and institutional affiliations. |
© 2022 by the authors. Licensee MDPI, Basel, Switzerland. This article is an open access article distributed under the terms and conditions of the Creative Commons Attribution (CC BY) license (https://creativecommons.org/licenses/by/4.0/).
Share and Cite
Laayati, O.; El Hadraoui, H.; El Magharaoui, A.; El-Bazi, N.; Bouzi, M.; Chebak, A.; Guerrero, J.M. An AI-Layered with Multi-Agent Systems Architecture for Prognostics Health Management of Smart Transformers: A Novel Approach for Smart Grid-Ready Energy Management Systems. Energies 2022, 15, 7217. https://doi.org/10.3390/en15197217
Laayati O, El Hadraoui H, El Magharaoui A, El-Bazi N, Bouzi M, Chebak A, Guerrero JM. An AI-Layered with Multi-Agent Systems Architecture for Prognostics Health Management of Smart Transformers: A Novel Approach for Smart Grid-Ready Energy Management Systems. Energies. 2022; 15(19):7217. https://doi.org/10.3390/en15197217
Chicago/Turabian StyleLaayati, Oussama, Hicham El Hadraoui, Adila El Magharaoui, Nabil El-Bazi, Mostafa Bouzi, Ahmed Chebak, and Josep M. Guerrero. 2022. "An AI-Layered with Multi-Agent Systems Architecture for Prognostics Health Management of Smart Transformers: A Novel Approach for Smart Grid-Ready Energy Management Systems" Energies 15, no. 19: 7217. https://doi.org/10.3390/en15197217
APA StyleLaayati, O., El Hadraoui, H., El Magharaoui, A., El-Bazi, N., Bouzi, M., Chebak, A., & Guerrero, J. M. (2022). An AI-Layered with Multi-Agent Systems Architecture for Prognostics Health Management of Smart Transformers: A Novel Approach for Smart Grid-Ready Energy Management Systems. Energies, 15(19), 7217. https://doi.org/10.3390/en15197217