1. Introduction
The Analytic Hierarchy Process (AHP) is a multilevel weighting analysis method proposed in the 1980s [
1] for multi-objective, multi-criteria, multi-factor, multi-level unstructured complex decision problems [
2]. AHP can transform complex correlations into quantitative analysis [
3]. The basic principle of AHP is that the problem can be decomposed into different constituent factors based on the nature of the problem and the overall goal to be achieved, and the factors are assembled and combined at different levels based on their interrelated influence and affiliation, forming a multi-level analysis structure model. Finally, defining the proportional relevance or ranking of the respective qualities of the lowest level (options, measures, etc., for decision) in relation to the highest level (overall goal) is the crux of the problem [
4,
5,
6].
A crucial component of the development of hydrocarbons is caprock, which is macroscopically influenced by variables such as capping distribution, thickness, lithology, the proportion of caprock to strata, and continuity. Microscopically, it is mainly related to mechanical properties, porosity, permeability, median pore radius, breakthrough pressure, etc. [
7,
8,
9,
10].Quantitative assessment techniques such as fuzzy evaluation, classification evaluation, cluster analysis, the graphical plate method, and the formula method have been devised in response to the emphasis placed on analyzing the caprock sealing ability [
11,
12,
13,
14,
15,
16,
17,
18,
19,
20], among which the caprock sealing ability evaluation based on the weight of each factor has not been realized, limiting the credibility of the evaluation results based on multi-factor caprock. As a result, in an effort to address the issue of the multiplicity of factors affecting gypsum-salt caprock as well as the challenge of quantitative sealing ability evaluation, this paper applies the AHP to establish an evaluation method system using the example of Cambrian gypsum-salt caprock in the Tarim Basin.
2. Geological Setting
The Tarim Basin is located in the south of the Xinjiang Uyghur Autonomous Region with a total area of roughly 560,000 km
2. It is adjacent to the Tianshan Mountains in the north and to the Kunlun Mountain System in the south. Within the basin, seven tectonic units have been identified, namely, Tabei, Central, Southeast Uplifts, Kuqa, Northern, Southwest, and Southeast depressions, resulting in a tectonic pattern of “four depressions and three uplifts” (
Figure 1) [
21].
The Paleozoic (which includes the Cambrian, Ordovician, Silurian, Devonian, and Carboniferous), Mesozoic (which includes the Permian, Triassic, and Cretaceous), and Cenozoic (which includes the Paleozoic, Neoproterozoic, and Quaternary) systems developed in the order from the bottom up in the study area [
22]. The Middle Cambrian gypsum-salt caprock is developed, and when combined with the hydrocarbon source rocks of the Yuertusi (Є
1y) Formation and the Xiaoerbulake (Є
1x) dolomite reservoir in the Lower Cambrian, it forms a high-quality lower-formation reservoir assemblage (
Figure 1) [
23], with oil resources of 34.5 × 10
8 t and gas resources of 5.98 × 10
8 t, accounting for 46% and 51%, respectively [
24].
3. Evaluation Methods
AHP was introduced to calculate the weights of each element in the caprock evaluation system in order to justify the position of multiple factors in the caprock evaluation system. The steps of this method are shown in
Figure 2, and the procedure is as follows [
2,
3,
4,
5,
6]:
(1) Create a hierarchical structure model by defining the evaluation problem for caprock sealing ability, identifying the influencing elements, and determining how factors relate to one another; a general objective, a sub-objective layer, and a program layer should be separated into three levels.
(2) Create a judgment matrix by comparing the influence components of each layer two by two: The core of the AHP is the judgment matrix. Let
Wi denote the weight that reflects the superiority of the
i-th scheme to a certain lowest-level objective or the importance of the
i-th objective of a certain layer to an upper-level objective, the meaning of the level is shown in
Table 1. Matrix A, the elements of which are the relative importance of each two scenarios (or sub-goals), is called the judgment matrix (Equation (1)).
Any two factors’ relative importance levels are assessed and quantified. The methods for scaling are described below (
Table 1).
(3) Calculate the judgment matrix’s eigenvectors.
(4) If the consistency test fails, the judgment matrix must be changed before the ranking weighting value of each layer is determined. The consistency test, in particular, involves calculating the weight vector of the lowest layer to the highest layer overall ranking using the test’s total ranking consistency ratio, which must be less than 0.1 to pass.
(5) The total hierarchical ranking is returned. The AHP software (version number: 10.2.5695.19077; creator: Jianhua Zhang; location: China) is used to calculate steps (3) and (4).
4. Results
4.1. Factors Influencing the Sealing Ability of the Gypsum-Salt Caprock
The primary factor limiting the caprock’s capacity to seal is lithology. Gypsum-salt rock is the collective name for a group of lithologies that are mostly made of gypsum rock, salt rock, and carbonate rock. As a result, the lithological makeup of caprock made of gypsum-salt rock is complicated [
25,
26]. There are many kinds of lithology compositions in Cambrian caprock in the Tarim Basin, such as gypsum rock, salt rock, mudstone, micritic dolomite, gypsum dolomite, silty fine-grained dolomite, granular dolomite, micritic limestone, gypsum limestone, and granular limestone. It can be divided into three assemblage types: salt rock type, gypsum rock type, and carbonate type. Because there are so many different lithology types and levels of breakthrough pressure in gypsum-salt caprocks, it is possible to assess the lithology sealing capacity by looking at the kinds of rock assemblage and lithology zoning.
The caprock thickness should reflect its distribution stability and continuity, as well as the capillary force strength [
19]. Furthermore, the former can be evaluated using the total thickness and ratio of caprock to stratum [
8]. Dominant lithology is defined as lithology with a breakthrough pressure >4 MPa [
27,
28], and a single layer of dominant lithology with a thickness >10 m is referred to as a “thick single layer” to stress the significance of capillary force. Furthermore, the strength of the capillary force of caprocks can be calculated using the total thickness and maximum thickness of a thick single layer.
The mechanical properties of the caprock determine the difficulty of fracture generation and are critical for determining the sealing ability [
17,
29,
30]. Shear, tensile, and compressive capacities make up the bulk of the caprock’s mechanical characteristics, and these capacities can be gauged using engineering geology metrics including internal friction coefficient, tensile strength, and peak strength.
The lithology, thickness, and mechanical properties were the three main categories chosen for this paper based on the analysis presented above. These three categories can be further subdivided into nine sub-categories, including rock assemblage types, lithological zoning, total thickness of thick single layers, maximum thickness of thick single layers, total thickness of caprock, ratio of caprock to stratum, internal friction coefficient, compressive strength, and peak strength.
4.2. Quantification the Controlling Factors
4.2.1. Lithology of the Caprock
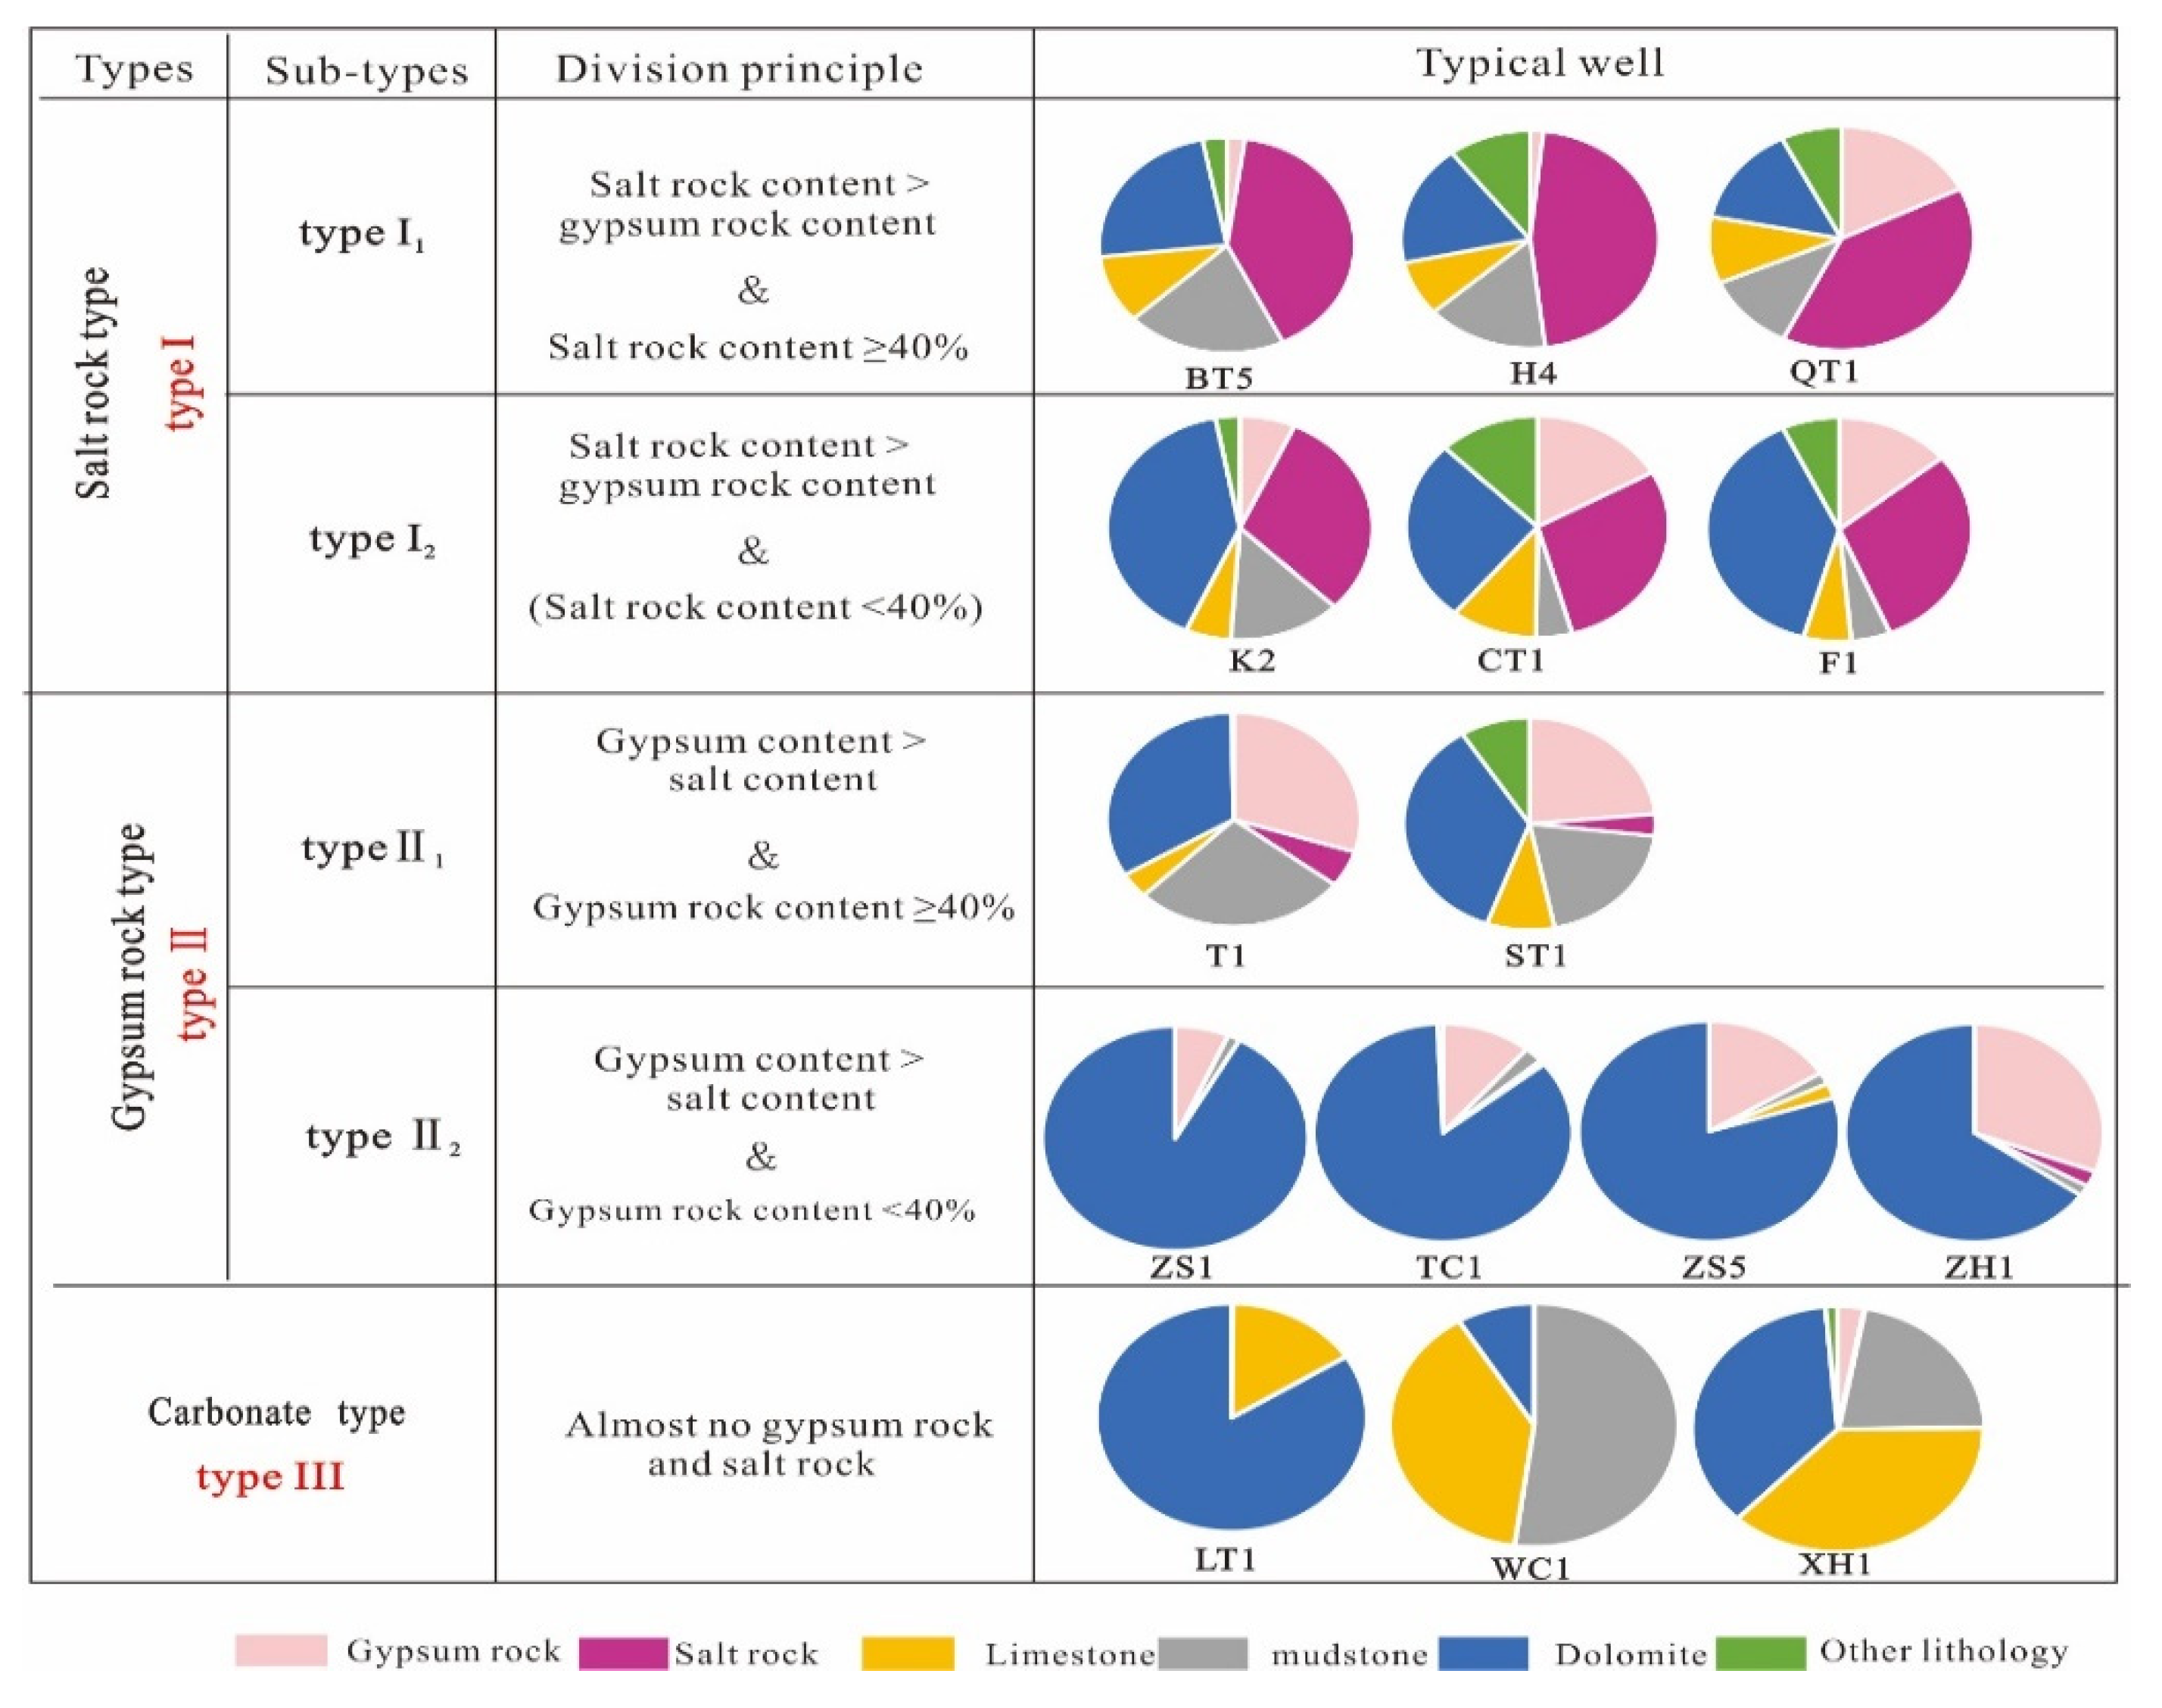
Rock assemblage types: According to the content of different lithologies, the gypsum-salt caprocks can be divided into the salt rock type (type I), gypsum rock type (type II), and carbonate type (type III). Furthermore, the first two types can be further divided into two sub-types using 40 percent content as the boundary (
Figure 3).
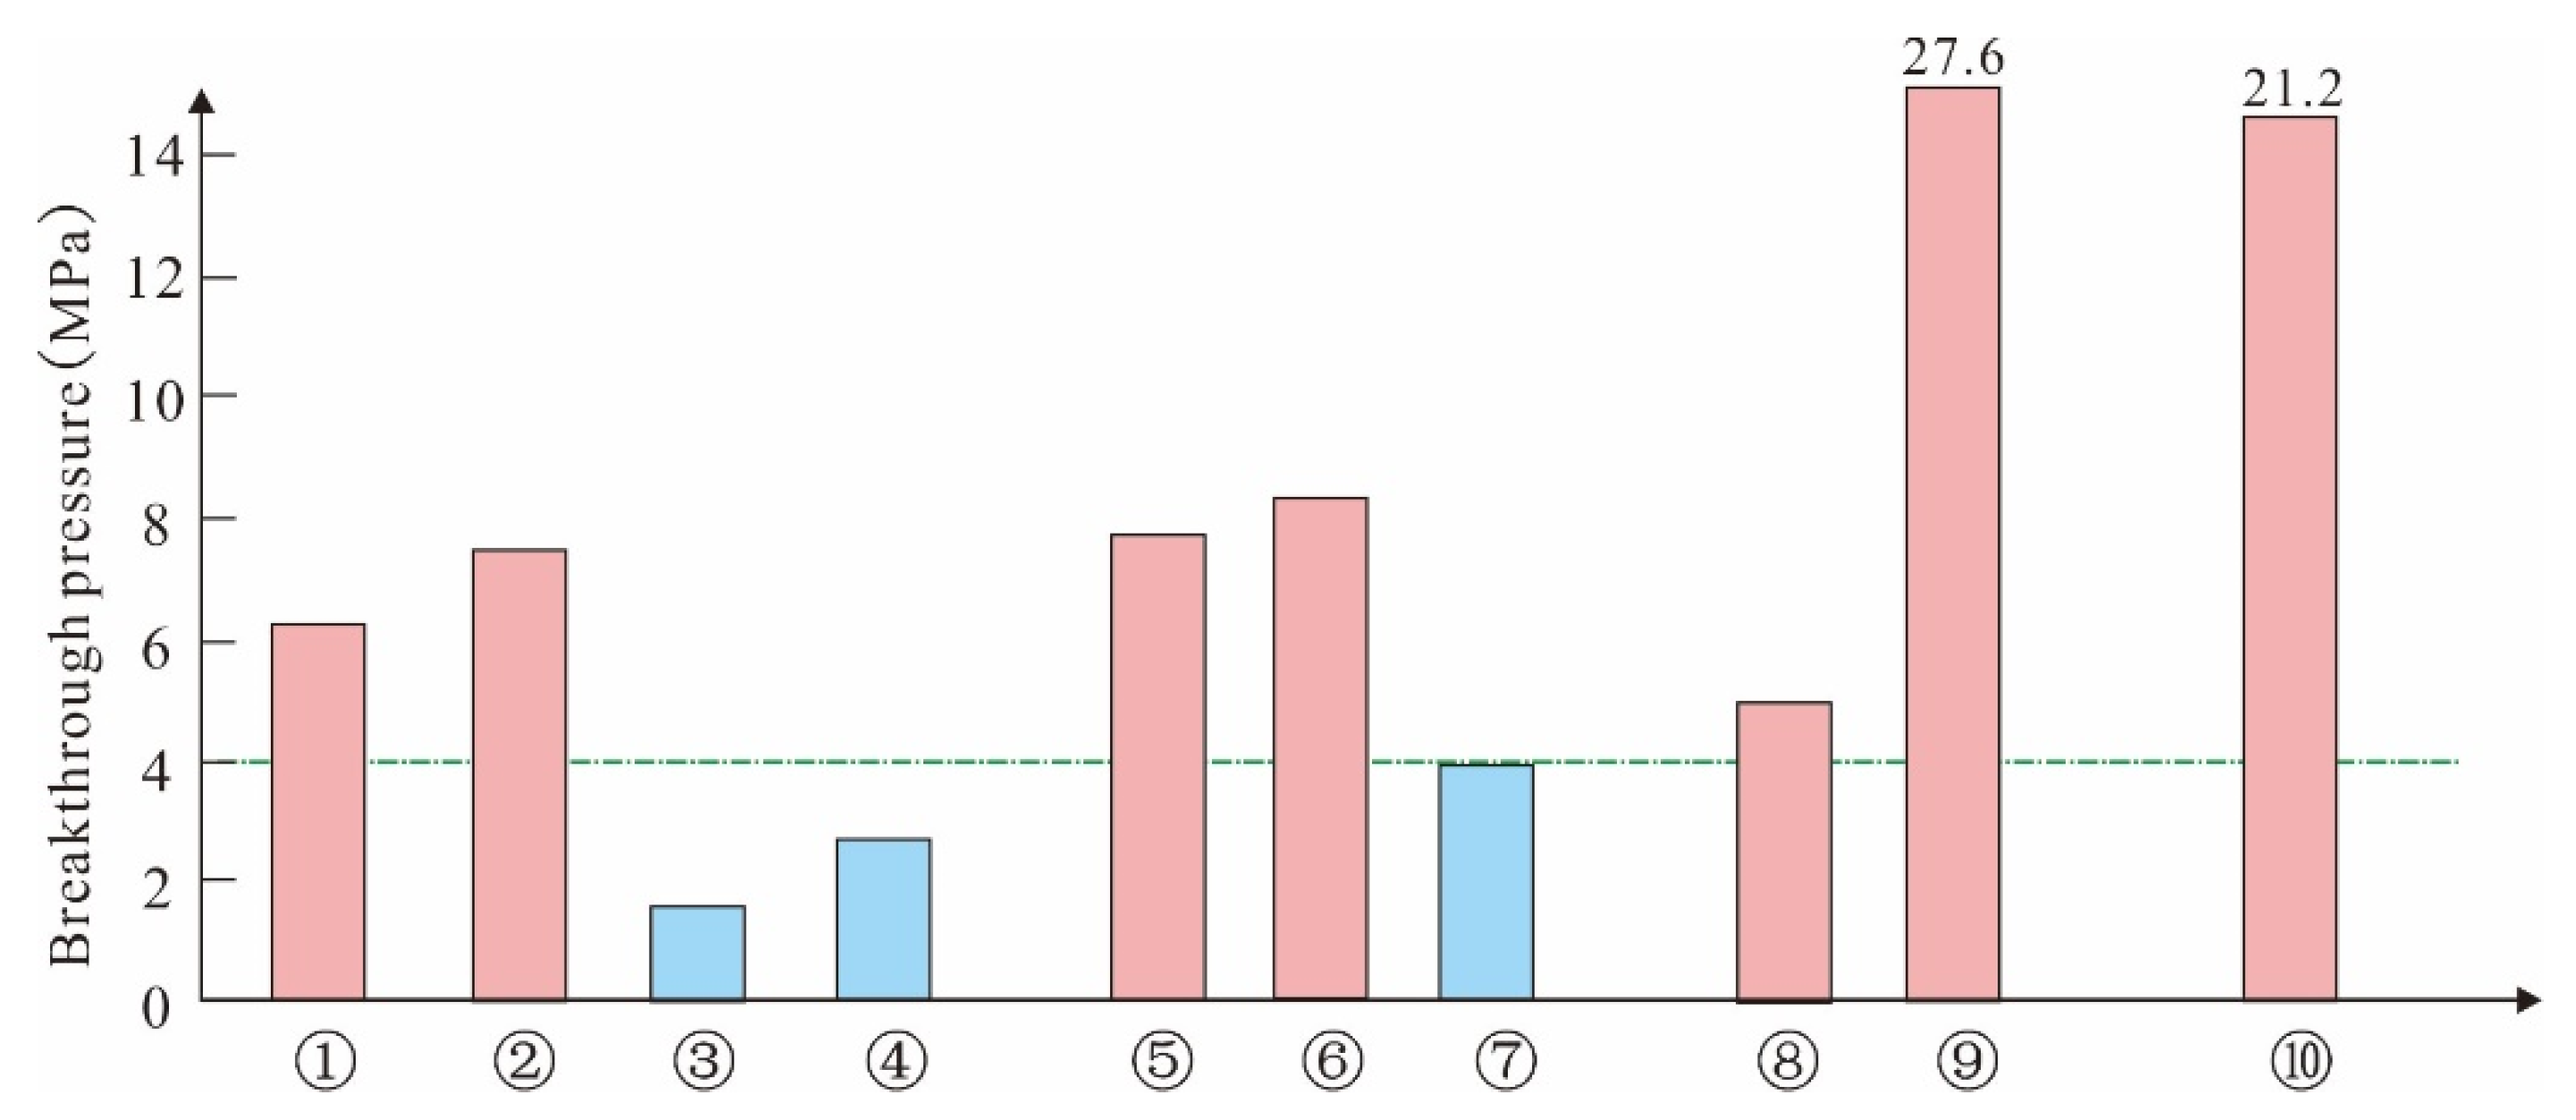
According to the cap breakthrough pressure experiment of Zhou et al. (2022) and the statistics of cap breakthrough pressure in Petroliferous basins in China, the breakthrough pressure of different lithologies of cap is salt rock > mudstone > gypsum rock > gypsum limestone > micritic limestone > gypsum dolomite > micritic dolomite (
Figure 4), and the cap breakthrough pressure of the corresponding rock assemblage type is type I
1 > type I
2 > type II
1 > type II
2 > type III. Fuzzy language was used to describe the quantitative values of lithologic combination factors, and the assigned values are shown in
Table 2.
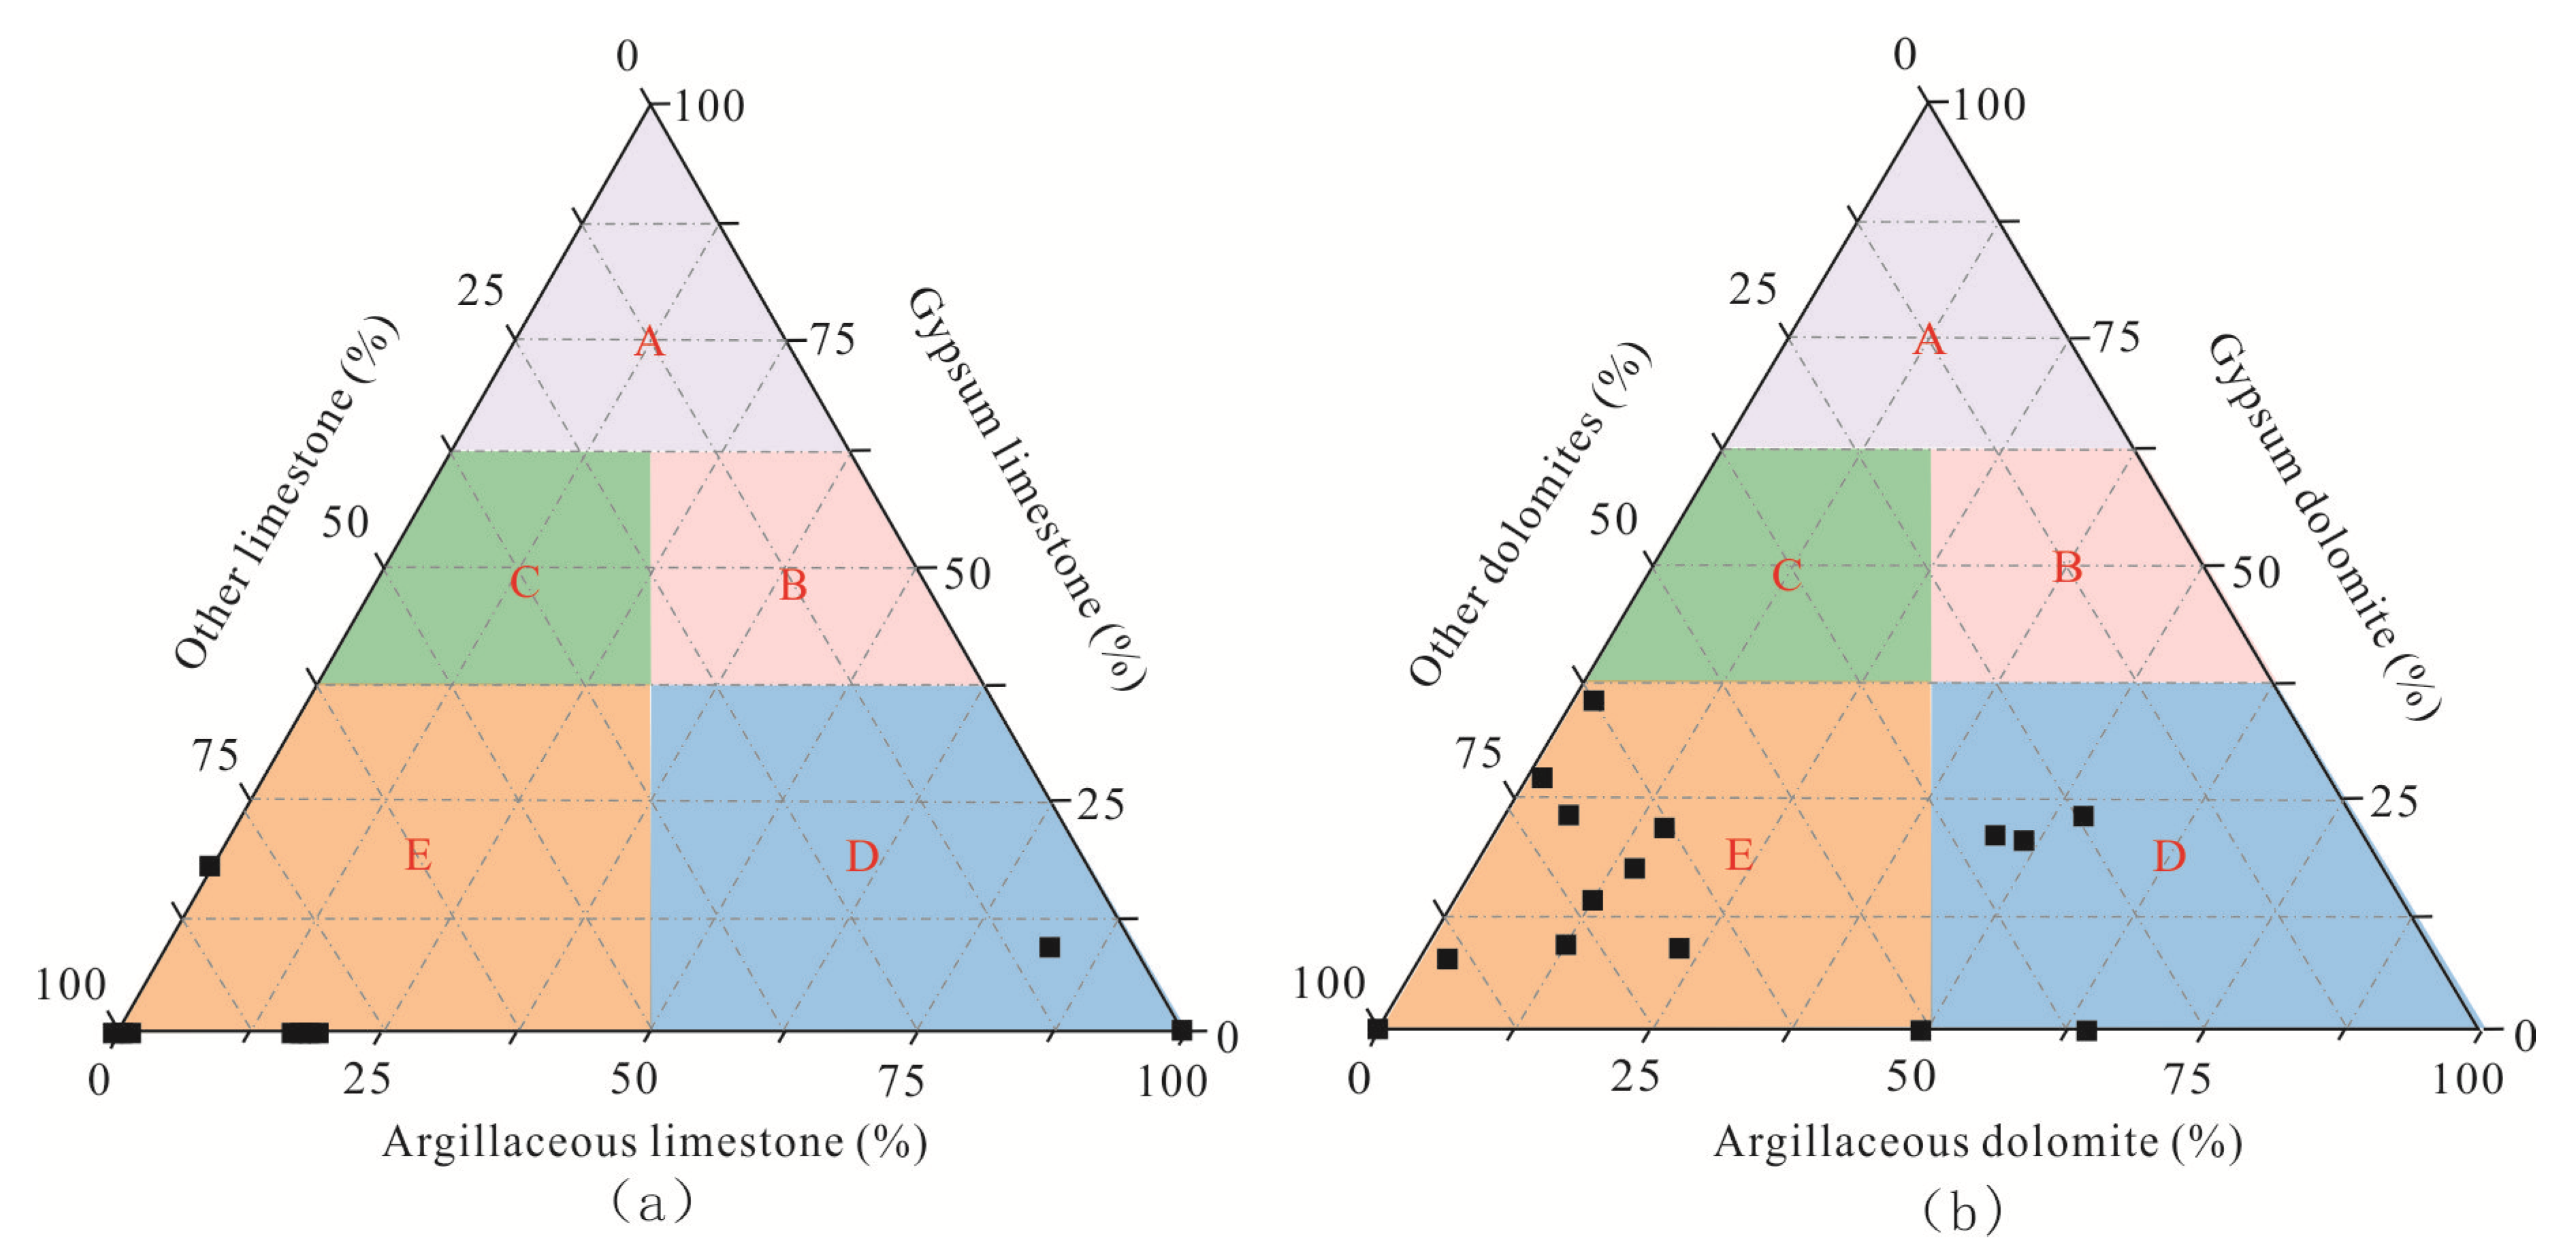
Lithological zoning: Because of the large difference in breakthrough pressure between limestone and dolomite types (
Figure 4), taking gypsum limestone, micritic limestone, and other types of limestone as end elements, the zoning evaluation chart of limestone lithology was established (
Figure 5a). Taking gypsum dolomite, micritic dolomite, and other types of dolomite as end elements, the lithology zoning evaluation chart of dolomite was established (
Figure 5b). The value was assigned according to the lithology zoning of caprock in the actual area of the Tarim Basin (
Table 2).
4.2.2. Thickness of Caprock
Using single-well integrated histograms from 14 wells in the Tarim Basin, the maximum thickness of thick monolayer, total thickness of thick monolayer, total thickness, and caprock ratio parameters of the Middle Cambrian Awatag Formation and Usongar Formation were statistically calculated. The statistical results revealed that the study area’s total caprock thickness ranged from 296 to 833.7 m; the ratio of caprock to stratum ranged from 22.6 to 89.6%; and the total of each parameter’s range was split into five intervals, and
Table 2 displays the allocated values for each interval.
4.2.3. Mechanical Parameters of the Caprock
In this study, the triaxial mechanical test of the research group 190 cover test results were examined, and the surrounding pressure and matching peak strength were read from the stress–strain curve. Based on the modified Griffith’s criterion, the associated internal friction coefficients and tensile strengths were computed using these values, and the related Mohr circles were displayed. According to statistical findings, gypsum rock, salt rock, and mudstone all have lower tensile strengths and peak strengths than carbonate rock when the confining pressure is low. Additionally, because gypsum rock increases a rock’s internal friction coefficient, gypsum rock, gypsum dolomite, and gypsum limestone have slightly higher internal friction coefficients than other lithologies (
Figure 6).
The values of homogenized mechanical parameters (
Table 3) are used as coefficients, and the product of the percentage of each dominant lithology to the total dominant lithology thickness is used as the evaluation value of each mechanical parameter because the composition ratio of single well lithologies varies, and the mean values of mechanical parameters of different lithologies differ significantly. The calculation results are displayed in
Table 4. The computation results’ range of values is divided into five equal sections, with the assignment of each interval indicated in
Table 2.
4.3. AHP Method to Determine Factor Weights
4.3.1. Hierarchical Model Drawing
A hierarchical structure model was created in the AHP software using three intermediate layer components—“lithology”, “thickness”, and “mechanical properties”—as well as nine evaluation criteria: the type of rock assemblage, lithological zoning, total thickness of a thick single layer, maximum thickness of a thick single layer, total thickness of the caprock layer, ratio of caprock to stratum, internal friction coefficient, compressive strength, and peak intensity.
Among them, rock assemblage type and lithological zoning belong to “lithology”; total thickness of the thick single layer, maximum thickness of the thick single layer, total thickness, ratio of caprock to stratum, and total belong to “thickness”. The coefficient of internal friction, tensile strength, and peak strength are “mechanical qualities” that are finally assigned to the decision target—the sealing capacity of gypsum-salt caprock (
Figure 7).
4.3.2. Matrix Judgment
The software was used to evaluate and construct the judgment matrix after identifying the hierarchical model. To begin, two factors were used to compare the three intermediate elements of “lithology”, “thickness”, and “mechanical characteristics”, and the data were entered using the judgment matrix’s scale or the slider on the right side of the adjustment module. For example, on a scale of one to three, “lithology” is somewhat more important than “thickness”; “lithology” is slightly more important than “mechanical characteristics”. On a scale of 1 to 4, “mechanical properties” is slightly significant to comparatively important; on a range of 2 to 4, “thickness” is similarly important to slightly important relative to “mechanical properties”, the data meaning is shown in
Table 5.
The data meaning is shown in
Table 5.
4.3.3. Matrix Calculation and Consistency Test
The parameter module of the AHP software was used to set the matrix calculation technique to “power method” and the consistency correction to “automatic selection adjustment methodology” to complete the matrix calculation and consistency check.
4.3.4. Weight Value Output
The weight values of each factor were output in the “Calculated Results” module (
Figure 8), as indicated in
Table 6.
4.4. Evaluation Model and Results
This paper constructed a quantitative method to evaluating the caprock sealing ability based on the weights of each factor calculated by AHP and the assigned values of each factor quantified by fuzzy language (
Table 3). The characterization formula of the sealing capacity evaluation value (C) of Cambrian gypsum-salt rock caprock is the following:
where xi is the evaluation parameter, and yi is the weight of the evaluation parameter (
Table 6). The quality of the caprock is good, average, and bad when value (C) is 3–4, 2–3, and 1–2, respectively.
The parameters of the Cambrian gypsum-salt caprock were allocated according to
Table 1 and computed using Equation (2) to complete the closure capacity evaluation according to the evaluation system (
Table 7). The C-value in the Bachu area ranged from 2.6 to 3.9, with an average value of 3.3, indicating high quality caprock; the C-value in the Taichung area ranged from 1.8 to 22, with an average value of 2.0, indicating general quality caprock; and the C-values of the two wells in the Tabei uplift, LT 1 and XH 1, were less than 2, indicating poor quality caprock (
Figure 8).
5. Discussion
To verify the sealing ability of the caprock to the overlying hydrocarbon, the relative locations of the gypsum-salt caprock of the Cambrian and the single-well hydrocarbon display formation were counted.
To ensure the correlation with the cap closure capacity, the comparative analyses of previous oil sources were combined. The hydrocarbon distribution above the Middle Cambrian Salt Paste cover derived from the hydrocarbon source rocks of the sub-salt Cambrian Yurtus Formation was determined, and the hydrocarbon was determined to be caused by the sub-salt hydrocarbon breaking through the cover [
23,
31].
Sub-salt type, sub-salt dominated type, and post-salt dominated type are the three distribution patterns of hydrocarbon generation with sub-salt hydrocarbon source rocks above and below the gypsum-salt caprock in the study area, according to the statistical data. The hydrocarbon distribution corresponds well with the confinement ability value of the gypsum-salt caprock of the Cambrian: when the confinement ability C-value is greater than 2, the corresponding hydrocarbon display type is mainly subsalt type and subsalt dominant type; when the C-value is less than 2, the corresponding hydrocarbon distribution location is above the salt, indicating that the evaluation results have a positive correlation with the deep hydrocarbon display in the Tarim Basin in the study area, and the confinement ability value (C) of the salt caprock has a positive correlation. The limit value of capacity value (C) is 2, and the C value reaches 2 to close the hydrocarbon (
Figure 9).
Statistics revealed that the on-salt dominant type of hydrocarbon distribution also existed in areas where the sealing ability of the caprock was strong, which differed from the results of capping ability evaluation, such as the well BT 5 with a C-value of 3.6, which had a good capping formation but was above the salt dominated type (
Figure 10).
The analysis shows that the post-drilling geological evaluation of well BT 5 concluded that the Lower Cambrian Xiaoerbulake Formation reservoir and the Middle Cambrian Awatage Formation gypsum-salt caprock formed a good reservoir–caprock combination relationship, but the top of the Cambrian System in the Haimidong 1 tectonic trap was cut through by multi-period active fractures (
Figure 10), which strongly damaged the ancient oil reservoir [
32], indicating that the gypsum-salt caprock can also be affected by the tectonic activities in the historical period and lead to hydrocarbon dissipation. As a result, both fracture activity and sealing ability of the caprock must be considered when determining the sealing ability of the gypsum-salt caprock of the Cambrian [
23].
Using the section of the well Kedong1-Yangta1 (
Figure 10) in the Tarim Basin as an example, the southern part of the southwest depression has poor sealing ability, high-angle recoil fractures develop, caprock integrity is destroyed, and hydrocarbons are primarily distributed along the fractures above the gypsum-salt caprock of the Cambrian. The caprock quality in the central uplift area is good, but the sub-salt hydrocarbon source rocks are undeveloped, and there is no hydrocarbon accumulation beneath the salt due to hydrocarbon sources. The value C in the northern depression reaches 2, and fracture activity is robust early and feeble late [
21]. Oil migrated to the salt from early hydrocarbon source rocks by active faults. The gypsum-salt caprock has the ability to “self-heal”, and the fractures close as the fractures become less active, and the gypsum-salt caprock seals the gas generated from late hydrocarbon source rocks or crude oil fracturing gas to the salt, forming a hydrocarbon distribution pattern of “oil above and gas below”. Because the Tabei uplift’s caprock is poorly closed and the high-angle retrograde fracture has occurred, the hydrocarbon are focused primarily on the salt (
Figure 10). The higher salt is primarily abundant in hydrocarbon (
Figure 10). As a result, the caprock sealing capacity value C reaches 2, and the caprock sealing in the area with poor fault activity or early strong and late weak is effective, which is a favorable accumulation area of subsalt hydrocarbon in the Tarim Basin.
6. Conclusions
In this paper, three major influencing factors of lithology, thickness, and mechanical properties are selected and refined into nine sub-categories of parameters based on the characteristics of the gypsum-salt caprock in the Tarim Basin, and the weights of each factor are determined by introducing AHP to establish a closure capacity evaluation system of the gypsum-salt caprock of the Cambrian in the Tarim Basin.
The quantitative evaluation results of caprock from 14 wells in the study area show that the evaluation value (C) of sealing capacity of Cambrian gypsum-salt rock caprock in the Tabei–Tazhong–Bachu area gradually increases, and the sealing capacity gradually becomes better. Combined with the analysis of fault type and activity, it is proposed that the sealing capacity of caprock C reaches 2, and the fault activity is poor or strong in the early period and weak in the late period, which is a favorable area for undersalt hydrocarbon accumulation in the Tarim Basin.
Author Contributions
Resources, Y.Z. and X.Y.; Validation, S.W.; Writing—original draft, S.Z.; Writing—review & editing, H.L. All authors have read and agreed to the published version of the manuscript.
Funding
This work was funded by the National Natural Science Foundation of China (Grant No. 42172147), the Strategic Priority Research Program of the Chinese Academy of Sciences (Grant No. XDA14010305), and the Petrochina major science and technology project (Grant No. ZD2019-183-002).
Acknowledgments
The authors are also grateful to Northwest Oilfield Branch Company Ltd., SINOPEC, for its contribution of data and valuable discussion.
Conflicts of Interest
The authors declare no conflict of interest.
References
- Saaty, R.W. The analytic hierarchy process—What it is and how it is used. Math. Model. 1987, 9, 161–176. [Google Scholar] [CrossRef]
- Vargas, L.G. An overview of the analytic hierarchy process and its applications. Eur. J. Oper. Res. 1990, 48, 2–8. [Google Scholar] [CrossRef]
- Ishizaka, A.; Labib, A. Review of the main developments in the analytic hierarchy process. Expert Syst. Appl. 2011, 38, 14336–14345. [Google Scholar] [CrossRef]
- Forman, E.H.; Gass, S.I. The analytic hierarchy process—An exposition. Oper. Res. 2001, 49, 469–486. [Google Scholar] [CrossRef]
- Saaty, T.L. Decision making with the analytic hierarchy process. Int. J. Serv. Sci. 2008, 1, 83–98. [Google Scholar] [CrossRef]
- Ho, W. Integrated analytic hierarchy process and its applications–A literature review. Eur. J. Oper. Res. 2008, 186, 211–228. [Google Scholar] [CrossRef]
- Rezaeyan, A.; Tabatabaei-Nejad, S.A.; Khodapanah, E.; Kamari, M. A laboratory study on capillary sealing efficiency of Iranian shale and anhydrite caprocks. Mar. Pet. Geol. 2015, 66, 817–828. [Google Scholar] [CrossRef]
- Newell, P.; Martinez, M.; Eichhubl, P. Impact of layer thickness and well orientation on caprock integrity for geologic carbon storage. J. Pet. Sci. Eng. 2017, 155, 100–108. [Google Scholar] [CrossRef]
- Wu, T.; Fu, X.; Liu, B.; Wang, H.; Xie, Z.; Pan, Z. Mechanical behavior and damage-induced permeability evolution of mudstone and gypsum caprocks. J. Pet. Sci. Eng. 2021, 196, 108079. [Google Scholar] [CrossRef]
- Zhang, C.; Wang, M. A critical review of breakthrough pressure for tight rocks and relevant factors. J. Nat. Gas Sci. Eng. 2022, 100, 104456. [Google Scholar] [CrossRef]
- Bildstein, O.; Jullien, M.; Crédoz, A.; Garnier, J. Integrated modeling and experimental approach for caprock integrity, risk analysis, and long term safety assessment. Energy Procedia 2009, 1, 3237–3244. [Google Scholar] [CrossRef]
- Bai, B.; Lü, G.; Li, X.; Li, Z.; Wang, Y.; Hu, Q. Quantitative measures for characterizing the sealing ability of caprock with pore networks in CO2 geological storage. Energy Procedia 2014, 63, 5435–5442. [Google Scholar] [CrossRef]
- Xiaofei, F.; Ru, J.; Haixue, W.; Tong, W.; Lingdong, M.; Yonghe, S. Quantitative evaluation of fault-caprock sealing capacity: A case from Dabei-Kelasu structural belt in Kuqa Depression, Tarim Basin, NW China. Pet. Explor. Dev. 2015, 42, 329–338. [Google Scholar]
- Lü, X.; Wang, Y.; Yu, H.; Bai, Z. Major factors affecting the closure of marine carbonate caprock and their quantitative evaluation: A case study of Ordovician rocks on the northern slope of the Tazhong uplift in the Tarim Basin, western China. Mar. Pet. Geol. 2017, 83, 231–245. [Google Scholar] [CrossRef]
- Fu, X.; Yan, L.; Meng, L.; Liu, X. Deformation mechanism and vertical sealing capacity of fault in the mudstone caprock. J. Earth Sci. 2019, 30, 367–375. [Google Scholar] [CrossRef]
- Wang, H.; Wu, T.; Fu, X.; Liu, B.; Wang, S.; Jia, R.; Zhang, C. Quantitative determination of the brittle–ductile transition characteristics of caprocks and its geological significance in the Kuqa depression, Tarim Basin, western China. J. Pet. Sci. Eng. 2019, 173, 492–500. [Google Scholar] [CrossRef]
- Liao, Z.; Wu, M.; Chen, X.; Zou, H. Fracture mechanical properties of carbonate and evaporite caprocks in Sichuan Basin, China with implications for reservoir seal integrity. Mar. Pet. Geol. 2020, 119, 104468. [Google Scholar] [CrossRef]
- Kibikas, W.M.; Ghassemi, A.; Carpenter, B.M. Evaluating the mechanical properties of carbonate and evaporite caprocks in the Sichuan Basin. J. Asian Earth Sci. X 2021, 6, 100063. [Google Scholar] [CrossRef]
- Wang, D.; Cheng, Y.; Wang, L.; Zhou, H. Controlling factors of coalbed methane occurrence below redbeds in Xutuan mine: Caprock thickness below redbeds. J. Nat. Gas Sci. Eng. 2021, 96, 104323. [Google Scholar] [CrossRef]
- Zhu, S.; Zheng, D.; Sun, J.; Wei, G.; Wu, Z.; Wang, J.; Guan, C.; Shi, L.; Zhang, L.; Li, C. Experimental study on dynamic sealing capacity and safe threshold of caprock in underground gas storages. J. Nat. Gas Sci. Eng. 2022, 101, 104521. [Google Scholar] [CrossRef]
- Jia, C.; Ma, D.; Yuan, J.; Wei, G.; Yang, M.; Yan, L.; Tian, F.; Jiang, L. Structural characteristics, formation & evolution and genetic mechanisms of strizke–slip faults in the Tarim Basin. Nat. Gas Ind. B 2022, 9, 51–62. [Google Scholar]
- Shuwei, G.; ZHANG, C.; Rong, R.; ZHANG, S.; Lin, W.; Lei, W.; Peiling, M.; Changwei, H. Early Cambrian syndepositional structure of the northern Tarim Basin and a discussion of Cambrian subsalt and deep exploration. Pet. Explor. Dev. 2019, 46, 1141–1152. [Google Scholar]
- Zhu, G.; Milkov, A.V.; Li, J.; Xue, N.; Chen, Y.; Hu, J.; Li, T.; Zhang, Z.; Chen, Z. Deepest oil in Asia: Characteristics of petroleum system in the Tarim basin, China. J. Pet. Sci. Eng. 2021, 199, 108246. [Google Scholar] [CrossRef]
- Wang, F.; Chen, D.; Wang, Q.; Du, W.; Chang, S.; Wang, C.; Tian, Z.; Cheng, M.; Yao, D. Quantitative evaluation of caprock sealing controlled by fault activity and hydrocarbon accumulation response: K gasfield in the Xihu Depression, East China Sea Basin. Mar. Pet. Geol. 2021, 134, 105352. [Google Scholar] [CrossRef]
- Liao, X.; Wang, Z.-L.; Fan, C.-Y.; Yu, C.-Q.; Yu, Z.-Y. Quantitative characterization of sealing integrity by caprock of Paleocene Artashi Formation gypsolyte rock in Kashi Sag of Tarim Basin, NW China. J. Cent. South Univ. 2019, 26, 695–710. [Google Scholar] [CrossRef]
- Tian, H.; Xu, T.; Zhu, H.; Yang, C.; Ding, F. Heterogeneity in mineral composition and its impact on the sealing capacity of caprock for a CO2 geological storage site. Comput. Geosci. 2019, 125, 30–42. [Google Scholar] [CrossRef]
- Zhou, X.; Lü, X.; Quan, H.; Qian, W.; Mu, X.; Chen, K.; Wang, Z.; Bai, Z. Influence factors and an evaluation method about breakthrough pressure of carbonate rocks: An experimental study on the Ordovician of carbonate rock from the Kalpin area, Tarim Basin, China. Mar. Pet. Geol. 2019, 104, 313–330. [Google Scholar] [CrossRef]
- Zhou, X.; Lü, X.; Sui, F.; Wang, X.; Li, Y. The breakthrough pressure and sealing property of Lower Paleozoic carbonate rocks in the Gucheng area of the Tarim Basin. J. Pet. Sci. Eng. 2022, 208, 109289. [Google Scholar] [CrossRef]
- Mehrgini, B.; Memarian, H.; Dusseault, M.B.; Ghavidel, A.; Heydarizadeh, M. Geomechanical characteristics of common reservoir caprock in Iran (Gachsaran Formation), experimental and statistical analysis. J. Nat. Gas Sci. Eng. 2016, 34, 898–907. [Google Scholar] [CrossRef]
- Závada, P.; Bruthans, J.; Adineh, S.; Warsitzka, M.; Zare, M. Composition and deformation patterns of the caprock on salt extrusions in southern Iran–Field study on the Karmostaj and Siah Taq diapirs. J. Struct. Geol. 2021, 151, 104422. [Google Scholar] [CrossRef]
- Yang, P.; Wu, G.; Ren, Z.; Zhou, R.; Zhao, J.; Zhang, L. Tectono-thermal evolution of Cambrian–Ordovician source rocks and implications for hydrocarbon generation in the eastern Tarim Basin, NW China. J. Asian Earth Sci. 2020, 194, 104267. [Google Scholar] [CrossRef]
- Ma, Y.; Cai, X.; Yun, L.; Li, Z.; Li, H.; Deng, S.; Zhao, P. Practice and theoretical and technical progress in exploration and development of Shunbei ultra-deep carbonate oil and gas field, Tarim Basin, NW China. Pet. Explor. Dev. 2022, 49, 1–20. [Google Scholar] [CrossRef]
Figure 1.
Sedimentary phases, tectonic features, and tectonic profiles of the Middle–Lower Cambrian in the Tarim Basin (modified after Jia et al., 2021 [
21]). Є
1y = Yuertusi Formation, Є
1x = Xiaoerbulake Formation,Є
1w = Wusonger Formation, Є
2s = Shayilike Formation, Є
2a = Awatag Formation.
Figure 1.
Sedimentary phases, tectonic features, and tectonic profiles of the Middle–Lower Cambrian in the Tarim Basin (modified after Jia et al., 2021 [
21]). Є
1y = Yuertusi Formation, Є
1x = Xiaoerbulake Formation,Є
1w = Wusonger Formation, Є
2s = Shayilike Formation, Є
2a = Awatag Formation.
Figure 2.
Hierarchical single sort solution process.
Figure 2.
Hierarchical single sort solution process.
Figure 3.
Classification of the Middle–Lower Cambrian (Є2a–Є1w) rock assemblage types in the Tarim Basin.
Figure 3.
Classification of the Middle–Lower Cambrian (Є2a–Є1w) rock assemblage types in the Tarim Basin.
Figure 4.
Comparison of the average breakthrough pressure of different lithological caprock layers. ① = micritic dolomite, ② = gypsum dolomite, ③ = fine crystalline dolomite, ④ = granular dolomite, ⑤ = micritic limestone, ⑥ = gypsum limestone, ⑦ = granular limestone, ⑧ = gypsum rock, ⑨ = salt rock, ⑩ = mudstone. Using 4 MPa as the boundary, those greater than 4 MPa are the dominant lithology, which are marked with red columns. (Data source: Wu et al., 2022 [
9]).
Figure 5.
Lithological zoning evaluation triangle plate. (a) Limestone plate, (b) Dolomite plate.
Figure 5.
Lithological zoning evaluation triangle plate. (a) Limestone plate, (b) Dolomite plate.
Figure 6.
Comparison diagram of lithology and mechanical properties: (a) coefficient of internal friction, (b) compressive strength, (c) peak intensity. ① = gypsum dolomite, ② = micritic dolomite, ③ = micritic limestone, ④ = gypsum limestone, ⑤ = salt rock, ⑥ = gypsum rock, ⑦ = mudstone.
Figure 6.
Comparison diagram of lithology and mechanical properties: (a) coefficient of internal friction, (b) compressive strength, (c) peak intensity. ① = gypsum dolomite, ② = micritic dolomite, ③ = micritic limestone, ④ = gypsum limestone, ⑤ = salt rock, ⑥ = gypsum rock, ⑦ = mudstone.
Figure 7.
Hierarchy modeling in AHP software. The red line in the figure is the identification, and the corresponding icon is clicked to establish the hierarchical relationship.
Figure 7.
Hierarchy modeling in AHP software. The red line in the figure is the identification, and the corresponding icon is clicked to establish the hierarchical relationship.
Figure 8.
Contour map of sealing capacity value of Cambrian gypsum-salt caprock in the Tarim Basin. The trend of the isoline of caprock sealing capacity refers to the sedimentary facies map. Taking the west by south of the basin as the center, the sealing capacity gradually deteriorates to the surroundings.
Figure 9.
Evaluation results of sealing ability of Cambrian gypsum-salt rock and hydrocarbon display analysis diagram in the Tarim Basin. The dotted line is the dividing line of caprock quality. The caprock sealing capacity value (C) in the range of 1–2 is the caprock with poor quality, in the range of 2–3 is the caprock with general quality, and in the range of 3–4 is the caprock with high quality.
Figure 10.
Sealing capacity and hydrocarbon distribution of Cambrian caprock in the Tarim Basin (see
Figure 8 for section position). The “sub-salt layers enrichment type”, “post-salt layers enrichment type”, and “oil in sub-salt layers and gas in post-salt layers type” are the three main hydrocarbon enrichment styles in the study area. The “post-salt layers enrichment type” is distributed in the areas with poor sealing ability of caprock and developed thrust faults at the edge of the basin, such as south of the southwest depression; the “sub-salt layers enrichment type” is mainly distributed in the areas with good sealing ability of caprock and undeveloped faults, such as north of the southwest depression; and the “oil in sub-salt layers and gas in post-salt layers type” is distributed in areas with good sealing capacity of caprock, and fault activity is poor or strong in the early period and weak in the late period, such as the northern depression.
Table 1.
Judgment matrix scales and their definitions.
Table 1.
Judgment matrix scales and their definitions.
| Scale | Definition |
|---|
| 1 | Factor i is as important as j |
| 3 | Factors i and j are slightly more important |
| 5 | Factors i and j are more strongly important |
| 7 | Factors i and j are strongly important |
| 9 | Factors i and j are absolutely important |
| 2, 4, 6, 8 | Between the above two adjacent cases |
| Countdown | Compare the two targets in reverse |
Table 2.
Evaluation parameter assignment table of sealing capacity of Cambrian gypsum-salt rock caprock.
Table 2.
Evaluation parameter assignment table of sealing capacity of Cambrian gypsum-salt rock caprock.
| Evaluation Parameters | Parameter Assignment |
|---|
| 4–5 | 3–4 | 2–3 | 1–2 | 0–1 |
|---|
| Lithological assemblage type | Salt rock type I | Salt rock type II | Gypsum rock type I | Gypsum Rock type II | Carbonate rock type |
| Lithological zoning | Limestone | Zone A | Zone B | Zone C | Zone D | Zone E |
| Dolomite | Zone A | Zone B | Zone C | Zone D | Zone E |
| Thick single layer total thickness (m) | >350 | 350–300 | 300–250 | 250–200 | <200 |
| Total thickness (m) | >750 | 600–750 | 450–600 | 300–450 | <300 |
| Thick single layer maximum thickness (m) | >40 | 35–40 | 35–30 | 30–25 | <25 |
| Ratio of Caprock to Stratum % | >60 | 50–60 | 40–50 | 30–40 | <30 |
| Peak intensity (MPa) | >45 | 35–45 | 25–35 | 15–25 | <15 |
| Compressive strength (MPa | 70–85 | 55–70 | 40–55 | 25–40 | <25 |
| Coefficient Internal friction | 70–85 | 55–70 | 40–55 | 25–40 | <25 |
Table 3.
Homogenization table of each mechanical parameter.
Table 3.
Homogenization table of each mechanical parameter.
| Rockiness | Coefficient Internal Friction (X) | Compressive Strength (Y, MPa) | Peak Intensity (Z, MPa) |
|---|
| Average Value | Homogenization (xi) | Average Value | Homogenization (yi) | Average Value | Homogenization (zi) |
|---|
| Gypsum dolomite | 0.72 | 0.97 | 23.07 | 0.72 | 161.34 | 0.60 |
| Micritic dolomite | 0.46 | 0.25 | 30.34 | 1.00 | 134.71 | 0.44 |
| Micritic limestone | 0.50 | 0.36 | 14.43 | 0.38 | 144.30 | 0.49 |
| Gypsum limestone | 0.73 | 1.00 | 21.19 | 0.64 | 226.50 | 1.00 |
| Salt Rock | 0.37 | 0.00 | 9.40 | 0.18 | 64.01 | 0.00 |
| Gypsum Rock | 0.66 | 0.81 | 4.75 | 0.00 | 78.10 | 0.09 |
| Mudstone | 0.65 | 0.78 | 8.80 | 0.16 | 118.00 | 0.33 |
Table 4.
Evaluation value of each mechanical parameter.
Table 4.
Evaluation value of each mechanical parameter.
| Well Name | Thickness of Dominant Lithology as a Percentage of Total Dominant Lithology Thickness (%) | Mechanical Parameters Evaluation Value |
|---|
| Gypsum Dolomite | Micritic Dolomite | Micritic Limestone | Gypsum Limestone | Salt Rock | Gypsum Rock | Mudstone | A (X) | B (Y) | C (Z) |
|---|
| T 1 | 4.50 | 6.14 | 0.00 | 0.00 | 7.88 | 42.77 | 38.71 | 70.74 | 16.99 | 22.03 |
| ST1 | 10.88 | 24.83 | 2.04 | 0.00 | 4.42 | 31.29 | 26.53 | 63.53 | 38.48 | 30.02 |
| F1 | 10.30 | 8.72 | 7.21 | 0.81 | 44.75 | 21.02 | 7.19 | 38.21 | 28.60 | 18.62 |
| H4 | 0.00 | 15.56 | 0.00 | 0.00 | 61.87 | 2.22 | 20.35 | 21.56 | 29.95 | 13.76 |
| CT1 | 9.71 | 6.76 | 0.29 | 0.00 | 47.94 | 27.94 | 7.35 | 39.58 | 23.67 | 13.88 |
| TC 1 | 19.01 | 47.93 | 0.00 | 0.00 | 0.00 | 27.27 | 5.79 | 57.03 | 62.54 | 36.86 |
| ZS1 | 60.58 | 16.45 | 0.00 | 0.00 | 0.00 | 18.64 | 4.33 | 81.35 | 60.76 | 46.69 |
| LT 1 | 51.67 | 47.65 | 0.00 | 0.00 | 0.00 | 0.00 | 0.68 | 62.56 | 84.96 | 52.19 |
| ZS 5 | 23.20 | 8.51 | 0.00 | 1.48 | 0.00 | 60.36 | 6.44 | 80.03 | 27.19 | 26.70 |
| QT 1 | 3.83 | 8.27 | 2.02 | 0.00 | 49.60 | 22.18 | 14.11 | 35.48 | 22.98 | 13.58 |
| K2 | 17.37 | 1.26 | 0.00 | 0.00 | 48.80 | 10.74 | 21.83 | 42.89 | 26.04 | 19.15 |
| WC1 | 0.00 | 0.00 | 0.00 | 0.00 | 0.00 | 0.00 | 100.0 | 78.00 | 16.00 | 33.00 |
| ZH 1 | 38.81 | 2.69 | 0.00 | 0.00 | 3.88 | 51.94 | 2.69 | 82.49 | 31.76 | 30.03 |
| BT 5 | 5.46 | 12.74 | 11.45 | 0.00 | 45.25 | 2.54 | 22.57 | 32.27 | 32.78 | 22.17 |
| XH 1 | 0.00 | 36.53 | 13.87 | 0.00 | 0.00 | 5.87 | 43.73 | 52.99 | 48.80 | 37.83 |
Table 5.
Judgment matrix scales and their meanings.
Table 5.
Judgment matrix scales and their meanings.
| Scale | Meaning |
|---|
| (7, 9] | Indicates that the factor Fi is absolutely important compared to Fj, Fi |
| (5, 7] | Indicates that the factor Fi is very important compared to Fj, Fi |
| (3, 5] | Indicates that the factor Fi is more important compared to Fj |
| (1, 3] | Indicates that the factor Fi is slightly more important compared to F |
| 1 | Indicates that the factors Fi and Fj are equally important when comparing Fi and Fj |
| [1/3, 1) | Indicates that the factor Fi is slightly more important than Fj |
| [1/5, 1/3) | Indicates that the factor Fi is more important than Fj |
| [1/7, 1/5) | Indicates that the factor Fi is very important compared to Fj |
| [1/9, 1/7) | Indicates that the factor Fi is absolutely important compared to Fj |
Table 6.
Evaluation parameter weight value of sealing capacity of Cambrian gypsum-salt caprock.
Table 6.
Evaluation parameter weight value of sealing capacity of Cambrian gypsum-salt caprock.
| Evaluation Parameters | Weight Value |
|---|
| Rock assemblage type | 0.5208 |
| Lithological zoning | Limestone type | 0.0521 |
| Dolomite type | 0.0521 |
| Total thickness | 0.0311 |
| Total thickness of thick single layer | 0.1098 |
| Maximum thickness of thick single layer | 0.0625 |
| Ratio of caprock to stratum | 0.0350 |
| Peak intensity | 0.0720 |
| Compressive strength | 0.0454 |
| Internal friction coefficient | 0.0191 |
Table 7.
Evaluation of sealing ability of Cambrian gypsum-salt rock type caprock in the Tarim Basin.
Table 7.
Evaluation of sealing ability of Cambrian gypsum-salt rock type caprock in the Tarim Basin.
| Region | Well Name | Lithological Combination Type | Lithological Zoning | Thick Single Layer Total Thickness (m) | Total Thickness (m) | Thick Single Layer Maximum Thickness (m) | Ratio of caprock to stratum % | Peak Strength
(Mpa) | Compressive Strength
(Mpa) | Coefficient Internal Friction | C-Value |
|---|
| Limestone Type | Dolomite Type |
|---|
| Data | Assignment | Zone | Assignment | Zone | Assignment | Data | Assignment | Data | Assignment | Data | Assignment | Data | Assignment | Data | Assignment | Data | Assignment | Data | Assignment |
|---|
| Bachu | T1 | type II1 | 3.0 | E | 0.3 | E | 0.4 | 488.6 | 4.8 | 698.6 | 3.7 | 28.0 | 1.8 | 69.9 | 4.2 | 22.0 | 1.7 | 17.0 | 0.3 | 70.7 | 4.1 | 2.7 |
| ST1 | type II1 | 3.0 | E | 0.6 | D | 1.9 | 294.0 | 2.9 | 391.0 | 1.7 | 21.0 | 0.8 | 75.2 | 4.6 | 30.0 | 2.5 | 38.5 | 1.8 | 63.5 | 3.5 | 2.6 |
| F1 | type I2 | 4.0 | D | 1.9 | E | 0.7 | 481.1 | 4.8 | 723.0 | 4.2 | 37.9 | 3.9 | 66.5 | 4.1 | 18.6 | 1.4 | 28.6 | 1.4 | 38.2 | 1.8 | 3.5 |
| H4 | type I1 | 5.0 | E | 1.5 | D | 1.3 | 427.5 | 4.3 | 569.5 | 2.6 | 72.5 | 5.0 | 75.1 | 4.6 | 13.8 | 0.9 | 30.0 | 1.5 | 21.6 | 0.7 | 3.9 |
| CT1 | type I2 | 4.0 | E | 0.3 | E | 0.7 | 340.0 | 3.8 | 564.0 | 2.6 | 34.0 | 2.8 | 60.3 | 4.0 | 13.9 | 0.9 | 23.7 | 0.9 | 39.6 | 2.0 | 3.1 |
| BT 5 | type I1 | 5.0 | D | 0.3 | D | 1.8 | 349.0 | 2.4 | 389.5 | 1.6 | 30.9 | 2.1 | 89.6 | 5.0 | 22.2 | 1.7 | 32.8 | 1.7 | 32.3 | 1.7 | 3.6 |
| K2 | type I2 | 4.0 | E | 0.3 | E | 0.9 | 437.5 | 4.3 | 696.5 | 3.6 | 78.0 | 5.0 | 62.8 | 4.2 | 19.1 | 1.4 | 26.0 | 1.1 | 42.9 | 2.3 | 3.4 |
| QT 1 | type I1 | 5.0 | E | 0.6 | D | 1.8 | 496.0 | 4.9 | 622.0 | 3.1 | 38.0 | 3.6 | 79.7 | 4.8 | 13.6 | 0.9 | 23.0 | 0.8 | 35.5 | 1.6 | 3.9 |
| Bachu | ZS1 | type II2 | 2.0 | E | 0.9 | E | 0.7 | 177.8 | 0.8 | 508.8 | 2.5 | 42.5 | 4.1 | 34.9 | 1.4 | 46.7 | 4.2 | 60.8 | 3.6 | 81.4 | 4.7 | 2.2 |
| ZS5 | type II2 | 2.0 | E | 0.9 | E | 0.3 | 223.2 | 1.4 | 833.7 | 5.0 | 380.0 | 3.6 | 26.8 | 0.6 | 26.7 | 2.2 | 27.2 | 1.2 | 80.0 | 4.7 | 2.0 |
| ZH 1 | type II2 | 2.0 | E | 0.3 | E | 0.8 | 335.0 | 2.3 | 565.0 | 2.6 | 31.0 | 2.1 | 59.3 | 3.9 | 30.0 | 2.5 | 31.8 | 1.7 | 82.5 | 4.8 | 2.0 |
| TC 1 | type II2 | 2.0 | E | 0.3 | E | 0.6 | 121.0 | 0.2 | 296.0 | 0.9 | 31.0 | 2.1 | 40.9 | 2.0 | 36.9 | 3.2 | 62.5 | 3.4 | 57.0 | 3.1 | 1.8 |
| Tabei | XH 1 | type III | 1.0 | E | 0.6 | D | 1.0 | 375.0 | 4.2 | 551.0 | 4.1 | 38.0 | 3.6 | 68.1 | 2.9 | 37.8 | 3.3 | 48.8 | 2.4 | 53.0 | 2.9 | 1.9 |
| LT 1 | type III | 1.0 | E | 0.3 | E | 0.7 | 146.9 | 0.4 | 650.0 | 3.4 | 27.8 | 1.7 | 22.6 | 0.4 | 52.2 | 4.8 | 85.0 | 5.0 | 62.6 | 3.5 | 1.5 |
| Publisher’s Note: MDPI stays neutral with regard to jurisdictional claims in published maps and institutional affiliations. |
© 2022 by the authors. Licensee MDPI, Basel, Switzerland. This article is an open access article distributed under the terms and conditions of the Creative Commons Attribution (CC BY) license (https://creativecommons.org/licenses/by/4.0/).


