1. Introduction
Lithium-ion batteries (LIBs), which possess higher power density and lifespan than the majority of rechargeable batteries, are widely used in modern battery–electric vehicles (BEVs) [
1]. The service life of LIBs targeted for BEV applications is limited by performance degradation, such as fading capacity and power due to various degradation mechanisms, including solid electrolyte interphase (SEI) growth, electrolyte decomposition, lithium plating, particle cracking of the electrode active material, electrical contact loss, binder, and current collector decomposition [
2]. The performance degradation of LIB originates from multiple mechanisms and their interactions as opposed to individual mechanisms [
3]. Therefore, the mathematical modeling of LIBs to predict their performance degradation is challenging and requires the inclusion of multiple simultaneously occurring battery-aging processes for the effective design of the battery management system (BMS) of BEVs [
4].
Many studies concerning capacity and power fades of LIB owing to aging and their aging mechanisms have been undertaken [
5,
6,
7]. Peled et al. [
5] reviewed the electrochemical phenomena for the formation and growth of an SEI and the chemical composition and characteristics of the SEI according to the physical properties of the electrodes and electrolytes of LIBs. Their study demonstrated that electrolyte decomposition according to the harsh charging current, operating temperature, and many cycles in the battery causes electrochemically incomplete SEI growth and adversely affects cell performance, efficiency, and safety. Waldmann et al. [
6] summarized the mechanisms of lithium plating and lithium deposition in graphite anodes when charging at high currents or low temperatures. Schipper et al. [
7] argued that the risk of low thermal stability at high state of charge (SOC) of nickel-rich LiNi
1-x-yCo
xMn
yO
2 and electrolyte depletion owing to the growth of the cathode solid electrolyte interphase are due to the reduced capacity of the lithium-ion battery. In some studies, the aging mechanism of LIB was quantitatively investigated through electrochemical analysis [
8,
9,
10]. Günter et al. [
8] examined the effect of the electrolyte quantity on the resistance and C-rate of an LIB and demonstrated how the charge-discharge capacity and potential change with the cycle and electrolyte quantity. Wetjen et al. [
9] performed a cycling test according to the Si ratio of the Si/graphite anode and explained the electrode degradation mechanism through electrochemical analysis. Yang et al. [
10] classified the aging mechanism of LIBs by incremental capacity analysis and investigated the relationship between the coulombic efficiency and capacity fade in long-term cycles. Various researchers have studied the aging phenomenon of LIB by combining mechanistic, chemical kinetics, and mathematical analysis with an electrochemical model [
11,
12,
13,
14,
15,
16,
17]. Ouyang et al. [
11] explained that LIB capacity fades through a mechanistic degradation model that considers the effects of an increase in ohmic resistance, lithium inventory loss, and active material loss. Gao et al. [
12] developed a simple capacity fade model that can predict the capacity fade of an LIB in various charging modes according to the charging current and charging termination voltage. Dong et al. [
13] developed an electrochemical aging model for LIBs that simulated SEI growth according to operating conditions, such as environmental temperature, SOC range, and current rate. Ali et al. [
14] evaluated the mechanical fracture properties of the SEI layer by combining an electrochemical model considering the reduction of cyclable lithium and electrolyte volume with a two-dimensional mechanical model for the core-shell structure. Ali et al. [
15] evaluated the discharge performance according to the SEI formation and Cu dissolution/deposition of CuCo
2O
4-based LIB cells based on electrochemical models and experiments. Yi et al. [
16] predicted the capacity fade and temperature distribution of aged LIB through a cycling test by using a two-dimensional model based on the distributions of the potential and current density on the electrodes. In addition to previous studies [
16], Koo et al. [
17] developed a model to predict the electrical and thermal behaviors of LIBs under various fast-charging scenarios. While maintaining its validity, their model did not calculate the phase and transport phenomena of lithium ions in the electrolyte, hence decreasing computational burden and time [
16,
17].
According to previous reviews on the aging of LIBs [
1,
2,
3,
4,
5,
6,
7], many processes contribute to the capacity and power fades of LIBs. These processes influencing LIB aging do not occur separately, but they interact to generate capacity loss and resistance augmentation and reduce the available peak power [
18,
19]. It has been very challenging to isolate the contribution of individual aging mechanism on the aging of an LIB, and Lee et al. [
20] successfully isolated the effect of cyclable lithium loss on the performance degradation of an LIB. It would be even more challenging to include multiple aging mechanisms for the estimation of the combined effect of multiple aging processes on the performance degradation of LIBs. In this study, two aging mechanisms of cyclable lithium loss and electrolyte depletion induced by various unwanted “side reactions” occurring during the operation and storage of LIBs are chosen to demonstrate the feasibility of the modeling to estimate the combined effects of multiple aging mechanisms on the capacity and discharge power fade of LIB. The modeling strategy presented in this study is an extension of the previous study by Lee et al. [
20], in which the change of the discharge behavior of the LIB cell according to loss of cyclable lithium was modeled. In this study, a direct and intuitive modeling methodology was adopted. Modeling parameters that can simulate cyclable lithium loss and electrolyte depletion were derived from the voltage of the cell measured under constant-current discharge at various current levels. The validity of the modeling results was verified by comparing them with experimental measurements.
2. Mathematical Model
Nickel-rich NCM are used in many lithium-ion battery applications owing to their high energy density [
21,
22]. Understanding the mechanism of NCM cathode degradation is still a critical research topic [
23], and numerous studies are being conducted on NCM-based LIB [
24,
25,
26]. In this study, modeling was conducted using the LIB cells composed of a cathode of LiNi
0.6Co
0.2Mn
0.2O
2 (NCM622) and an anode made of natural graphite.
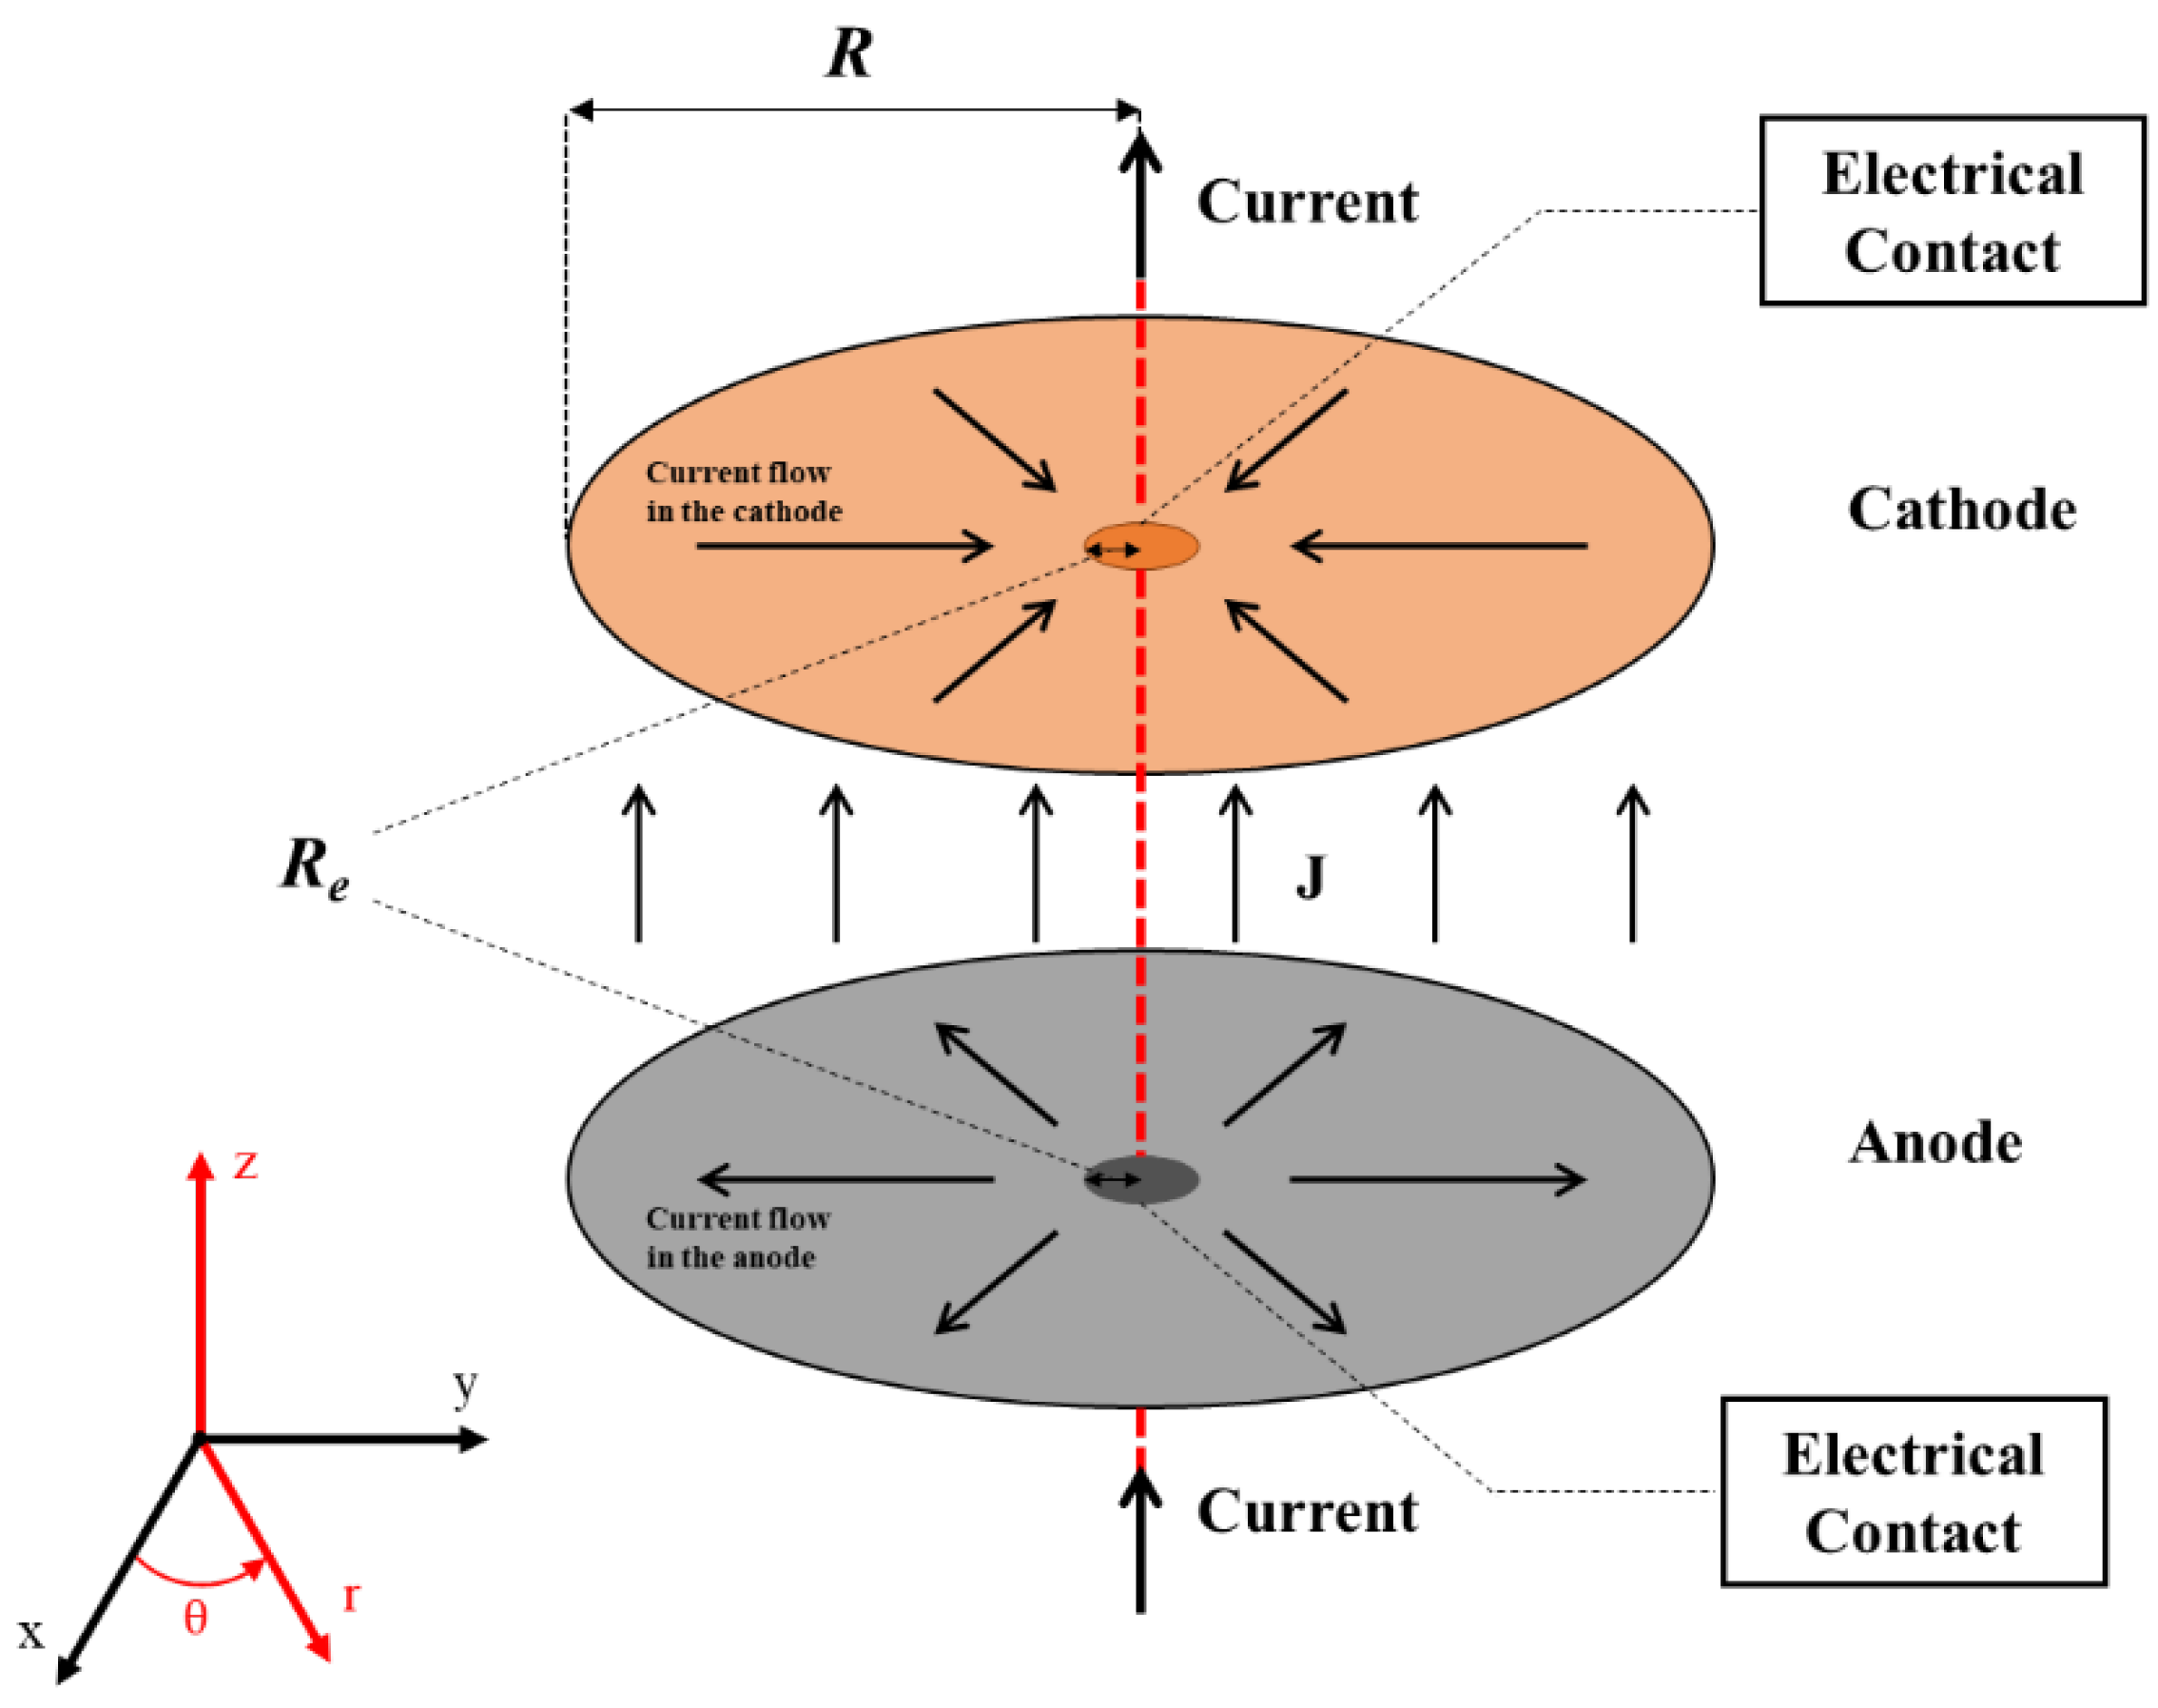
Figure 1 shows the current flows of two parallel circular electrodes in a cylindrical coordinate system. The distance between the cathode and anode is so close that the current density flows perpendicular to the electrodes. During discharge, current flows from the anode to the cathode, and the radius of the electrode is
R, and the radius of the electrical contact is
Re. The modeling procedure performed in this study is similar to that of Lee et al. [
20], in which a two-dimensional model calculating the potential and current density distribution of an electrode is reduced to one-dimensional based on the circular symmetry around the center of a circular electrode in terms of the radial coordinate,
r, in
Figure 1. As a result of the circular symmetry, the Poisson equation for calculating the voltage distribution between the cathode and anode can be written as follows [
16,
17,
20,
27]:
where
r is the radial coordinate;
Vc and
Va are the cathode and anode voltages (V), respectively;
rc and
ra are the cathode and anode resistances (Ω), respectively;
J represents the current density (current per unit area (A·m
−2)) flowing from the anode to the cathode through the separator;
Re and
R stand for the radii of the electrical contact and the LIB coin cell, respectively.
To solve these equations, appropriate boundary conditions must be assigned for
Vc and
Va during discharge. First, the boundary condition for
Vc during discharge can be expressed by Equations (3) and (4).
The first boundary condition during discharge, given in Equation (3), is that the value of the linear current density passing through the electrical contact with a perimeter of
(cm) is
. The total current passing through the electrical contact at a discharge is constant and has a value of
I0 (A). The second boundary condition given in Equation (4) indicates that no current flows at the edge of the cathode. The boundary condition for
Va during discharge can be expressed by Equations (5) and (6).
The first boundary condition given in Equation (5) indicates that the voltage of the electrical contact at the anode during discharge is fixed at zero as the reference voltage. The second boundary condition given in Equation (6) indicates that no current flows at the edge of the anode, which is analogous to the boundary condition of
Vc. Following a similar methodology described in [
16,
17], the governing Equations (1) and (2) subject to the boundary conditions (3)–(6) for obtaining the voltage distributions at the electrodes were solved by using the finite element method.
In Equations (1) and (2), the current density,
J, is a function of the cathode and anode voltages. Current density and voltage depend on the polarization characteristics of the electrode. In this study, the relationship between the current density and electrode voltages used by Tiedemann and Newman [
28] and Newman and Tiedemann [
29] was employed as
where
Y is a fitting parameter, and its physical meaning is analogous to the rate constant of an electrochemical reaction;
U is a fitting parameter, and its physical meaning is the equilibrium voltage of the battery cell [
27]. We represent
Y and
U as a function of SOC following the approach of Gu [
30]. The details of the process of deriving
Y and
U as a function of SOC is described in the
Section 4.
3. Experimental Section
To measure the electrochemical characteristics, a CR2032 coin-type cell composed of a NCM622 cathode and graphite anode was used. The cathode consisted of 94 wt% active material, 0.75 wt% carbon nanotube, 3 wt% superP, and 2.25 wt% polyvinylidene fluoride(PVDF) coated on Al foil. The anode was composed of 91 wt% graphite, 1 wt% superP, and 8 wt% PVDF coated on Cu foil. Both electrodes were purchased from LIBEST (Daejeon, Republic of Korea). The 1M LiPF6 in ethylene carbonate: diethyl carbonate: ethyl methyl carbonate with a 3:3:4 volume ratio and 2% vinylene carbonate were used as the electrolyte with the SC1622 separator. The capacity balance ratio between the anode and cathode was 1.1:1. Galvanostatic charge-discharge tests were performed by using a Wonatech WBCS3000L32 battery cycler (Wonatech, Seoul, Korea).
To represent the loss of cyclable lithium, a process similar to Lee et al. [
20] was used to assemble the LIB coin cells. In the design of the half-cell, the cathode is NCM622, and the counter electrode is lithium metal. The NCM622 half-cell performed three formation cycles at 0.1 C in the voltage range of approximately 2.5–4.2 V. The cells were subsequently discharged to the appropriate state of charge at 30, 10, and 0%. The percentage cyclable lithium loss was determined using the capacity of the last formation cycle to discharge the cells. To obtain the cathode with the specified cyclable lithium loss percentage, the NCM622/lithium metal cell was dismantled in an argon-filled glovebox in order to recover the lithium loss electrode. To prevent exposure to air, the cathode was cleaned with dimethyl carbonate and processed in a vacuum chamber. To control the degree of electrolyte depletion, the volume of electrolyte used to assemble the coin cells was 20, 15, and 10 μL. The use of an electrolyte volume higher than 20 μL did not produce any noticeable change in the electrical performance of the LIB coin cell. Therefore, a coin cell with an electrolyte volume greater than or equal to 20 μL is considered immune to electrolyte depletion. The coin cells assembled with an electrolyte volume below 20 μL started to show a decay in the electrical performance of the LIB coin cell, which was expected to be affected by electrolyte depletion. A list of coin cells used in this study to test the combined effects of cyclable lithium loss and electrolyte depletion of LIB cells is given in
Table 1.
4. Results and Discussion
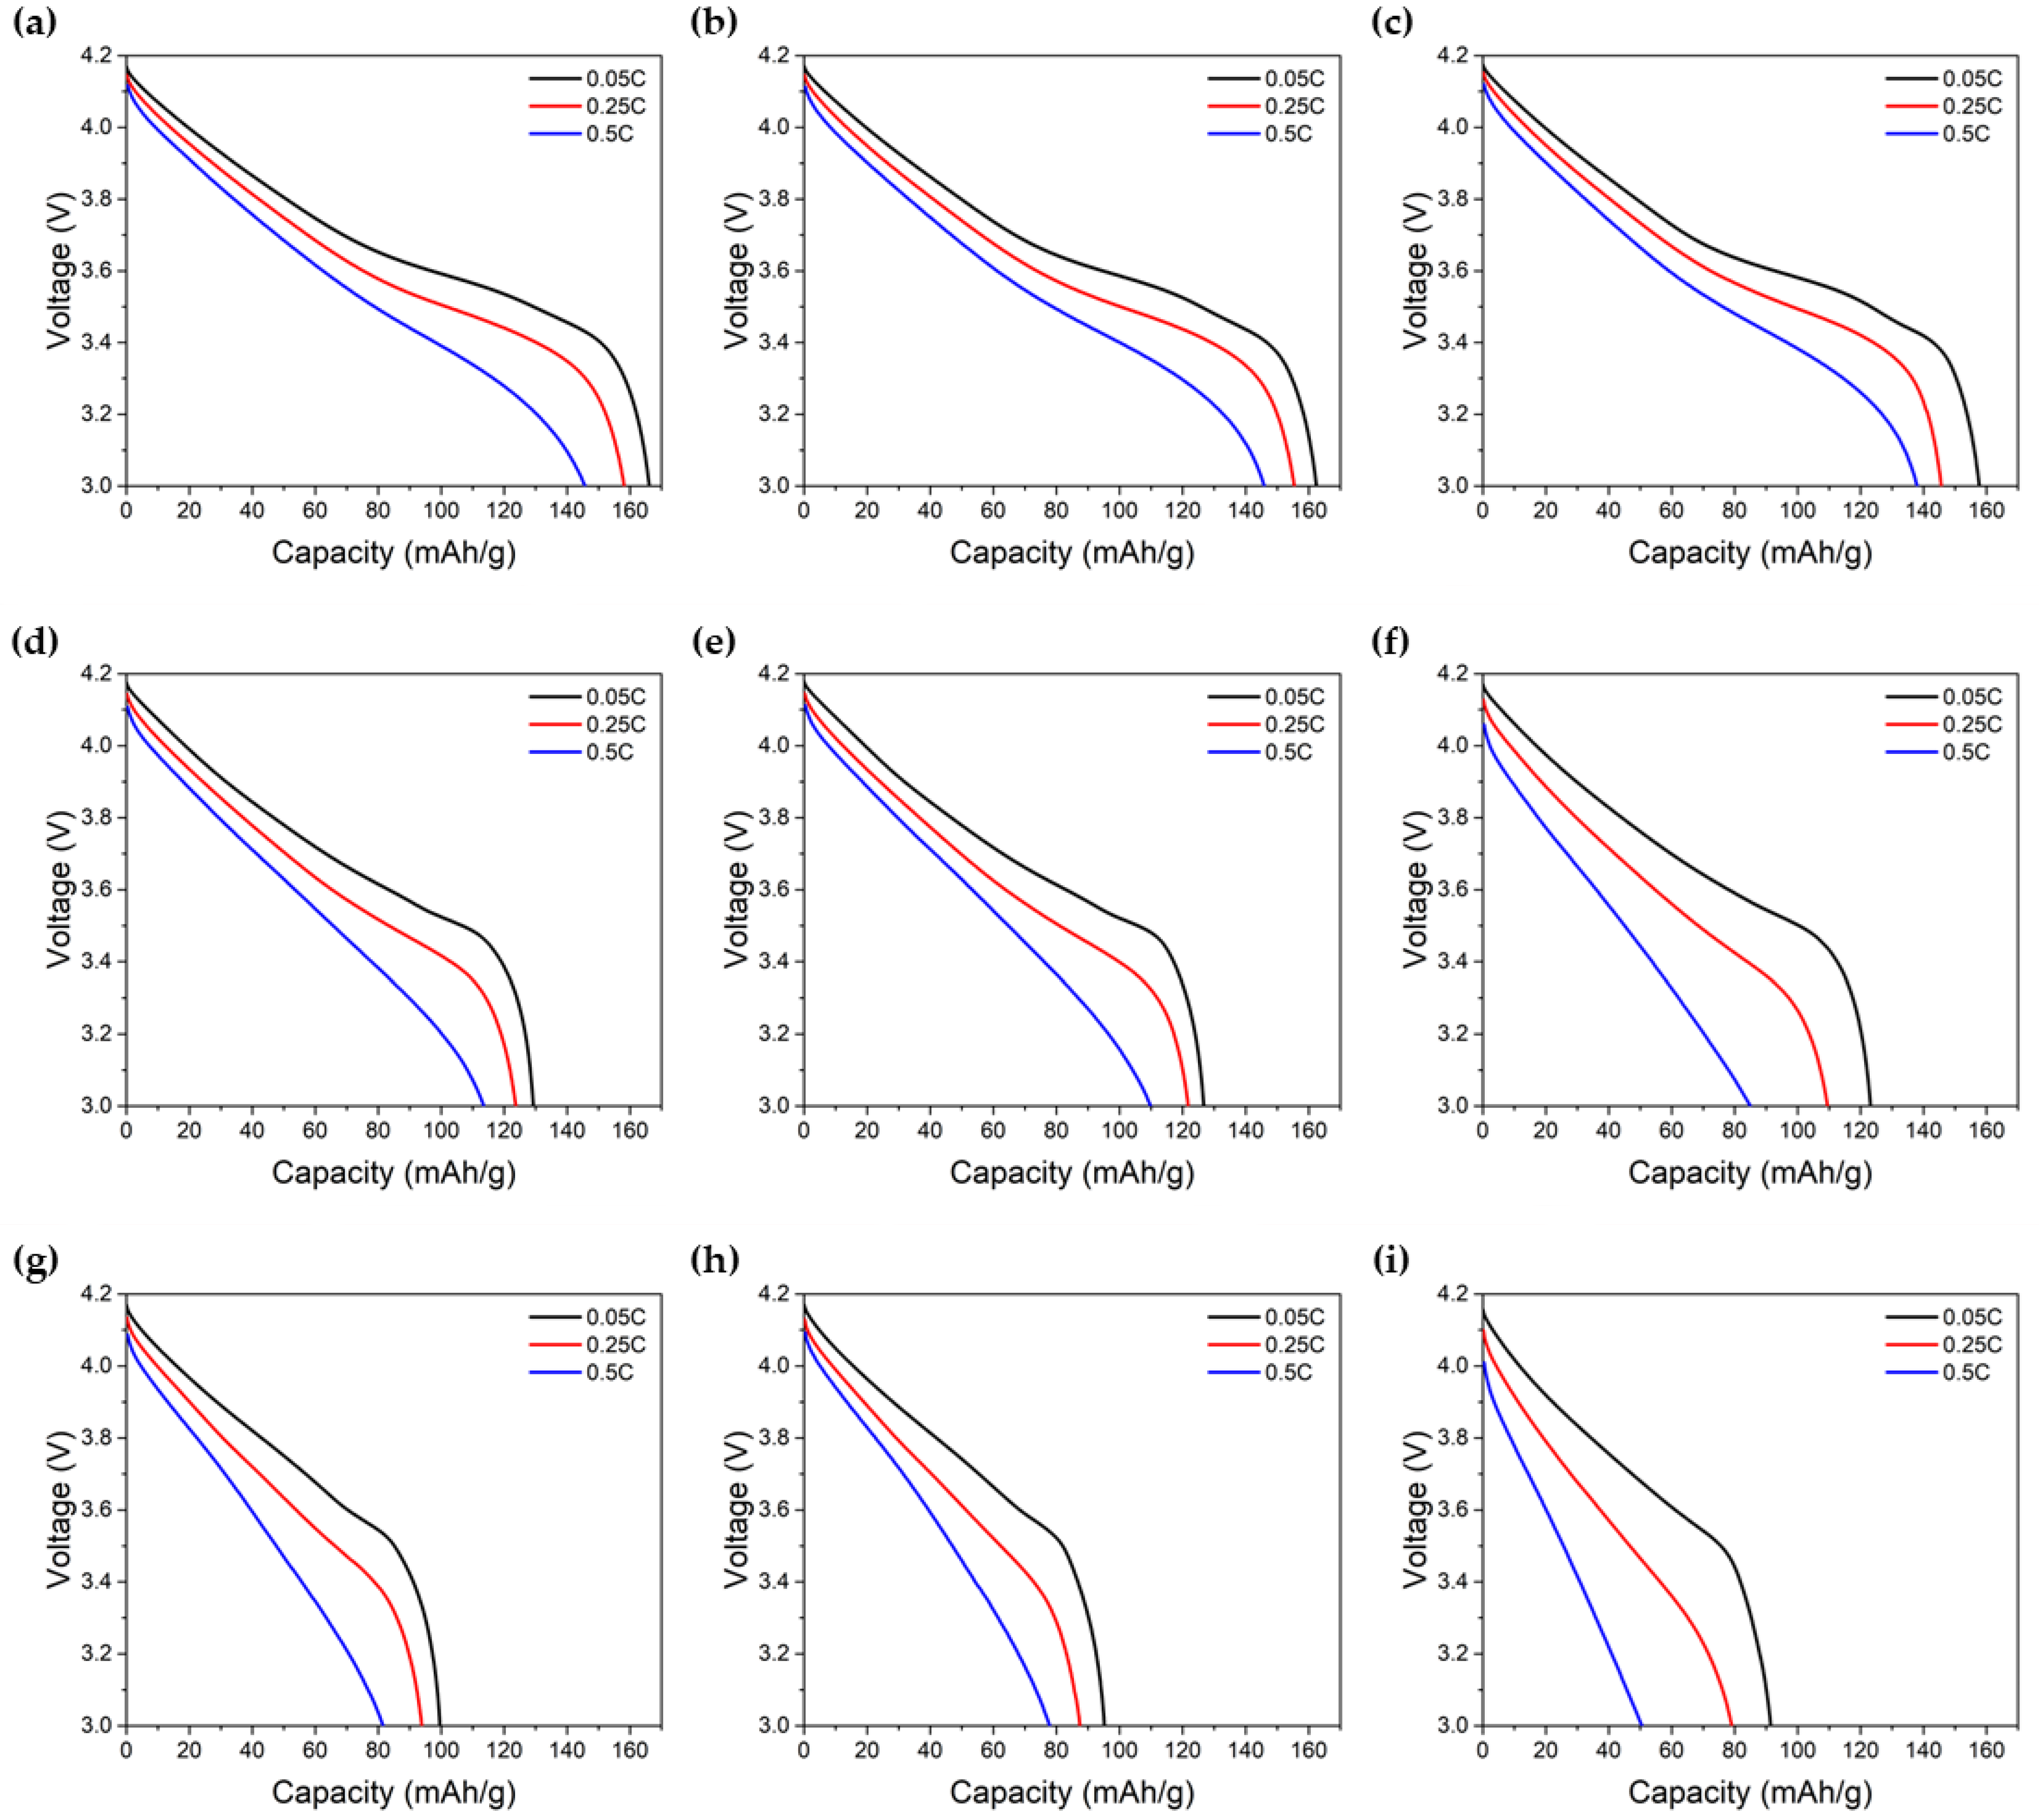
In the discharge experiments to test the combined effects of cyclable lithium loss and electrolyte depletion, currents corresponding to 0.05 C, 0.25 C, and 0.5 C were discharged at 25 °C, and the discharge was terminated when the cell voltage reached 3 V. In
Figure 2a–i, the experimental results of the galvanostatic discharge of the LIB cell for nine different degradation levels are presented and show the effect of cyclable lithium loss and electrolyte depletion on the discharge voltage at various current levels.
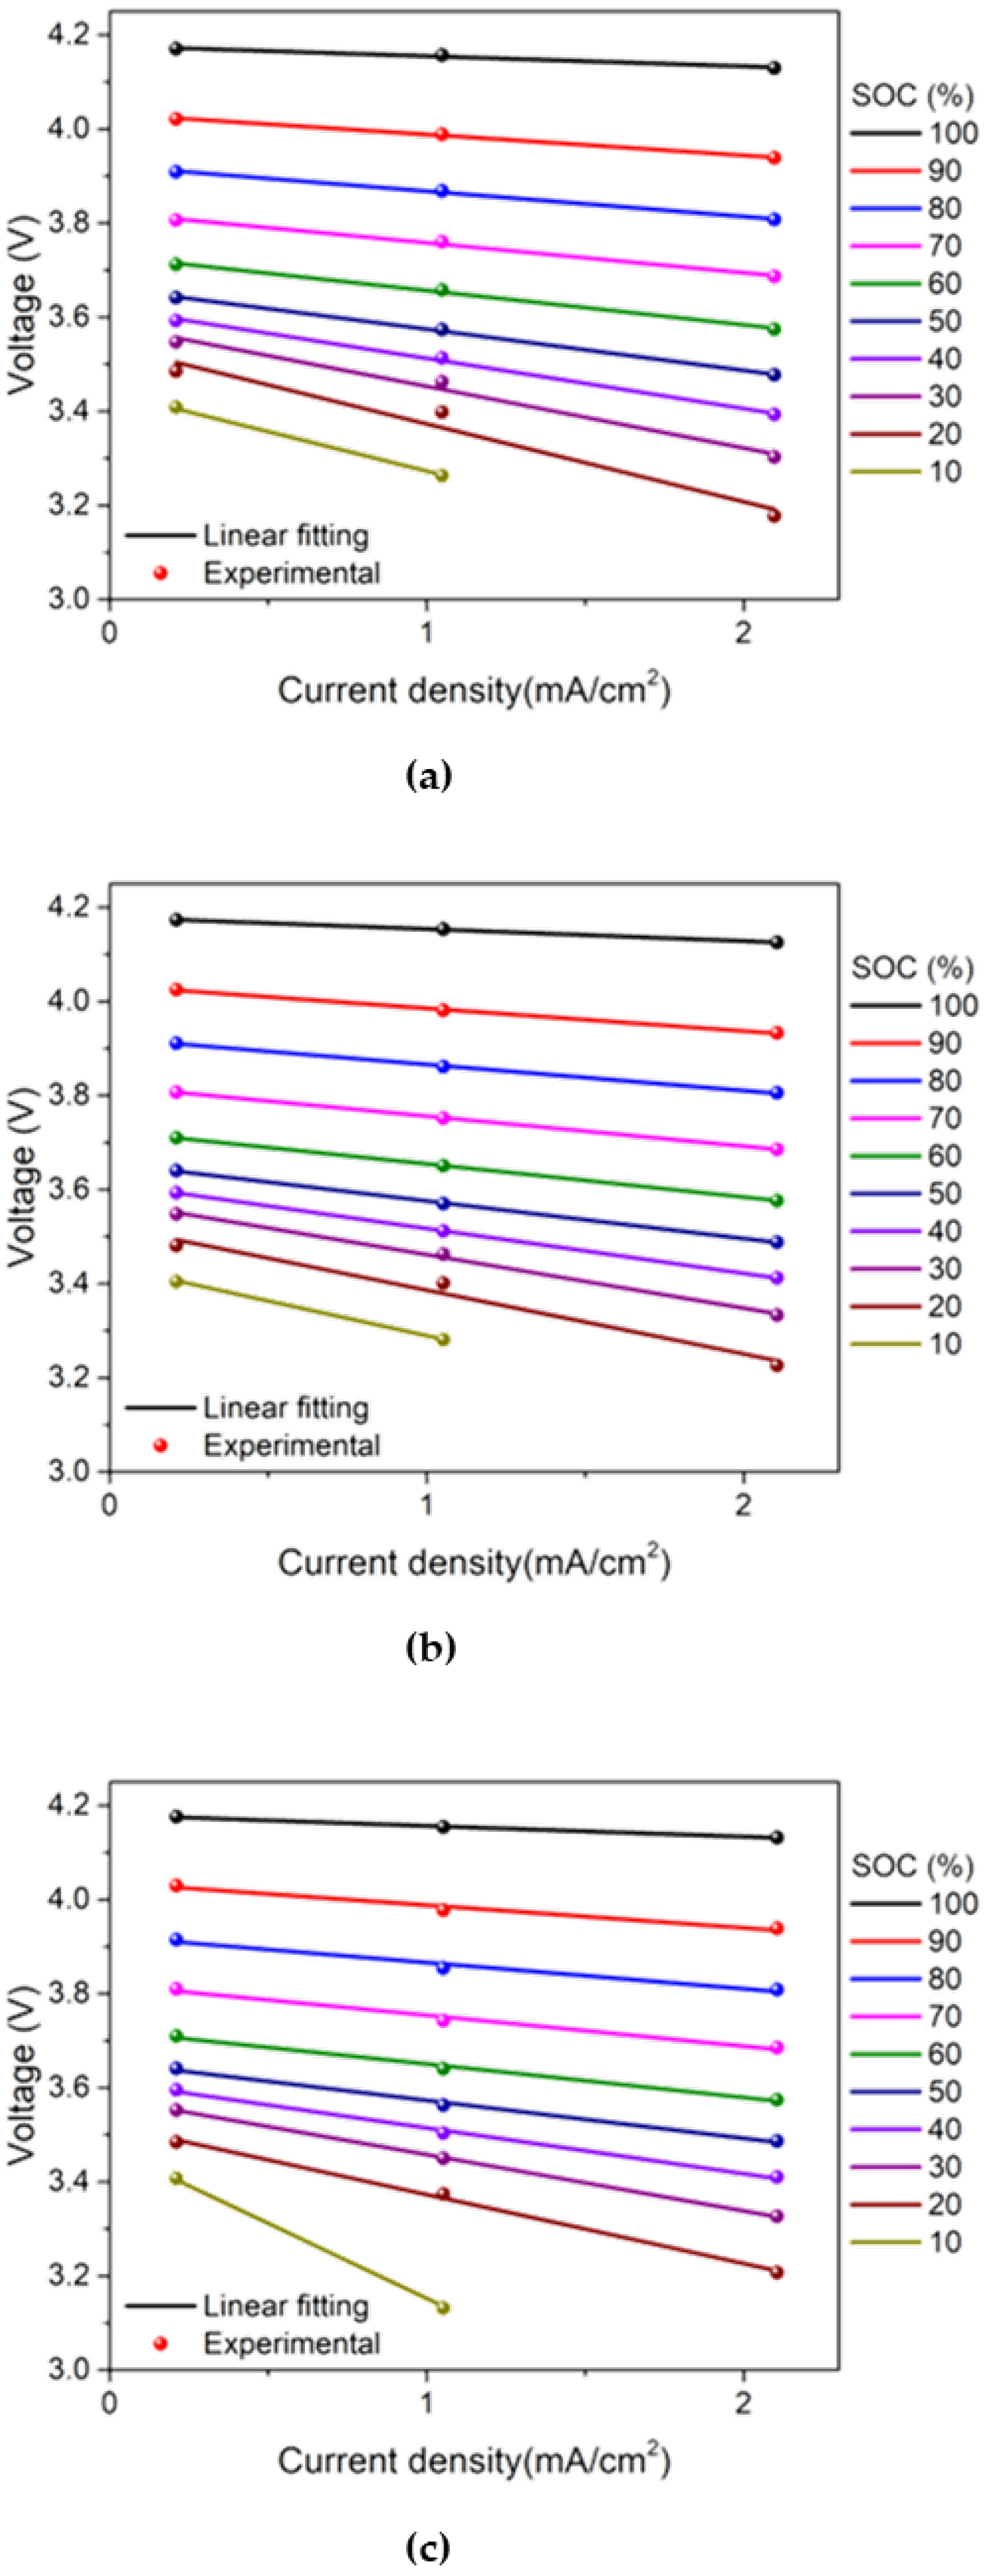
From the test data of cells 1, 2, and 3, the relationship between the discharge-current density and the voltage are shown in
Figure 3a–c, respectively. Graphs corresponding to cells 4–9 were excluded to avoid redundancy. During discharge, the current density and cell voltage can be well-expressed as linear functions in most SOC regions, and the discharge voltage can be effectively expressed at various degradation levels using Equation (7). A linear dependence of the cell voltage on the applied-current density was confirmed for cells 4–9 (not shown here).
To calculate the voltage of the LIB cell based on the cyclable lithium loss and electrolyte depletion,
Y and
U in Equation (7) are obtained as the inverse of the slope and intercept of the vertical axis of linear functional relationships in
Figure 3a–c at the various SOC levels, respectively. Instead of polynomial fitting, a direct value of 0.01 units in the range of SOC from 0 to 1 was used in order to detect accurately subtle changes in
U and
Y due to degradation.
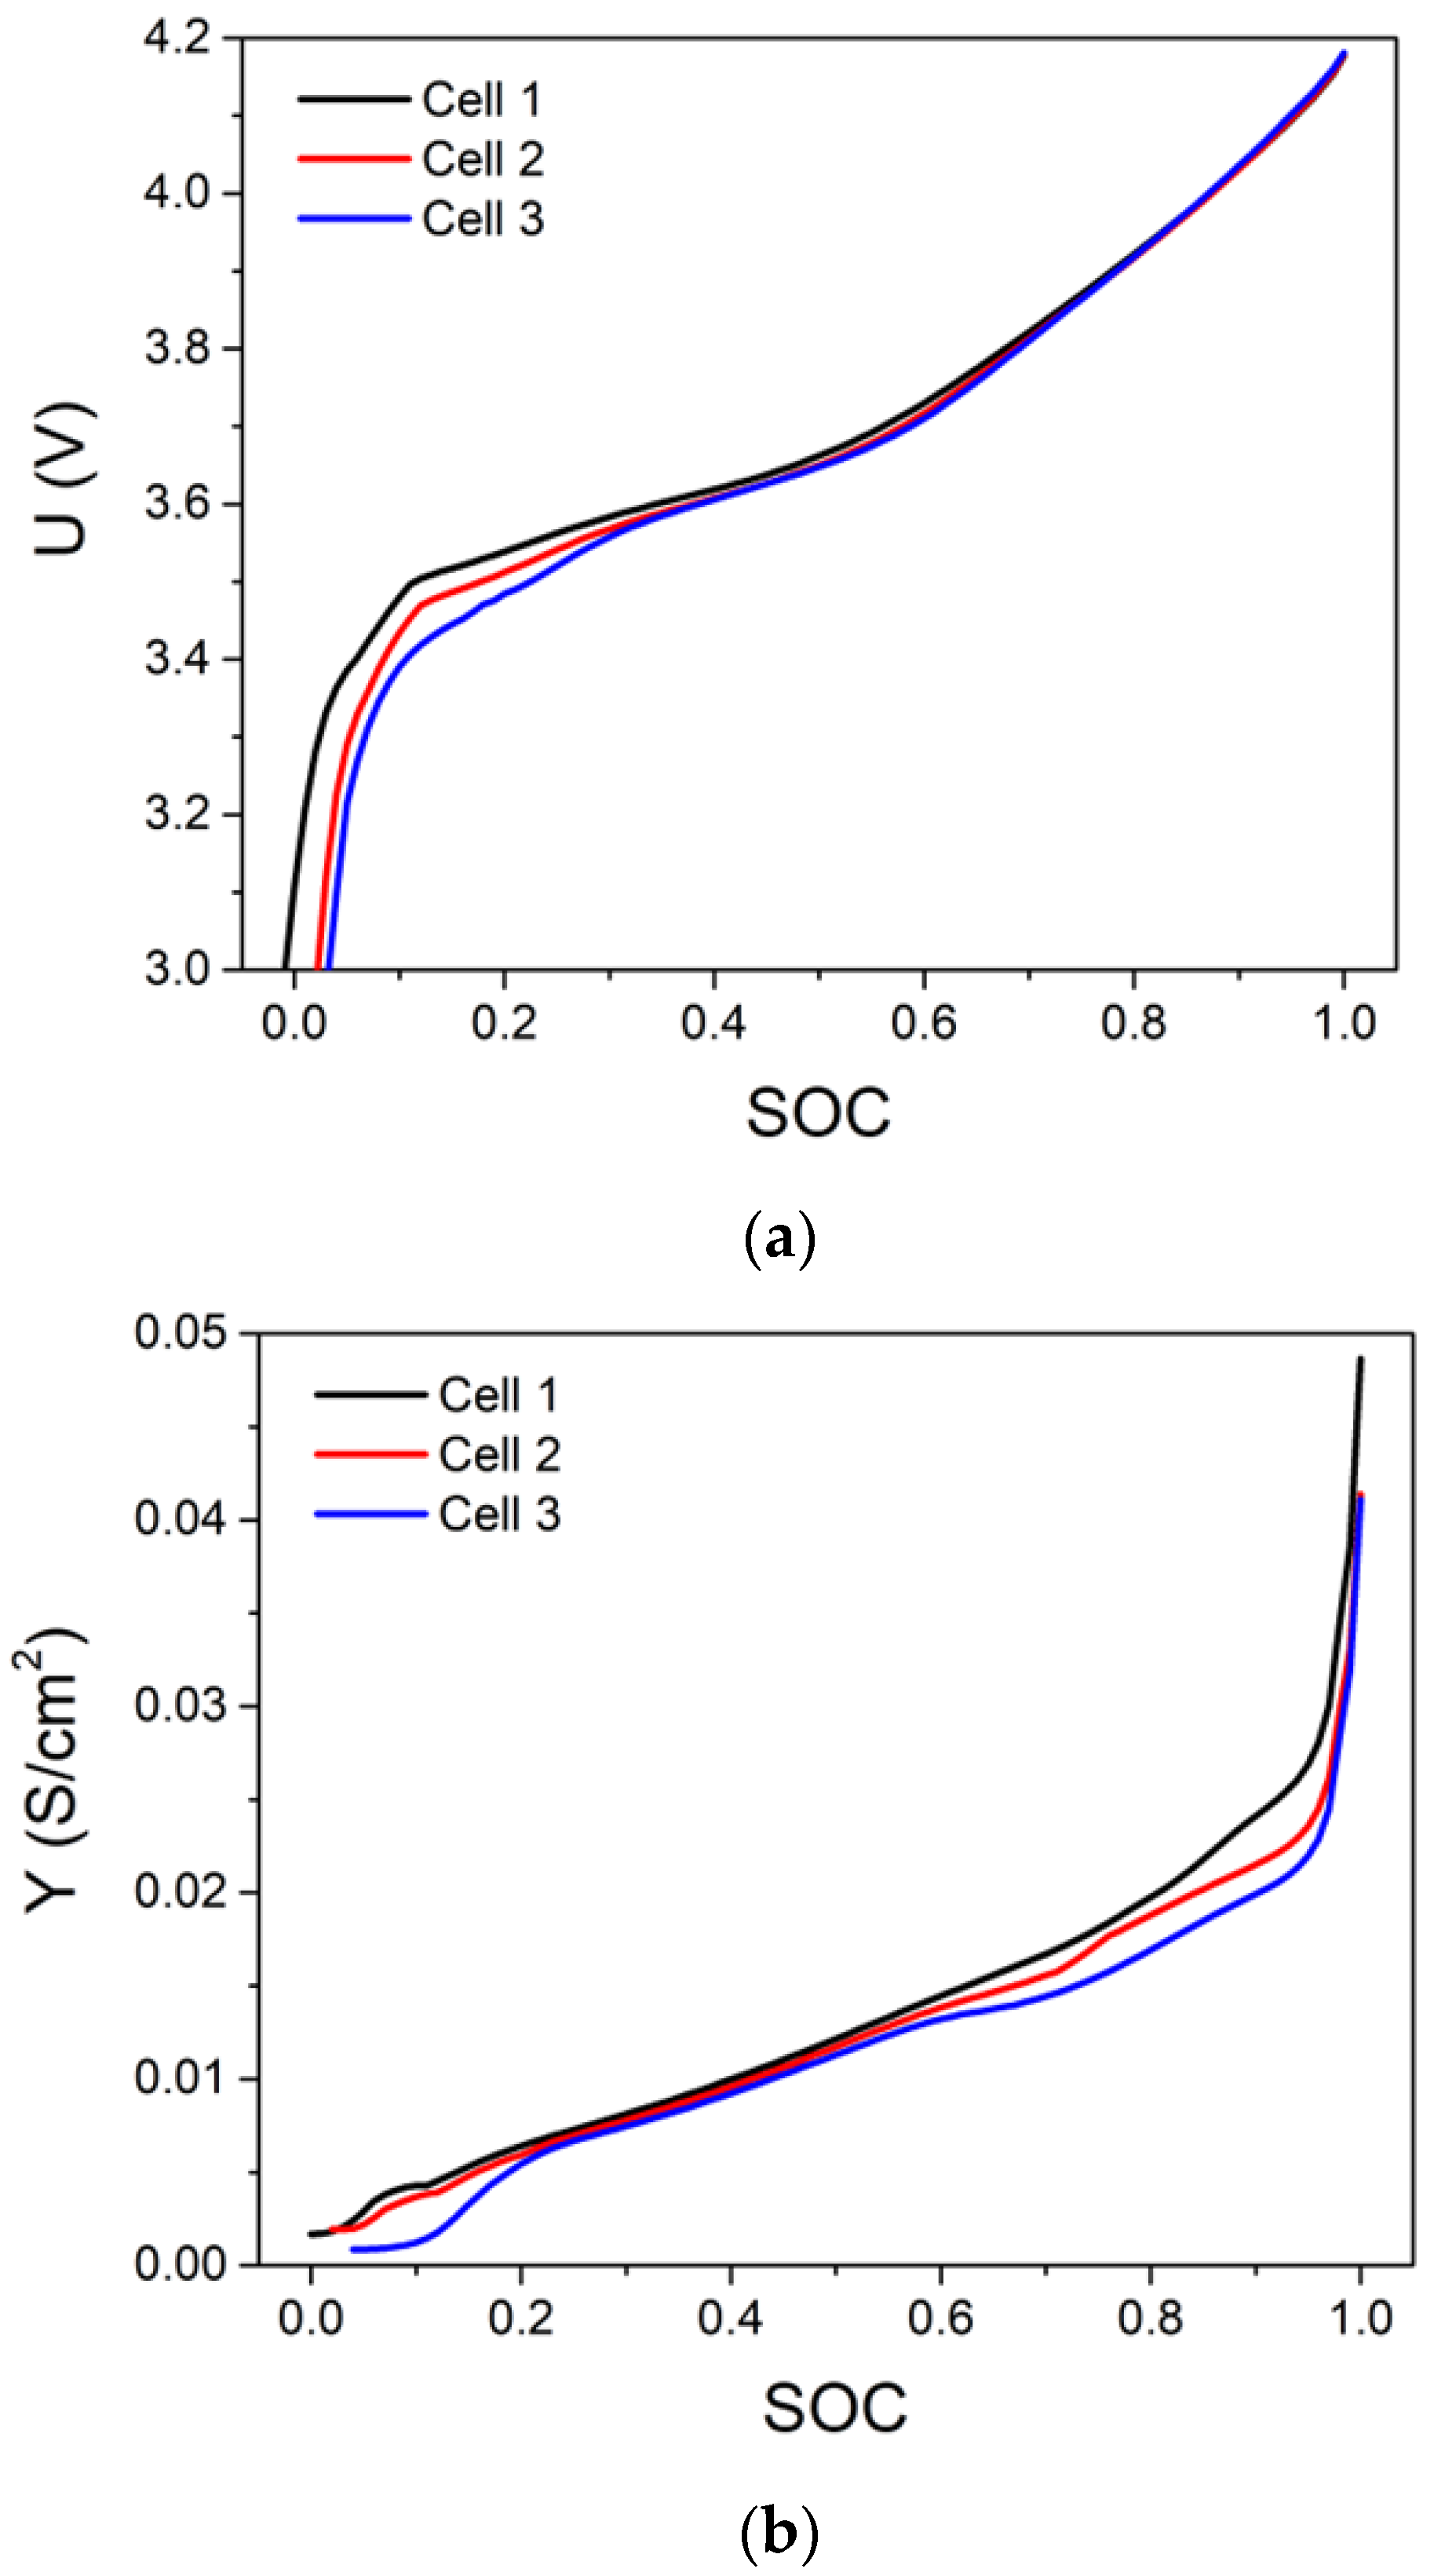
Figure 4a,b depicts the correlation of
U and
Y on SOC for LIB cells with no cyclable lithium loss and three levels of electrolyte depletion.
U represents the equilibrium voltage of the LIB cell, and
Y is similar to the reaction constant of an electrochemical reaction [
27].
U and
Y are critical modeling parameters for calculating the discharge behavior of the degraded LIB in this study. The correlation of
U and
Y on SOC of cells 4–9 were also obtained although they were excluded to avoid redundancy.
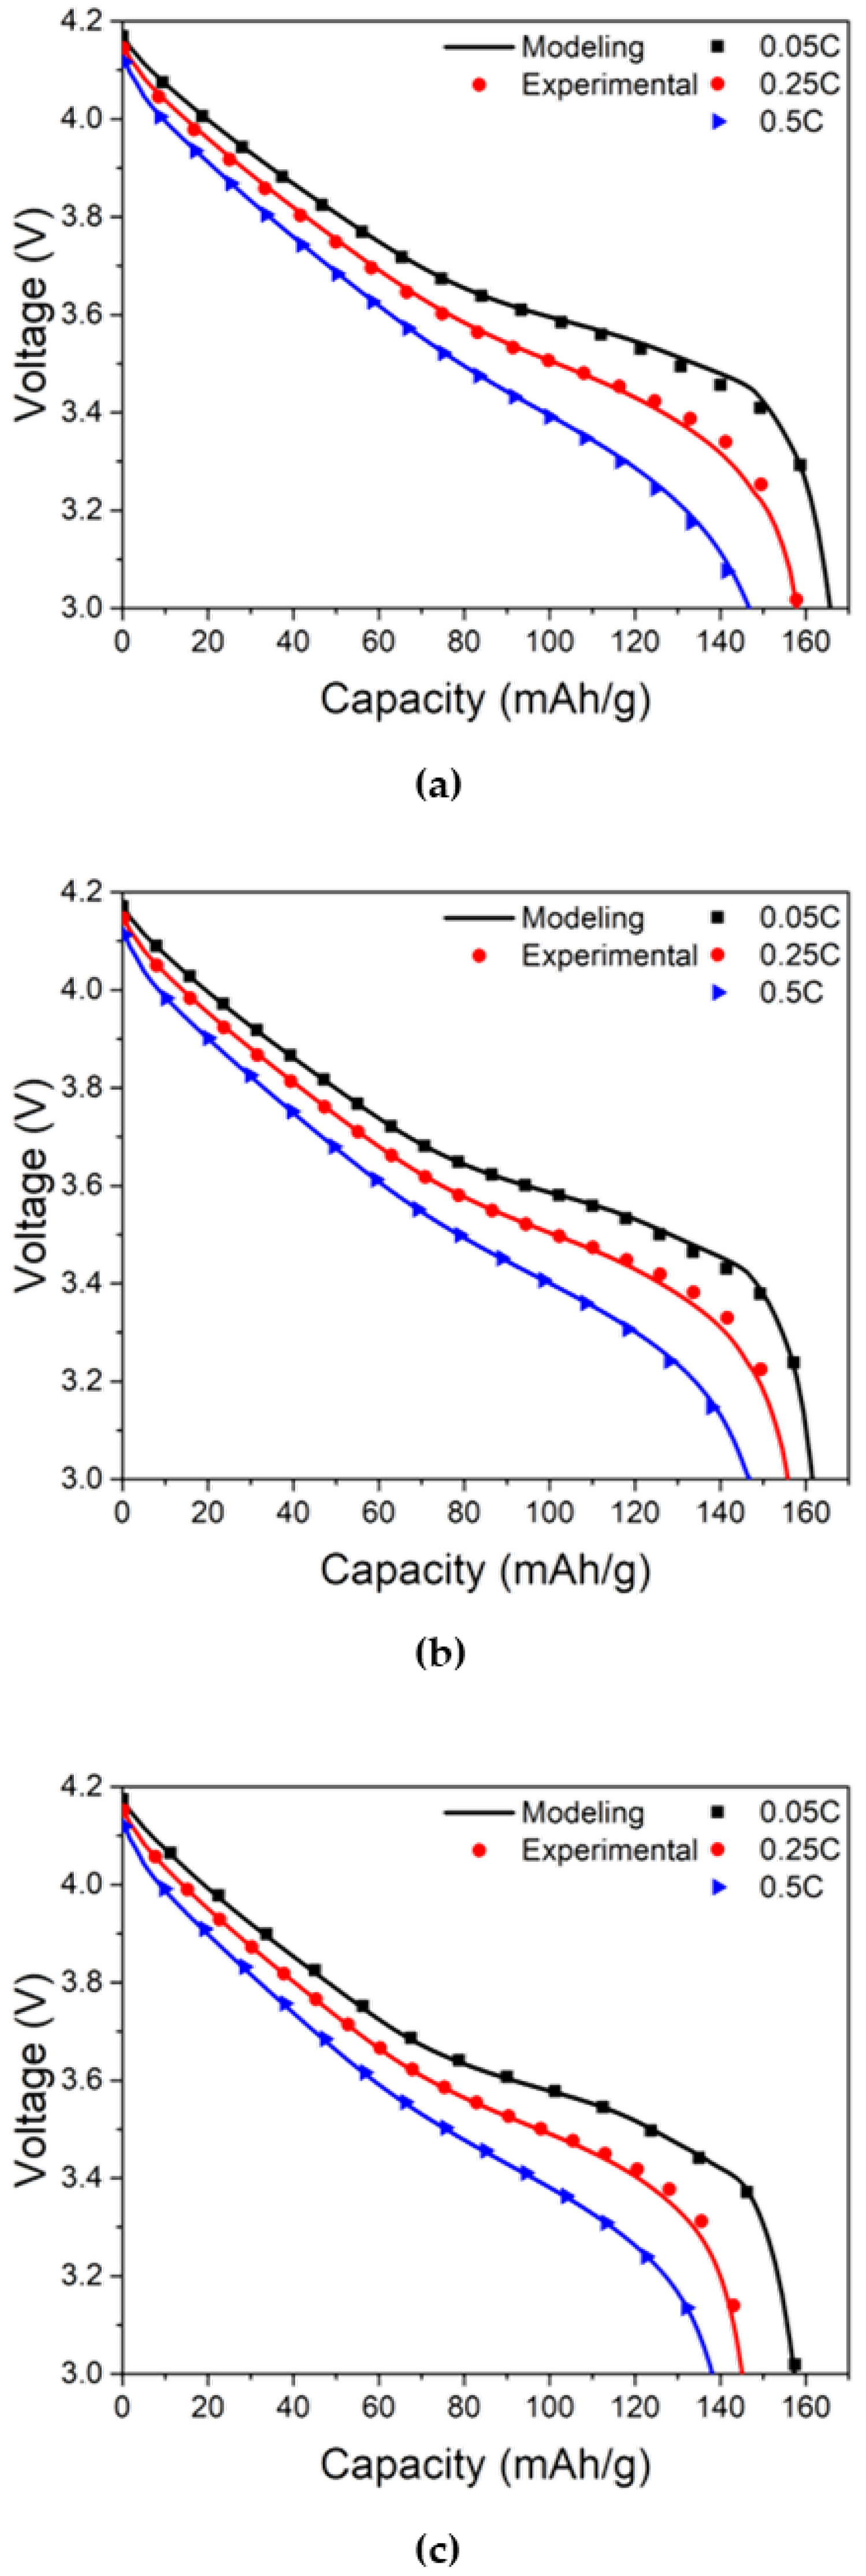
To evaluate the feasibility of the modeling approach, the cell voltage of the LIB cell calculated from the method described above were compared with the experimental measurements acquired with various discharge rates for different levels of LIB cell degradation. Using
U and
Y of nine different degradation levels due to the combined effects of cyclable lithium loss and electrolyte depletion as model parameters, the calculated discharge curves when discharging from 0.05 C to 0.5 C of LIB were compared with the experimental results. In
Figure 5a–c, the discharge experimental results of the LIB cell with no cyclable lithium loss and three different electrolyte depletions show good agreement with the modeling results. The slight deviation between the modeling results and experimental data near the end of discharge may come from the fact that the current density and voltage did not follow a linear relationship owing to a sudden voltage drop in the range of an SOC less than 10%. The validity of the modeling approach for predicting the effect of cyclable lithium loss and electrolyte depletion on the discharge behavior of cells 4–9 was also confirmed although they were excluded to avoid redundancy.
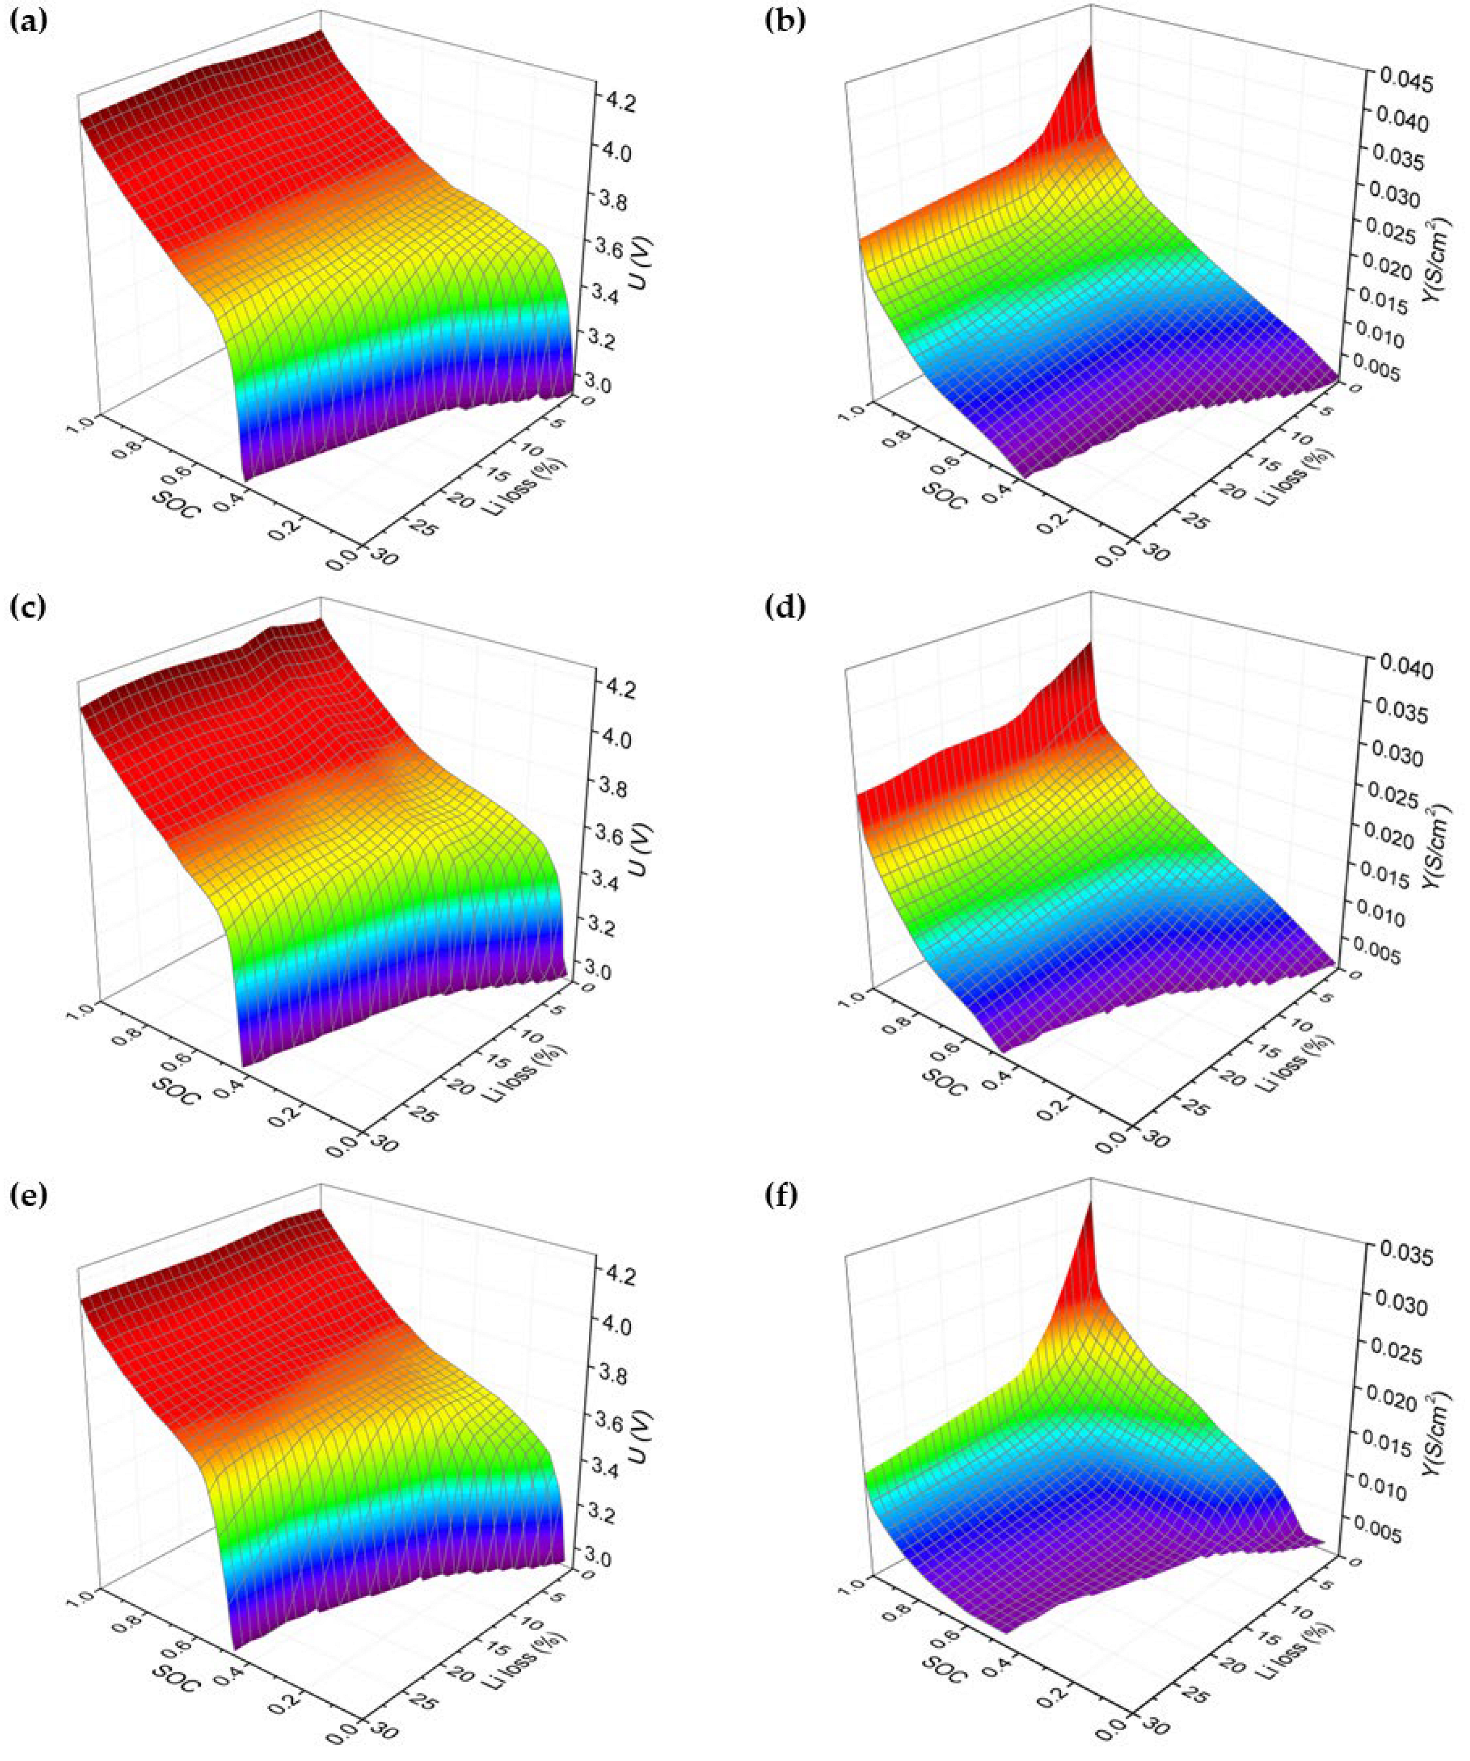
Based on the verified models for nine different levels of cyclable lithium loss and electrolyte depletion, the degradation behavior of the LIB cells was predicted over a broader range. Correlation of
U and
Y on SOC and cyclable lithium loss were calculated to predict the voltage change as the LIB cell deteriorated over a broader range that extends beyond the nine degradation levels presented in
Table 1. For this study, we used the publicly available kriging software, which is widely used in geostatistics [
31]. Based on regression, the kriging method generates the unknown values of the functions, which have multiple parameters through an appropriate interpolation and extrapolation from the measured data. The
U and
Y values with respect to SOC for nine different levels of cyclable lithium loss and electrolyte depletion in
Table 1 were entered into kriging software as input data to obtain
U and
Y values in a broader range of cyclable lithium loss.
Figure 6a–f presents these outcomes as 3D graphs of
U and
Y with respect to the SOC and cyclable lithium loss.
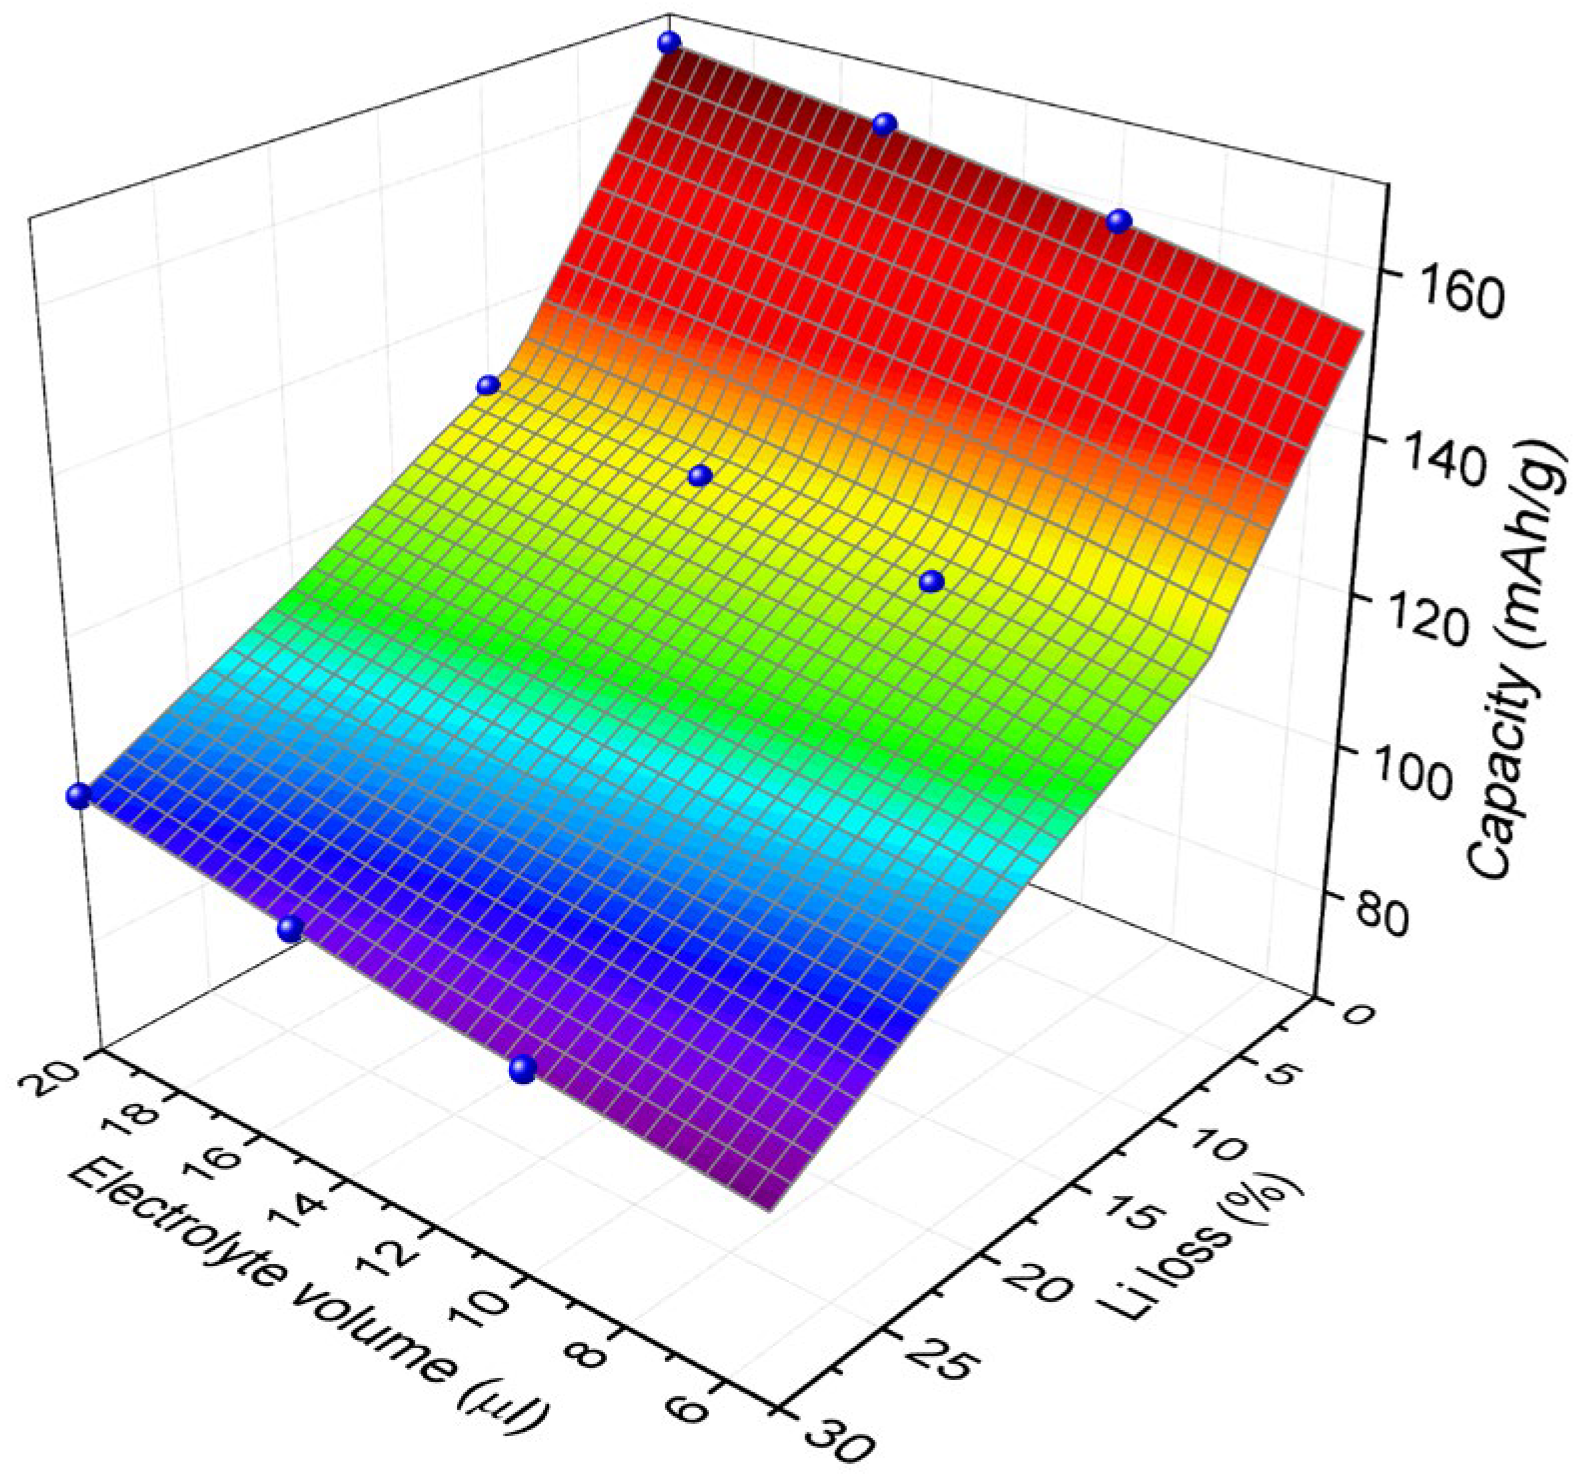
The discharge capacity of the LIB cell was estimated by using
U and
Y calculated for cyclable lithium losses ranging from 0 to 30% and an electrolyte volume ranging from 5 to 20 μL. The capacity at the discharge rate of 0.05 C was calculated by using the above-mentioned model and the parameters of
U and
Y, and it was compared with the experimental results in
Figure 7. The 0.05 C discharge capacity is 166 mAh/g with no cyclable lithium loss and no electrolyte depletion. When there is no cyclable lithium loss, the 50% of electrolyte depletion brings about 5% reduction. On the other hand, the cyclable lithium loss of 30% coupled with 50% of electrolyte depletion results in 46% reduction. As the amount of cyclable lithium loss and electrolyte depletion increases, the decrease in capacity becomes more pronounced.
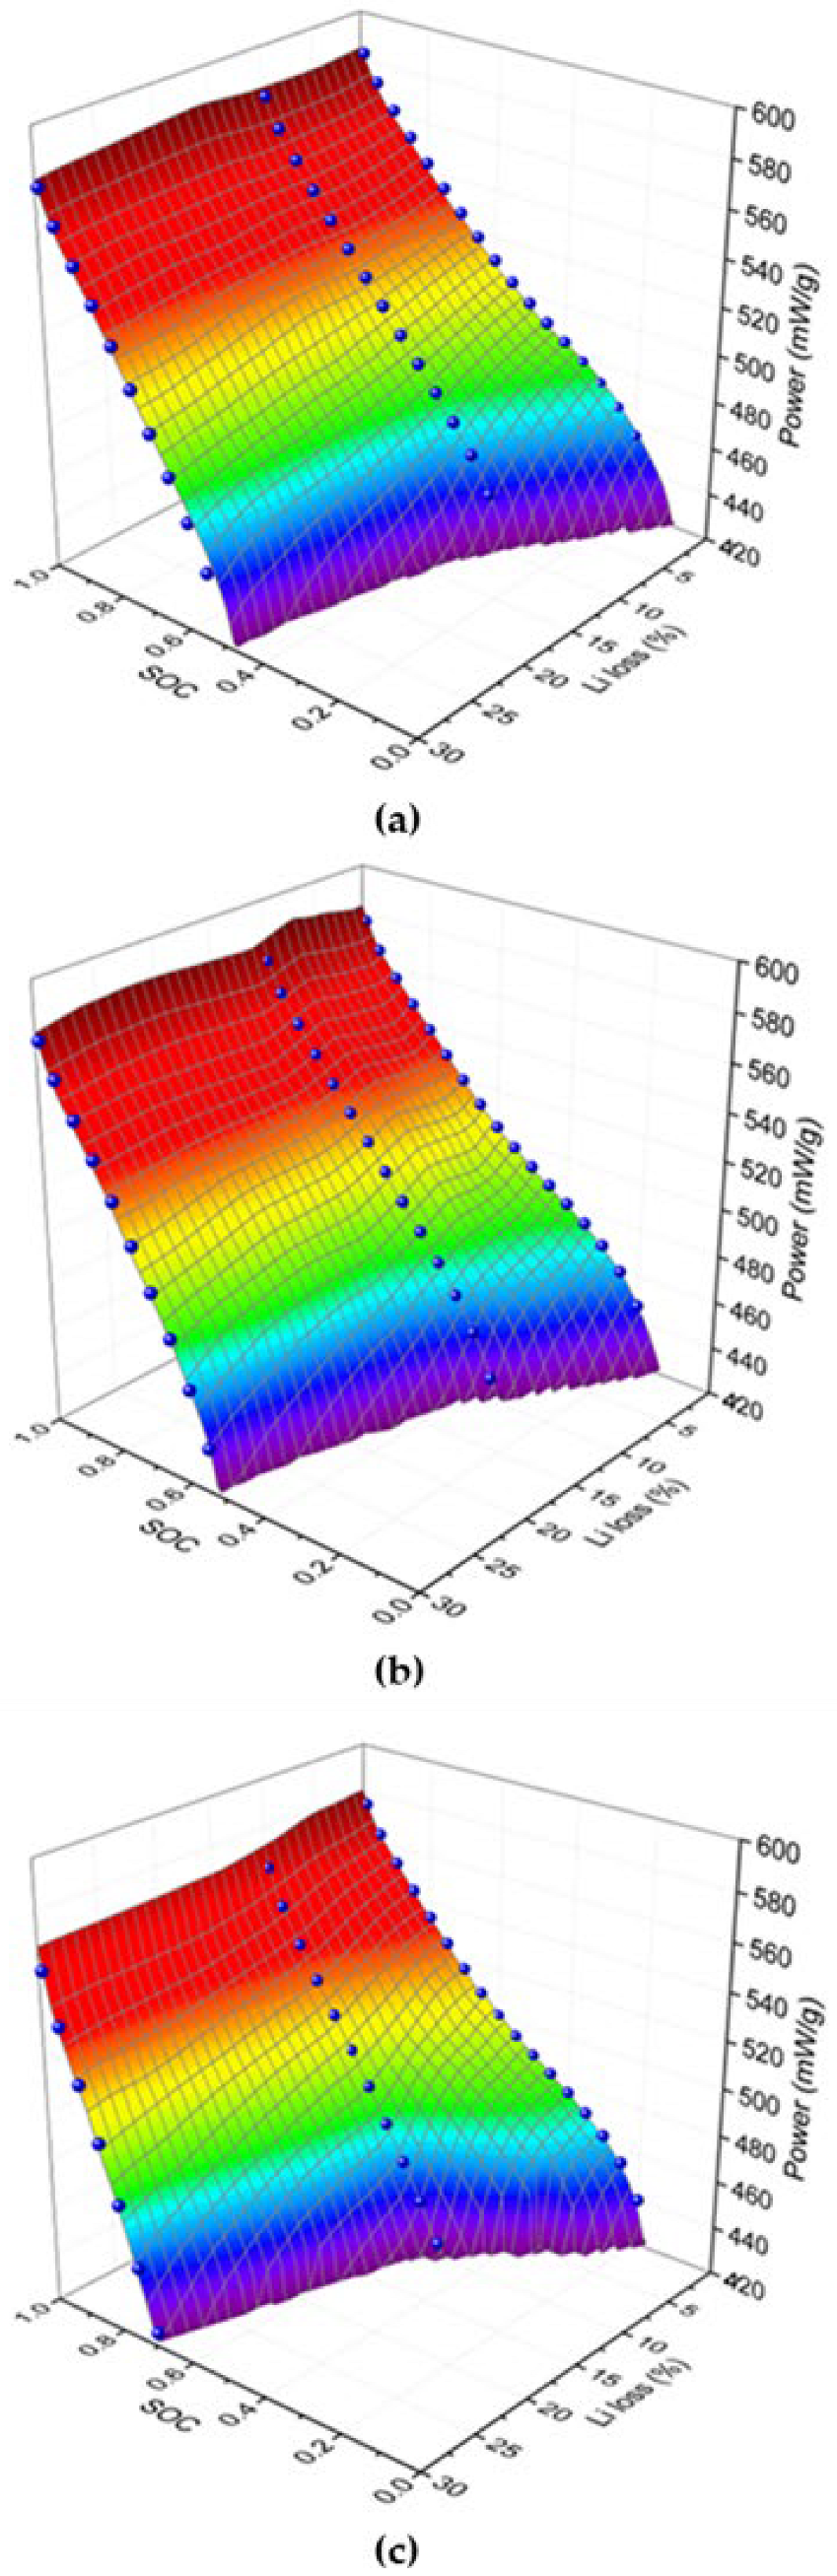
Power fade is one of the most important factors that contribute to the degradation of LIB cell performance as a result of various degradation mechanisms. In particular, when a LIB cell with a high degree of degradation is discharged with a high current, the available discharge power is significantly lowered.
Figure 8a–c shows the results of calculating the discharge power with respect to SOC and cyclable lithium loss for electrolyte volumes of 20, 15, and 10 μL at a discharge rate of 0.5 C. Because the voltage drops as the SOC reduces during discharge, the discharge power drops as the SOC reduces for a given electrolyte volume.
Figure 8a illustrate the influence of the cyclable lithium loss on the discharge power because the use of an electrolyte volume higher than 20 μL did not produce any noticeable change in the electrical performance of the LIB coin cell as mentioned in
Section 3. The 0.5 C discharge power at the SOC level of 0.8 is 541 mW/g, with no cyclable lithium loss and no electrolyte depletion. When there is no cyclable lithium loss, the 50% of electrolyte depletion brings about 1% reduction in discharge power during 0.5 C discharge at the SOC level of 0.8.
Figure 8b,c shows that the impact of the cyclable lithium loss on the discharge power becomes much stronger than that at 20 μL, as the electrolyte volume drops up to 10 μL. When the cyclable lithium loss is 30%, the 50% of electrolyte depletion results in 13% reduction in discharge power during 0.5 C discharge at the SOC level of 0.8.
Aging mechanisms, including cyclable lithium loss, electrolyte depletion, dissolution of active materials, disordering of the electrode structure, and loss of electrical contact, occur in a complex way as a result of many causes. These factors affecting the aging of LIBs are concurrently responsible for the capacity and power fades. Analyzing the cause and effect of LIB aging requires isolating the contribution of separate processes and integrating the different processes in a controlled manner to determine the overall performance degradation of the LIB cells. No other processes besides cyclable lithium loss and electrolyte depletion were included in this study; however, the modeling approach developed here can be an important steppingstone in constructing a powerful modeling tool that incorporates the combined impact of many individual processes that contributes to LIB aging.


 ,
, 


