
Peak Shaving Methods of Distributed Generation Clusters Using Dynamic Evaluation and Self-Renewal Mechanism


Abstract
:1. Introduction
2. Peak Shaving Priority Sequencing of Distributed Generations
2.1. Multi-Index Evaluation for Peak Shaving Performance
- a.
- Based on the max operational ratings , the limits of output power :
- b.
- The min/max current and voltage limits within the power system in the cycle :
- c.
- The limit of max power conversion of DG , :
2.2. Priority Sequencing by Objective and Subjective Synthetic Approach and TOPSIS
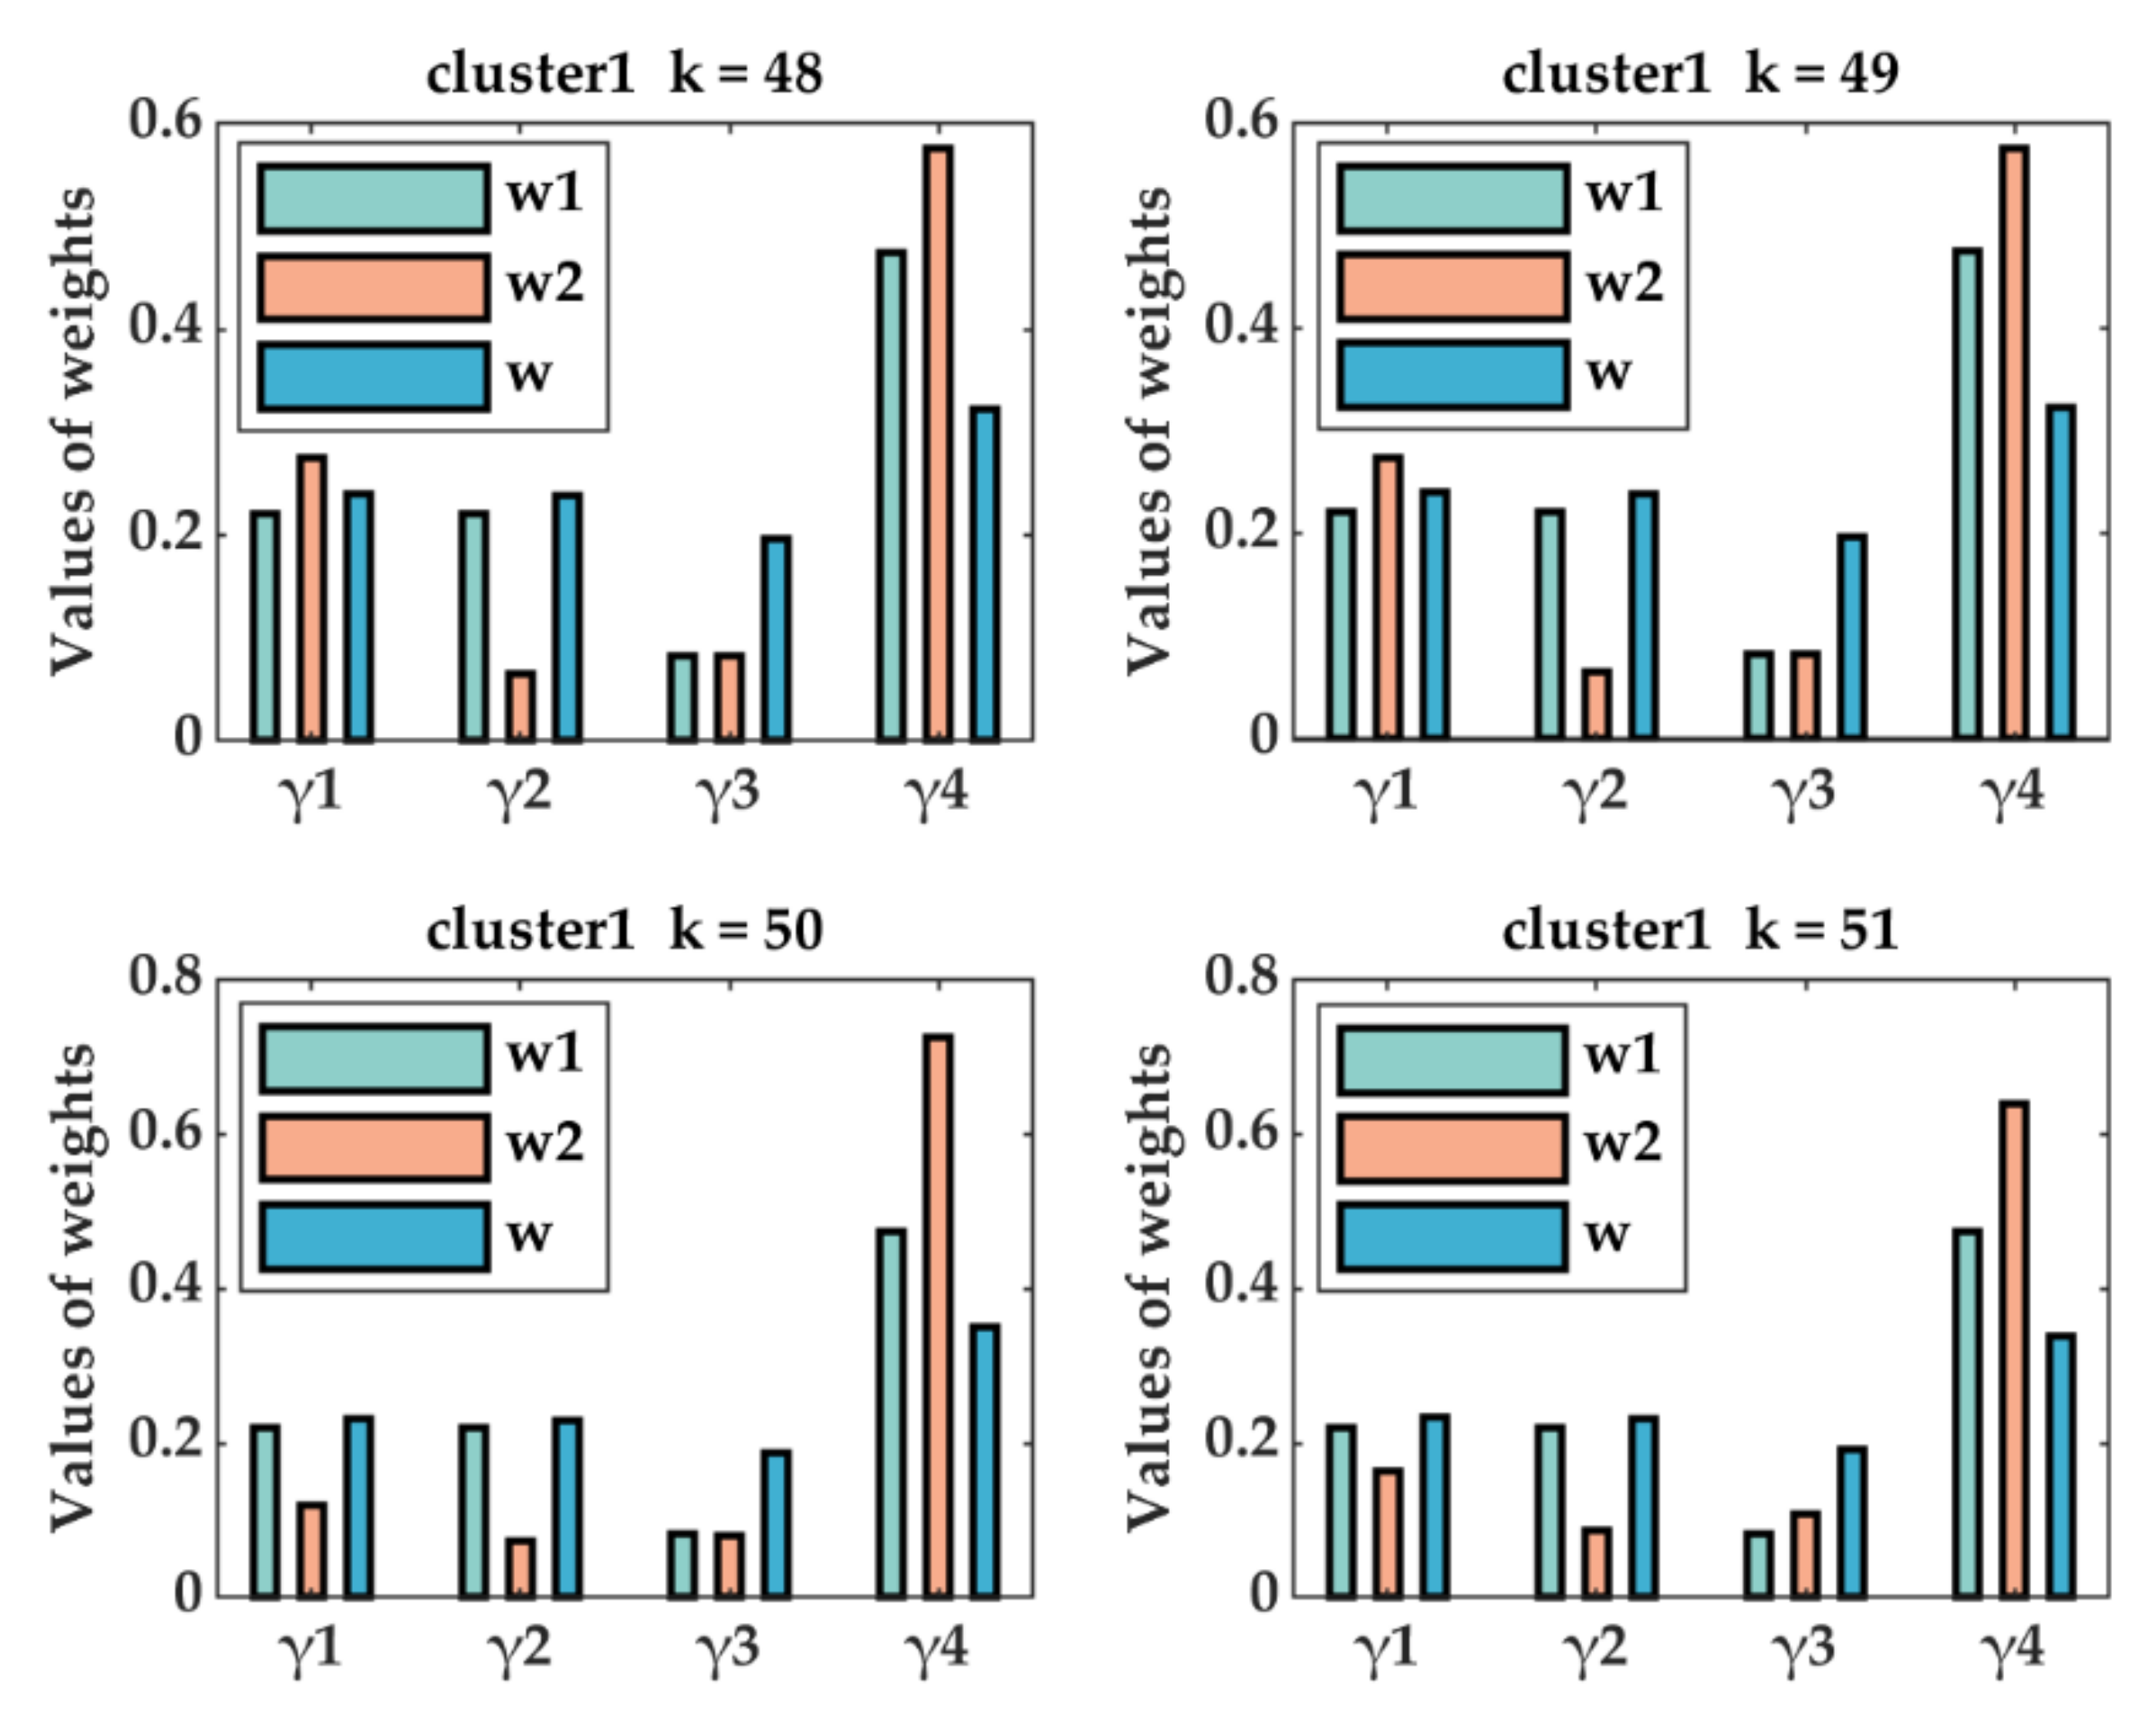
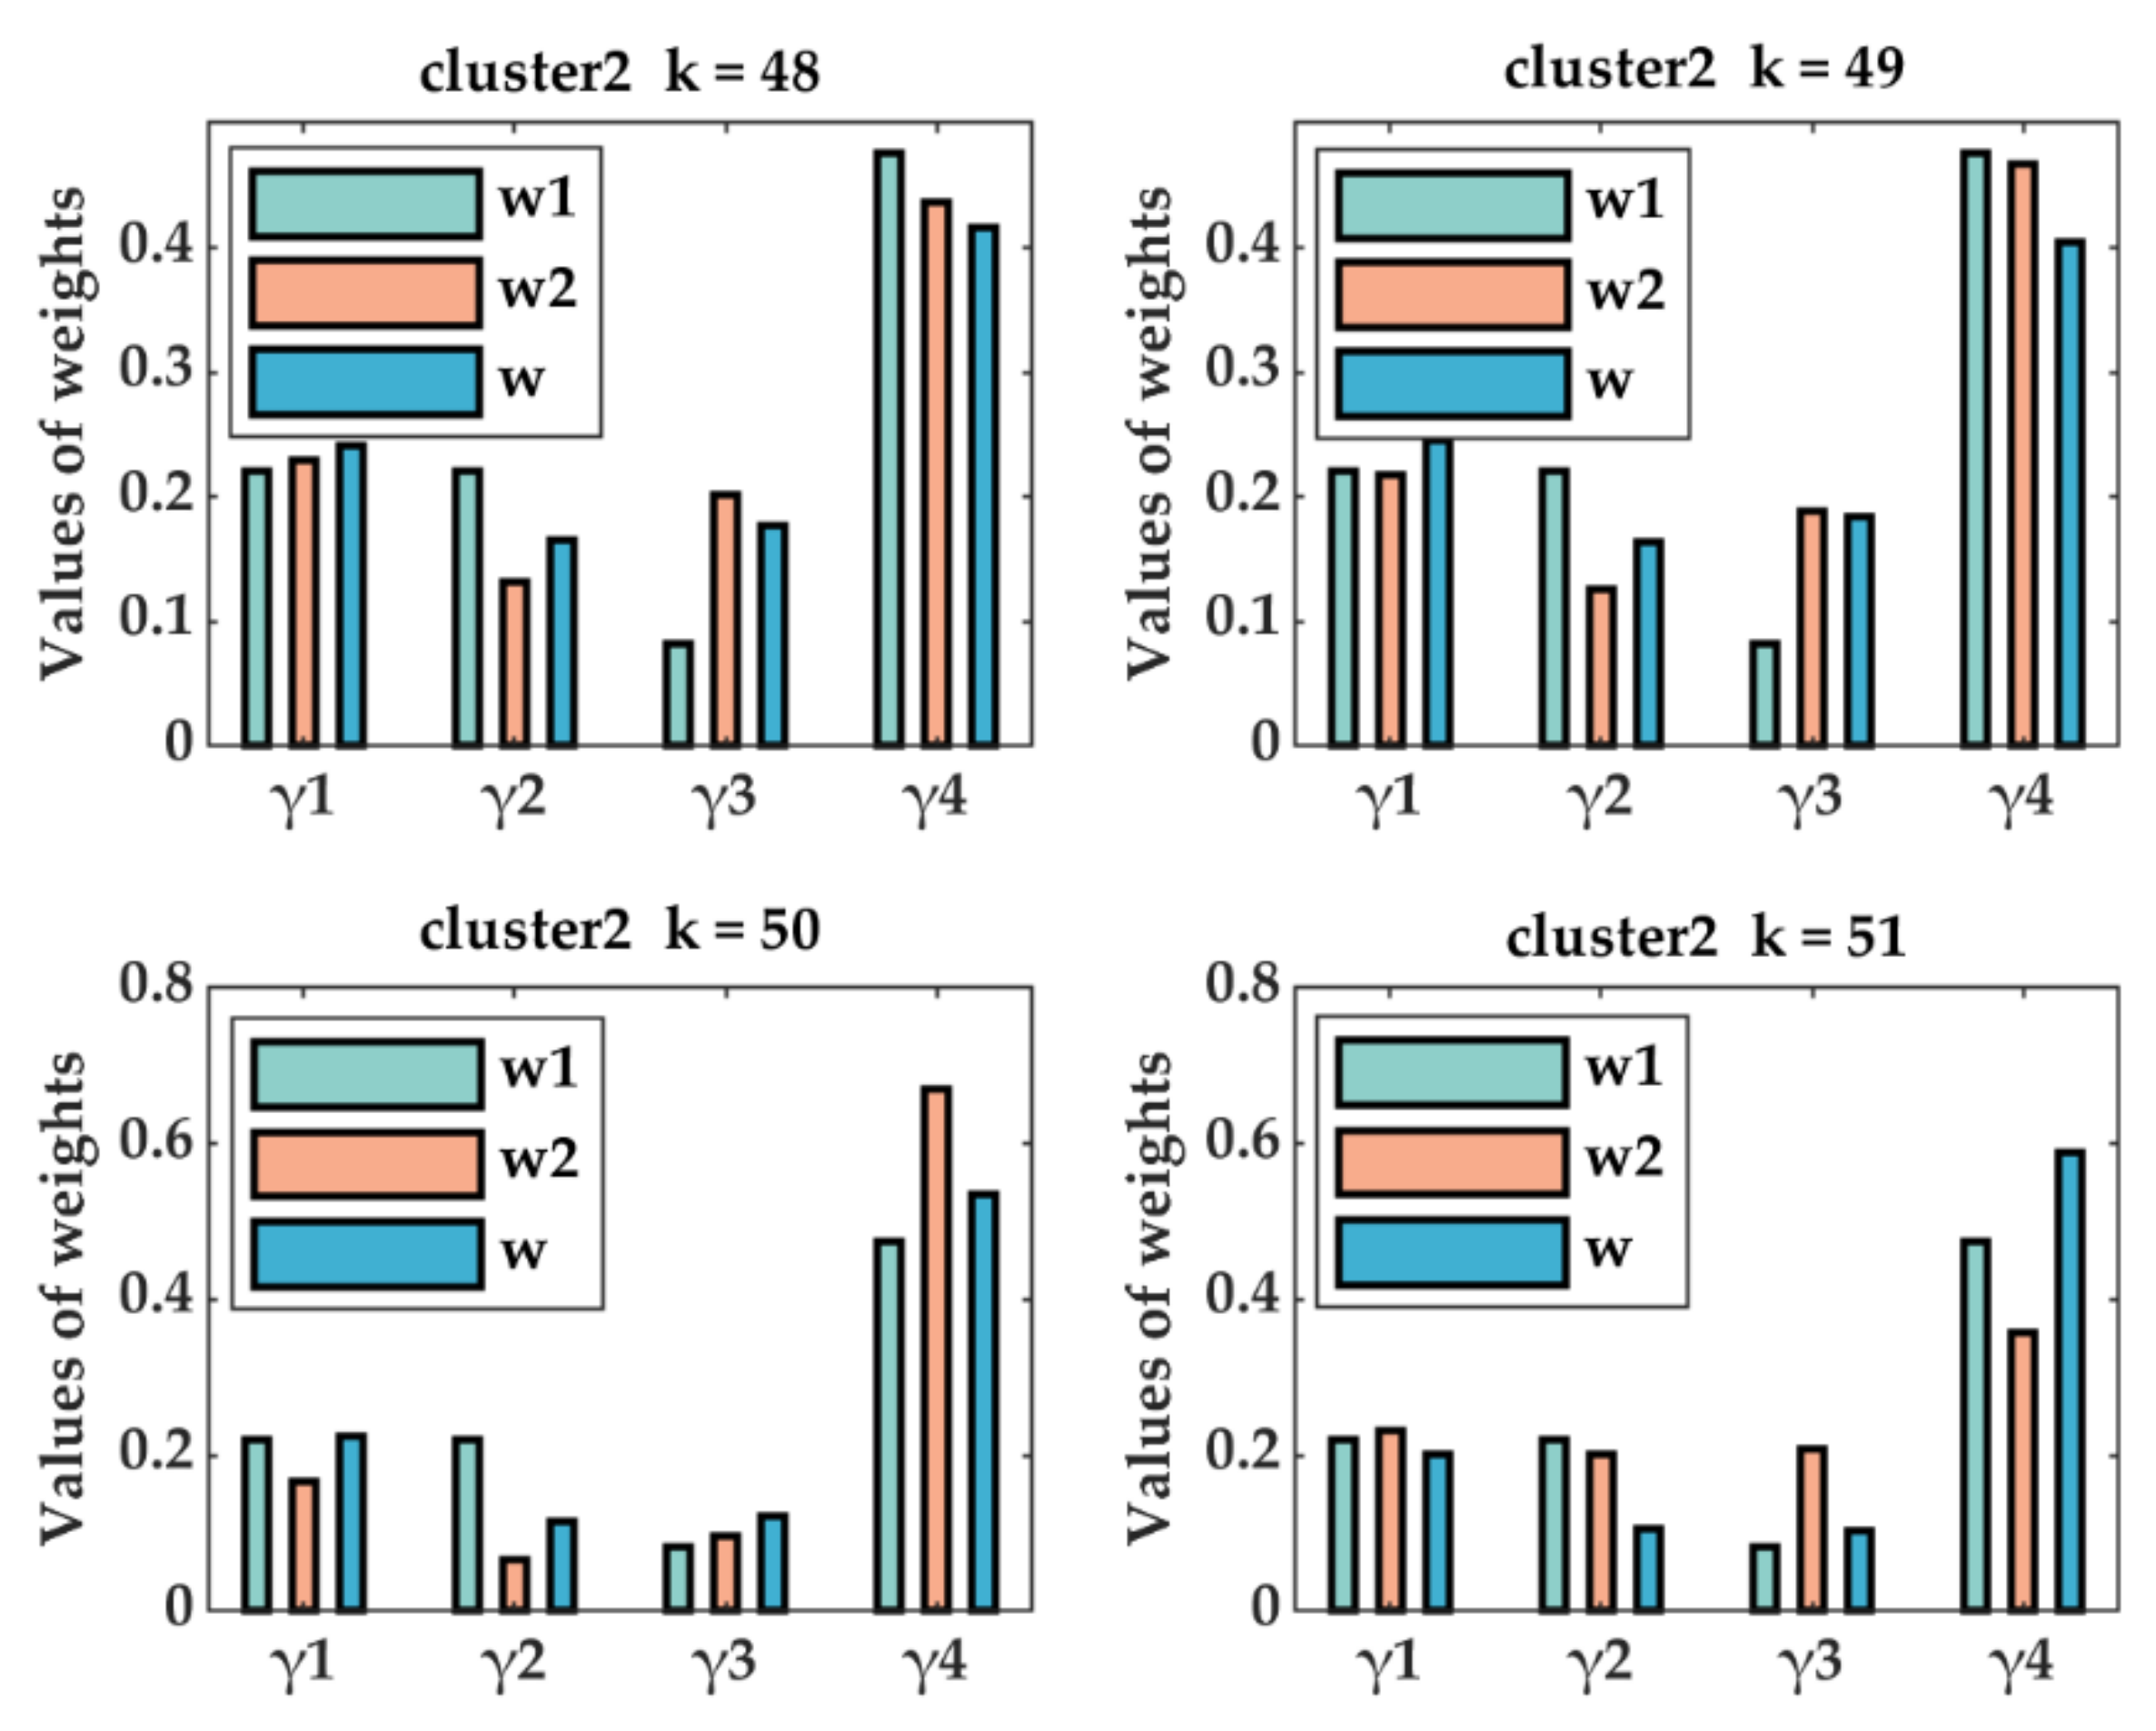
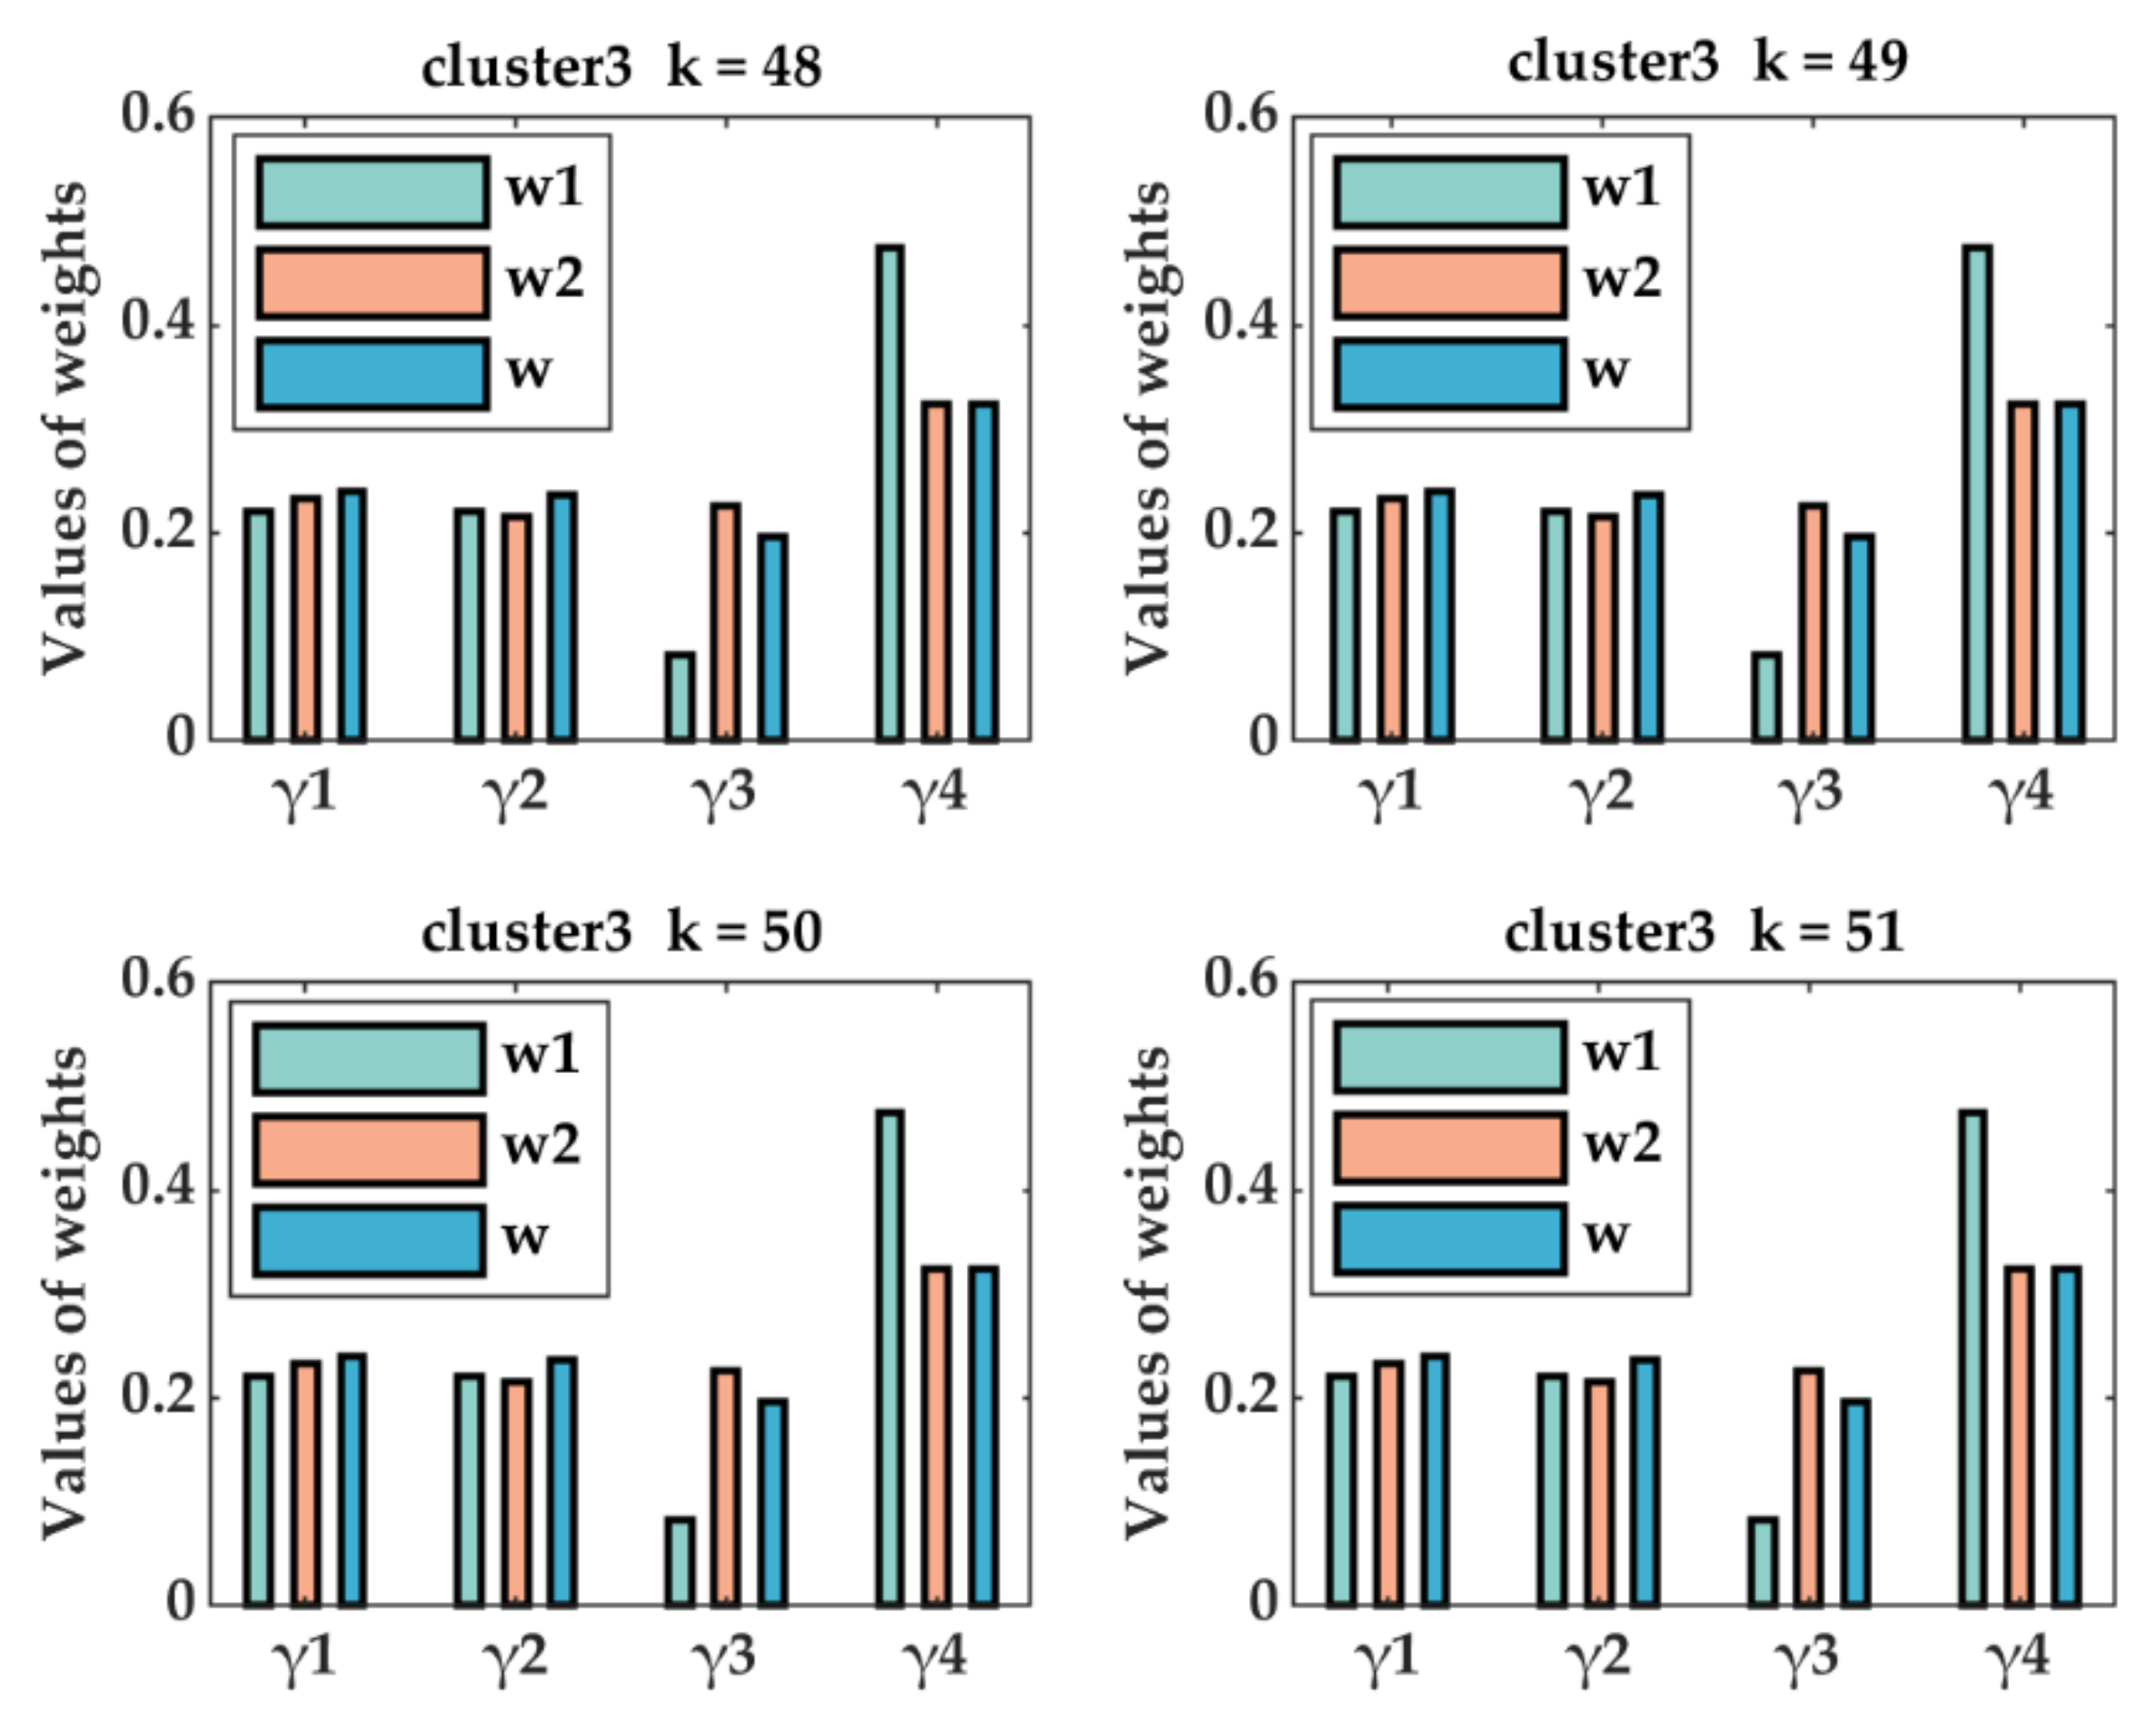
2.2.1. Combination Weighting of Multidimensional Indexes
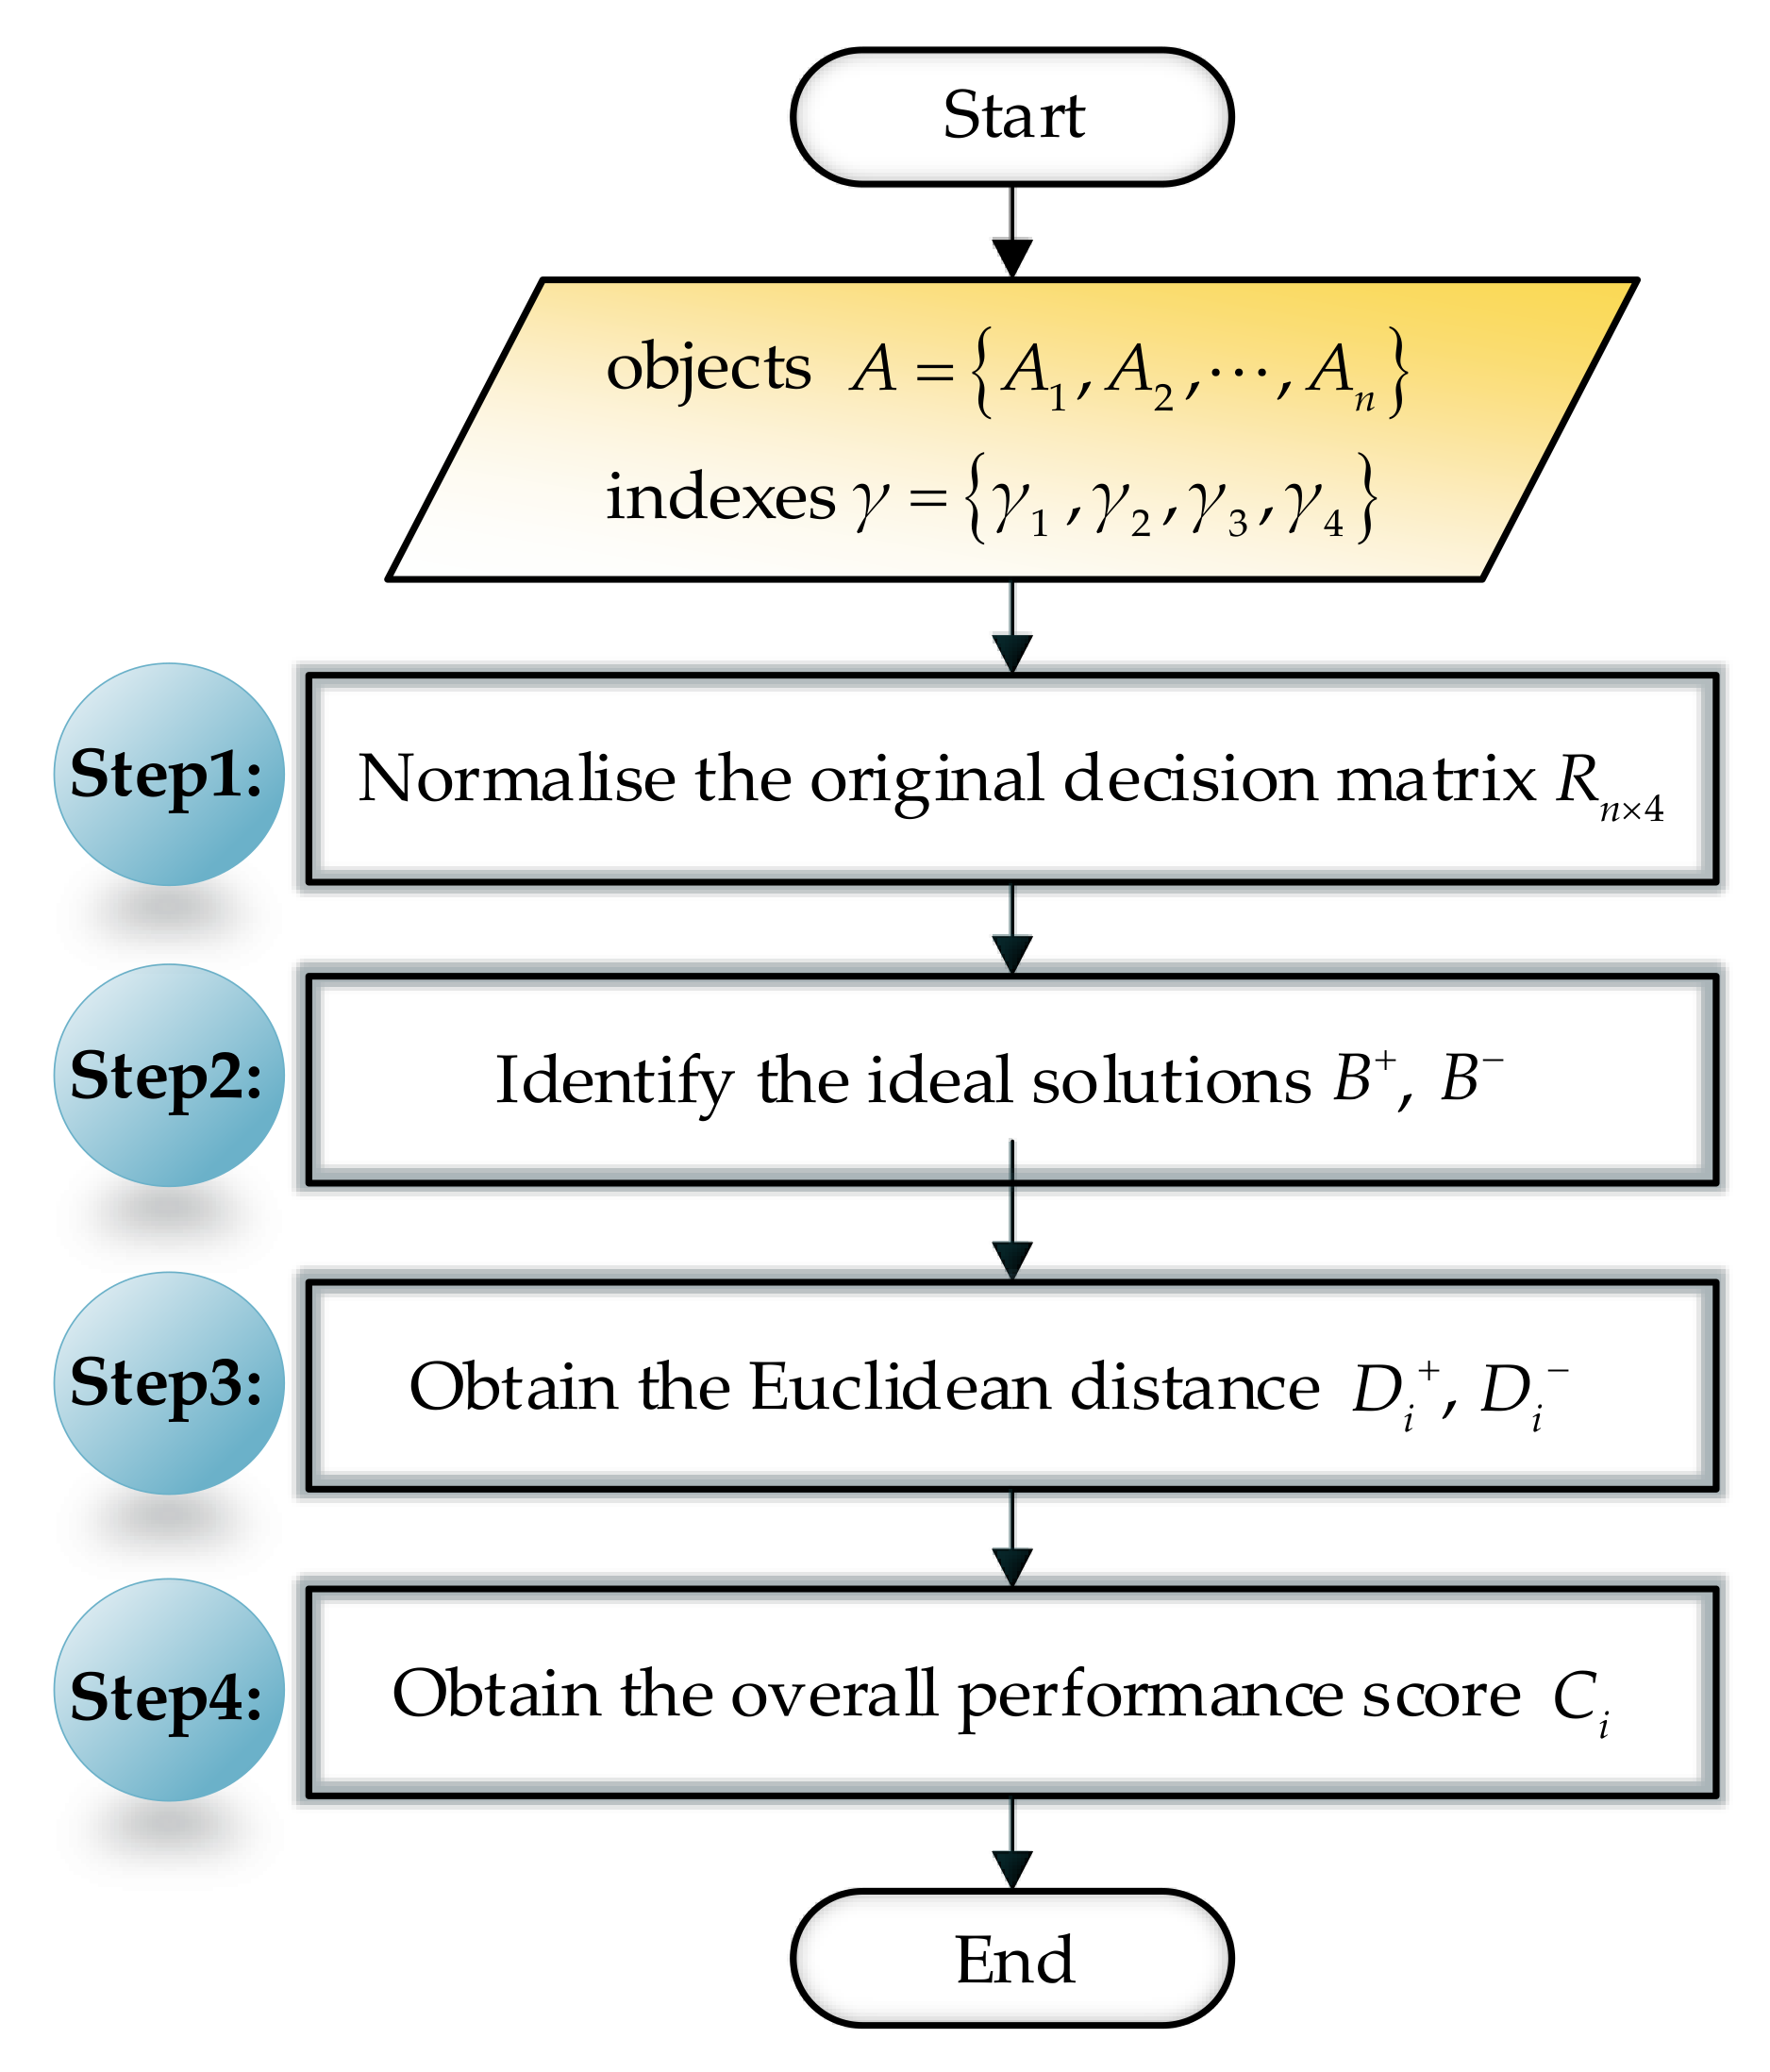
2.2.2. Priority Sequencing Based on the Modified TOPSIS
- (1)
- Step1: construction and normalization of the decision matrix
- (2)
- Step2: identification of the ideal solution
- (3)
- Step3: calculation of the weighted Euclidean distance
- (4)
- Step4: calculation of the overall performance score
3. Peak Shaving Method with Dynamic Evaluation and Self-Renewal Mechanism
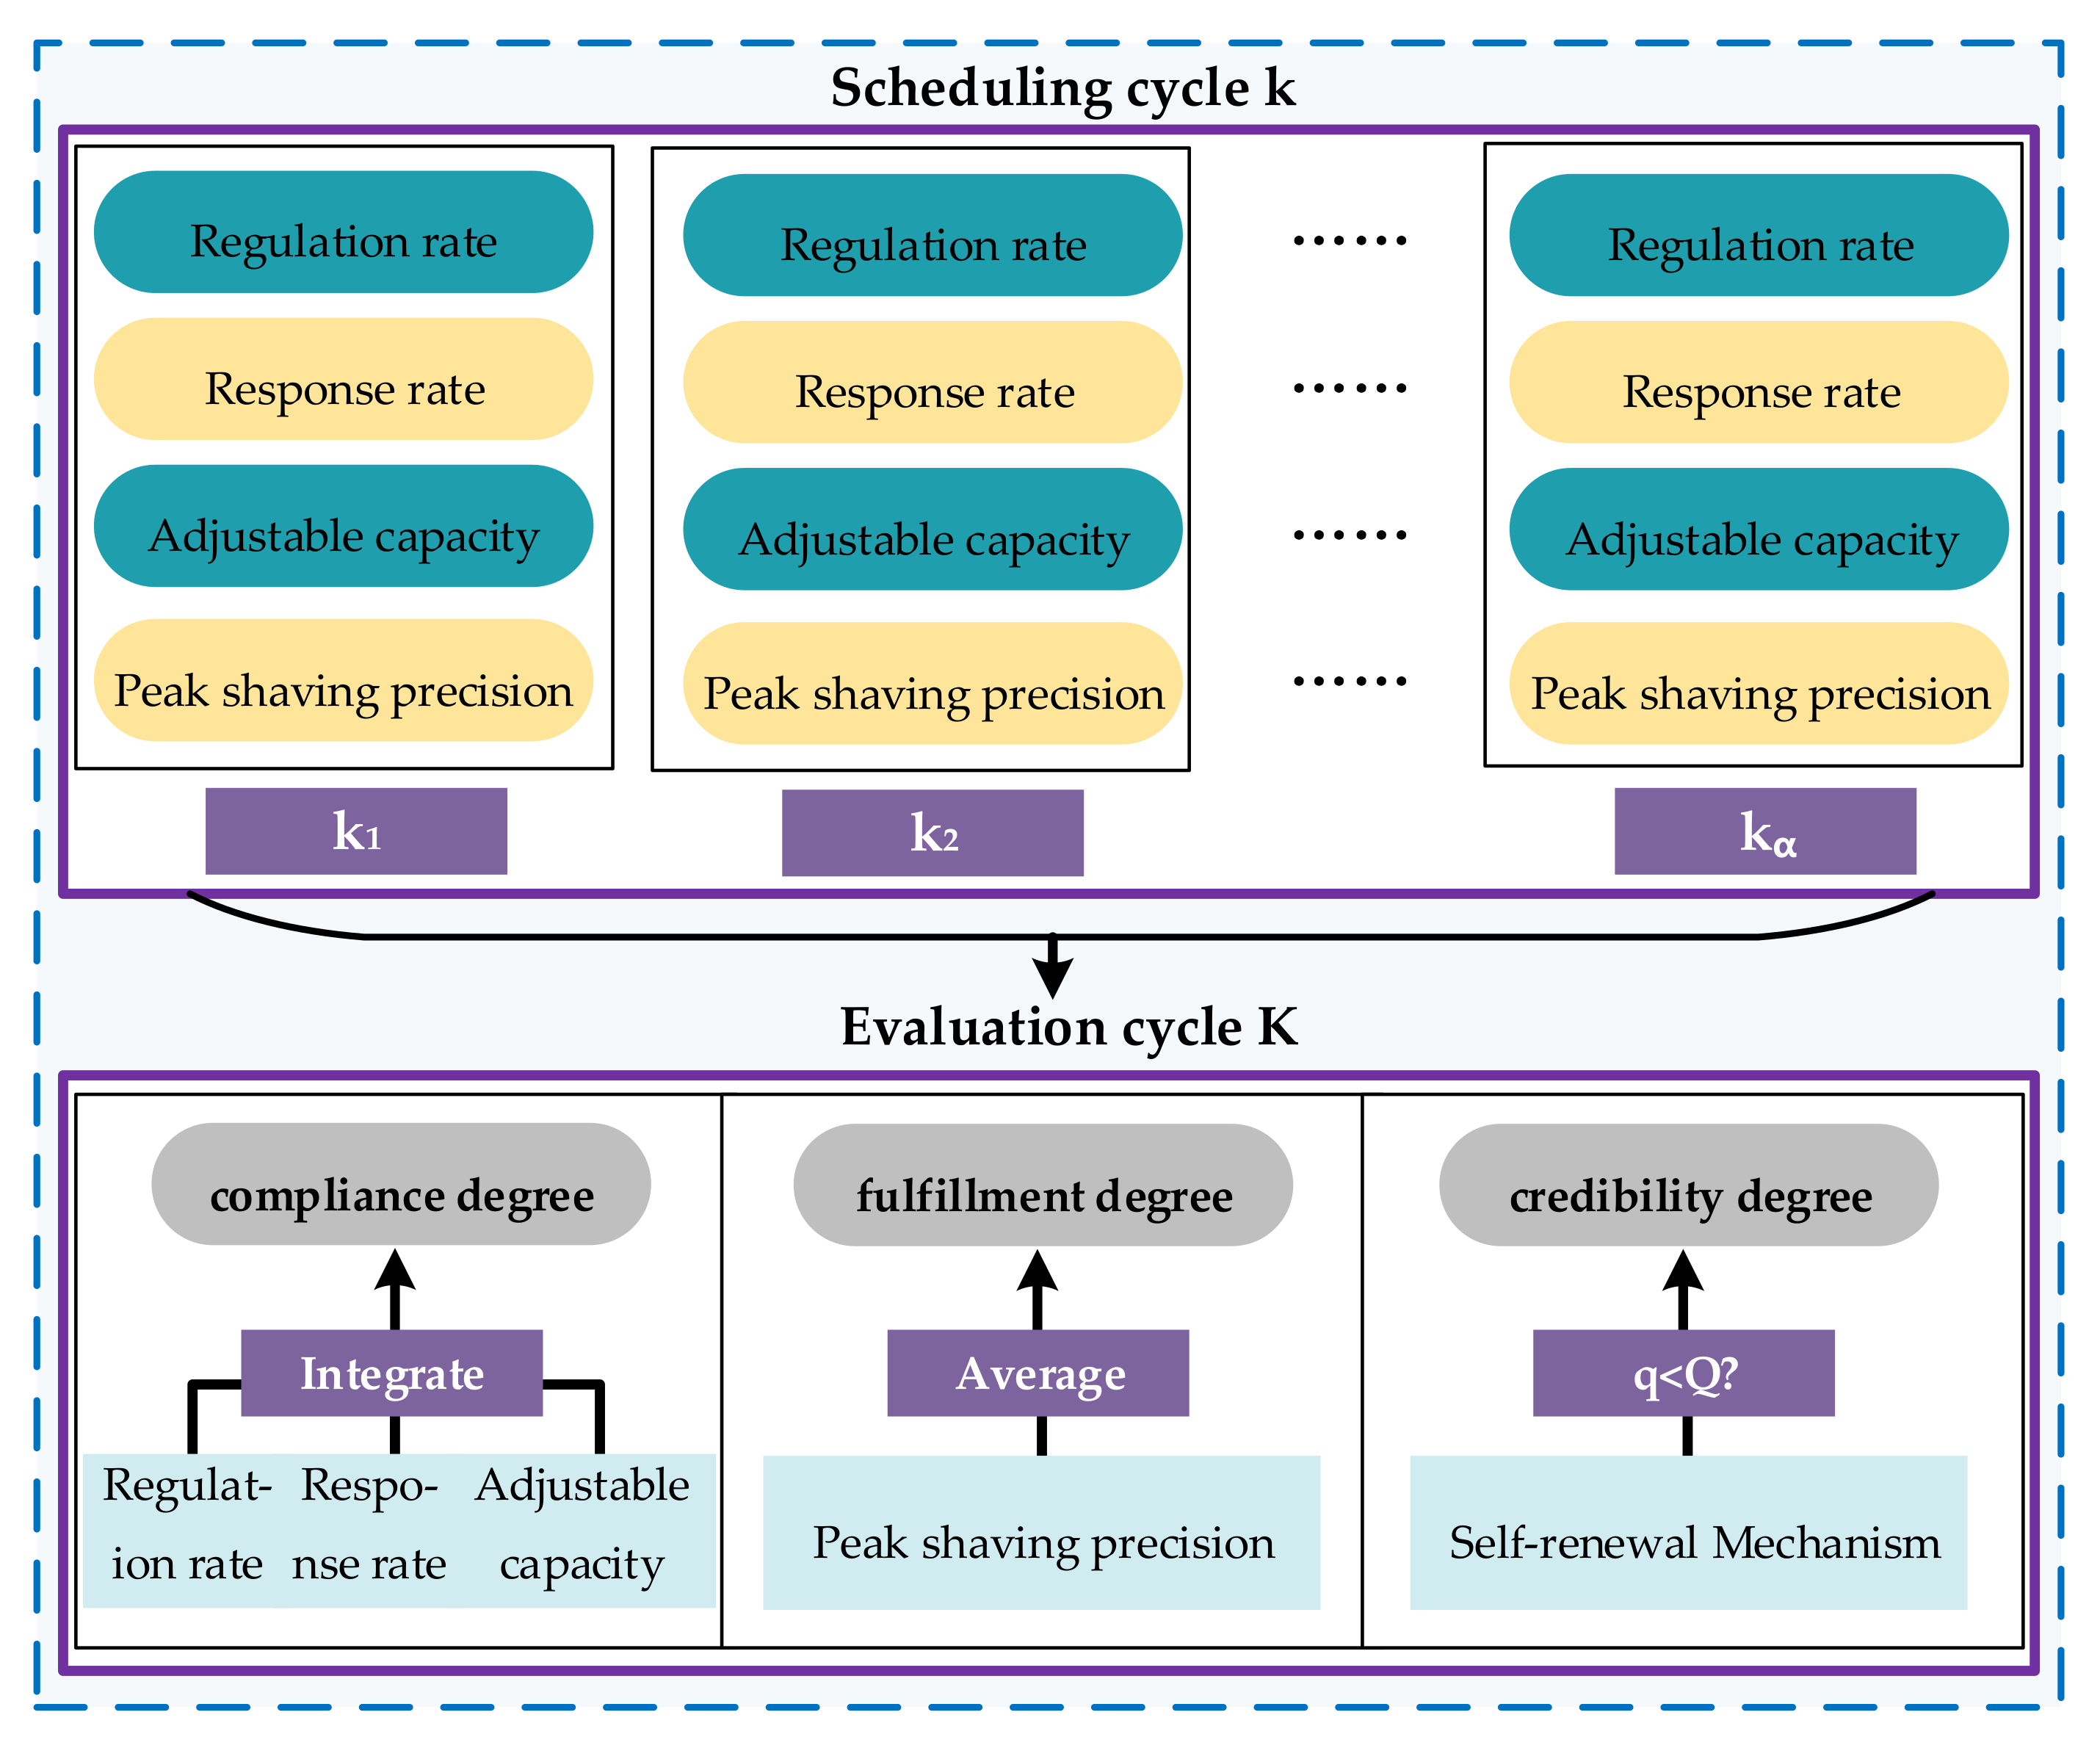
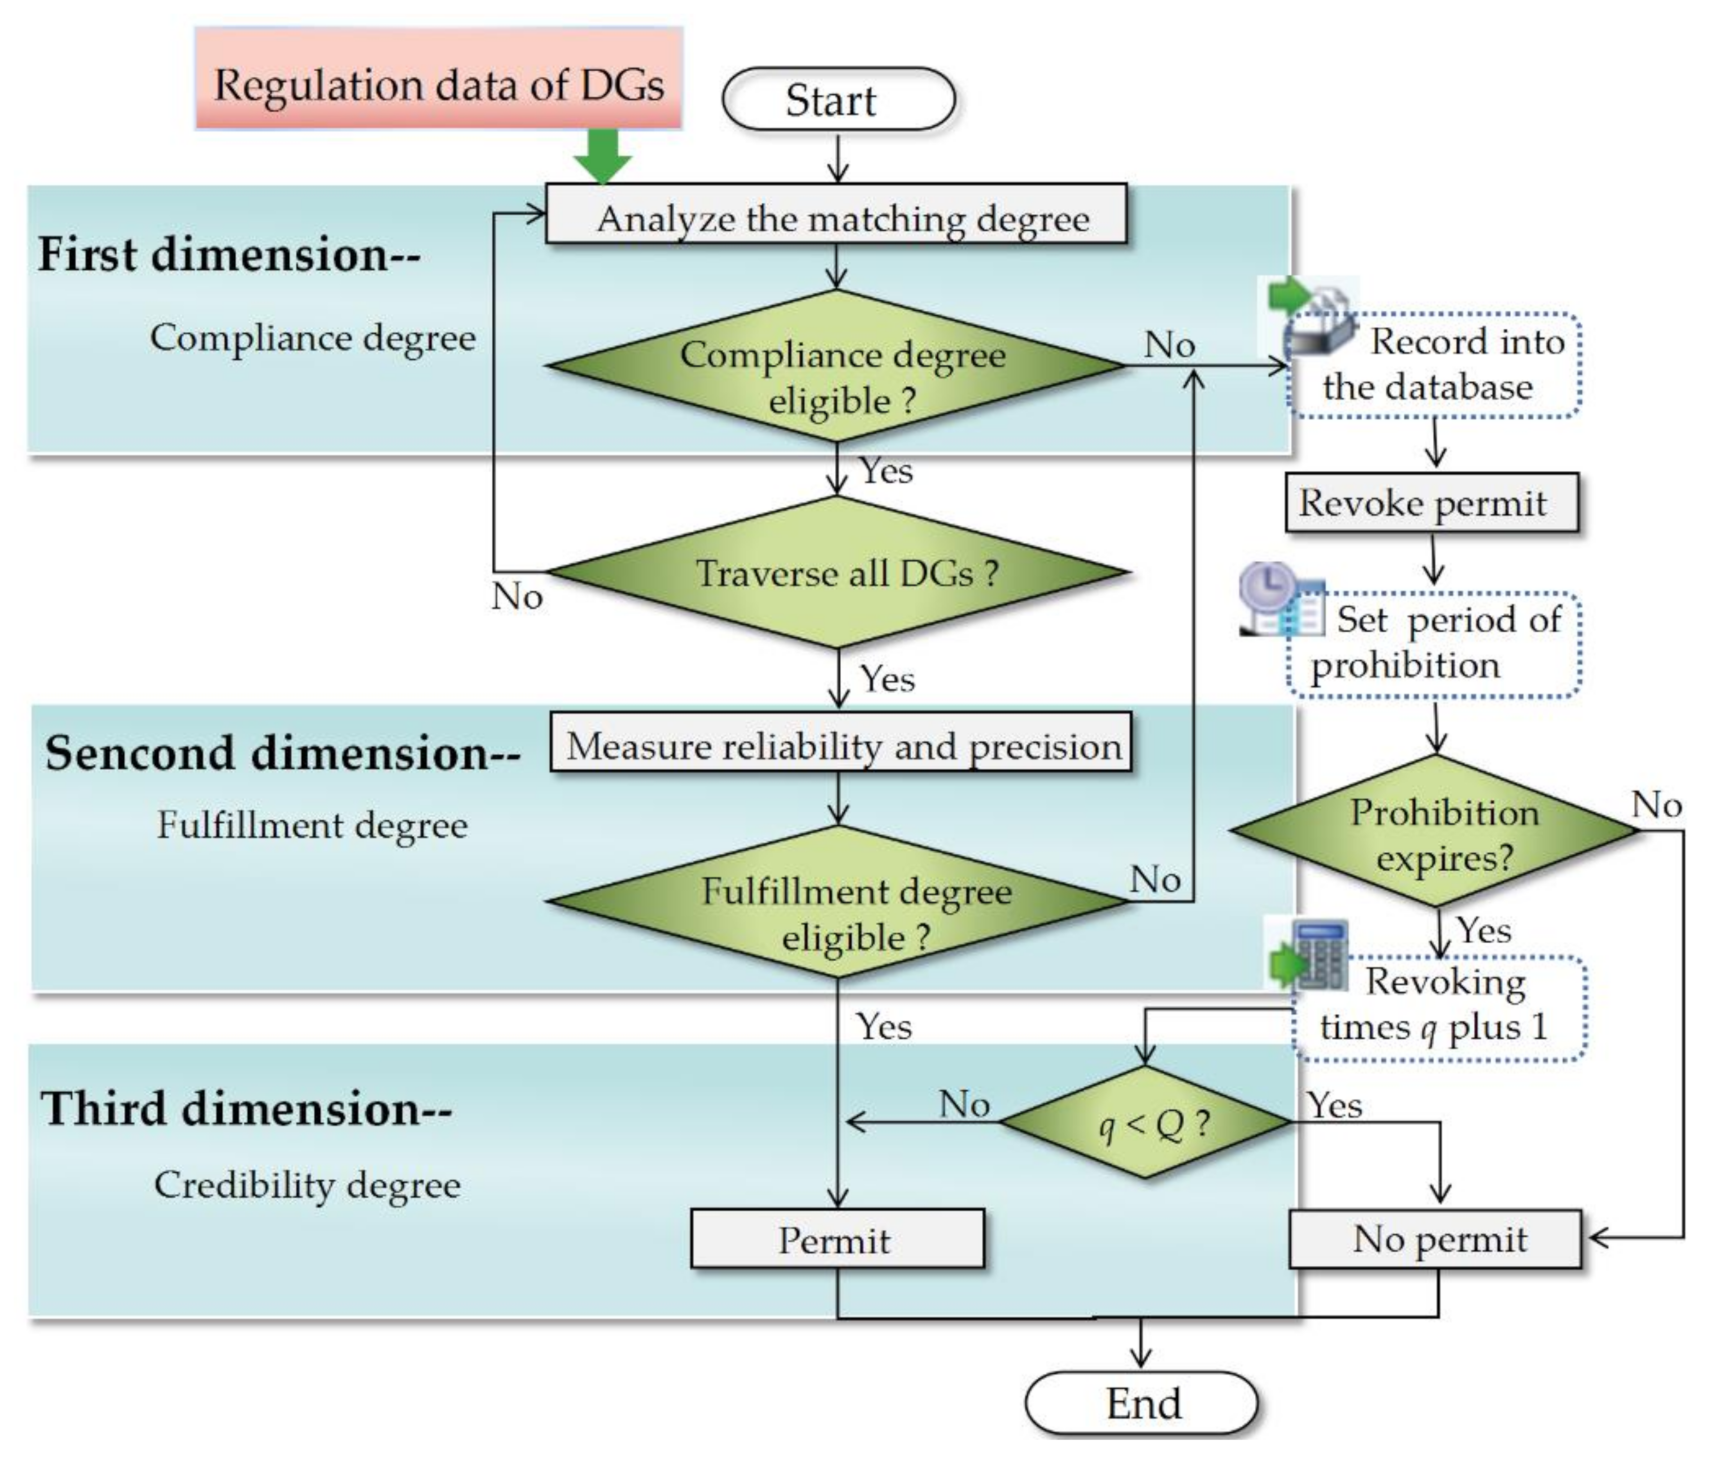
3.1. Three-Dimensional Dynamic Evaluation
- (1)
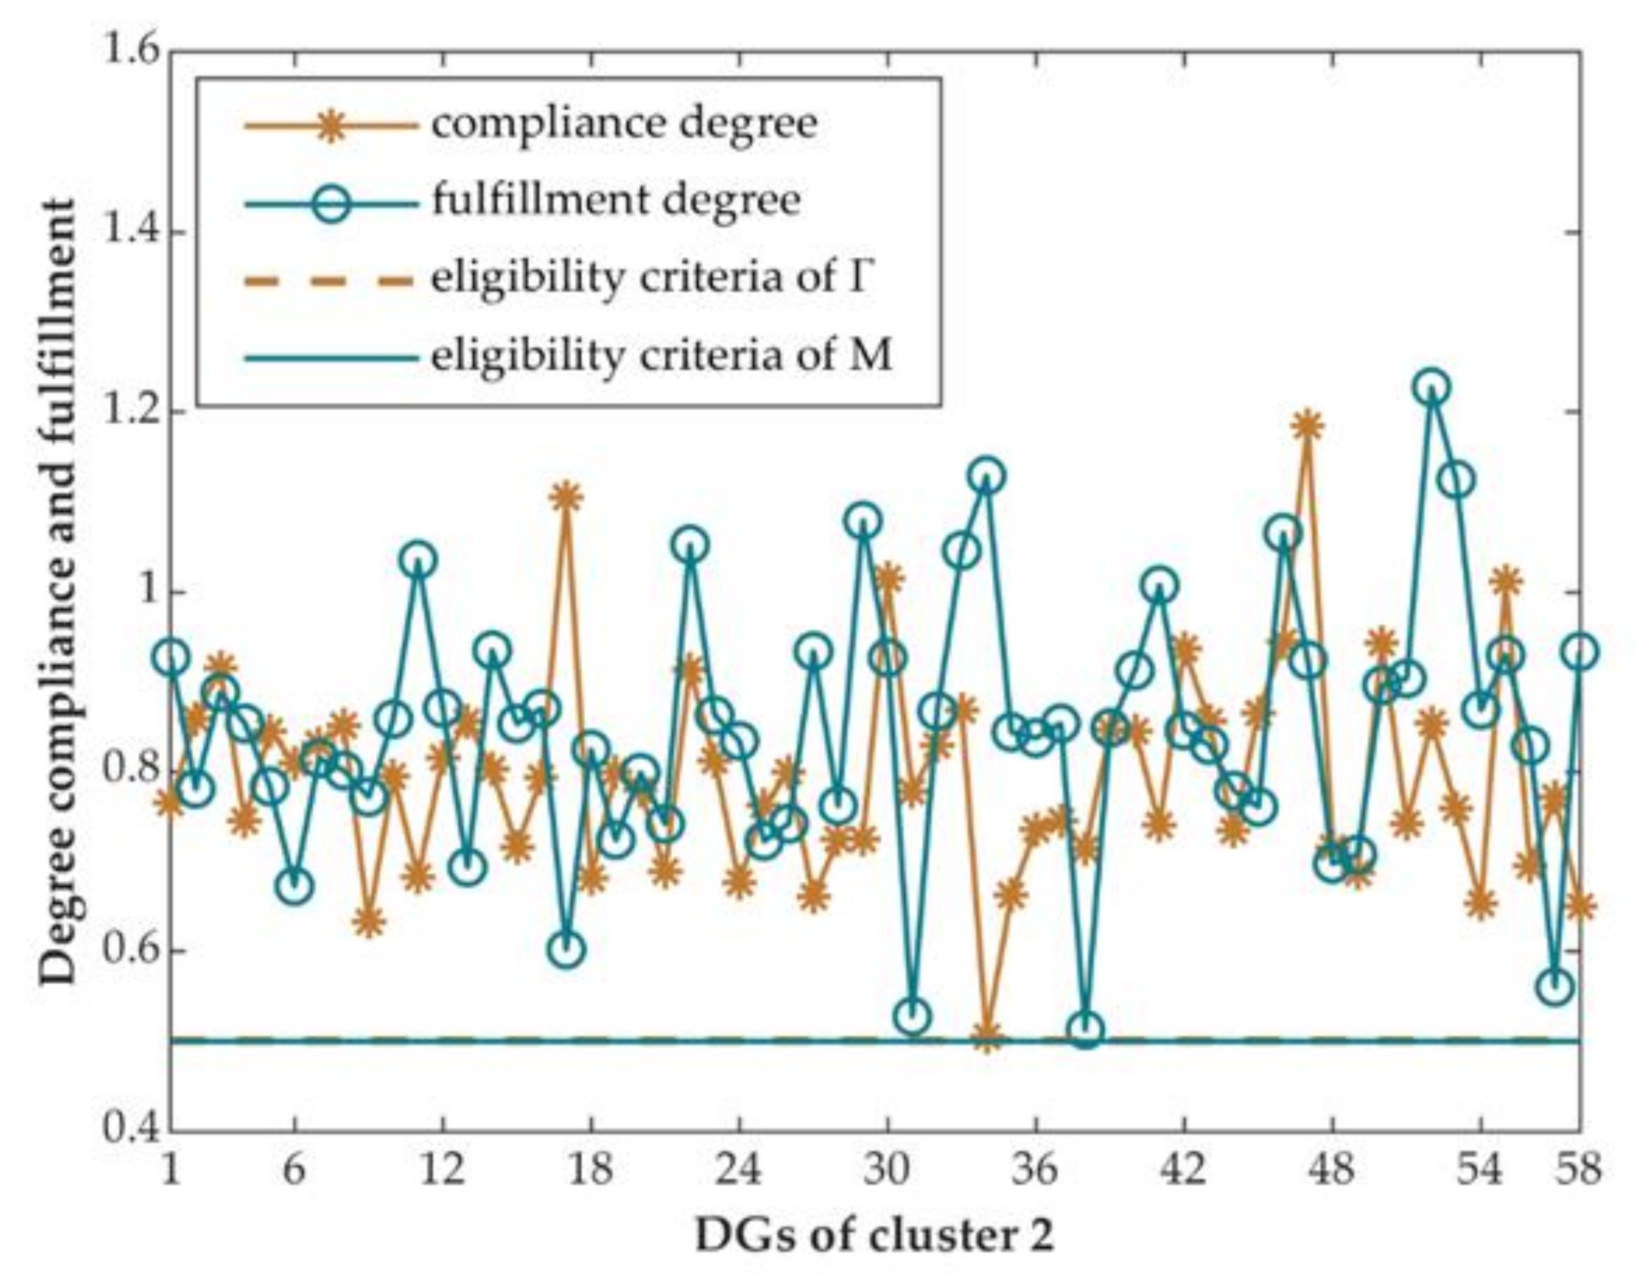
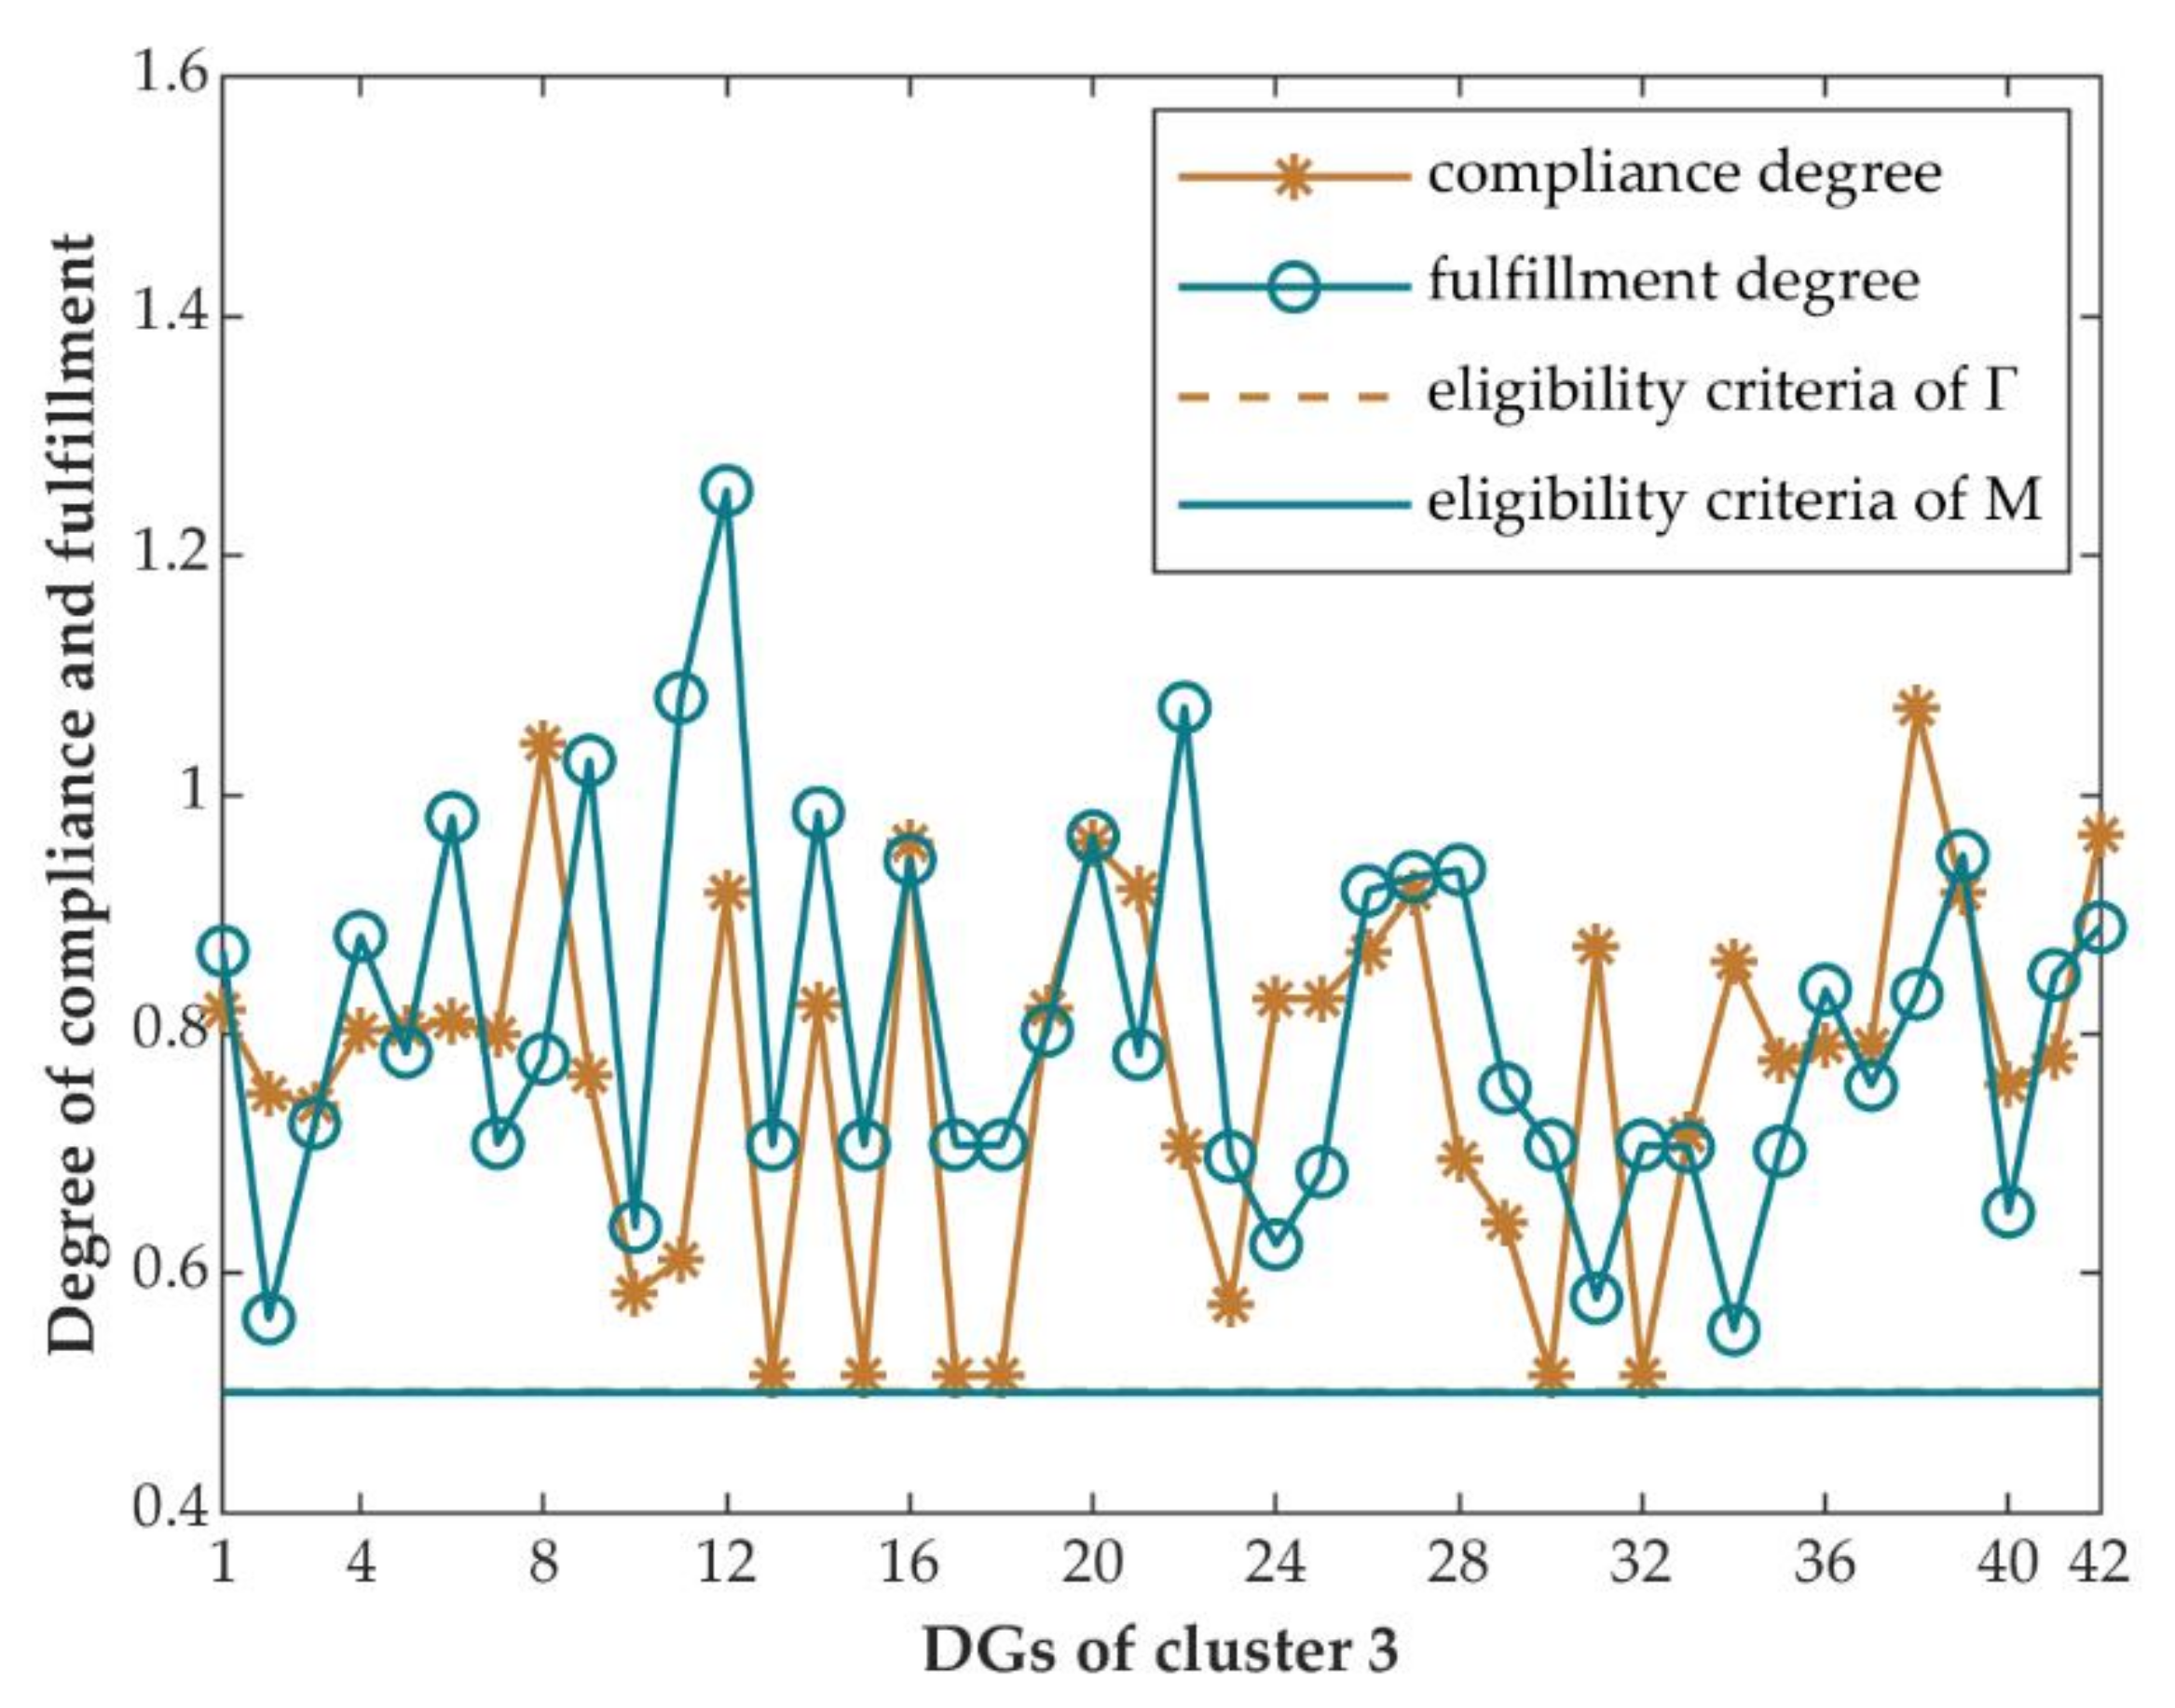
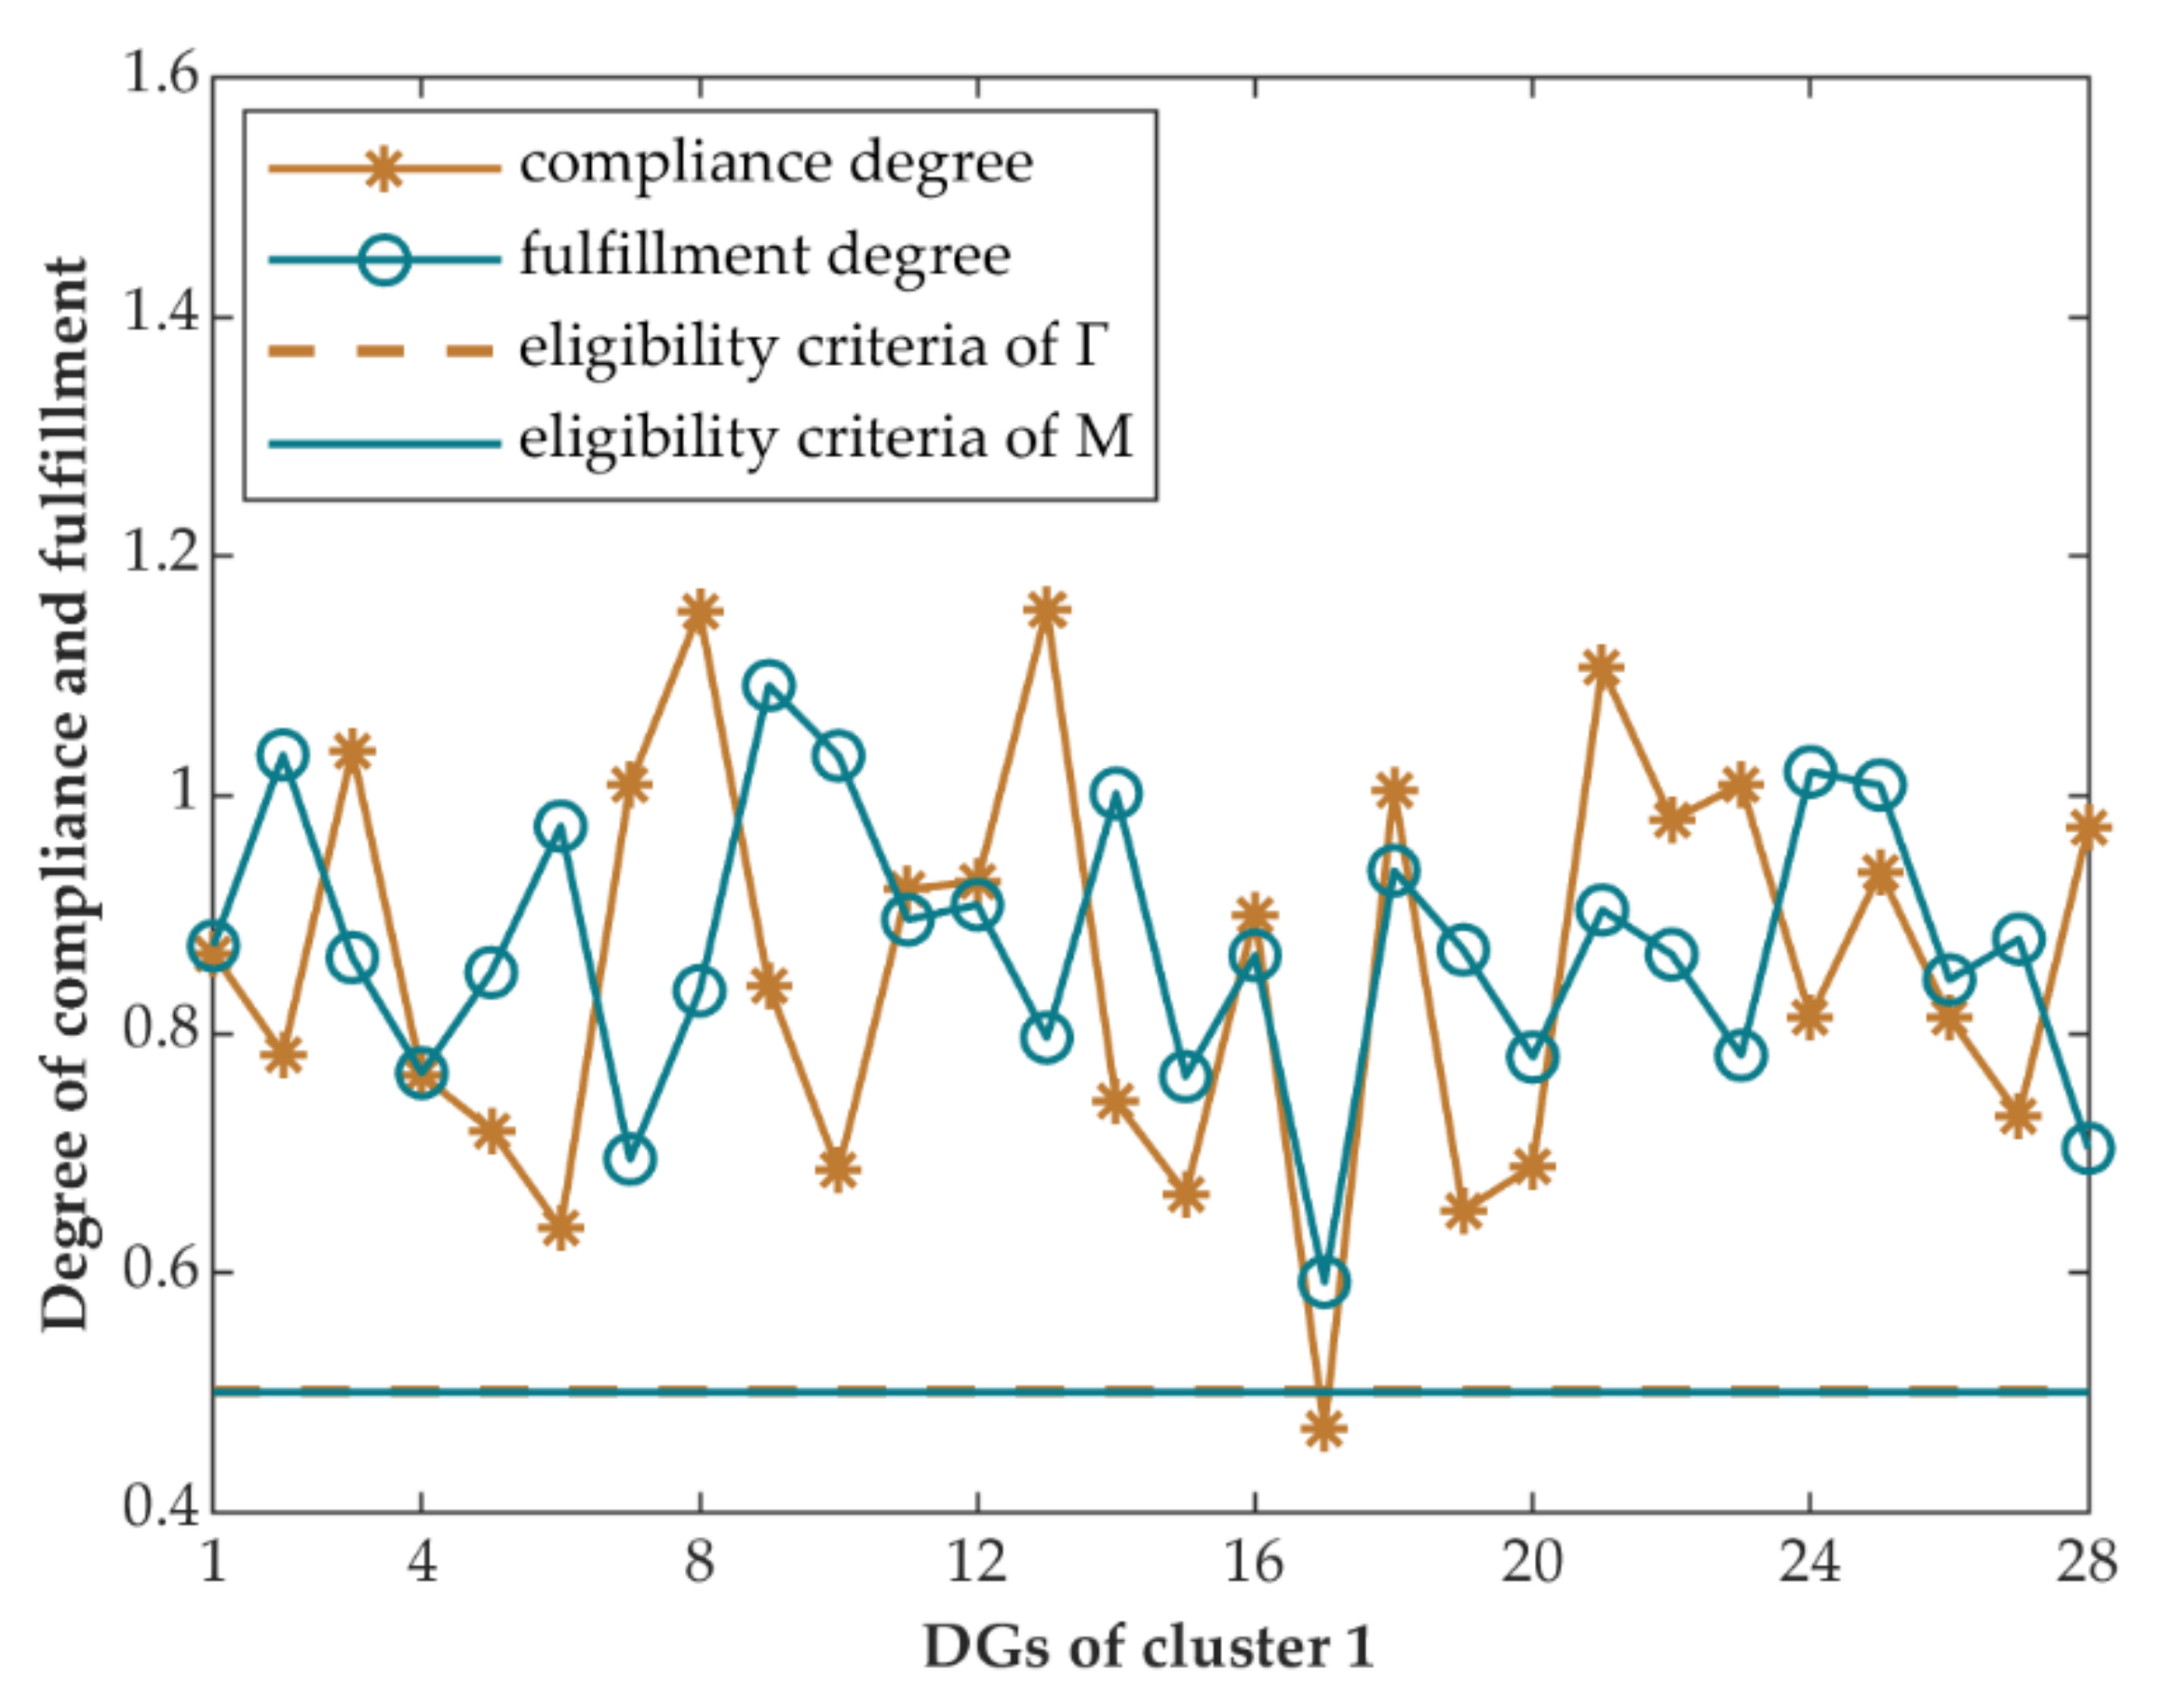
- The first dimension—compliance degree : It reflects the matching degree between the regulation ability of DG and the peak shaving task from the power dispatching center, so this dimension is mainly designed to measure and quantify the peak shaving ability of DGs.
- (2)
- The second dimension—fulfillment degree : This dimension represents the average peak shaving accuracy of DGs during an evaluation cycle, and is applied to measure the reliability and precision of regulation. So, the index of peak shaving precision is used in the calculation of the fulfillment degree, which is as follows:
- (3)
- The third dimension—credibility degree : This dimension is proposed to judge whether the DGs should be permissioned to continue participating in the auxiliary service of peak shaving. This judgment is mainly made by counting the historical records where a DG unit is temporarily prohibited from participating in peak shaving, that is, the times of revoking its peak shaving permit. The degree of credibility is defined as:where: and is the total number of DGs in one cluster, including all DGs allowed and not allowed for peak shaving. Specifically, a maximum record of revoking the permit is firstly preset as . Only the times that it has been revoked less than , the credibility degree can be eligible and equal to 1, otherwise and the peak shaving permit will be permanently revoked.
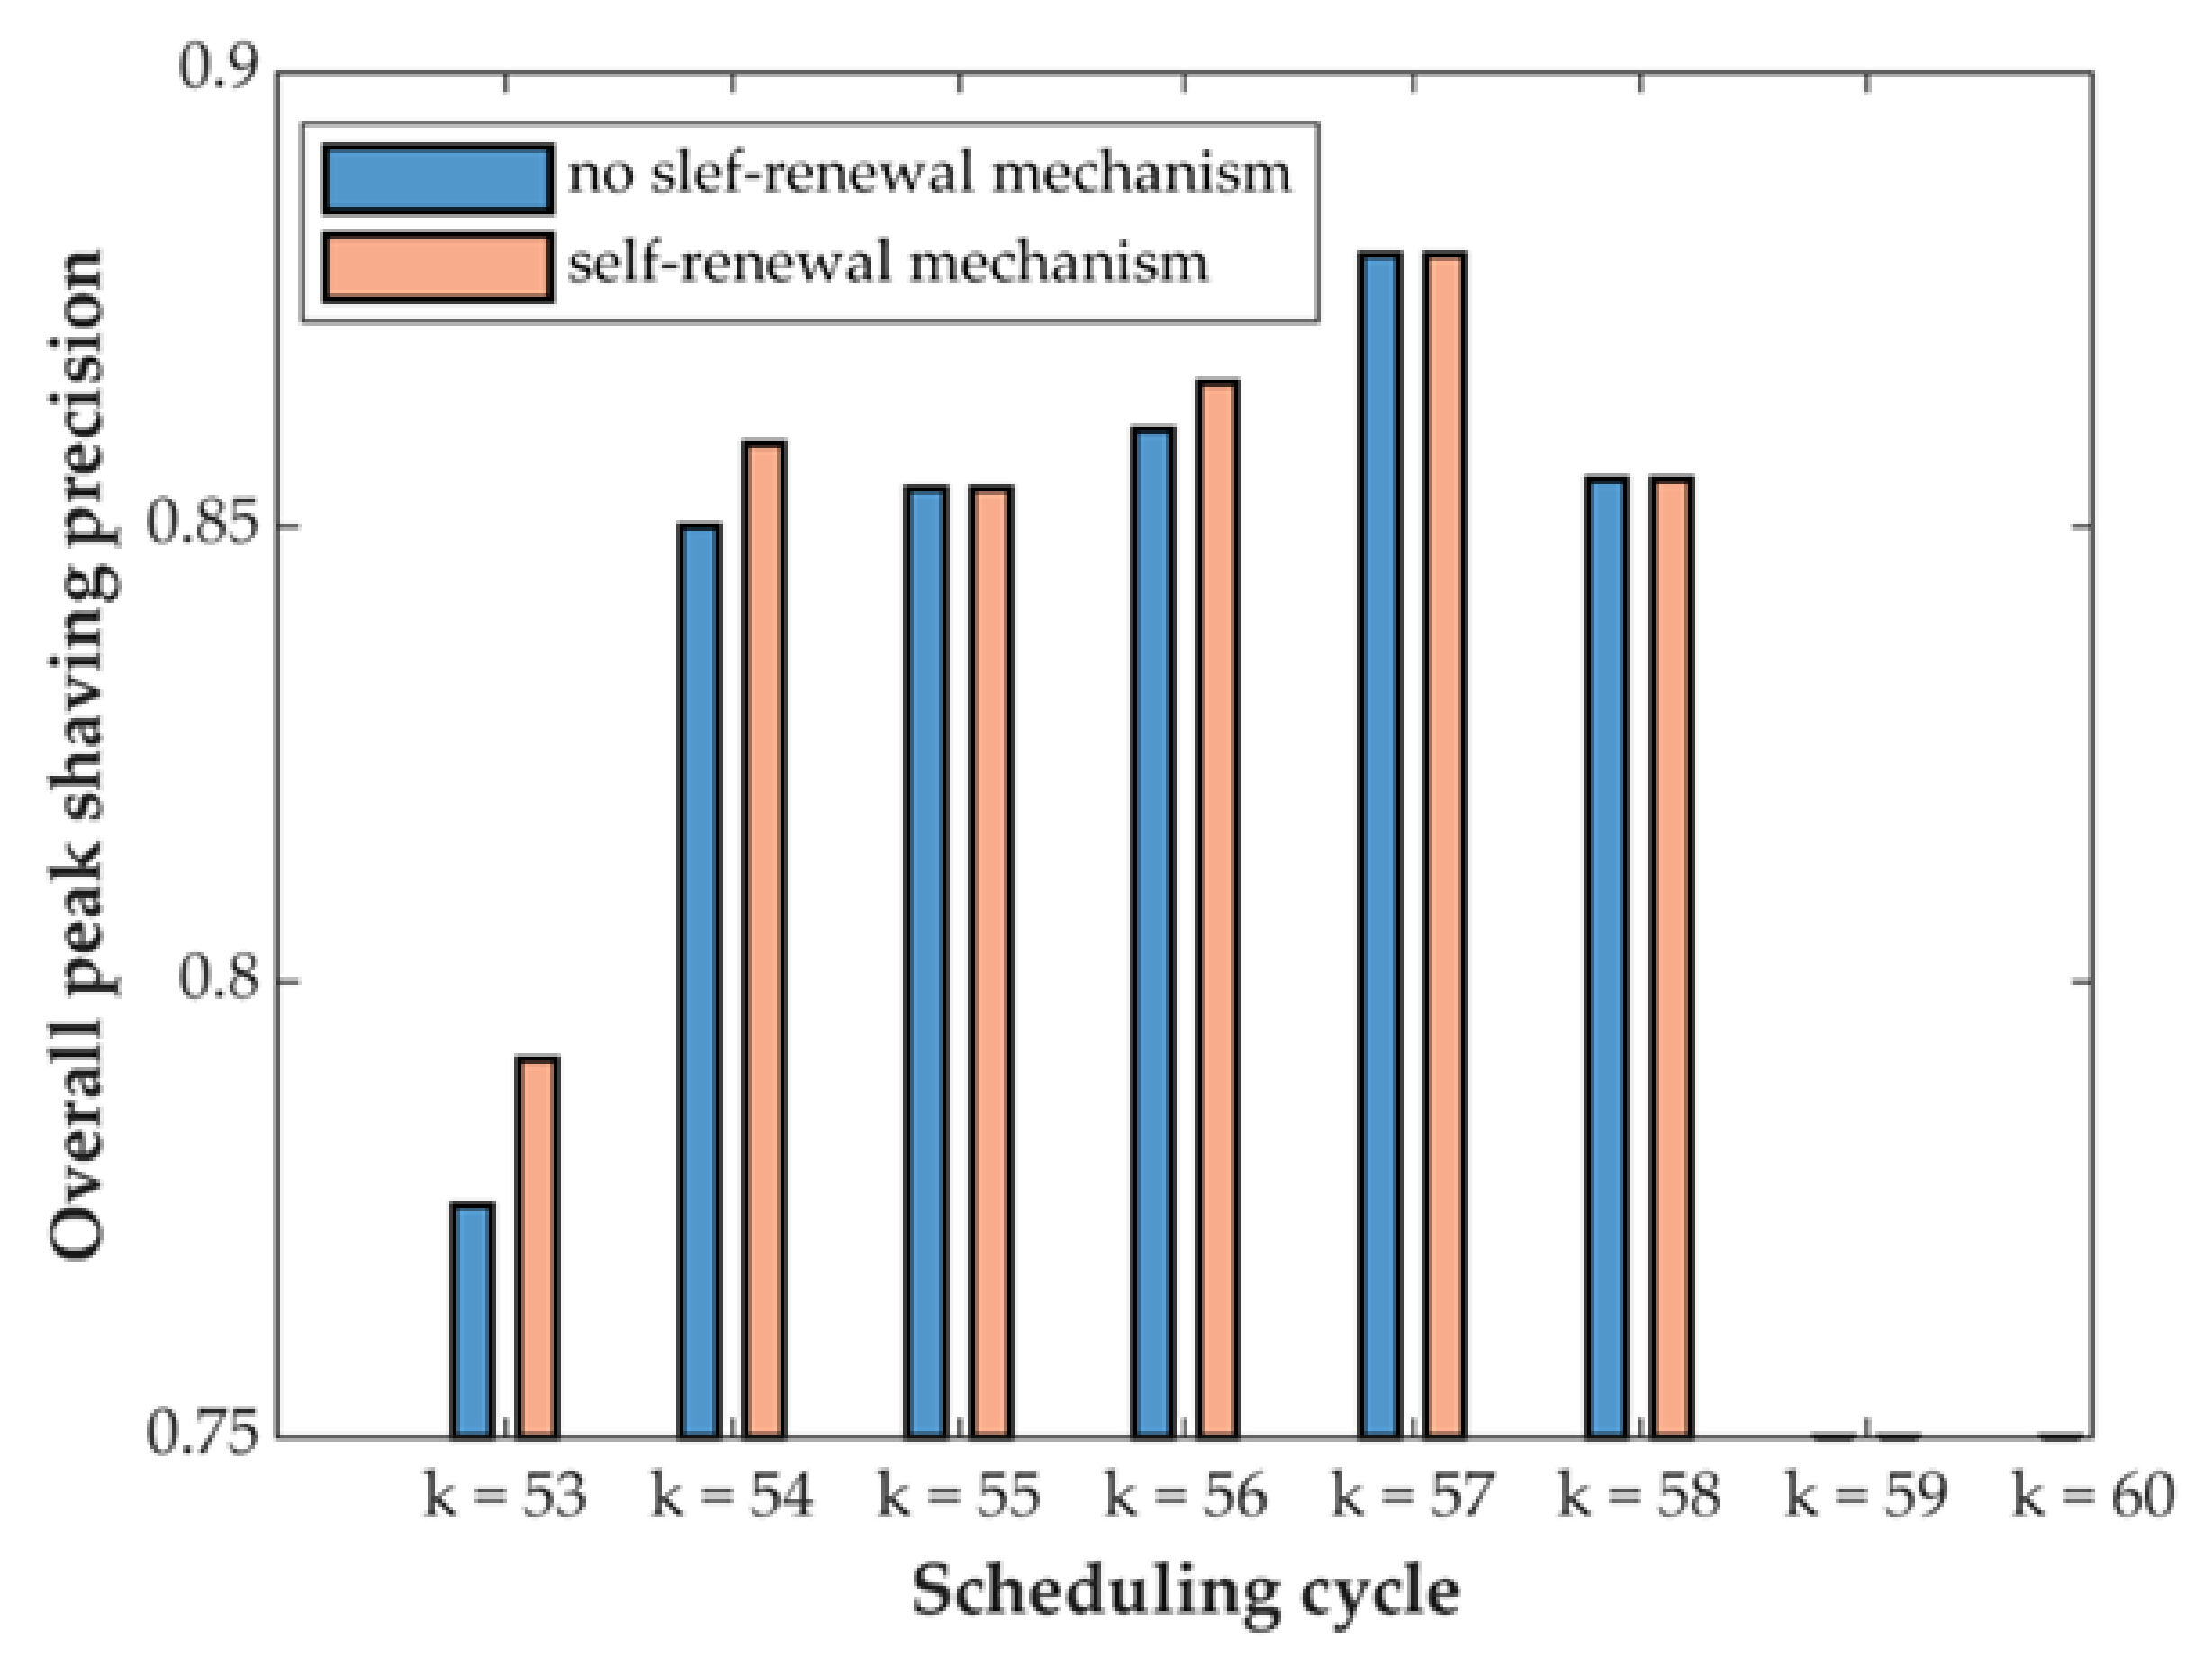
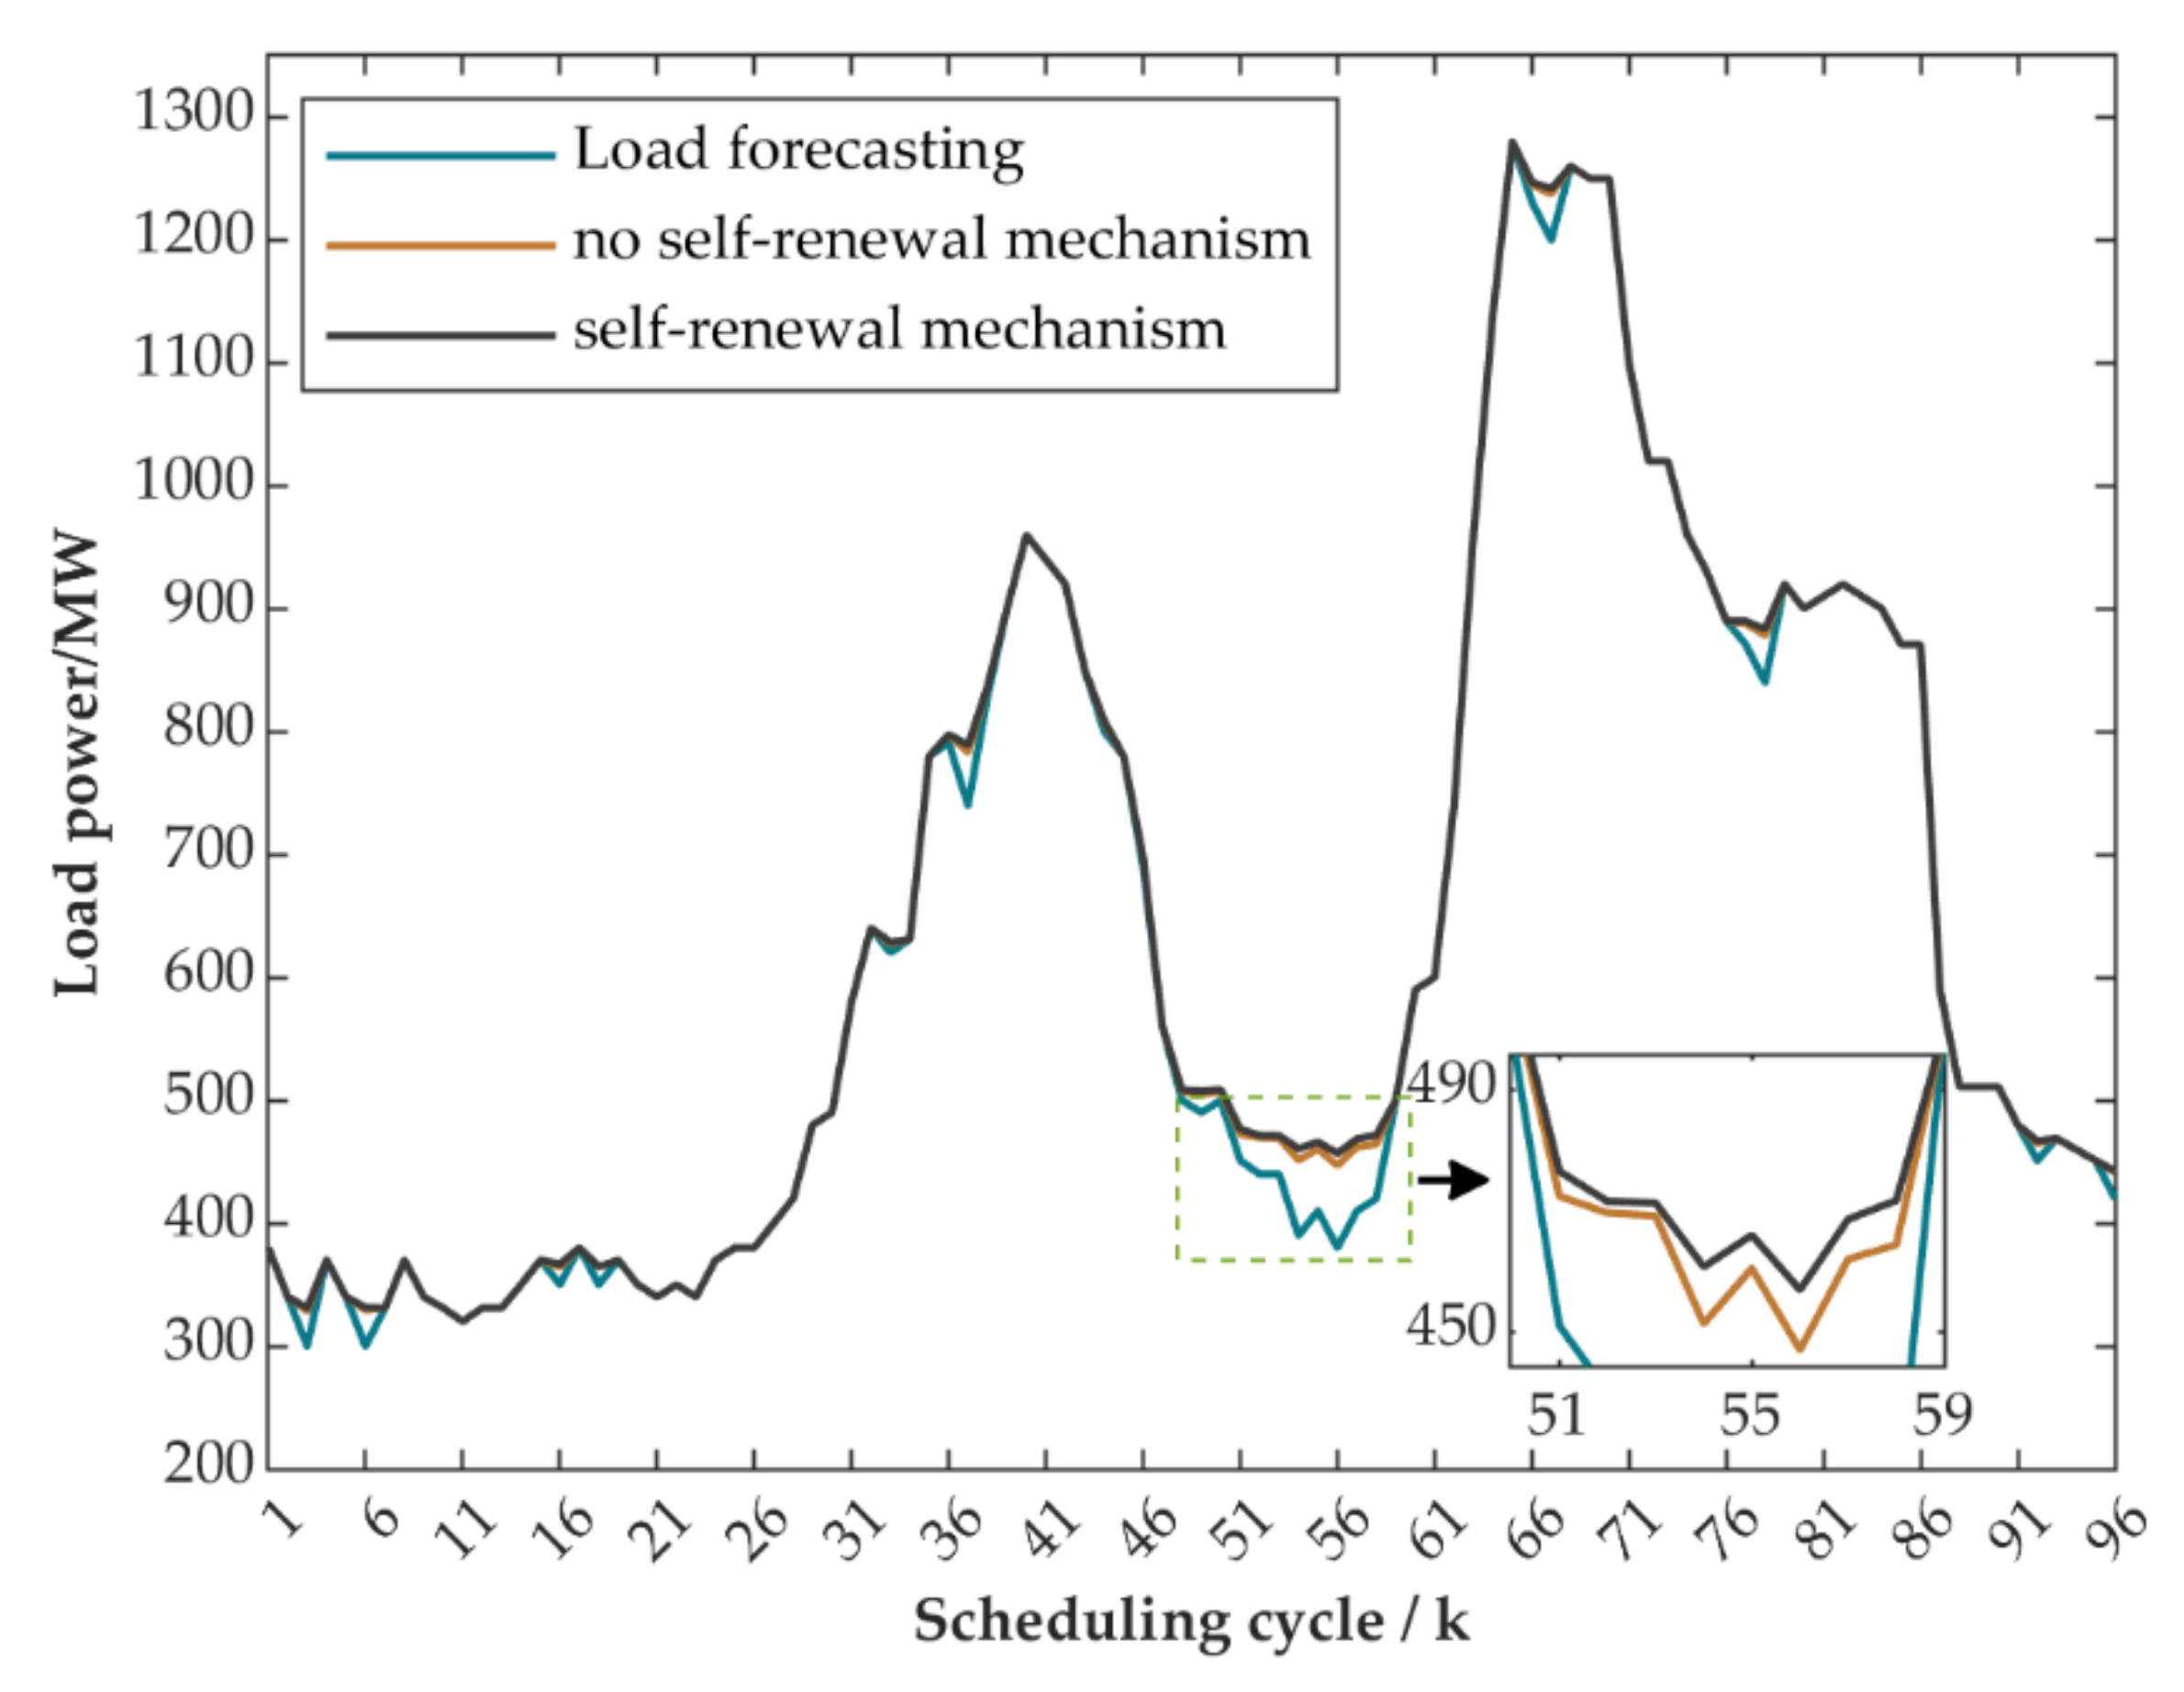
3.2. Self-Renewal Mechanism of Clusters
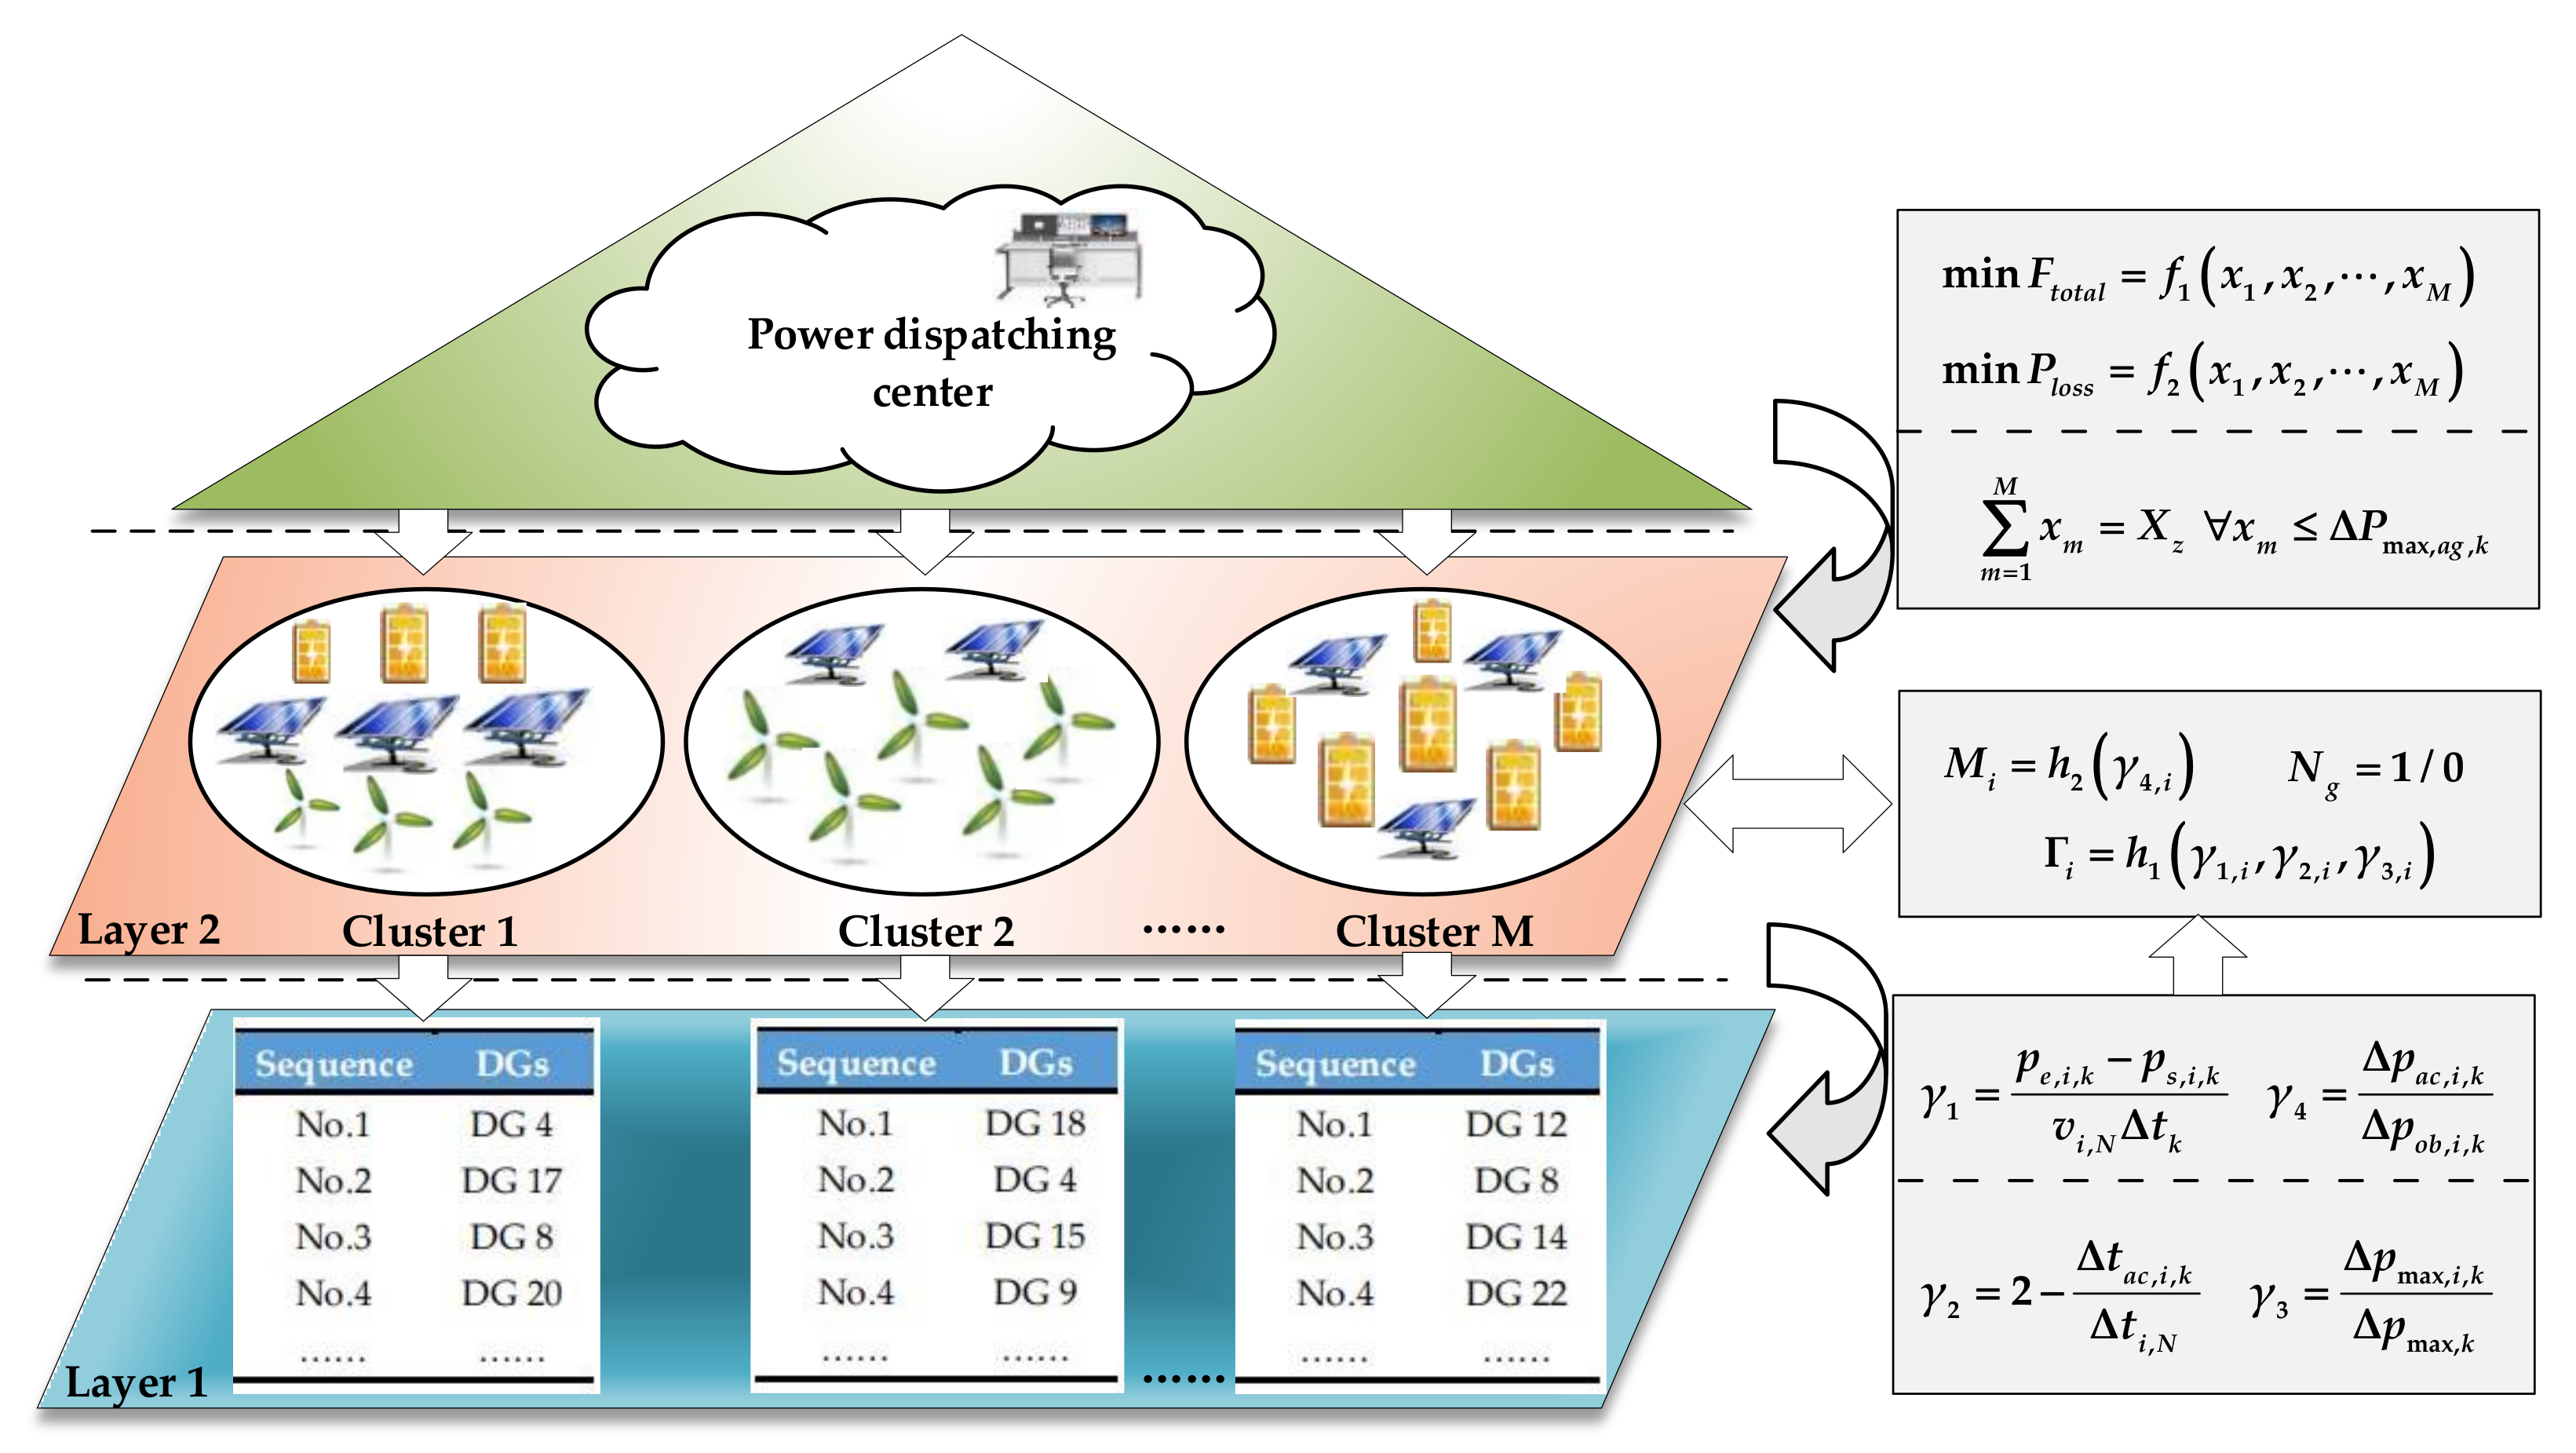
3.3. Two-Layer Optimization Method of Peak Shaving Task Allocation
4. Case Study and Discussion
5. Conclusions
Author Contributions
Funding
Conflicts of Interest
Abbreviations
| AHP | analytic hierarchy process |
| DGs | distributed generations |
| EWM | entropy weight method |
| MCDM | Multi-Criteria Decision Making |
| PV | photovoltaic |
| TOPSIS | techniques for order preference by similarity to an ideal solution |
References
- Mehigan, L.; Deane, J.P.; Gallachoir, B.P.Ó.; Bertsch, V. A review of the role of distributed generation (DG) in future electricity systems. Energy 2018, 163, 822–836. [Google Scholar] [CrossRef]
- Masson, G.; Bosch, E.; Kaizuka, I.; Jäger-Waldau, A.; Donoso, J. Snapshot of Global PV Markets 2022 Task 1 Strategic PV Analysis and Outreach PVPS; IEA PVPS: Paris, France, 2022; pp. 15–17. [Google Scholar]
- Rana, M.M.; Atef, M.; Sarkar, M.R.; Uddin, M.; Shafiullah, G.M. A Review on Peak Load Shaving in Microgrid—Potential Benefits, Challenges, and Future Trend. Energies 2022, 15, 2278. [Google Scholar] [CrossRef]
- Yue, S.; Cong, L.; Lizhu, S.; Chuanpu, Z.; Yanlan, F.; Yongqi, H. Peak Shaving Auxiliary Service Market Model with Multi-Type Power Participation. In Proceedings of the 2021 International Conference on Power System Technology (POWERCON), Haikou, China, 8–9 December 2021; pp. 684–689. [Google Scholar]
- Ceran, B.; Jurasz, J.; Mielcarek, A.; Campana, P.E. PV systems integrated with commercial buildings for local and national peak load shaving in Poland. J. Clean. Prod. 2021, 322, 129076. [Google Scholar] [CrossRef]
- Ren, J.; Ma, X.; Zhang, X.; Guo, T.; Liu, Y. Joint Optimal Deep Peak Regulation of Renewable-rich Power System with Responsive Load Heating Storage Enabled CHP and Flexible Thermal Llants. In Proceedings of the 2020 IEEE 4th Conference on Energy Internet and Energy System Integration, Wuhan, China, 30 October 2020–1 November 2020; pp. 2673–2678. [Google Scholar]
- Yang, Y.; Qin, C.; Zeng, Y.; Wang, C. Interval Optimization-Based Unit Commitment for Deep Peak Regulation of Thermal Units. Energies 2019, 12, 922. [Google Scholar] [CrossRef]
- Papadopoulos, V.; Knockaert, J.; Develder, C.; Desmet, J. Peak shaving through battery storage for low-voltage enterprises with peak demand pricing. Energies 2020, 13, 1183. [Google Scholar] [CrossRef]
- Wang, S.; Li, X.; Hao, Y. Coordinated peak regulation control strategy of BESS and thermal power units in high proportion new energy power system. In Proceedings of the 2020 IEEE Sustainable Power and Energy Conference (ISPEC), Chengdu, China, 23–25 November 2020; pp. 579–584. [Google Scholar]
- Karandeh, R.; Lawanson, T.; Cecchi, V. A two-stage algorithm for optimal scheduling of battery energy storage systems for peak-shaving. In Proceedings of the 2019 North American Power Symposium (NAPS), Wichita, KS, USA, 13–15 October 2019; pp. 1–6. [Google Scholar]
- Liu, D.; Jin, Z.; Chen, H.; Cao, H.; Yuan, Y.; Fan, Y.; Song, Y. Peak Shaving and Frequency Regulation Coordinated Output Optimization Based on Improving Economy of Energy Storage. Electronics 2021, 11, 29. [Google Scholar] [CrossRef]
- Manojkumar, R.; Kumar, C.; Ganguly, S.; Catalão, J.P. Optimal peak shaving control using dynamic demand and feed-in limits for grid-connected PV sources with batteries. IEEE Syst. J. 2021, 15, 5560–5570. [Google Scholar] [CrossRef]
- Rana, M.M.; Romlie, M.F.; Abdullah, M.F.; Uddin, M.; Sarkar, M.R. A novel peak load shaving algorithm for isolated microgrid using hybrid PV-BESS system. Energy 2021, 234, 121157. [Google Scholar] [CrossRef]
- Huang, H.; Li, Y. Optimization Strategy of Wind-Photovoltaic-Energy Storage Grid Peak Shaving. In Proceedings of the 2021 IEEE 2nd China International Youth Conference on Electrical Engineering (CIYCEE), Chengdu, China, 15–17 December 2021; pp. 1–7. [Google Scholar]
- Wang, S.; Jia, R.; Shi, X.; An, Y.; Huang, Q.; Guo, P.; Luo, C. Hybrid time-scale optimal scheduling considering multi-energy complementary characteristic. IEEE Access 2021, 9, 94087–94098. [Google Scholar] [CrossRef]
- Guo, Y.; Ming, B.; Huang, Q.; Wang, Y.; Zheng, X.; Zhang, W. Risk-Averse day-ahead generation scheduling of hydro–wind–photovoltaic complementary systems considering the steady requirement of power delivery. Appl. Energy 2022, 309, 118467. [Google Scholar] [CrossRef]
- Cong, D.; Shiyi, M.; Jun, W.; Fuqiang, L.; Yuou, H. Study on peak shaving strategy of pumped storage power station combined with wind and photovoltaic power generation. In Proceedings of the 2017 International Conference on Computer Systems, Electronics and Control (ICCSEC), Dalian, China, 25–27 December 2017; pp. 871–874. [Google Scholar]
- Ding, J.; Zhang, Q.; Hu, S.; Wang, Q.; Ye, Q. Clusters partition and zonal voltage regulation for distribution networks with high penetration of PVs. IET Gener. Transm. Distrib. 2018, 12, 6041–6051. [Google Scholar] [CrossRef]
- Ye, C.; Cao, K.; Han, H.; Liu, Z.; Cai, D.; Liu, D. Cluster Partition Method of Large-Scale Grid-Connected Distributed Generations considering Expanded Dynamic Time Scenarios. Math. Probl. Eng. 2022, 2022, 1934992. [Google Scholar] [CrossRef]
- Wang, J.; Zhong, H.; Wu, C.; Du, E.; Xia, Q.; Kang, C. Incentivizing distributed energy resource aggregation in energy and capacity markets: An energy sharing scheme and mechanism design. Appl. Energy 2019, 252, 113471. [Google Scholar] [CrossRef]
- Shi, Z.; Wang, Z.; Jin, Y.; Tai, N.; Jiang, X.; Yang, X. Optimal allocation of intermittent distributed generation under active management. Energies 2018, 11, 2608. [Google Scholar] [CrossRef]
- Faria, P.; Spínola, J.; Vale, Z. Distributed energy resources scheduling and aggregation in the context of demand response programs. Energies 2018, 11, 1987. [Google Scholar] [CrossRef]
- Li, H.; Duan, J.; Zhang, D.; Yang, J. A distributed energy resources aggregation model based on multi-scenario and multi-objective methodology. Appl. Sci. 2019, 9, 3586. [Google Scholar] [CrossRef]
- Shen, J.; Chen, G.; Cheng, C.; Wei, W.; Zhang, X.; Zhang, J. Modeling of Generation Scheduling for Multiple Provincial Power Grids Using Peak-Shaving Indexes. J. Water Resour. Plan. Manag. 2021, 147, 04021052. [Google Scholar] [CrossRef]
- He, L.; Li, C.L.; Nie, Q.Y.; Men, Y.; Shao, H.; Zhu, J. Core abilities evaluation index system exploration and empirical study on distributed PV-generation projects. Energies 2017, 10, 2083. [Google Scholar] [CrossRef]
- Galgali, V.S.; Vaidya, G.A.; Ramachandran, M. Selection of distributed generation system using multicriteriadecision making fuzzy TOPSIS optimization. In Proceedings of the 2016 5th International Conference on Reliability, Infocom Technologies and Optimization (Trends and Future Directions) (ICRITO), Amity Univ, Noida, India, 7–9 September 2016; pp. 86–89. [Google Scholar]
- Chakraborty, S. TOPSIS and Modified TOPSIS: A comparative analysis. Decis. Anal. J. 2022, 2, 100021. [Google Scholar] [CrossRef]
- Zhu, Y.; Tian, D.; Yan, F. Effectiveness of entropy weight method in decision-making. Math. Probl. Eng. 2020, 2020, 3564835. [Google Scholar] [CrossRef]
- Dyer, R.F.; Forman, E.H. Group decision support with the analytic hierarchy process. Decis. Support Syst. 1992, 8, 99–124. [Google Scholar] [CrossRef]


| Reference | Power Type | Peak Shaving Method | Applicable Conditions |
|---|---|---|---|
| [12] | centralized | optimal control model | small quantity |
| [14,15,16] | centralized | optimization operation model | small quantity |
| [17] | centralized | mathematical model | small quantity |
| this paper | decentralized | two-layer methods | large quantity |
| Distributed Generation Clusters | Number of DG Units | Aggregate Adjustable Power |
|---|---|---|
| cluster 1 | 28 | 24.86 MW |
| cluster 2 | 58 | 51.32 MW |
| cluster 3 | 42 | 37.75 MW |
| Distributed Generation Clusters | ||||
|---|---|---|---|---|
| cluster 1 | 0 MW | 24.86 MW | 24.86 MW | 24.86 MW |
| cluster 2 | 29 MW | 15.14 MW | 15.14 MW | 51.32 MW |
| cluster 3 | 0 MW | 0 MW | 0 MW | 13.82 MW |
| Sequence | Modified TOPSIS Sequence | |||
|---|---|---|---|---|
| 1 | 8 | 8 | 2 | 20 |
| 2 | 10 | 10 | 7 | 26 |
| 3 | 15 | 15 | 23 | 16 |
| 4 | 25 | 25 | 26 | 8 |
| 5 | 4 | 4 | 8 | 18 |
| 6 | 22 | 22 | 22 | 15 |
| 7 | 27 | 27 | 10 | 7 |
| 8 | 17 | 17 | 19 | 21 |
| 9 | 14 | 14 | 28 | 12 |
| 10 | 21 | 21 | 13 | 28 |
| 11 | 28 | 28 | 14 | 19 |
| 12 | 16 | 16 | 21 | 27 |
| 13 | 13 | 13 | 6 | 4 |
| 14 | 6 | 6 | 1 | 9 |
| 15 | 12 | 12 | 5 | 2 |
| 16 | 5 | 5 | 18 | 6 |
| 17 | 2 | 2 | 3 | 22 |
| 18 | 9 | 9 | 17 | 10 |
| 19 | 19 | 19 | 4 | 3 |
| 20 | 1 | 1 | 25 | 23 |
| 21 | 23 | 23 | 11 | 14 |
| 22 | 7 | 7 | 9 | 24 |
| 23 | 20 | 20 | 12 | 5 |
| 24 | 18 | 18 | 24 | 25 |
| 25 | 24 | 24 | 27 | 11 |
| 26 | 26 | 26 | 15 | 17 |
| 27 | 11 | 11 | 16 | 13 |
| 28 | 3 | 3 | 20 | 1 |
| Cycle | Peak Shaving Instructions | No Self-Renewal Mechanism | Self-Renewal Mechanism | ||||
|---|---|---|---|---|---|---|---|
| Cluster 1 | Cluster 2 | Cluster 3 | Cluster 1 | Cluster 2 | Cluster 3 | ||
| = 53 | 40 MW | 24.86 MW | 15.14 MW | 0 MW | 24.02 MW | 15.98 MW | 0 MW |
| = 54 | 90 MW | 24.86 MW | 51.32 MW | 13.82 MW | 24.02 MW | 51.32 MW | 14.66 MW |
| = 55 | 70 MW | 18.68 MW | 51.32 MW | 0 MW | 18.68 MW | 51.32 MW | 0 MW |
| = 56 | 100 MW | 24.86 MW | 51.32 MW | 23.82 MW | 24.02 MW | 51.32 MW | 24.66 MW |
| = 57 | 70 MW | 18.68 MW | 51.32 MW | 0 MW | 18.68 MW | 51.32 MW | 0 MW |
| = 58 | 60 MW | 8.68 MW | 51.32 MW | 0 MW | 8.68 MW | 51.32 MW | 0 MW |
| = 59 | 0 MW | / | / | / | / | / | / |
| = 60 | 0 MW | / | / | / | / | / | / |
Publisher’s Note: MDPI stays neutral with regard to jurisdictional claims in published maps and institutional affiliations. |
© 2022 by the authors. Licensee MDPI, Basel, Switzerland. This article is an open access article distributed under the terms and conditions of the Creative Commons Attribution (CC BY) license (https://creativecommons.org/licenses/by/4.0/).
Share and Cite
Li, H.; Xu, Q.; Wang, S.; Song, H. Peak Shaving Methods of Distributed Generation Clusters Using Dynamic Evaluation and Self-Renewal Mechanism. Energies 2022, 15, 7036. https://doi.org/10.3390/en15197036
Li H, Xu Q, Wang S, Song H. Peak Shaving Methods of Distributed Generation Clusters Using Dynamic Evaluation and Self-Renewal Mechanism. Energies. 2022; 15(19):7036. https://doi.org/10.3390/en15197036
Chicago/Turabian StyleLi, Hongwei, Qing Xu, Shitao Wang, and Huihui Song. 2022. "Peak Shaving Methods of Distributed Generation Clusters Using Dynamic Evaluation and Self-Renewal Mechanism" Energies 15, no. 19: 7036. https://doi.org/10.3390/en15197036
APA StyleLi, H., Xu, Q., Wang, S., & Song, H. (2022). Peak Shaving Methods of Distributed Generation Clusters Using Dynamic Evaluation and Self-Renewal Mechanism. Energies, 15(19), 7036. https://doi.org/10.3390/en15197036