Article

Assessment of Thermal Comfort in Rooms Equipped with a Decentralised Façade Ventilation Unit

by
Ewa Zender-Świercz
1,*,
Marek Telejko
2,
Beata Galiszewska
1 and
Mariola Starzomska
1
1
Department of Building Physics and Renewable Energy, Faculty of Environmental, Geomatic and Energy Engineering, Kielce University of Technology, 25-314 Kielce, Poland
2
Department of Building Organization and Building Materials, Faculty of Civil Engineering and Architecture, Kielce University of Technology, 25-314 Kielce, Poland
*
Author to whom correspondence should be addressed.
Energies 2022, 15(19), 7032; https://doi.org/10.3390/en15197032
Submission received: 5 August 2022 / Revised: 20 September 2022 / Accepted: 21 September 2022 / Published: 25 September 2022
(This article belongs to the Special Issue New Advances in Building Physics and Renewable Energy)

Abstract

:
Thermal comfort affects not only the well-being of the occupants of a building but also the effectiveness of their learning and work efficiency. It can be disturbed if the ventilation airflow is increased when improving indoor air quality. When natural ventilation is used in the fall and winter period, the supply air temperature is low, resulting in a lack of thermal comfort. In existing buildings, there is often no place for mechanical ventilation; hence, decentralised façade ventilation units are increasingly used. The article presents an analysis of thermal comfort in rooms with this type of unit equipped with heat recovery exchangers of different efficiencies. Studies have shown that the alternating supply/exhaust airflow and the related unevenness of air streams flowing through the heat accumulator cause an inflow of low-temperature air, resulting in thermal discomfort. The highest value of the PMV index was −1.6, and the lowest was −4.1, which means that 54.8 to 100% of the occupants are dissatisfied with their thermal comfort. This means there is a need to change the construction of inlet/exhaust vents so that the stream of supply air is not directly parallel to the floor. In addition, the use of an air heater should be considered.

1. Introduction

People spend about 90% of their time indoors, so it is extremely important that they feel comfortable there [1]. In addition to general well-being, thermal comfort influences the effectiveness of learning and work performance [2,3]. Furthermore, a lack of thermal comfort causes “environmental stress”, causing a negative trend [4,5]. At the same time, it should be noted that thermal comfort is associated with energy and economic cost. The cost of HVAC systems (heating ventilation and air conditioning) includes 20 to 50% of the thermal comfort costs for an apartment and 30 to 70% for a single-family house [6]. For the remaining buildings, this share is even more dominant [6]. Most existing buildings are ventilated naturally. The study by Miranda et al. [7] found that to reduce the concentration of carbon dioxide (CO2) in educational facilities to acceptable and safe values, it was necessary to increase the air supply stream to 14 l/s per person. Considering, that in the case of natural ventilation, the outside air flows into the premises without heating it, this results in an increase in the level of dissatisfaction with thermal comfort from 25% to 72% when the outside temperature is below 6 °C. Alonso et al. [8] also drew attention to the increase in thermal discomfort during the improvement of indoor air quality (IAQ). They noticed that the application of increased efficiency of hybrid ventilation while reducing the carbon dioxide concentration to 400 ppm resulted in thermal discomfort lasting for 50% and, in some cases, even 80% of the hours of occupancy of rooms. Furthermore, a regenerative ventilation system [9] effectively reduces the concentration of CO2 and PM10 (particulate matter), while increasing thermal discomfort during its work. The use of individual ventilation with air supply in the desk shows the difference in the number of dissatisfied persons depending on the height of the exhaust location. In the case of exhaust at a height of 1.2 m, the percentage of dissatisfied people was higher at higher velocities of air supply, while at a height of 1.8 m, more people experienced discomfort at lower speeds [10].
Of course, maintaining thermal comfort in a room involves energy consumption. Therefore, it is important to properly design HVAC installations. Otherwise, users change the temperature controller settings to feel thermal comfort, which translates into increased energy consumption [11,12].
It should be mentioned that thermal comfort is strongly correlated with subjective thermal perception, which is influenced by health conditions, and thus the adaptability of the room users [13,14].
At the same time, air quality is also perceived to some extent through the prism of thermal comfort [2,15,16,17]. The lack of thermal comfort with a simultaneous increase in carbon dioxide concentration causes fatigue, drowsiness, lack of concentration, and malaise in students, who cannot work effectively in such rooms [18]. It cannot be clearly stated that one of the ventilation systems is a worse solution. In natural, mechanical, and mixed ventilation systems, unfavourable cold drafts may occur, which causes discomfort [19]. An example is the analysis by Shan et al. [20], who compared mixing and displacement ventilation and showed that mixed ventilation showed general discomfort from the draft, while displacement ventilation caused a feeling of draft and cold in the lower body, even more so because skin sensitivity is greater for cold than for heat [21]. Thermal comfort is primarily controlled by internal temperature [14,22,23]. It becomes particularly problematic in already existing buildings where, to reduce operating costs, the walls are insulated, and the joinery is replaced with sealing. It is related to the disturbance of airflow in natural ventilation systems, and its modernisation becomes a necessity. Usually, there is no place for mechanical ventilation or the installation of an air-handling unit and ducts. The elements that can solve this problem are decentralised devices mounted on the walls of the building and equipped with a reversible fan [24,25].
As Lamberti and others [26] pointed out in their extensive review of the literature, there is a lack of research covering the impact of various ventilation strategy solutions on thermal comfort, and in this regard, our article is part of the research gap, as it presents the impact of decentralised façade ventilation on the perception of thermal comfort. In the literature, one can find a description of the analysis carried out by Silva et al. [27], who investigated air quality and thermal comfort in buildings equipped with centralised and decentralised ventilation systems. However, their research covered a period of higher temperatures of 2–20 °C. In addition, thermal comfort was evaluated in a survey in which the respondents evaluated their satisfaction with only the temperature and humidity of the air in the rooms. A total of 11 respondents rated the temperature as neutral, and others as cold or slightly cool. Another study [28] on decentralised systems mounted on the façade of individual rooms involved units with two fans and a heat exchanger. In this case, the heat recovery was sufficient to maintain thermal comfort. In this type of device, constant airflow enables the maintenance of stable conditions of heat exchange between the supplied and exhausted stream, analogously to centralised systems. The subject of this article is the devices with airflow, which is not constant and changes when changing the flow direction—supply/exhaust. This solution, called decentralised façade ventilation units, can be equipped with a reverse fan or four dampers that change the flow direction of the supply or the exhaust [29].
The subject of scientific research [30,31] was also decentralised ventilation installed on walls, but in this case, they were mini units with a rotary exchanger, and the authors focused on their thermal properties and not on the perceptions of room users.
The purpose of this article is to evaluate thermal comfort in rooms equipped with decentralised façade ventilation units with reverse supply and exhaust. The novelty of this study is the analysis of thermal comfort when different heat recovery exchangers are used.

2. Materials and Methods

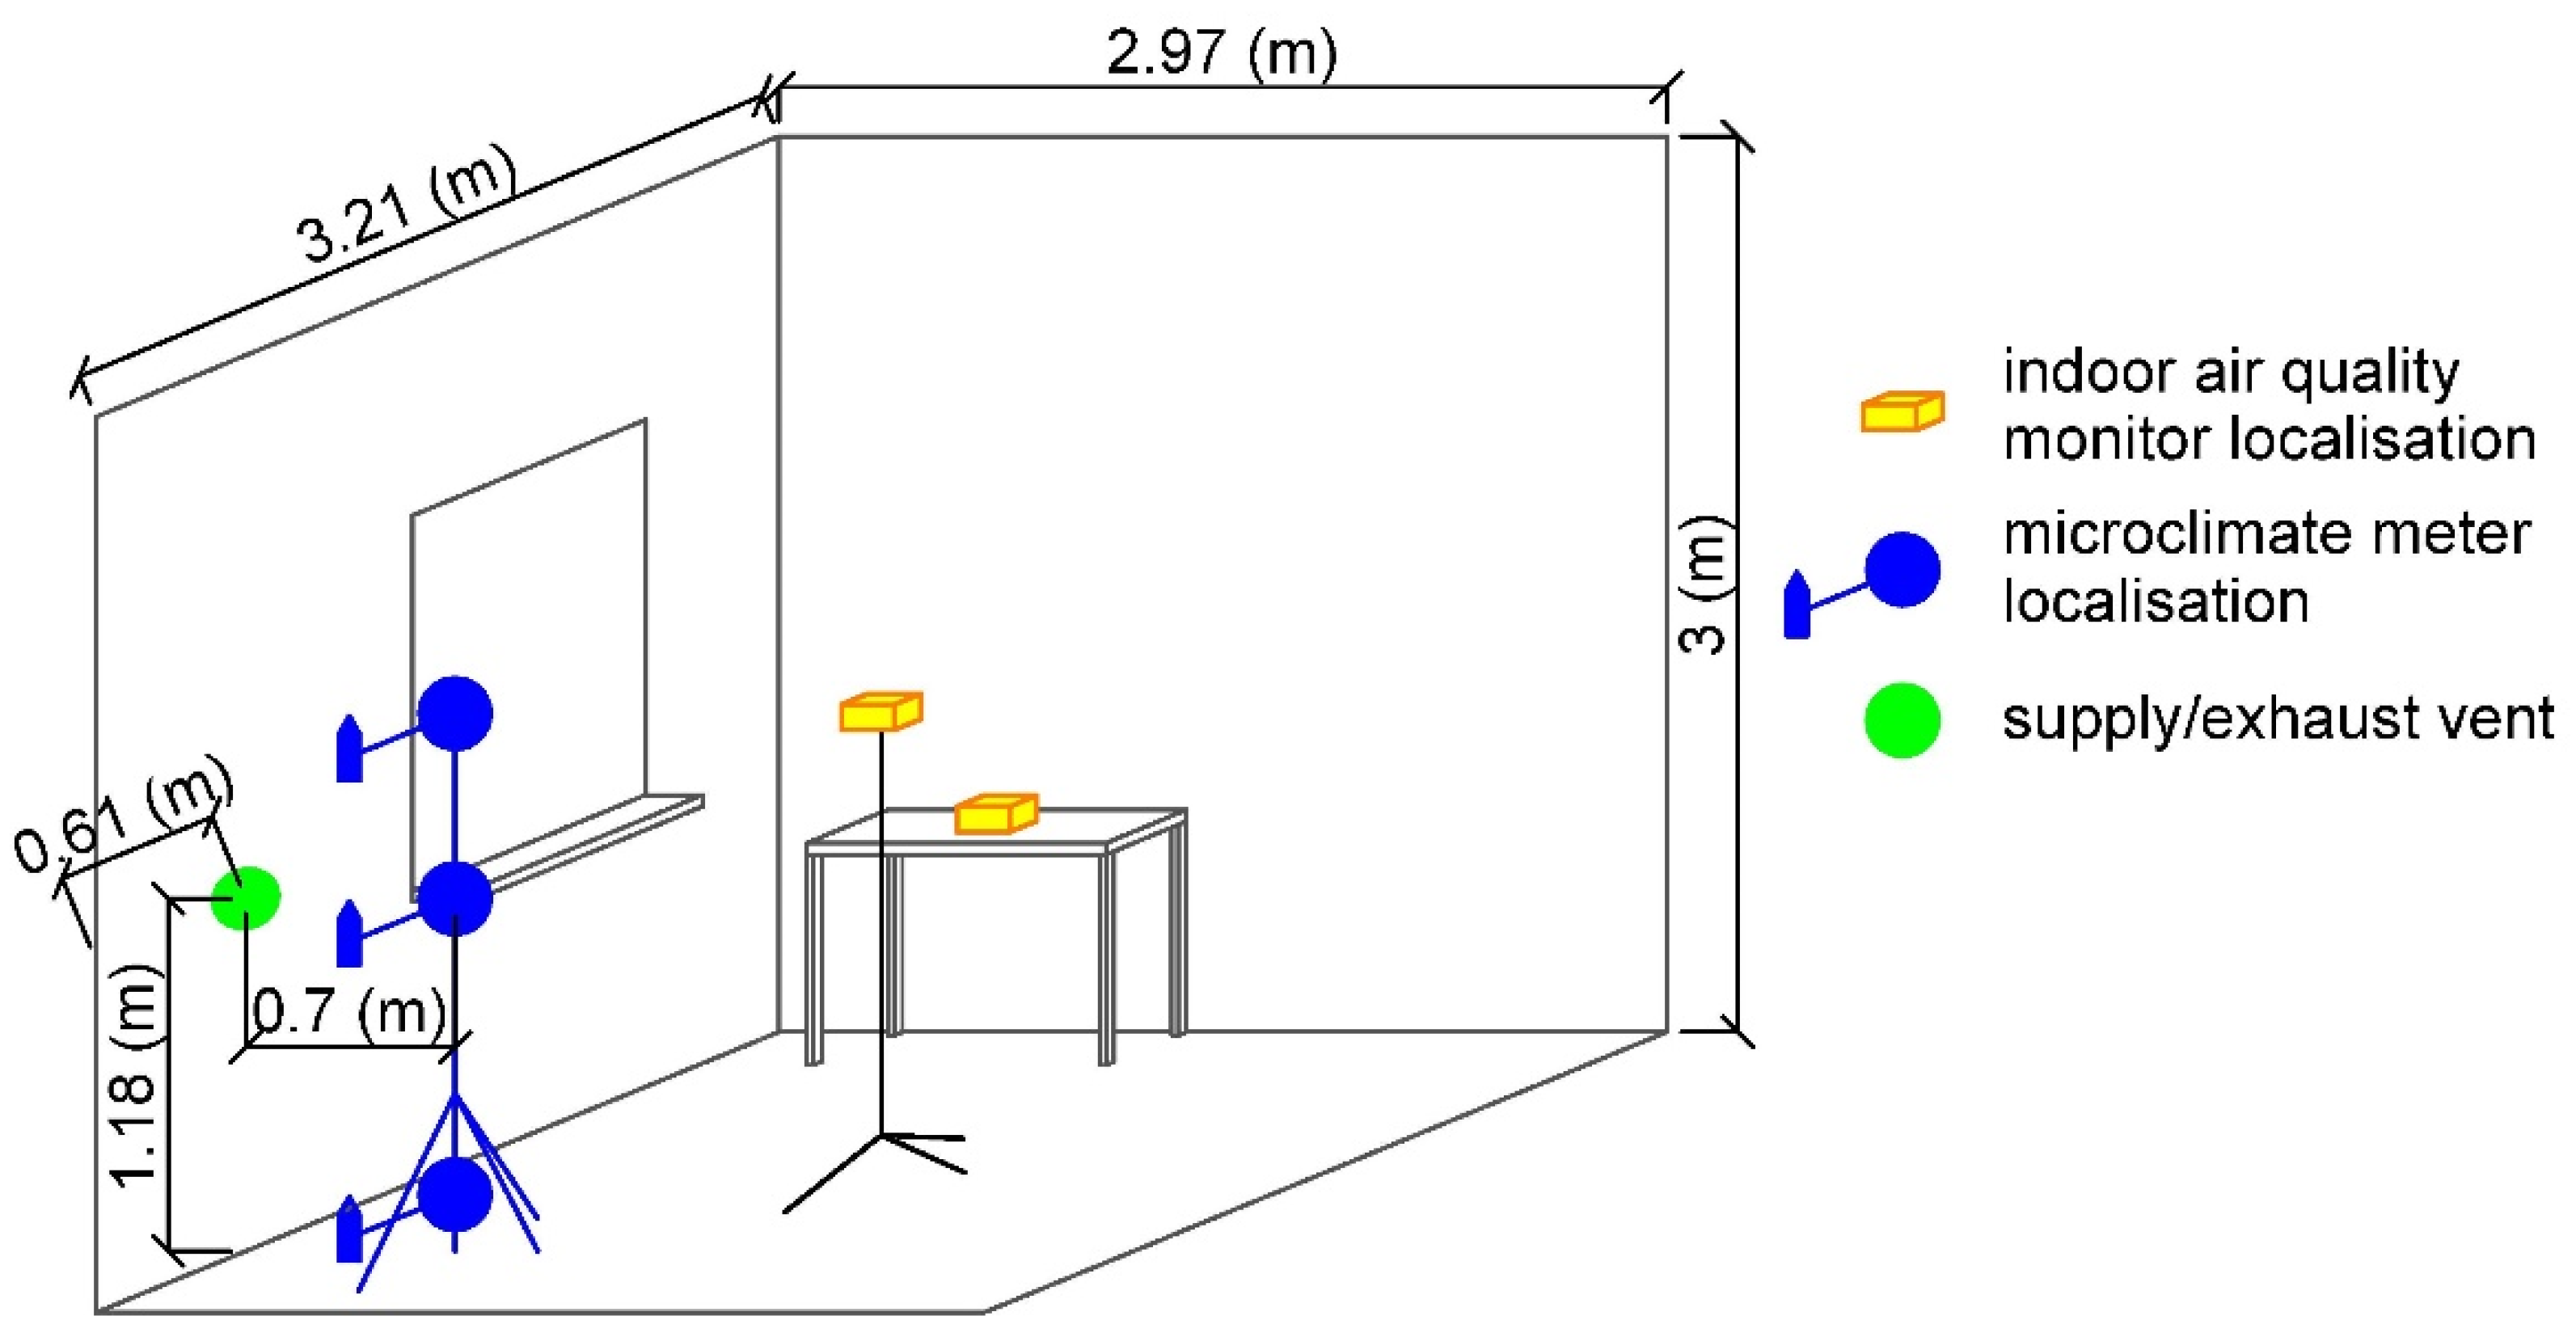
2.1. Characteristics of Research Subject

The analysis covers a room equipped with a decentralised façade unit to ventilate the rooms (Figure 1). The building is in Poland in a temperate climate zone, with low temperatures in winter (−20 °C to +10 °C). The dimensions of the analysed room are 2.97 × 3.21 m, with a height of 3 m. The heat transfer coefficient for the exterior walls is 0.2 W∙m−2∙K−1, according to the legal regulations in force at the time the building was constructed. The analysis covers the period from November 2017 to March 2018.

2.2. Methodology of Calculation

In the article, the predicted mean vote (PMV) factor was used to assess thermal sensations, as it is the most common in modelling thermal comfort [14,32,33]. Other indicators, such as PET and SET, show the temperature values for specific air parameters, with the specific thermal insulation of clothes [34]. Meanwhile, the PMV considers the six most influential variables: air temperature, mean radiant temperature of surrounding partitions, air velocity, relative humidity of indoor air, metabolic rate, and clothing insulation. It is mature, standardised, and agreed upon by the scientific community factor. The procedure specified in the PN-EN ISO 7730 standard [35] was used to determine the PMV and predicted percentage of dissatisfied (PPD) factors (Equations (1) and (2)).
PMV = 0.303 · e 0.036 · M + 0.028 · { M W 3.05 · 10 3 · 5733 6.99 · M W p a 0.42 · M W 58.15 1.7 · 10 5 · M · 5867 p a 0.0014 · M · 34 t a 3.96 · 10 8 · f cl · t cl + 273 4 t r + 273 4 f cl · h c · t cl t a }  
where:
t cl = 35.7 0.028 · M W I cl · { 3.96 · 10 8 · f cl · t cl + 273 4 t r + 273 4 + f cl · h c · t cl t a } ° C f cl = 1.05 + 0.645 · I cl   f o r > 0.078 f cl = 1.05 + 0.645 · I cl   f o r   I cl 0.078 h c = 2.38 · t cl t a 0.25   f o r   2.38 · t cl t a 0.25 > 12.1 · v ar 12.1 · v ar   f o r   2.38 · t cl t a 0.25 12.1 · v ar
where PMV is the predicted mean vote, M is the metabolic rate (W∙m−2), W is the external work ((W∙m−2), Icl is the thermal resistance of clothing (m2∙°C∙W−1), fcl is the ratio of a person’s surface area while clothed to person’s surface area while nude, ta is the air temperature (°C), tr is the mean radiant temperature (°C), var is the relative air velocity (m∙s−1), pa is the partial water vapour pressure (Pa), and tcl is the surface temperature of clothing (°C). The air velocity in the formula is the relative air velocity that included the walking velocity defined in Annex C of the PN-EN ISO 7730 standard [35].
The PPD provides information on thermal discomfort by predicting the percentage of people who may feel too hot or too cold in each environment.
PPD = 100 95 · exp 0.03353 · PMV 4 0.2179 · PMV 2
The levels of thermal insulation of clothing were selected as the most appropriate for office occupants in the autumn and winter period (underwear, long-sleeve blouse, pants or skirt with pantyhose, sweater, and shoes) with a value of 0.86 clo [35]. The metabolic rate for a level of activity of sitting posture can be approximately 1.2 met (70 W/m2) [35].

2.3. Characteristics of Used Measurements

The air velocity in the room was measured with a microclimate meter (Table 1) with three anemometers placed at three levels: the feet, abdomen, and head. The air velocity was recorded in the device with a time step of 5 s. The air temperature was measured while the decentralised façade ventilation unit was operating without a heat recovery exchanger, using an air quality monitor (Table 2). The volumetric flow of the supply and exhaust air was measured using a balometer (Table 3).

2.4. Conditions for Research

The air temperature in the room during the operation of the decentralised façade ventilation unit in the supply cycle, without heat recovery, was 20 °C in the central point of the room, 20 °C in the workplace, and −6 °C at 70 cm from the supply/exhaust vent.
The article presents an analysis of thermal comfort in the case of using heat recovery with 7 variants (Table 4). The first variant is the most popular ceramic storage exchanger. The next three exchangers are made of aluminium cylinders filled with jojoba oil. Their diameters are equal to 10 mm, 25 mm, and 40 mm, respectively. The last three exchangers are made of aluminium cylinders filled with coconut oil. Their diameters are the same: 10 mm, 25 mm, and 40 mm.
For various heat recovery efficiencies, the air supply temperature was calculated according to the procedure described in PN EN 13141-8 [36], which allowed for the calculations of the PMV and PPD values. An analysis was carried out for air supply/exhaust cycles of 10 min and 2 min.

3. Results and Discussion

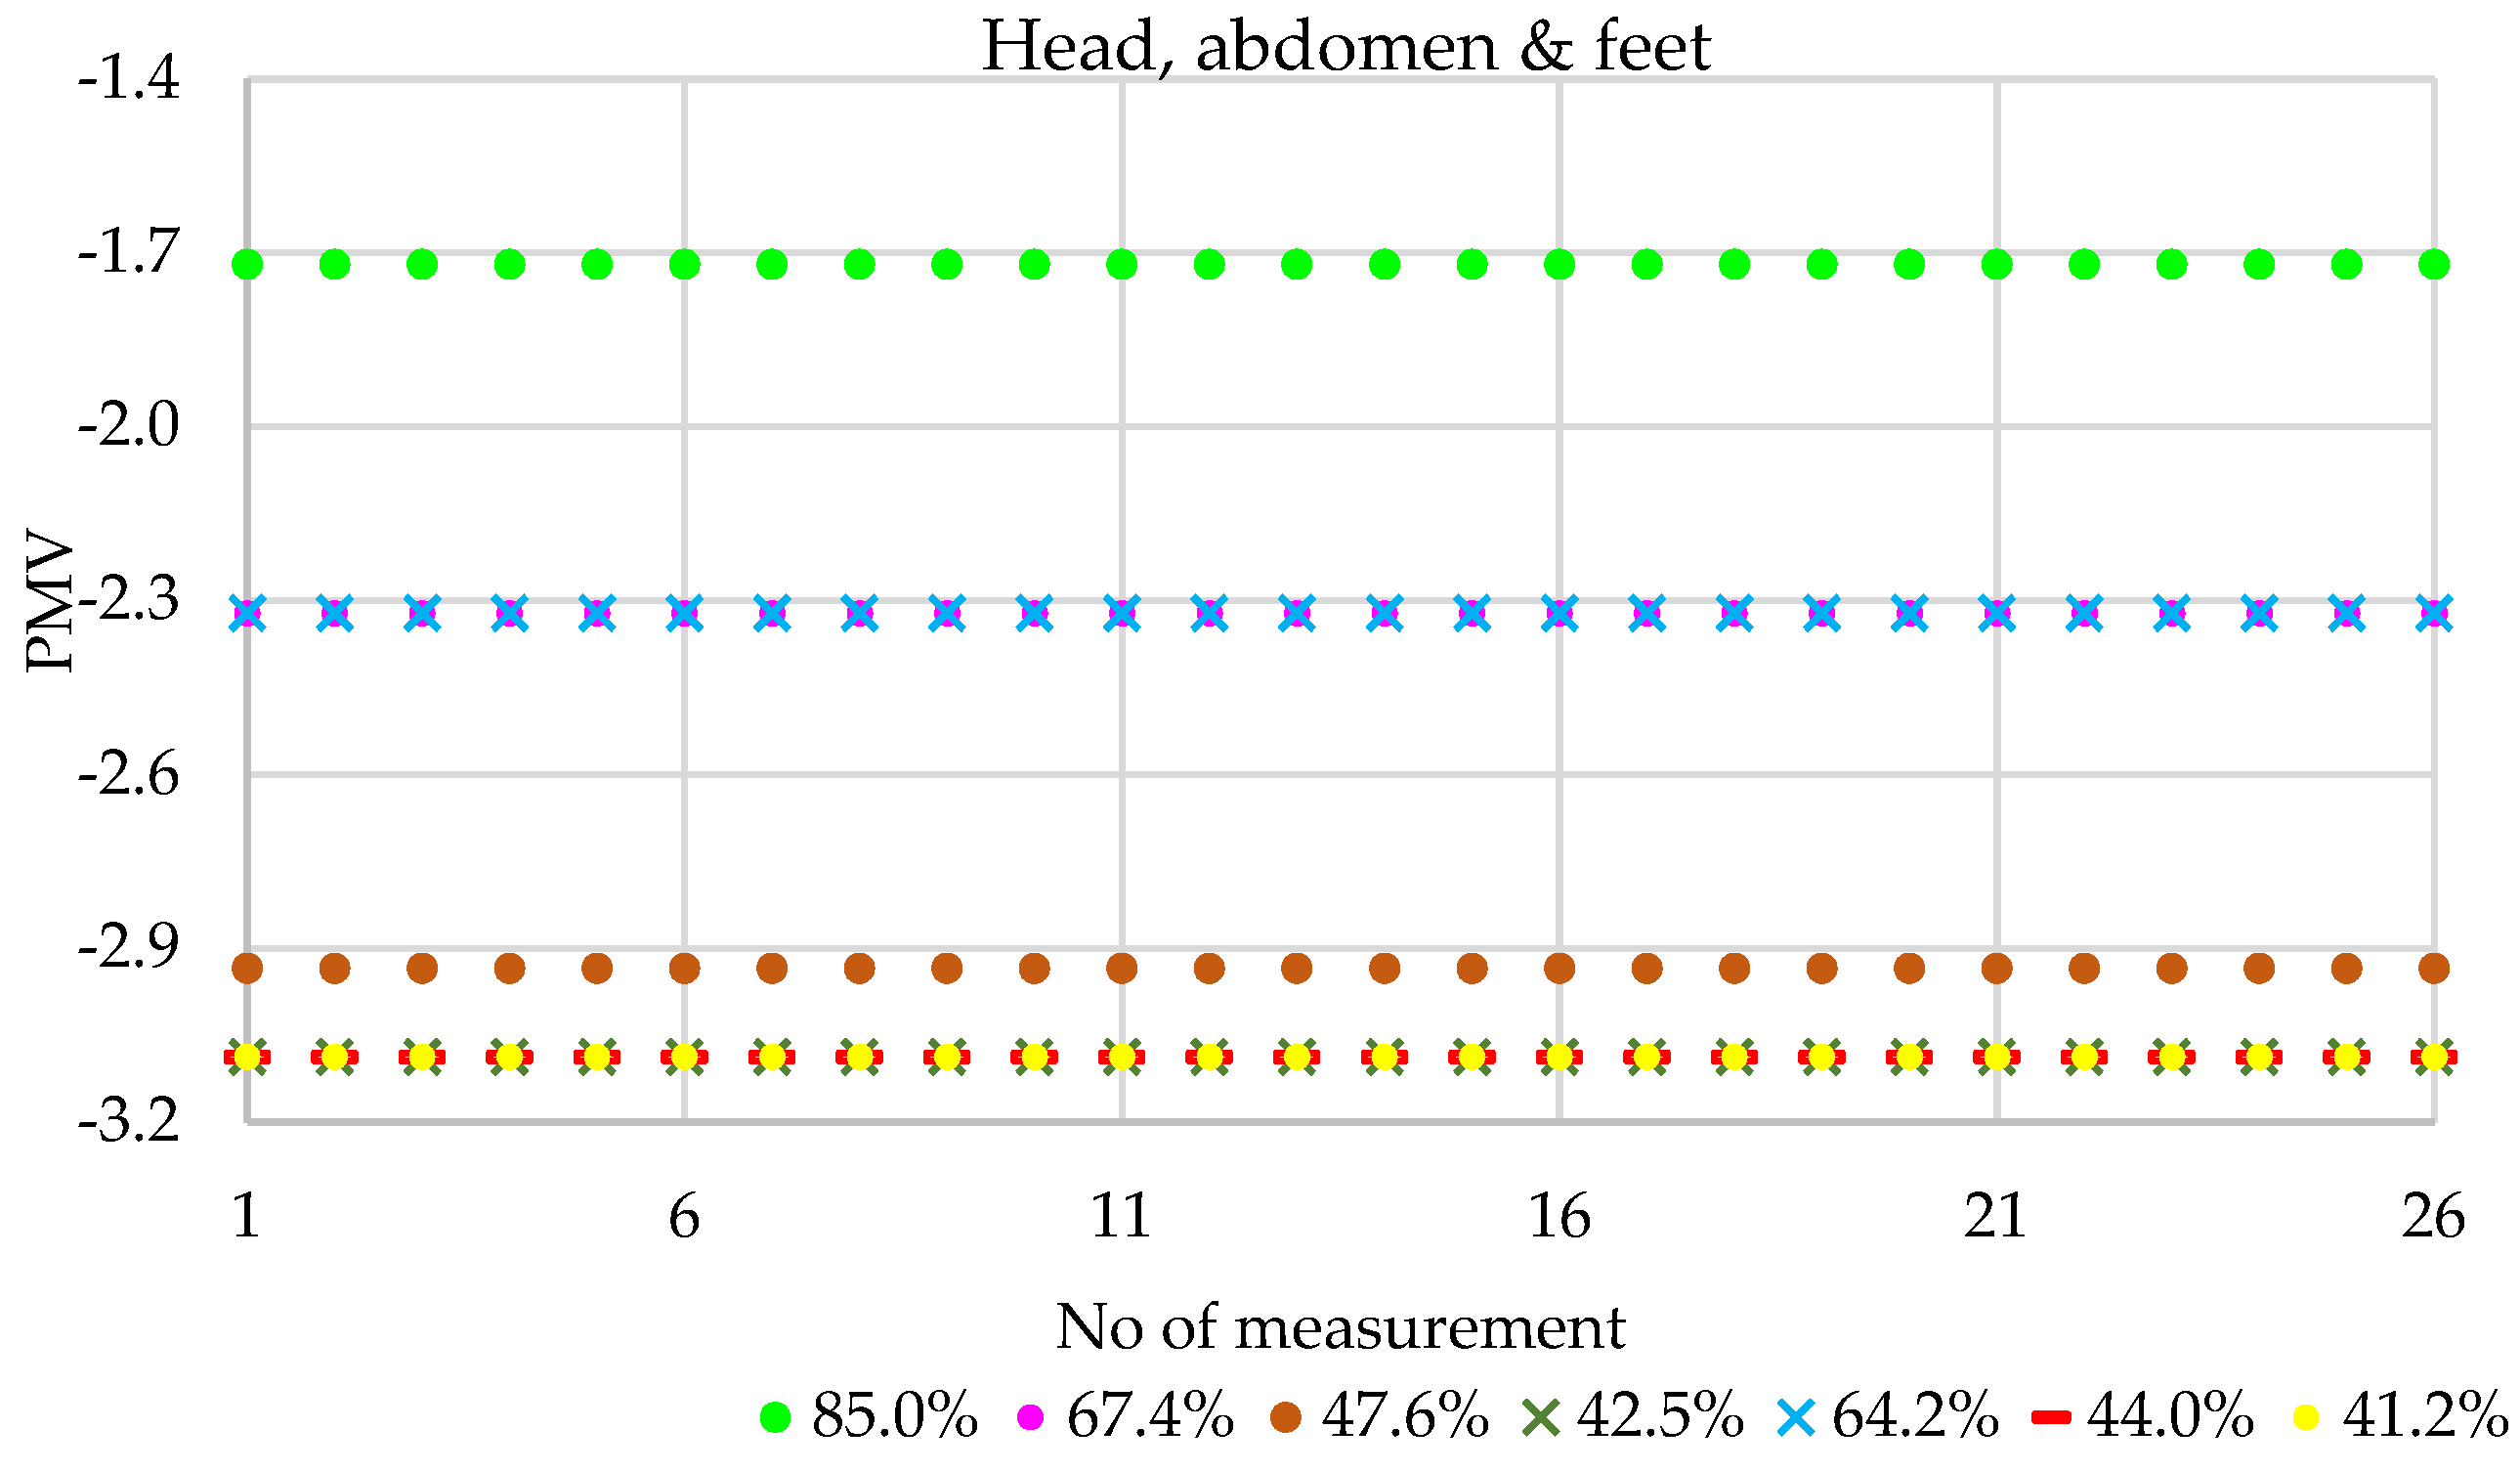
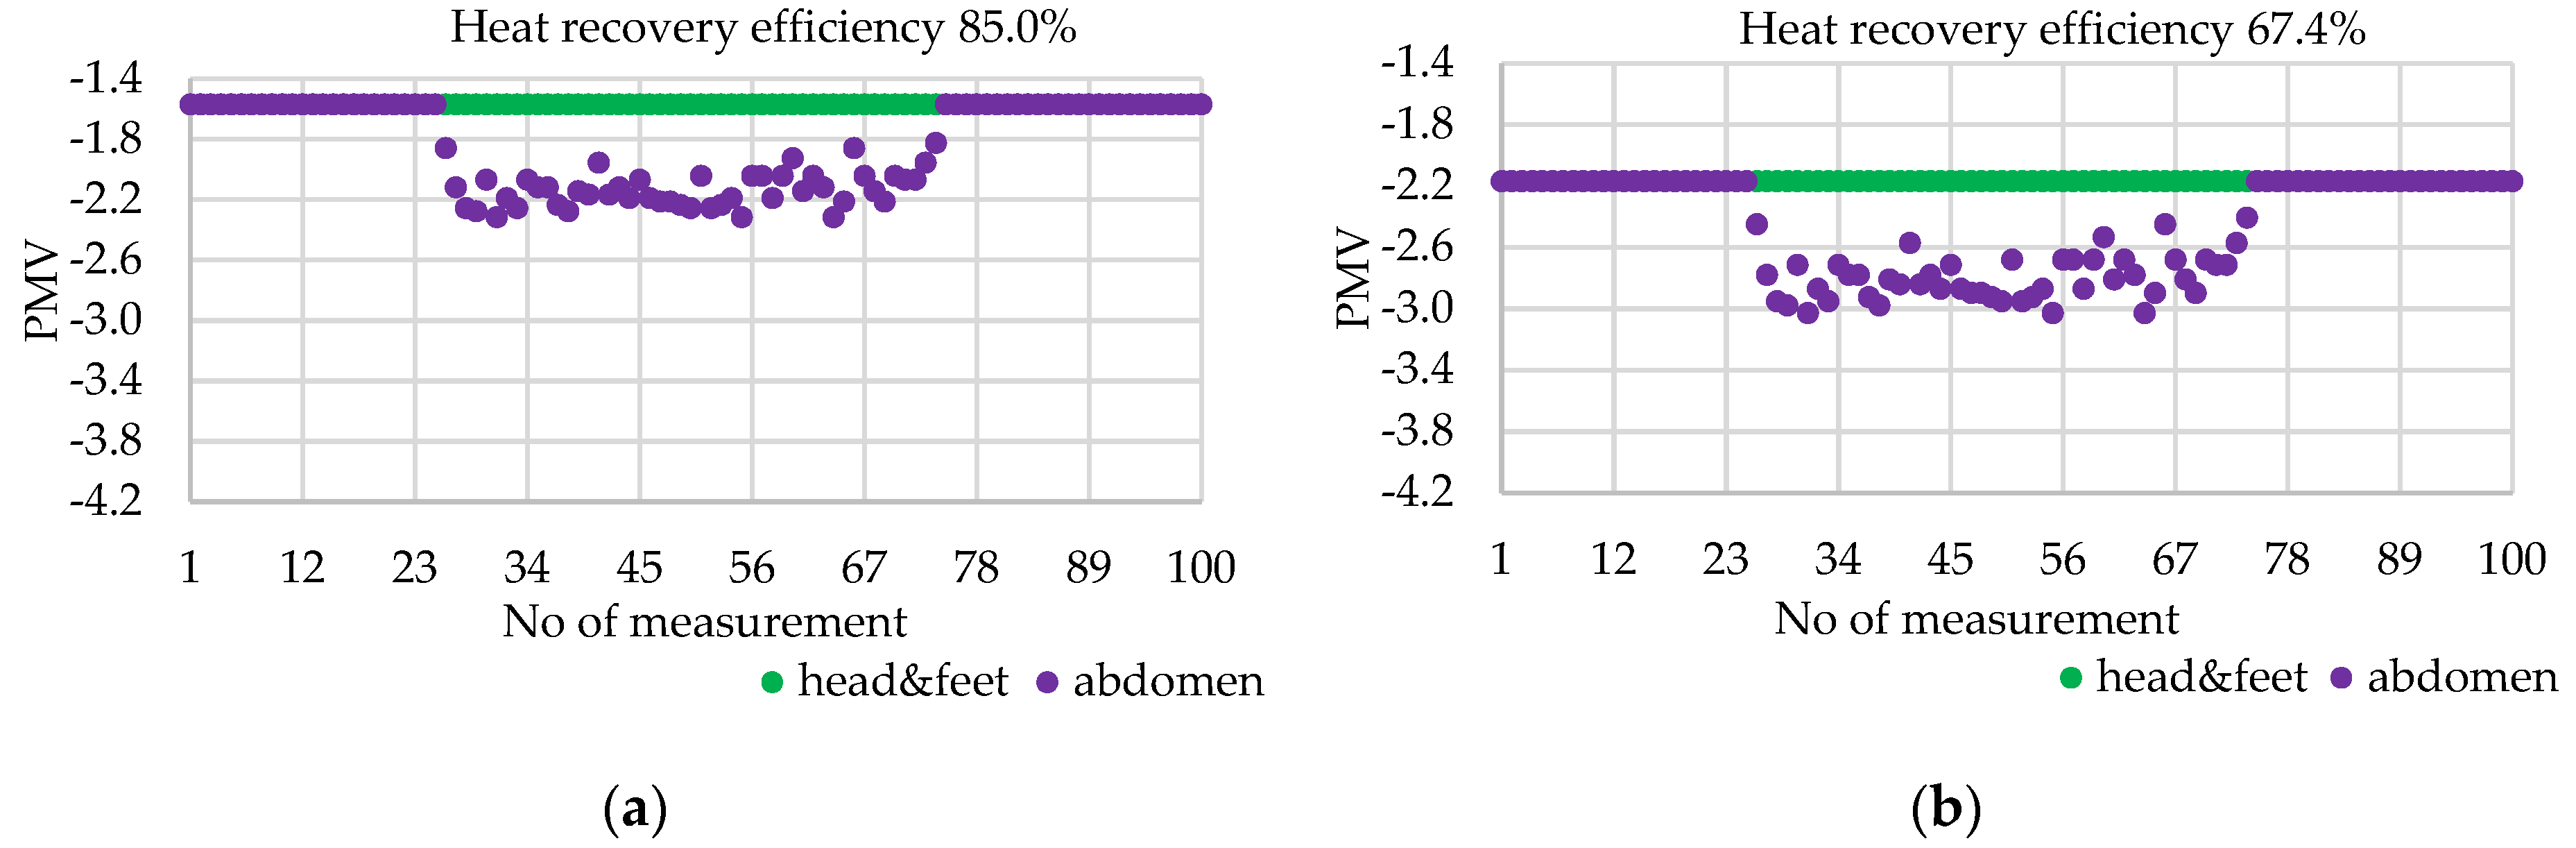
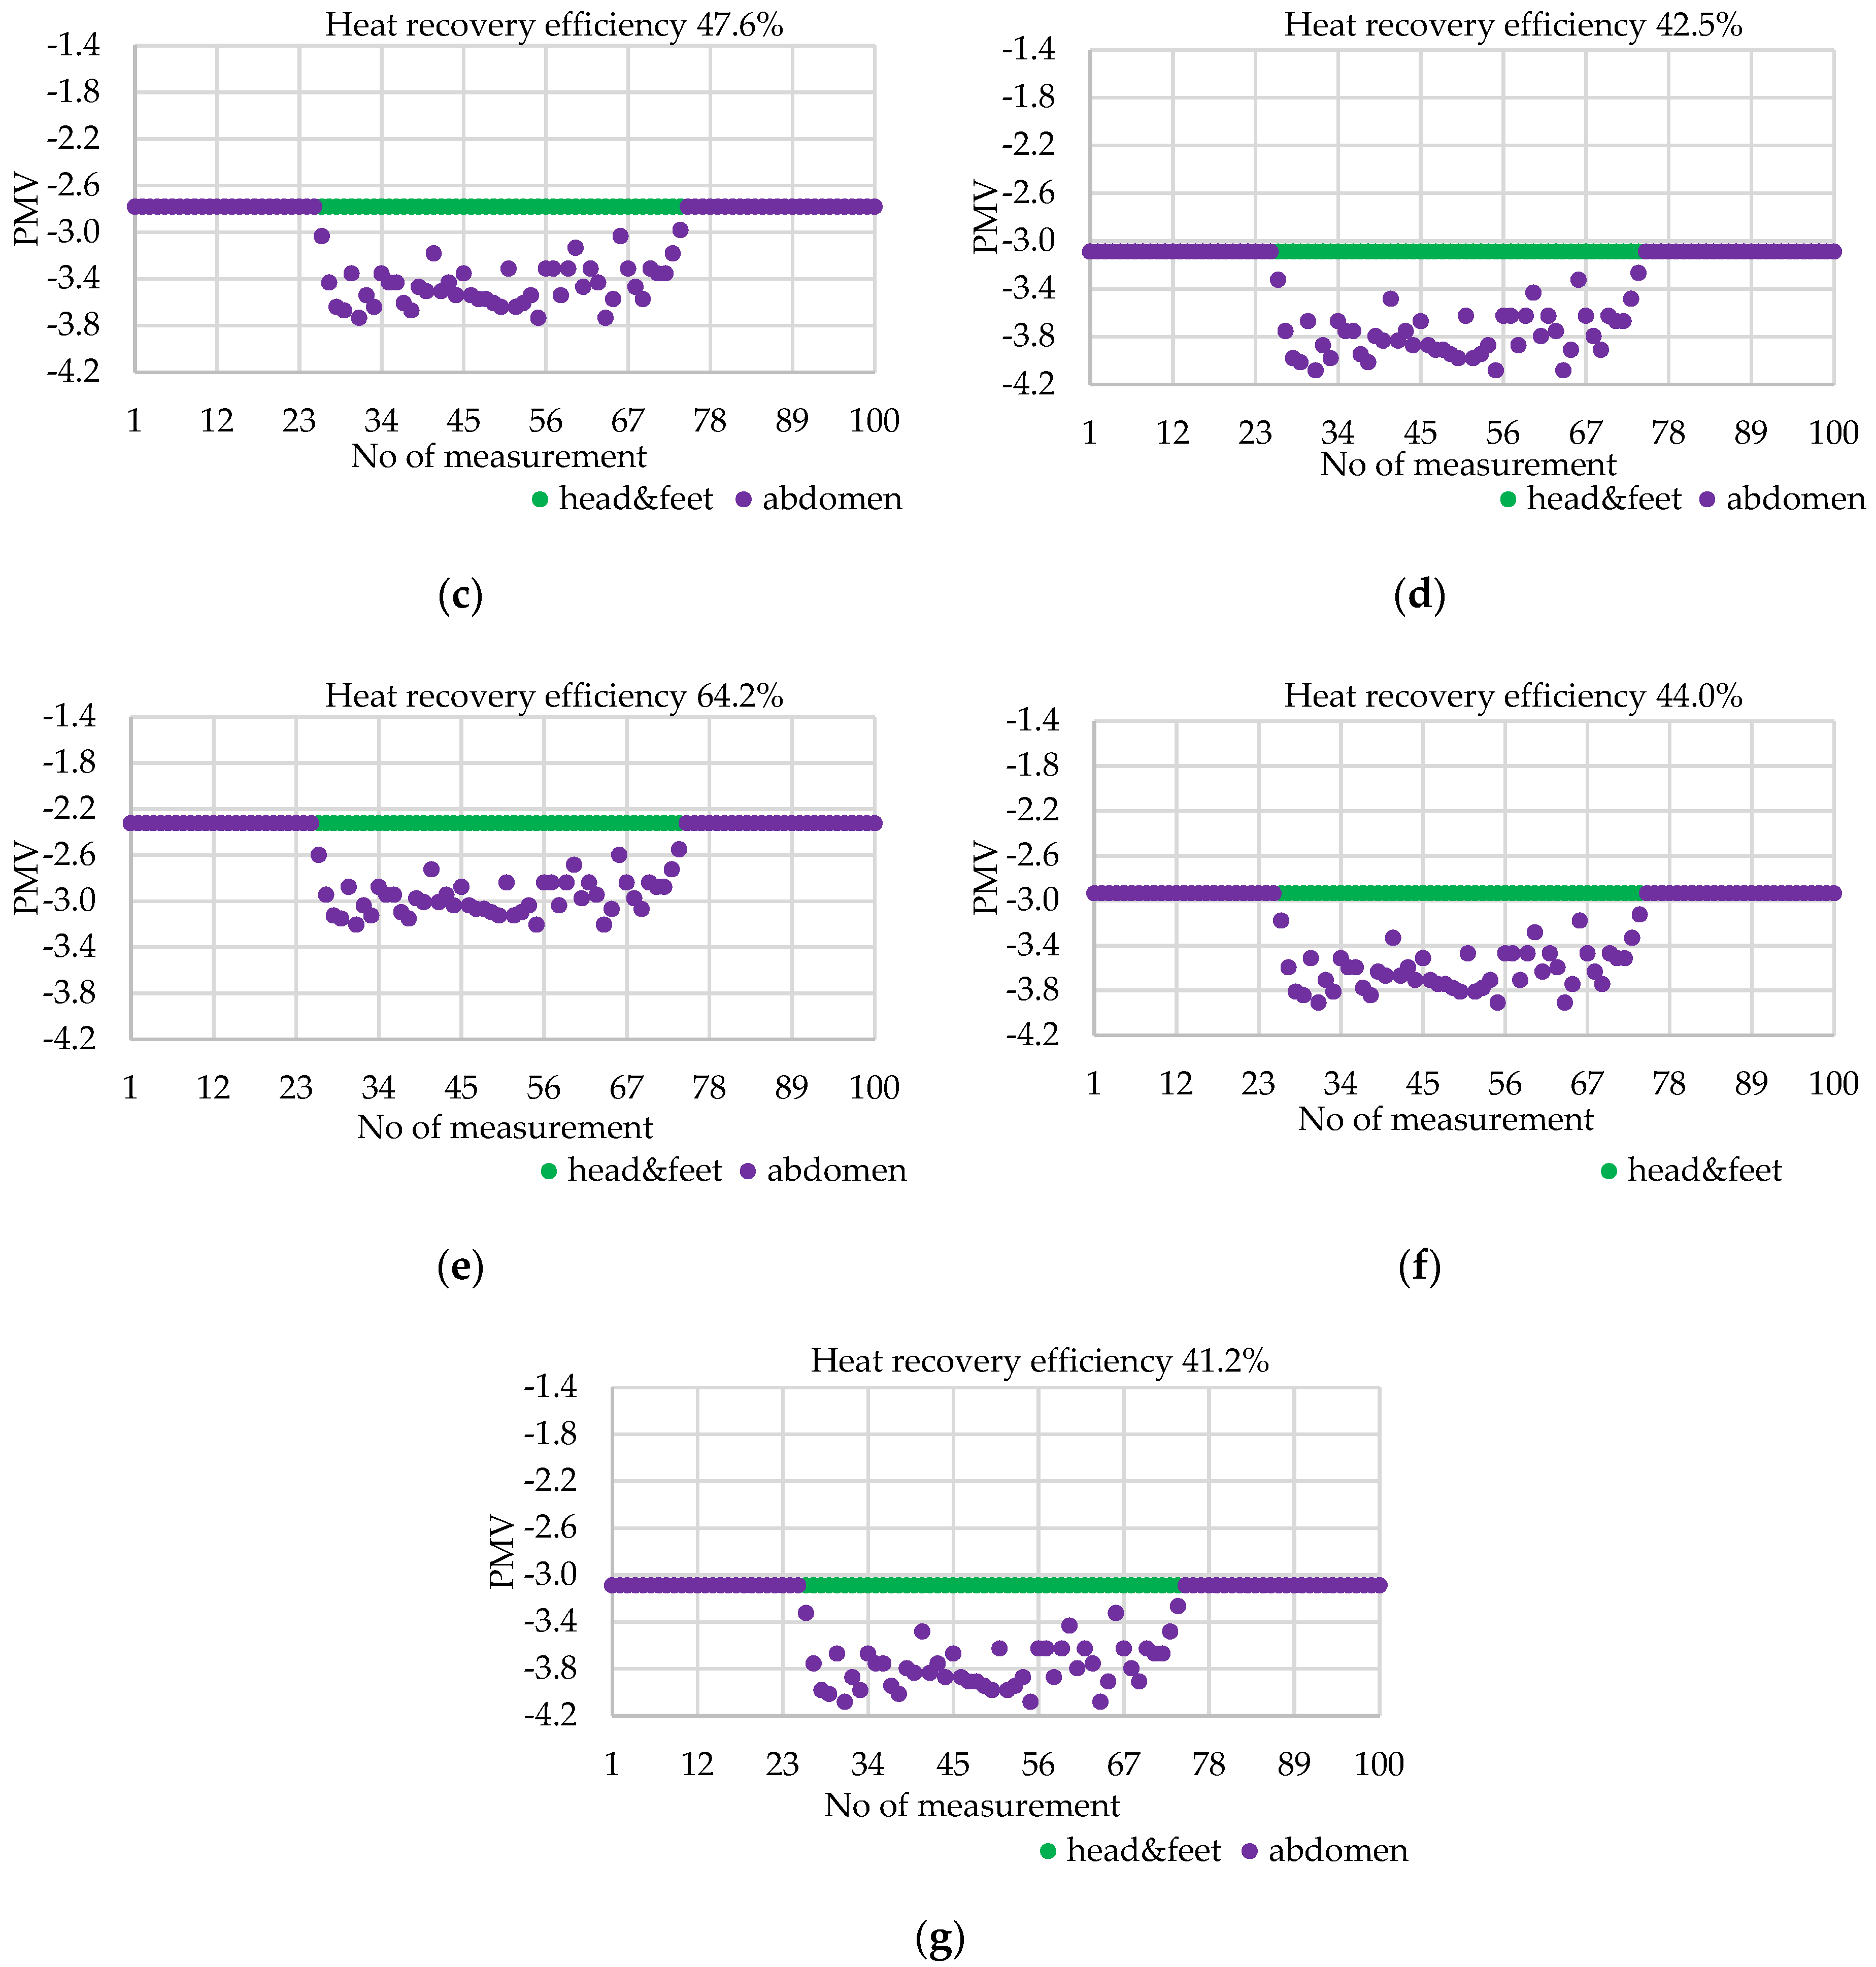
3.1. Experimental Studies

The results show that in a room equipped with the decentralised façade ventilation unit without a heat recovery exchanger or an air heater (Figure 2) [29] during the cycle, 2 min and 10 min did not achieve thermal comfort at 70 cm from the supply/exhaust vent. In the case of a shorter cycle, the thermal discomfort was the same at the feet, abdomen, and head. For this reason, in Figure 2a, the lines that show the course of the values of the PMV index coincide. In a longer cycle, the greatest discomfort was felt at the abdomen, i.e., at the height of the supply/exhaust vent.
The use of heat recovery allows thermal discomfort to be reduced both during the 2-min cycle and during the 10-min cycle (Figure 3 and Figure 4). In a 2-min cycle, the greatest discomfort will be felt with heat recovery rates of 42.5% and 44%. The PMV index will be −3.1 for all three parts of the body. The lowest thermal discomfort (PMV −1.7) was observed for a ceramic exchanger with an efficiency of 85%. However, such a low value of the PMV index means that the room was also outside the categories of thermal comfort rooms in this case.
Similarly, for a 10-min cycle, the room was not classified as thermally comfortable. In this case, it is clearly visible that the discomfort in the abdomen was greater than in the feet and head (at the feet and head levels, the discomfort was the same). This was due to the longer duration of airflow with the higher speed in the 10-min cycle than in the 2-min cycle. The maximum value of the PMV index (−1.6) was lower than for the shorter duration of the supply/exhaust cycle and, as in the first case, was obtained for the highest efficiency of the heat recovery exchanger. The lowest PMV index value (−4.1) was achieved with the lowest efficiency values of the heat recovery exchangers in the abdominal area. For the feet and head, the lowest PMV index value was similar to the 2-min cycle and equal to −3.1.
The PMV values obtained resulted in high PPD values—62.8% to 99.4% for a 2-min cycle, and 54.8% to 100% for a 10-min cycle, which means there was no thermal comfort for most room users located near the supply/exhaust vent (70 cm).

3.2. Discussion

It should also be noted that the high recovery efficiency is the maximum that can be obtained under laboratory conditions. In the case of devices with alternating supply and exhaust, due to the variable volumetric flow of supply and exhaust air flowing through the accumulation exchanger, this efficiency will be possible only in a short period of operation of the decentralised façade ventilation unit. This is confirmed by the efficiency values of other exchangers and the studies by Merzkirch et al. [25] and Han and Kwon [37]. This clearly indicates the need for an air heater. In addition, the supply air stream should not be directly parallel to the floor, which will reduce the air velocity around the room users and allow the supply air to mix with the air from the room, which will prevent the occupants from experiencing low-temperature airflow around them. This indicates a need to change the design of the vent. Merckx et al. [38] pointed out that only upward vertical airflow does not cause drafts and allows comfortable air velocities in the room.
Mikola and others [39] reached similar conclusions, comparing mini units with a crossflow exchanger and wall-mounted devices with a reversible fan and a ceramic mass for heat recovery. They showed that the device with alternating supply/exhaust during periods of low outdoor temperatures achieved air supply temperatures close to the outdoor temperature. Their research covered devices placed on different floors; hence, they concluded that the large differences in the supply and exhaust volumetric airflow rates resulted from the natural distribution of overpressure and negative pressure in multi-storey buildings. The analysis carried out for the purposes of this article concerns a single-story building. Although in the case of a one-storey building, the influence of the pressure distribution is not so important for the correct operation of the devices, our research confirms that the moment of switching the supply/exhaust air is extremely important for the supply temperature value, and the shorter the cycle, the lower the temperature of the air flowing into the room due to reduced heat recovery.
According to the analysis [40] of thermal comfort in naturally ventilated rooms, due to the negative influence of the buoyancy force, the legs of users are the most exposed to discomfort. At the same time, the authors recognised that air temperature plays a key role in the value of the PMV index. In our investigation, we analysed a device equipped with a fan, and this resulted in higher values of the velocity of air flowing through the room. In this case, the temperature was no longer the most important parameter. The air velocity started to play a significant role in the vicinity of the supply air element. While in the case of natural ventilation, the location of the supply air element affects the speed of the flowing air without affecting the value of the PMV index, in the case of mechanical ventilation, the vent should be selected very carefully, and the air stream should be directed upward. De Faria [41] et al. studied the influence of the operating temperature and air velocity on thermal comfort. Although the research was carried out for the summer period, they showed that an increase in air velocity caused a slight feeling of chill even at temperatures below 26 °C. This means that the air velocity will be even more important in rooms in the winter period, when, according to PN EN 16798 [42] and CIBSE [43], the comfort temperature is 19–21 °C, suitable for people who lead a sedentary lifestyle.
The PMV index range for overall comfort is recommended as −0.5 to 0.5 in the ASHRAE 55 standard [44], and A. Lan et al. [45] suggest that the PMV comfort range at work should be between −0.5 and 0 to avoid productivity loss. The analysis presented in the article showed a PMV value even of −4.1. Therefore, the percentage of those dissatisfied with the thermal comfort at 70 cm from the supply/exhaust vent will range from 54.8% to 100%. This is due to the non-uniformity of the supply and exhaust airflows in decentralised façade ventilation units, which leads to a lack of stability in the amount of heat recovered. This leads to a low supply air temperature. In addition, the airflow parallel to the floor will not mix the lower temperature air sufficiently with the air in the room and will result in higher air velocity around the occupants.
At the same time, it should be noted that the PMV does not consider many factors, which often causes an overestimation of the thermal feelings of the building users. The authors [2,33,46,47,48,49,50] indicated the inaccuracy of the PMV index as a criterion to evaluate thermal comfort, noting that analyses should consider the influence of the population density, gender, age, and socio-economic background, whereas the appropriate combination of natural and mechanical ventilation will ensure thermal comfort and IAQ. This is extremely important due to the fact that in the autumn and winter period, natural ventilation alone does not guarantee thermal comfort, and continuous mechanical ventilation is associated with high energy consumption [2]. Machine learning and dynamic building simulations are becoming more and more common [51,52]. This approach to thermal comfort will also allow it to be included in the risk management of the construction process [53,54,55]. Scientists [56] suggested using an analysis of the speed of activation of decentralised systems and an analysis of thermal sensation based on the determination of skin temperature by thermal vision cameras to assess thermal comfort and control HVAC systems in buildings.
The authors [57] investigated the influence of the location of the supply and exhaust elements on energy consumption and thermal comfort. In their analysis, they placed the supply and exhaust elements on the ceiling of the room. They analysed the location of the exhaust in relation to the supply. This showed that the location of the supply on the same side of the room as the exhaust was the most favourable from the point of view of thermal comfort and energy consumption. At the same time, the location of the exhaust air vent on the opposite side of the room was associated with a lack of thermal comfort and the highest level of pollution. This is an important consideration for decentralised façade ventilation units with alternating supply and exhaust, as they are intended to be installed in pairs on opposite external walls. Studies of various ventilation systems were also carried out by Ferdyn-Grygierek et al. [58]. They studied natural ventilation and centralised VAV and CAV systems. They noticed that opening windows to ventilate rooms increased the demand for heat while improving thermal comfort. However, it should be remembered that, in this case, a large amount of pollutant air flowed into the room. With mechanical CAV systems, the demand for energy increased to maintain an appropriate level of thermal comfort. VAV systems provided lower energy consumption with a similar level of thermal comfort. However, the authors did not consider the influence of the location of the vents on the feeling of thermal comfort in their study.

3.3. Statistical Analysis

The measured data were used to perform a statistical analysis of thermal comfort in a room with a decentralised façade ventilation unit with supply/exhaust cycle times of 2 min and 10 min. A one-way ANOVA was carried out for the characteristic of the PMV index. The grouping variables were the efficiency of heat recovery, with values of 85.0%, 67.4%, 47.6%, 42.5%, 64.2%, 44.0%, and 41.2%.
The zero hypothesis stating the equality of the average values of the PMV index characteristic was verified on the basis of all combinations of the factors’ levels. The F statistic was used for this purpose (the ratio of intergroup variance to intragroup variance). The results of the completed calculations were used to verify the hypothesis, stating the equality of average values of the PMV index characteristic. The p value obtained for the F statistic in a completed test, less than 0.0001, allows us to state that there were at least two groups where the average values of the PMV index characteristic differed. This allowed us to apply the Tukey multiple comparison method for both supply/exhaust cycle times.
Table 5 contains the calculation results for the PMV index characteristic, carried out according to the Tukey method in groups matching the levels of 85.0%, 67.4%, 47.6%, 42.5%, 64.2%, 44.0%, and 41.2% of the efficiency of heat recovery factor for a 2-min supply/exhaust cycle.
Table 5 shows that the highest average PMV index value should be expected for the 85% efficiency of heat recovery rate and the lowest for the 42.5%, 44.0%, and 41.2% efficiency of heat recovery rates.
The data in Table 6 confirm the conclusions derived from Table 5. The 95% confidence intervals for the pairs of the efficiency of heat recovery rates—67.4% and 64.2%; 42.5% and 44.0%; 42.5% and 41.2—includes zero, which means that the differences between the average values for each of those pairs are not statistically significant. None of the achieved 95% confidence intervals for the other pairs includes zero, which means that the differences between the average values for each of the pairs are statistically significant. There is the possibility of the quantitative determination of the differences between the average values using 95% confidence intervals. For example, for the difference in the average values in the groups matching the efficiency of heat recovery rates of 85.0% and 67.4%, the extremes are 0.56 and 0.64. Each value within the interval with specified extremes is treated equally as a potential true value of the analysed difference. Thus, it should be accepted that an average PMV index for the efficiency of heat recovery rate of 85.0% may exceed the average PMV index for the efficiency of heat recovery rate of 67.4% by either 0.56 or 0.64.
Table 7 contains the calculation results for the PMV index characteristic, carried out according to the Tukey method in groups matching the levels of 85.0%, 67.4%, 47.6%, 42.5%, 64.2%, 44.0%, and 41.2% of the efficiency of heat recovery factor for a 10 min supply/exhaust cycle.
Table 7 shows that the highest average PMV index value should be expected for the 85% efficiency of heat recovery rate and the lowest for the 42.5% and 41.2% efficiency of heat recovery rates.
The data in Table 8 confirm the conclusions derived from Table 7. The 95% confidence intervals for the pair of the efficiency of heat recovery rates of 42.5% and 41.2% includes zero, which means that the differences between the average values for those pairs are not statistically significant. None of the achieved 95% confidence intervals for the other pairs includes zero, which means that the differences between the average values for each of the pairs are statistically significant. There is the possibility of the quantitative determination of the differences between the average values using the 95% confidence intervals. For example, for the difference in the average values in groups matching the efficiency of heat recovery rates of 85.0% and 67.4%, the extremes are 0.58 and 0.63. Each value within the interval with the specified extremes is treated equally as a potential true value of the analysed difference. Thus, it should be accepted that an average PMV index for the efficiency of heat recovery rate of 85.0% may exceed the average PMV index for the efficiency of heat recovery rate of 67.4%, by either 0.58 or 0.63.

3.4. Limitations of the Study

The findings of this study must be seen in light of some limitations. They are a simplification of the methodology. There was a simple calculation of the PMV index. The biases in the PMV index were shown by Humphreys and Nicol [59]. The PMV index takes into account metabolism but does not take into account the fact that people accustomed to warmer climates may have a lower metabolic rate for the same activities. Likewise, clothing typical of hot climates may permit a greater-than-expected diffusion of air and moisture. Moreover, the method with the use of the PMV does not take into account acclimatisation to the prevailing conditions, and thus, the tolerance to the thermal conditions in the room. Moreover, the methodology does not take into account changing weather patterns. In future works, it would be worth designing a model on feeling thermal comfort using computer fluid dynamics (CFD). However, as a preliminary study, the proposed model was sufficient to spot the problem of obtaining thermal comfort in rooms equipped with decentralised façade ventilation units. Theoretical considerations are important because of the costs of experiments. Our research shows a problem with thermal comfort; therefore it would be beneficial to conduct field research, for example, using a thermal manikin, in the future.

4. Conclusions

The analysis carried out showed that:
  • Regardless of the type of heat recovery used in the decentralised façade ventilation unit, users experienced discomfort caused by the feeling of being slightly cool or cold;
  • The obtained values of the PMV index resulted in the percentage of those dissatisfied with the feeling of thermal comfort increasing from 54.8% to 100%.
The huge number of those dissatisfied is a consequence of the non-uniformity of the supply and exhaust airflows in decentralised façade ventilation units. In addition, airflow parallel to the floor also has a negative impact on the feeling of comfort.
The statistical analysis performed on the results obtained shows that the average PMV index values for similar values of the efficiency of heat recovery are not statistically significant. In the case of the shorter cycle (2 min), no statistically significant differences were observed for the pairs of efficiency of heat recovery: 67.4% and 64.2%; 42.5% and 44%; 42.5% and 41.2%, while for the longer cycle (10 min), no statistically significant differences were observed for the pair consisting of 42.5% and 41.2%. For the remaining pairs of the efficiency of heat recovery, the average PMV index values are statistically significant.
In future studies, analyses should be performed for the various designs of the supply/exhaust vents and the air heater used. In addition, an attempt should be made to assess thermal comfort using a method of evaluating the indoor environment other than the PMV index.

Author Contributions

Conceptualisation, E.Z.-Ś.; methodology, E.Z.-Ś. and M.T.; data curation, B.G. and M.S.; writing—review and editing, E.Z.-Ś.; visualisation, M.T., B.G., and M.S.; funding acquisition, E.Z.-Ś. All authors have read and agreed to the published version of the manuscript.

Funding

This research was funded by the program of the Minister of Science and Higher Education under the name: “Regional Initiative of Excellence” in 2019–2022 project number 025/RID/2018/19, financing amount PLN 12,000,000.

Data Availability Statement

The data presented in this study are available upon request from the corresponding author.

Conflicts of Interest

The authors declare no conflict of interest.

References

  1. Allen, J.G.; Macomber, J.D. Healthy Buildings. How Indoor Spaces Drive Performance and Productivit; Hardvard University Press: Cambridge, MA, USA, 2020. [Google Scholar]
  2. Jia, L.-R.; Han, J.; Chen, X.; Li, Q.-Y.; Lee, C.-C.; Fung, Y.-H. Interaction between Thermal Comfort, Indoor Air Quality and Ventilation Energy Consumption of Educational Buildings: A Comprehensive Review. Buildings 2021, 11, 591. [Google Scholar] [CrossRef]
  3. Lala, B.; Rizk, H.; Kala, S.M.; Hagishima, A. Multi-Task Learning for Concurrent Prediction of Thermal Comfort, Sensation and Preference in Winters. Buildings 2022, 12, 750. [Google Scholar] [CrossRef]
  4. Nico, M.A.; Liuzzi, S.; Stefanizzi, P. Evaluation of thermal comfort in university classrooms through objective approach and subjective preference analysis. Appl. Ergon. 2015, 48, 111–120. [Google Scholar] [CrossRef] [PubMed]
  5. Ossama, A.A.; Gamal, M.E.K.; Amal, A.A. Correlation between indoor environmental quality and productivity in buildings. In Proceedings of the 19th of IAPS, Cairo, Egypt, 11–16 September 2006. [Google Scholar]
  6. Raimundo, A.M.; Virgílio, A.; Oliveira, M. Analyzing thermal comfort and related costs in buildings under Portuguese temperate climate. Build. Environ. 2022, 219, 109238. [Google Scholar] [CrossRef]
  7. Miranda, M.T.; Romero, P.; Valero-Amaro, V.; Arranz, J.I.; Montero, I. Ventilation conditions and their influence on thermal comfort in examination classrooms in times of COVID-19. A case study in a Spanish area with Mediterranean climate. Int. J. Hyg. Environ. Health 2021, 240, 113910. [Google Scholar] [CrossRef]
  8. Alonso, A.; Llanos, J.; Escandón, R.; Sendra, J.J. Effects of the COVID-19 Pandemic on Indoor Air Quality and Thermal Comfort of Primary Schools in Winter in a Mediterranean Climate. Sustainability 2021, 13, 2699. [Google Scholar] [CrossRef]
  9. Oh, S.; Song, S. Detailed Analysis of Thermal Comfort and Indoor Air Quality Using Real-Time Multiple Environmental Monitoring Data for a Childcare Center. Energies 2021, 14, 643. [Google Scholar] [CrossRef]
  10. Conceiçäo, E.; Awbi, H. Evaluation of Integral Effect of Thermal Comfort, Air Quality and Draught Risk for Desks Equipped with Personalized Ventilation Systems. Energies 2021, 14, 3235. [Google Scholar] [CrossRef]
  11. Nägele, F.; Kasper, T.; Girod, B. Turning up the heat on obsolete thermostats: A simulation-based comparison of intelligent control approaches for residential heating systems. Renew. Sustain. Energy Rev. 2017, 75, 1254–1268. [Google Scholar] [CrossRef]
  12. Alghamdi, S.; Tang, W.; Kanjanabootra, S.; Alterman, D. Effect of Architectural Building Design Parameters on Thermal Comfort and Energy Consumption in Higher Education Buildings. Buildings 2022, 12, 329. [Google Scholar] [CrossRef]
  13. Akili, Z.E.; Bouzidi, Y.; Merabtine, A.; Polidori, G.; Chkeir, A. Experimental Investigation of Adaptive Thermal Comfort in French Healthcare Buildings. Buildings 2021, 11, 551. [Google Scholar] [CrossRef]
  14. Grassi, B.; Piana, E.A.; Lezzi, A.M.; Pilotelli, M. A Review of Recent Literature on Systems and Methods for the Control of Thermal Comfort in Buildings. Appl. Sci. 2022, 12, 5473. [Google Scholar] [CrossRef]
  15. Frontczak, M.; Wargocki, P. Literature survey on how different factors influence human comfort in indoor environments. Build. Environ. 2011, 46, 922–937. [Google Scholar] [CrossRef]
  16. de Oliveira, C.C. Assessment of Air Quality Perception and Its Effects on Users’ Thermal Comfort in Office Buildings. Sci 2021, 3, 47. [Google Scholar] [CrossRef]
  17. Mui, K.W.; Tsang, T.W.; Wong, L.T. Bayesian updates for indoor thermal comfort models. J. Build. Eng. 2019, 29, 101117. [Google Scholar] [CrossRef]
  18. Kosiński, P.; Skotnicka-Siepsiak, A. Possibilities of Adapting the University Lecture Room to the Green University Standard in Terms of Thermal Comfort and Ventilation Accuracy. Energies 2022, 15, 3735. [Google Scholar] [CrossRef]
  19. Mumovic, D.; Palmer, J.; Davies, M.; Orme, M.; Ridley, I.; Oreszczyn, T.; Judd, C.; Critchlow, R.; Medina, H.; Pilmoor, G.; et al. Winter indoor air quality, thermal comfort and acoustic performance of newly built secondary schools in England. Build. Environ. 2009, 44, 1466–1477. [Google Scholar] [CrossRef]
  20. Shan, X.; Zhou, J.; Chang, V.W.-C.; Yang, E.-H. Comparing mixing and displacement ventilation in tutorial rooms: Students’ thermal comfort, sick building syndromes, and short-term performance. Build. Envirnment 2016, 102, 128–137. [Google Scholar] [CrossRef]
  21. Seo, Y.; Kim, J.-H. Differential Cutaneous Thermal Sensitivity in Humans: Method of Limit vs. Method of Sensation Magnitude. Int. J. Environ. Res. Public Health 2021, 18, 12576. [Google Scholar] [CrossRef]
  22. Kannan, T.; Lork, C.; Tushar, W.; Yuen, C.; Wong, N.; Tai, S. Energy Management Strategy for Zone Cooling Load Demand Reduction with Occupancy Thermal Comfort Margin. In Proceedings of the 2019 IEEE PES GTD Grand International Conference and Exposition Asia, GTD Asia 2019, Bangkok, Thailand, 19–23 March 2019; Institute of Electrical and Electronics Engineers Inc.: Bangkok, Thailand, 2019; pp. 247–252. [Google Scholar] [CrossRef]
  23. Zhang, S.; Lu, Y.; Lin, Z. Coupled thermal comfort control of thermal condition profile of air distribution and thermal preferences. Build. Environ. 2020, 177, 106867. [Google Scholar] [CrossRef]
  24. Ratajczak, K.; Amanowicz, Ł.; Szczechowiak, E. Assessment of the air streams mixing in wall-type heat recovery units for ventilation of existing and refurbishing buildings toward low energy buildings. Energy Build 2020, 227, 110427. [Google Scholar] [CrossRef]
  25. Merzkirch, A.; Maas, S.; Scholzen, F.; Waldmann, D. Field tests of centralized and decentralized ventilation units in residential buildings—Specific fan power, heat recovery efficiency, shortcuts and volume flow unbalances. Energy Build 2016, 116, 376–383. [Google Scholar] [CrossRef]
  26. Lamberti, G.; Salvadori, G.; Leccese, F.; Fantozzi, F.; Bluyssen, P.M. Advancement on Thermal Comfort in Educational Buildings: Current Issues and Way Forward. Sustainability 2021, 13, 10315. [Google Scholar] [CrossRef]
  27. Silva, M.F.; Maas, S.; de Souza, H.A.; Gomes, A.P. Post-occupancy evaluation of residential buildings in Luxembourg with centralized and decentralized ventilation systems, focusing on indoor air quality (IAQ). Assessment by questionnaires and physical measurements. Energy Build 2017, 148, 119–127. [Google Scholar] [CrossRef]
  28. Manza, H.; Huberb, H.; Schälinc, A.; Webera, A.; Ferrazzinic, M.; Studera, M. Performance of single room ventilation units with recuperative or regenerative heat recovery. Energy Build 2000, 31, 37–47. [Google Scholar] [CrossRef]
  29. Zender-Świercz, E. Microclimate in Rooms Equipped with Decentralized Façade Ventilation Device. Atmosphere 2020, 11, 800. [Google Scholar] [CrossRef]
  30. Smith, K.M.; Svend Svendsen, S. The effect of a rotary heat exchanger in roombased ventilation on indoor humidity in existing apartments in temperate climates. Energy Build 2016, 116, 349–361. [Google Scholar] [CrossRef]
  31. Smith, K.M.; Svend Svendsen, S. Development of a plastic rotary heat exchanger for room-based ventilation in existing apartments. Energy Build 2015, 107, 1–10. [Google Scholar] [CrossRef]
  32. Van Hoof, J. Forty years of Fanger’s model of thermal comfort: Comfort for all? Indoor Air 2008, 18, 182–201. [Google Scholar] [CrossRef]
  33. Mamani, T.; Herrera, R.F.; Rivera, F.M.-L.; Atencio, E. Variables That Affect Thermal Comfort and Its Measuring Instruments: A Systematic Review. Sustainability 2022, 14, 1773. [Google Scholar] [CrossRef]
  34. Staiger, H.; Laschewski, G.; Matzarakis, A. Selection of appropriate thermal indices for applications in human biometeorological studies. Atmosphere 2019, 10, 18. [Google Scholar] [CrossRef]
  35. PN-EN ISO 7730:2006; Ergonomics of the Thermal Environment—Analytical Determination and Interpretation of Thermal Comfort Using Calculation of the PMV and PPD Indices and Local Thermal Comfort Criteria. CEN: Brussels, Belgium, 2006.
  36. PN-EN 13141-8:2022; Ventilation for Buildings—Performance Testing of Components/Products for Residential Ventilation—Part 8: Performance Testing of Un-Ducted Mechanical Supply and Exhaust Ventilation Units (Including Heat Recovery) for Mechanical Ventilation Systems Intended for Single Room. CEN: Brussels, Belgium, 2022.
  37. Han, H.; Kwon, Y.-I. Inhaling/exhaling heat recovery ventilator using the concept of alternating-current ventilation. HVACR Res. 2006, 12, 843–859. [Google Scholar] [CrossRef]
  38. Merckx, M.; Bruyneel, G.; Pollet, I.; Laverge, J. Temperature, draft and ventilation efficiency of room based decentralised heat recovery ventilation systems. In Proceedings of the 39th AIVC Conference “Smart Ventilation for Buildings”, Antibes Juan-LesPins, France, 18–19 September 2018; pp. 838–847. [Google Scholar]
  39. Mikola, A.; Simon, R.; Kurnitski, J. The impact of air pressure conditions on the performance of single room ventilation units in multi-story buildings. Energies 2019, 12, 2633. [Google Scholar] [CrossRef]
  40. Ganesh, G.A.; Sinha, S.L.; Verma, T.N.; Dewangan, S.K. Numerical simulation for energy consumption and thermal comfort in a naturally ventilated indoor environment under different orientations of inlet diffuser. Build. Environ. 2022, 217, 109071. [Google Scholar] [CrossRef]
  41. Faria, L.C.d.; Romero, M.d.A.; Porras-Amores, C.; Pirró, L.F.d.S.; Saez, P.V. Prediction of the Impact of Air Speed Produced by a Mechanical Fan and Operative Temperature on the Thermal Sensation. Buildings 2022, 12, 101. [Google Scholar] [CrossRef]
  42. PN EN 16798-1:2019-06; Energy Performance of Buildings—Ventilation for Buildings—Part 1: Indoor Environmental Input Parameters for Design and Assessment of Energy Performance of Buildings Addressing Indoor Air Quality, Thermal Environment, Lighting and Acoustics—Module M1-6. CEN: Brussels, Belgium, 2019.
  43. CIBSE. CIBSE Guide A: Environmental Design; Chartered Institution of Building Services Engineers: London, UK, 2006. [Google Scholar]
  44. ANSI/ASHARE Standard 55-2020; Thermal Environmental Conditions for Human Occupancy. American Society of Heating, Refrigerating and Air Conditioning Engineers, Inc.: Atlanta, GA, USA, 2020.
  45. Lan, L.; Wargocki, P.; Lian, Z. Quantitative measurement of productivity loss due to thermal discomfort. Energy Build. Int. 2011, 43, 1057–1062. [Google Scholar] [CrossRef]
  46. Zhang, J.; Li, P.; Ma, M. Thermal Environment and Thermal Comfort in University Classrooms during the Heating Season. Buildings 2022, 12, 912. [Google Scholar] [CrossRef]
  47. Pao, S.-L.; Wu, S.-Y.; Liang, J.-M.; Huang, I.-J.; Guo, L.-Y.; Wu, W.-L.; Liu, Y.-G.; Nian, S.-H. A Physiological-Signal-Based Thermal Sensation Model for Indoor Environment Thermal Comfort Evaluation. Int. J. Environ. Res. Public Health 2022, 19, 7292. [Google Scholar] [CrossRef]
  48. Auffenberg, F.; Snow, S.; Stein, S.; Rogers, A. A comfort-based approach to smart heating and air conditioning. ACM Trans. Intell. Syst. Technol. 2018, 9, 1–20. [Google Scholar] [CrossRef] [Green Version]
  49. Zheng, P.; Wu, H.; Liu, Y.; Ding, Y.; Yang, L. Thermal comfort in temporary buildings: A review. Build. Env. 2022, 221, 109262. [Google Scholar] [CrossRef]
  50. Tardioli, G.; Filho, R.; Bernaud, P.; Ntimos, D. An Innovative Modelling Approach Based on Building Physics and Machine Learning for the Prediction of Indoor Thermal Comfort in an Office Building. Environ. Sci. Proc. 2021, 11, 25. [Google Scholar] [CrossRef]
  51. Tardioli, G.; Filho, R.; Bernaud, P.; Ntimos, D. An Innovative Modelling Approach Based on Building Physics and Machine Learning for the Prediction of Indoor Thermal Comfort in an Office Building. Buildings 2022, 12, 475. [Google Scholar] [CrossRef]
  52. Brik, B.; Esseghir, M.; Merghem-Boulahia, L.; Hentati, A. Providing Convenient Indoor Thermal Comfort in Real-Time Based on Energy-Efficiency IoT Network. Energies 2022, 15, 808. [Google Scholar] [CrossRef]
  53. Krechowicz, M. Qualitative Risk Assessment of Passive House Design and Construction Processes. In Proceedings of the 5th World Multidisciplinary Civil Engineering-Architecture-Urban Planning Symposium—WMCAUS, Prague, Czech Republic, 15–19 June 2020; IOP Publishing: Bristol, UK, 2020; p. 042068. [Google Scholar] [CrossRef]
  54. Krechowicz, M. Effective Risk Management in Innovative Projects: A Case Study of the Construction of Energy efficient, Sustainable Building of the Laboratory of Intelligent Building in Cracow. IOP Conf. Ser. Mater. Sci. Eng. 2017, 245, 062006. [Google Scholar] [CrossRef]
  55. Krechowicz, M. Risk Management in Complex Construction Projects that Apply Renewable Energy Sources: A Case Study of the Realization Phase of the Energis Educational and Research Intelligent Building. IOP Conf. Ser. Mater. Sci. Eng. 2017, 245, 062007. [Google Scholar] [CrossRef]
  56. Boudier, K.; Hoffmann, S. Analysis of the Potential of Decentralized Heating and Cooling Systems to Improve Thermal Comfort and Reduce Energy Consumption through an Adaptive Building Controller. Energies 2022, 15, 1100. [Google Scholar] [CrossRef]
  57. Ovando-Chacon, G.E.; Rodríguez-León, A.; Ovando-Chacon, S.L.; Hernández-Ordoñez, M.; Díaz-González, M.; Pozos-Texon, F.d.J. Computational Study of Thermal Comfort and Reduction of CO2 Levels inside a Classroom. Int. J. Environ. Res. Public Health 2022, 19, 2956. [Google Scholar] [CrossRef]
  58. Ferdyn-Grygierek, J.; Grydierek, K.; Gumińska, A.; Krawiec, P.; Oćwieja, A.; Poloczek, R.; Szkarłat, J.; Zawartka AZobczyńska, D.; Żukowska-Tejsen, D. Passive Cooling Solutions to Improve Thermal Comfort in Polish Dwellings. Energies 2021, 14, 3648. [Google Scholar] [CrossRef]
  59. Humphreys, M.A.; Nicol, J.F. The validity of ISO-PMV for predicting comfort votes in every-day thermal environments. Energy Build 2002, 34, 667–684. [Google Scholar] [CrossRef]
Figure 1. Layout of meters and the decentralised façade unit in the analysed room.
Energies 15 07032 g001
Figure 2. The course of the PMV index with the use of a device without heat recovery: (a) cycle 2 min, (b) cycle 10 min [29].
Energies 15 07032 g002
Figure 3. The course of the value of the PMV index for a 2-min cycle. Heat recovery exchanger: 85%—ceramic, 67.4%—jojoba oil, 10 mm, 47.6%—jojoba oil, 25 mm, 42.5%—jojoba oil, 40 mm, 64.2%—coconut oil, 10 mm, 44%—coconut oil, 25 mm, 41.2%—coconut oil, 40 mm.
Energies 15 07032 g003
Figure 4. The course of the value of the PMV index for a 10-min cycle. Heat recovery exchanger: (a) ceramic, (b) jojoba oil, 10 mm, (c) jojoba oil, 25 mm, (d) jojoba oil, 40 mm, (e) coconut oil, 10 mm, (f) coconut oil, 25 mm, (g) coconut oil, 40 mm.
Energies 15 07032 g004aEnergies 15 07032 g004b
Table 1. Microclimate measurement specifications.
ParameterMeasurement RangeResolution of IndicationsUnitAccuracy
Air velocity0 ÷ 50.01m∙s−1±0.05 + 0.05 × Va for 0–1 m∙s−1 ±5%
for 1–5 m∙s−1
Radiant temperature−30 ÷ +600.01°C±0.4 °C
Table 2. Measurement ranges and resolution of indications. Indoor air quality monitor.
ParameterMeasurement RangeResolution of IndicationsUnitAccuracy
Temperature10 ÷ 450.1°C±0.5
Table 3. The specifications of the balometer station.
ParameterMeasurement RangeResolution of IndicationsUnitAccuracy
Volumetric flow rate42–42501m3∙h−1±3% read out value ±12 m³∙h−1 > 85 m³∙h−1
Air speed0.125–12.50.01m∙s±3% read out value ±0.04 m∙s−1 > 0.25 m∙s−1
Temperature−40–1210.1°C±0.3% °C
Humidity5–950.1%±3% RH
Table 4. Efficiency of heat recovery and temperature of the supply air.
CeramicJojoba Oil
10 mm
Jojoba Oil
25 mm
Jojoba Oil
40 mm
Coconut Oil
10 mm
Coconut Oil
25 mm
Coconut Oil
40 mm
Efficiency (%)8567.447.642.564.24441.2
tN (°C) 2 min 12843883
tN (°C) 10 min 13953843
Legend of the headings: Ceramic is the material of the heat exchanger. Jojoba oil and coconut oil are the substances that fill the cylinders of the heat exchangers. The 10 mm, 25 mm, and 40 mm are values of the diameters of the cylinders of the heat exchangers. tN is the temperature of the air supply. The 2 min and 10 min are the times of the supplying/exhausting cycle.
Table 5. The Tukey multiple comparison method tests for the PMV index characteristic in groups based on the efficiency of the heat recovery factor levels. Supply/exhaust cycle: 2 min.
Tukey GroupingAverage of PMV IndexnEfficiency of Heat Recovery
(%)
A−1.77885.0
B−2.37867.4
C−3.07847.6
D−3.17842.5
E−2.37864.2
D−3.17844.0
D−3.17841.2
Table 6. Simultaneous 95% confidence intervals obtained using the Tukey method for difference in avg. values of PMV index in groups matching efficiency of heat recovery levels. Supply/exhaust cycle: 2 min.
Comparison of PMV Index for Pairs of Heat Recovery Efficiency (%)Difference between Avg. Values of PMV IndexSimultaneous 95% Confidence Intervals
Lower Limit of the Confidence IntervalUpper Limit of the Confidence Interval
85–67.40.600.560.64
67.4–85−0.60−0.64−0.56
85–47.61.221.171.26
47.6–85−1.22−1.26−1.17
85–42.51.371.331.41
42.5–85−1.37−1.41−1.33
85–64.20.600.560.64
64.2–85−0.60−0.64−0.56
85–441.371.331.41
44–85−1.37−1.41−1.33
85–41.21.371.331.41
41.2–85−1.37−1.41−1.33
67.4–47.60.610.570.65
47.6–67.4−0.61−0.65−0.57
67.4–42.50.770.720.81
42.5–67.4−0.77−0.81−0.72
67.4–64.20.00−0.040.04
64.2–67.40.00−0.040.04
67.4–440.770.720.81
44–67.4−0.77−0.81−0.72
67.4–41.20.770.720.81
41.2–67.4−0.77−0.81−0.72
47.6–42.50.150.110.19
42.5–47.6−0.15−0.19−0.11
47.6–64.2−0.61−0.65−0.57
64.2–47.60.610.570.65
47.6–440.150.110.19
44–47.6−0.15−0.19−0.11
47.6–41.20.150.110.19
41.2–47.6−0.15−0.19−0.11
42.5–64.2−0.77−0.81−0.72
64.2–42.50.770.720.81
42.5–440.00−0.040.04
44–42.50.00−0.040.04
42.5–41.20.00−0.040.04
41.2–42.50.00−0.040.04
64.2–440.770.720.81
44–64.2−0.77−0.81−0.72
64.2–41.20.770.720.81
41.2–64.2−0.77−0.81−0.72
44–41.20.00−0.040.04
41.2–440.00−0.040.04
Table 7. The Tukey multiple comparison method tests for the PMV index characteristic in groups based on the efficiency of heat recovery factor levels. Supply/exhaust cycle: 10 min.
Tukey GroupingAverage of PMV IndexnThe Efficiency of Heat Recovery
(%)
A−1.730085.0
B−2.330067.4
C−2.930047.6
D−3.230042.5
E−2.430064.2
F−3.130044.0
D−3.230041.2
Table 8. Simultaneous 95% confidence intervals obtained using the Tukey method for difference in avg. values of PMV index in groups matching efficiency of heat recovery levels. Supply/exhaust cycle: 10 min.
Comparison of PMV Index for Pairs of Heat Recovery Efficiency (%)Difference between Avg. ValuesSimultaneous 95% Confidence Intervals
Lower Limit of the Confidence IntervalUpper Limit of the Confidence Interval
85–67.40.610.580.63
67.4–85−0.61−0.63−0.58
85–47.61.231.201.25
47.6–85−1.23−1.25−1.20
85–42.51.541.511.56
42.5–85−1.54−1.56−1.51
85–64.20.760.740.79
64.2–85−0.76−0.79−0.74
85–441.381.361.41
44–85−1.38−1.41−1.36
85–41.21.541.511.56
41.2–85−1.54−1.56−1.51
67.4–47.60.620.590.64
47.6–67.4−0.62−0.64−0.59
67.4–42.50.930.900.95
42.5–67.4−0.93−0.95−0.90
67.4–64.20.150.130.18
64.2–67.4−0.15−0.18−0.13
67.4–440.770.750.80
44–67.4−0.77−0.80−0.75
67.4–41.20.930.900.95
41.2–67.4−0.93−0.95−0.90
47.6–42.50.310.280.34
42.5–47.6−0.31−0.34−0.28
47.6–64.2−0.46−0.49−0.44
64.2–47.60.460.440.49
47.6–440.160.130.18
44–47.6−0.16−0.18−0.13
47.6–41.20.310.280.34
41.2–47.6−0.31−0.34−0.28
42.5–64.2−0.77−0.80−0.75
64.2–42.50.770.750.80
42.5–44−0.15−0.18−0.13
44–42.50.150.130.18
42.5–41.20.00−0.030.03
41.2–42.50.00−0.030.03
64.2–440.620.590.64
44–64.2−0.62−0.64−0.59
64.2–41.20.770.750.80
41.2–64.2−0.77−0.80−0.75
44–41.20.150.130.18
41.2–44−0.15−0.18−0.13
Publisher’s Note: MDPI stays neutral with regard to jurisdictional claims in published maps and institutional affiliations.

