Article

Research on Renewable-Energy Accommodation-Capability Evaluation Based on Time-Series Production Simulations

1
College of Information Engineering, Zhejiang University of Technology, Hangzhou 310023, China
2
Economic and Technological Research Institute, State Grid Zhejiang Electric Power Co., Ltd., Hangzhou 310016, China
*
Author to whom correspondence should be addressed.
Energies 2022, 15(19), 6987; https://doi.org/10.3390/en15196987
Submission received: 7 September 2022 / Revised: 20 September 2022 / Accepted: 21 September 2022 / Published: 23 September 2022

Abstract

:
In recent years, renewable energy has received extensive attention due to its advantages of sustainability, economy, and environmental protection. However, with the rapid development of renewable energy, the problem of curtailment is becoming increasingly serious. Studying the calculation method and establishing a quantitative evaluation system of renewable energy accommodation capacity are important means to solve this problem. This paper comprehensively considers the factors affecting the accommodation of renewable energy, establishes a accommodation calculation model with the maximum accommodation of renewable energy as the optimization target based on the time series production simulation method, and uses the hybrid particle swarm optimization (PSO) algorithm to solve it. The model is verified with historical data such as load, photovoltaic (PV), and wind power in a certain region throughout the year. The experimental results verify the rationality of the renewable-energy accommodation-capacity model proposed in this paper and the correctness of the theoretical analysis. The calculation results have important reference and guiding significance for the operation and control of power-grid planning and dispatching.

1. Introduction

Compared with a traditional power system that relies entirely on the grid for power supply, the system containing renewable energy is more economical [1]. By increasing the installation capacity for renewable energy and improving the conversion efficiency of power generation, the rapid development of renewable energy can be achieved [2]. In recent years, with the rapid development of renewable energy power, its power generation efficiency is also gradually improving [3]. Currently, the total amount of renewable power generation has been very considerable, but the curtailment of renewable energy has gradually become an important issue that threatens the progress and development of the power system [4]. Therefore, attaching importance to the improvement of the efficiency of renewable energy grid connection and reducing the curtailment of renewable energy are important measures in the progress and development of the power sector under the current trend [5].
Currently, the research on renewable energy accommodation mainly includes two directions. The first category is the research on the accommodation of renewable energy power in the microgrid. Another category is the research on the accommodation of large-scale renewable energy power in the grid system. In the first type of research, Moretti L et al. [6] proposed a predictive design and scheduling optimization algorithm based on mixed integer linear programming (MILP) to improve the utilization of renewable energy. In [7], the goal of absorbing renewable energy in the off-grid electrical system was successfully achieved by optimizing the combination of various power sources in the microgrid. In [8], a hierarchical microgrid model considering communication uncertainty was proposed, and accurate results were obtained for the capacity assessment of renewable energy in the microgrid. Due to the limited amount of renewable energy that can be absorbed by the microgrid itself, although this type of research can improve the serious problem of renewable energy curtailment, it cannot effectively solve the problem.
In the second type of research, [9,10] realized the improvement of renewable energy accommodation capacity by considering the demand response mechanism in the power grid. In [11], this paper proposes a new machine-learning-based method to determine the capacity of the grid to accommodate renewable energy by estimating the transmission capacity of the power line. Ref. [12] aims at low carbon and economy and the highest renewable energy capacity, and proposes a multi-objective function considering the combined weights to improve the capacity of renewable energy. In [13], the method of using cross-regional power transmission is proposed to improve the accommodation capacity. Ref. [14] analyzed China’s renewable energy accommodation from the perspectives of market and government regulation and proposed solutions to improve accommodation from the perspective of policies and institutions. In [15], the deep reinforcement learning algorithm is used to obtain the strategy of renewable energy accommodation in different scenarios so as to achieve the goal of making full use of renewable energy. In [16], the load scheduling method is used to achieve an improvement in the absorption capacity of renewable energy and the stability of the grid balance. The frequency stability of the system is improved through an optimization strategy of the energy storage battery so as to achieve the goal of promoting the accommodation of renewable energy [17,18]. Although the above methods have realized the accommodation of large-scale renewable energy, due to the integration of large-scale renewable energy into the grid, the problems of intermittency and volatility seriously threaten the security and stability of grid operation [19]. Therefore, it is very important to ensure the balance of the power grid while realizing the accommodation of renewable energy.
In the research on ensuring the grid’s balance, while renewable energy is connected to the grid [20,21], it started from reducing the intermittency and volatility of renewable energy itself in order to solve the problems that affect the security and stability of the grid system when renewable energy is connected to the grid. In [22], the power supply and demand balance when intermittent renewable energy was connected to the grid is ensured by combining different elastic resources. In [23], a multi-period optimal scheduling scheme was proposed to solve the uncertainty problem of renewable energy generation and improve the stability of renewable energy grid connection. In [24], the controllability and uncertainty of distributed energy resources are improved by microgrid technology, thereby reducing the negative impact of renewable energy on grid stability under high penetration rates. Some researchers solve the grid-balancing problem when renewable energy is connected to the grid by increasing the type and size of the load in the grid. Some examples include the following: increasing the air-conditioning load realizes the effective accommodation of PV power [25], using electric vehicles to increase the load on the grid to improve the accommodation capacity of renewable energy [26,27], and increasing the accommodation of wind power through the application of electricity to natural gas [28].
Summing up the above studies, among the various methods to achieve renewable energy power accommodation, most of them are small-scale renewable energy accommodation and the goal tends to be more economical, which leads to the unsatisfactory accommodation of renewable energy and the stability goal of the power grid system. This paper comprehensively considers the influence factors of renewable energy accommodation, such as the boundary conditions of grid operation and the coordinated multi-link optimization of the grid operation mode. Under the premise of ensuring the stability and security of grid operation, a renewable energy accommodation capability model with the goal of maximum annual accommodation of renewable energy is established. The method is based on the time-series simulation-analysis method, which can realize the quantitative analysis of the absorption capacity of renewable energy. The experimental results show that the renewable energy accommodation level calculation method proposed in this paper has a significant effect on the improvement in regional renewable energy accommodation levels, and the actual calculation results verify the reliability of the method. The methods and contributions used in this paper are summarized below.
  • The aggregation model of power grid is proposed, which realizes the optimization of power grid structure, and puts forward corresponding evaluation indicators for the renewable-energy accommodation capability.
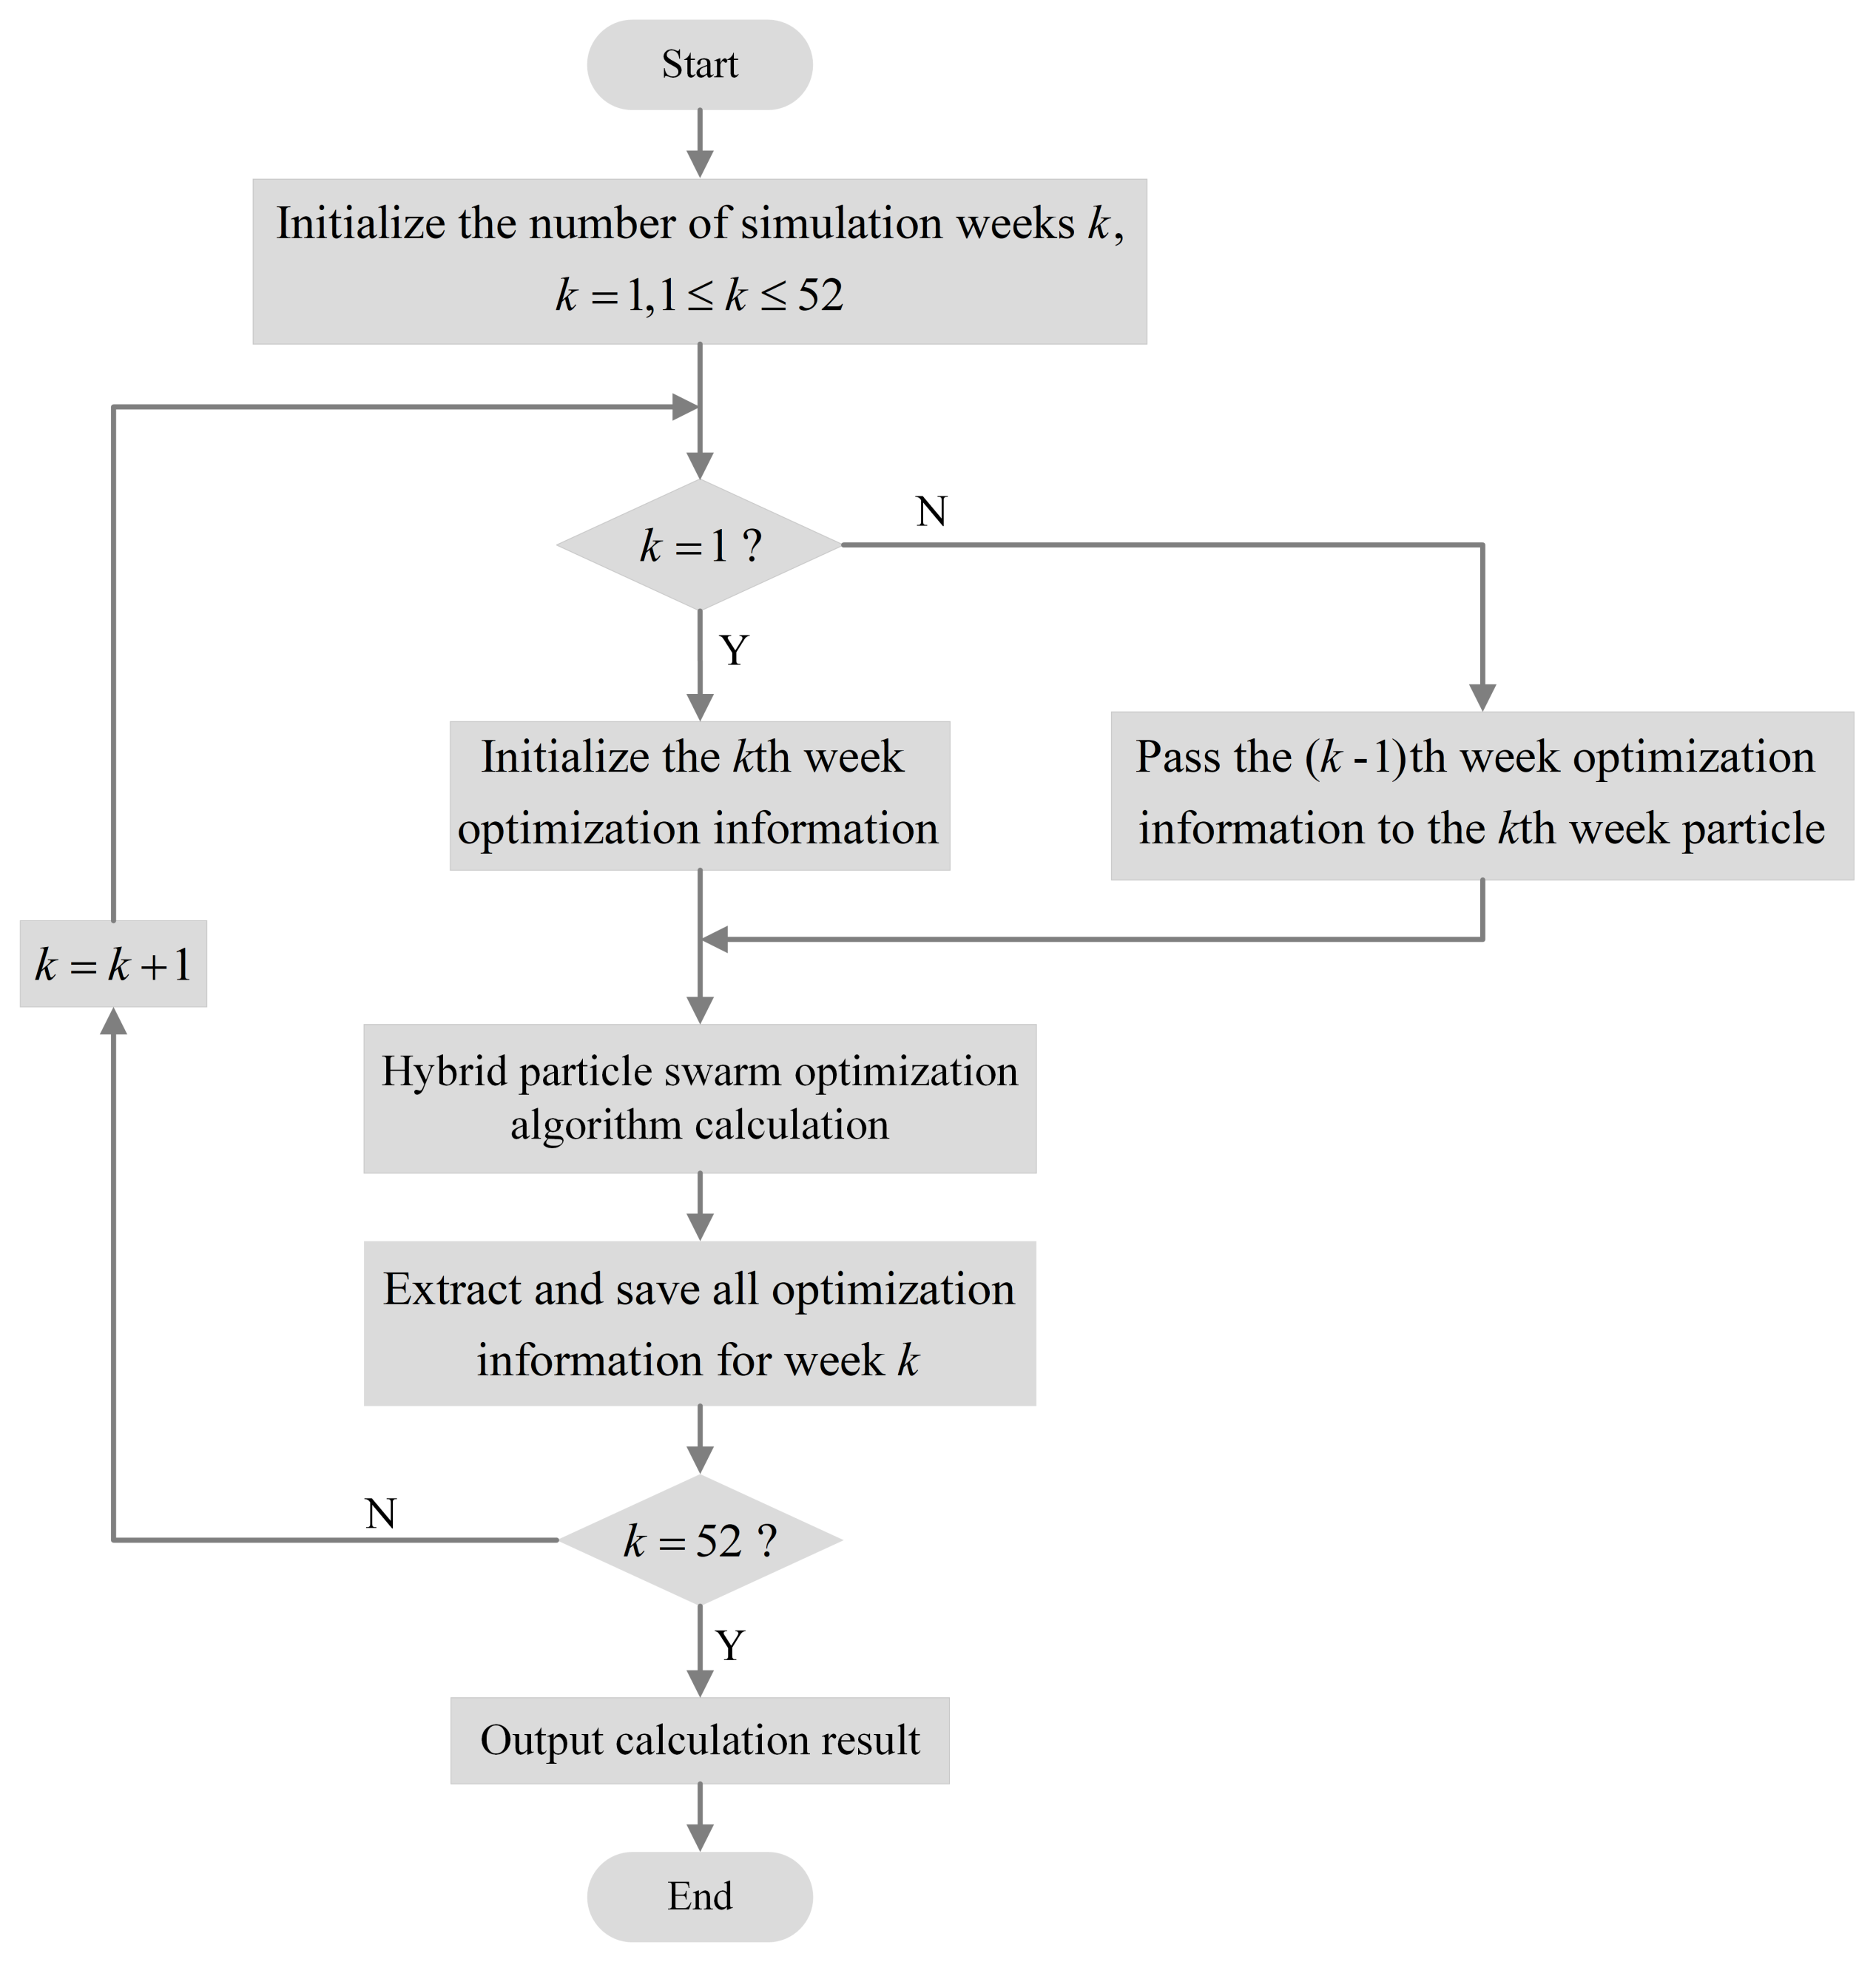
  • A renewable energy accommodation capability model based on time-series production simulation is proposed, a week-by-week optimization solution is designed, and the hybrid particle swarm optimization algorithm is used to solve the problem, which can quickly obtain the calculation results of long-term accommodation capability.
  • The effectiveness and efficiency of the designed renewable energy accommodation capability calculation method are verified by simulation calculations in Matlab.
The rest of the paper is structured as follows. Section 2 introduces the construction of the partitioned power grid model by means of aggregating equivalents, the evaluation indicators of the renewable energy accommodation capability. In Section 3, a renewable energy accommodation capability model based on the time series production simulation method is established, and then the corresponding optimization algorithm and solution method are designed. Section 4 shows the simulation calculation results of the renewable energy accommodation capability model in Matlab and analyzes and evaluates the results according to the actual operating conditions of the power grid. The conclusions of this paper are provided in Section 5.

2. Problem Formulation

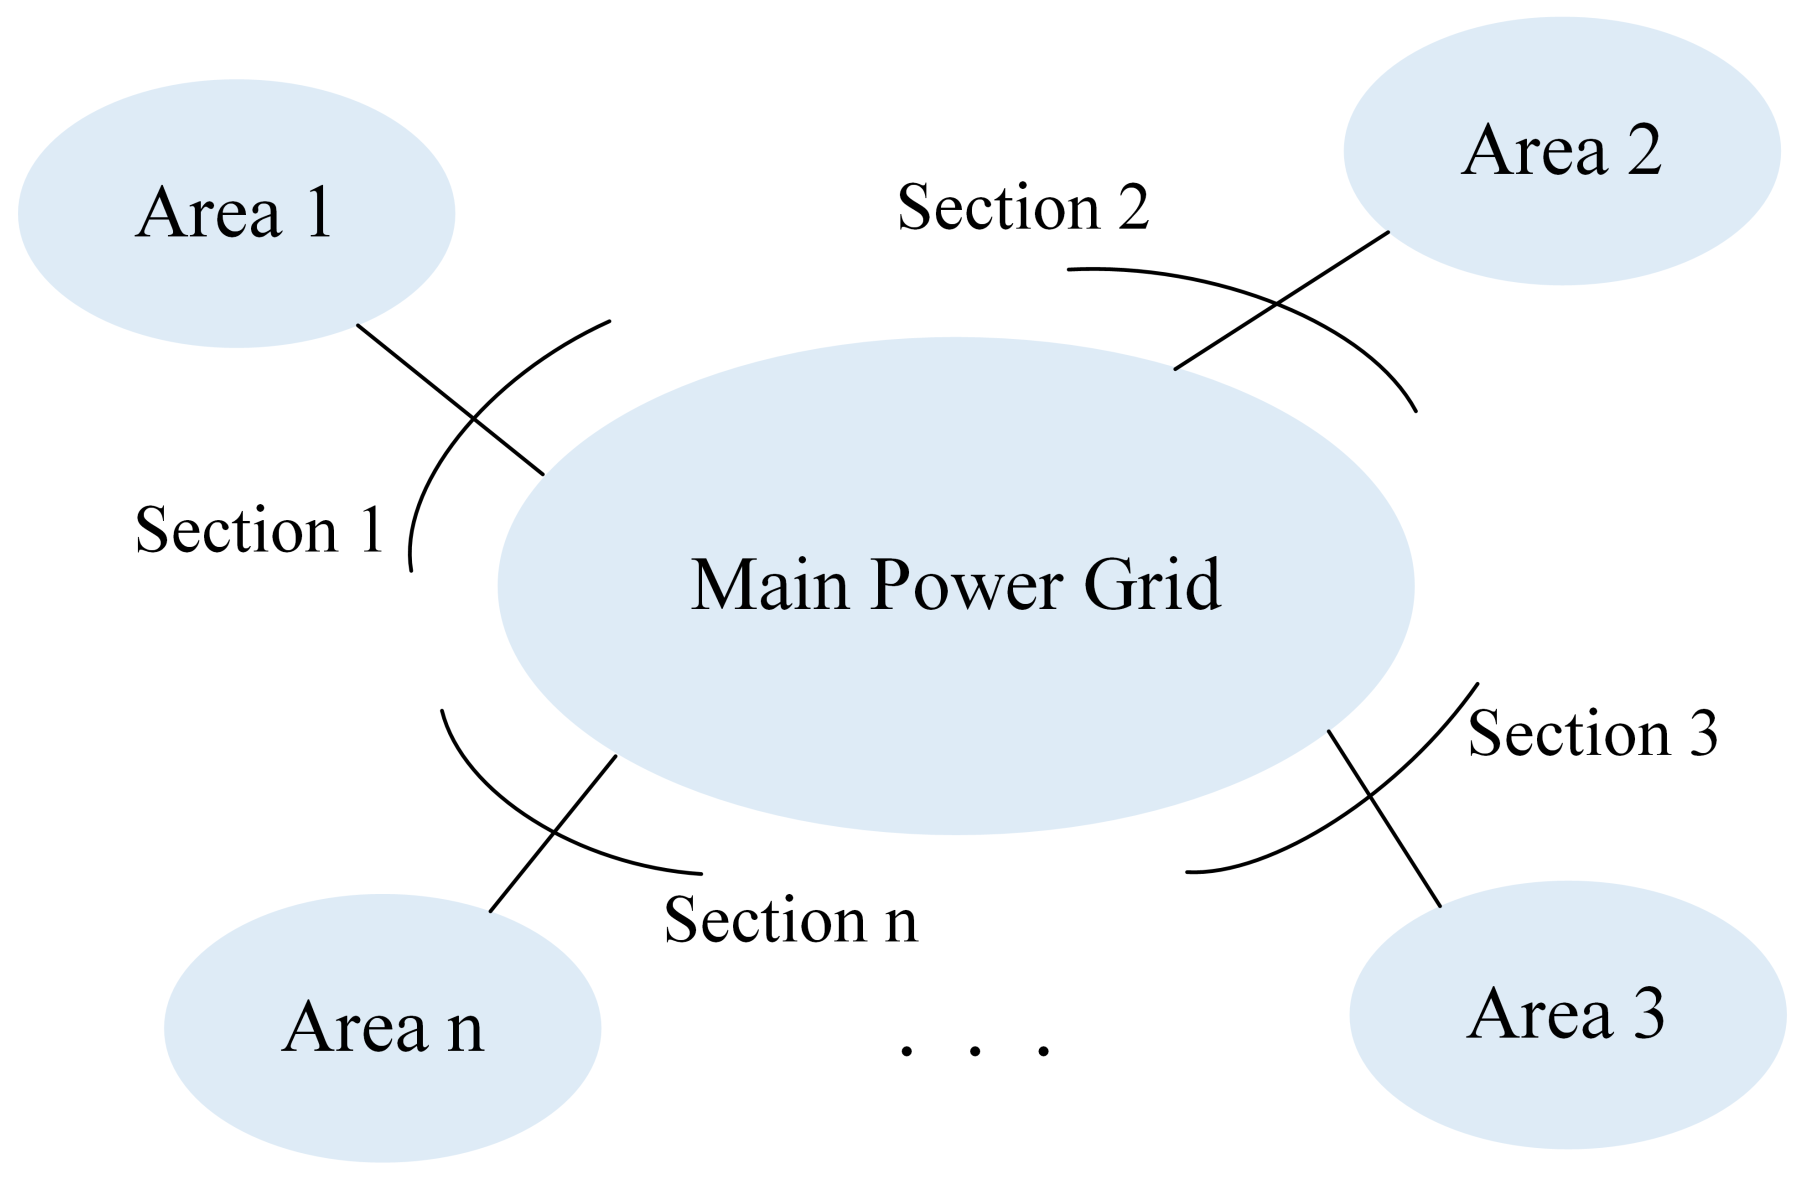
2.1. Aggregation Model of the Power Grid

Compared with the microgrid, the renewable energy accommodation capability scenario studied in this paper has a larger coverage area and the grid structure is more complex. Establishing a detailed physical model of the power grid is too complicated, and it is time-consuming to simulate the time-series production on a long-term scale. Therefore, this paper adopts the method of partitioning the power grid to realize the assessment of the renewable energy accommodation capacity of the entire power grid. This method does not need to consider the detailed grid topology structure, and effectively reduces the complexity of the grid and improves the calculation speed of the renewable energy accommodation capacity on the basis of retaining the original grid operation’s characteristics.
The method partitions the power grid according to the blockage of renewable energy delivery, and then performs load model aggregation, tie-line model aggregation, and power-supply model aggregation for each partition. Load model aggregation aggregates various loads in the grid area into a load curve, which is the sum of all loads in the grid’s area. In the tie line model aggregation, the tie lines in the power grid area will be aggregated into a tie line, the lower limit of the transmission capacity of the tie line is the cumulative value of the lower limit of the transmission capacity of each tie line, and the electricity transmitted by the tie line obtained after aggregation is each tie line. The cumulative value of the power delivered by the line. In the aggregation of power supply models, the power supply in the grid area is firstly divided into thermal power, hydropower, wind, and PV power. The aggregation methods of hydropower units and thermal power units are the same; that is, the units with the same capacity and type are classified into one category, and the installed capacity, maximum output, minimum output, ramp rate, and electricity constraints of similar units are the same. The normalized output and installed capacity of wind and PV power sources in the grid area are used as model parameters of their respective aggregation models, and the relationship is shown in Equation (1):
P n w n = P w n C w n P n p v n = P p v n C p v n
where P n w n , P w n , and C w n are the normalized output, ouput, and installed capacity of wind power in sub-grid n, respectively. P n p v n , P p v n , and C p v n are the normalized output, ouput, and installed capacity of PV power in sub-grid n, respectively.
The structure diagram of the power grid partition is shown in Figure 1. Among them, areas i ( i = 1 , 2 , , n ) is the area where the transmission of renewable energy is blocked due to the limitation of the transmission capacity of the section, and the main network is the other areas where the transmission of renewable energy is not in a restricted area.

2.2. Evaluation Indicators of Renewable-Energy Accommodation Capability

When the power grid does not consider external transmission, the renewable-energy accommodation capability is directly related to the system’s peak shaving capacity. That is, the conventional unit cannot reduce the output during the load trough period to accommodate more renewable energy. In addition, if the tie line connecting the power grid with the outside world allows a certain amount of renewable energy to be sent out, it will significantly increase the space for renewable-energy accommodation, which will be considered when analyzing the cross-regional accommodation of renewable energy. The renewable energy output and peak shaving margin of the system are expressed as follows:
P n e w t , n = P w t , n + P p v t , n P p t t , n = P l t , n P min t , n
where N and n are the total number of sub-grids included in the system and a sub-grid respectively, T and t are the total length of the scheduling time and the simulation time step respectively, P n e w t , n , P w t , n , and P p v t , n are the total renewable energy output, wind, and PV power output of the sub-grid n at time period t, respectively, P p t t , n , P l t , n , and P min t , n are the system peak shaving margin, load, and minimum output of sub-grid n at time period t, respectively.
The renewable energy accommodation capability is the sum of the renewable energy output values within the peak regulation margin.
Q c o n = t = 1 T n = 1 N min P n e w t , n , P p t t , n
When the output value of the renewable energy exceeds the peak shaving margin of the system, the excess output value will be discarded to maintain the power balance constraint. The output value of renewable energy that is discarded at a certain moment in a sub-grid is expressed as follows.
Q t , n = max 0 , P n e w t , n P p t t , n
From Equation (4), it can be further obtained that the total discarded electricity of renewable energy in the grid system in the dispatch time is as follows.
Q = t = 1 T n = 1 N max 0 , P n e w t , n P p t t , n
In order to more clearly observe the accommodation of renewable energy in each time period of the power grid, this paper not only sets the total abandonment information of renewable energy but also introduces the abandonment information of the entire time period. The power abandonment information in the entire time period is the wind and PV power curtailment information in each time period of the simulation, and the wind and PV power curtailment are calculated according to the proportion of their output.
Q w i n d t , n = Q t , n × P w t , n P n e w t , n Q p v ( t , n ) = Q ( t , n ) × P p v t , n P n e w t , n

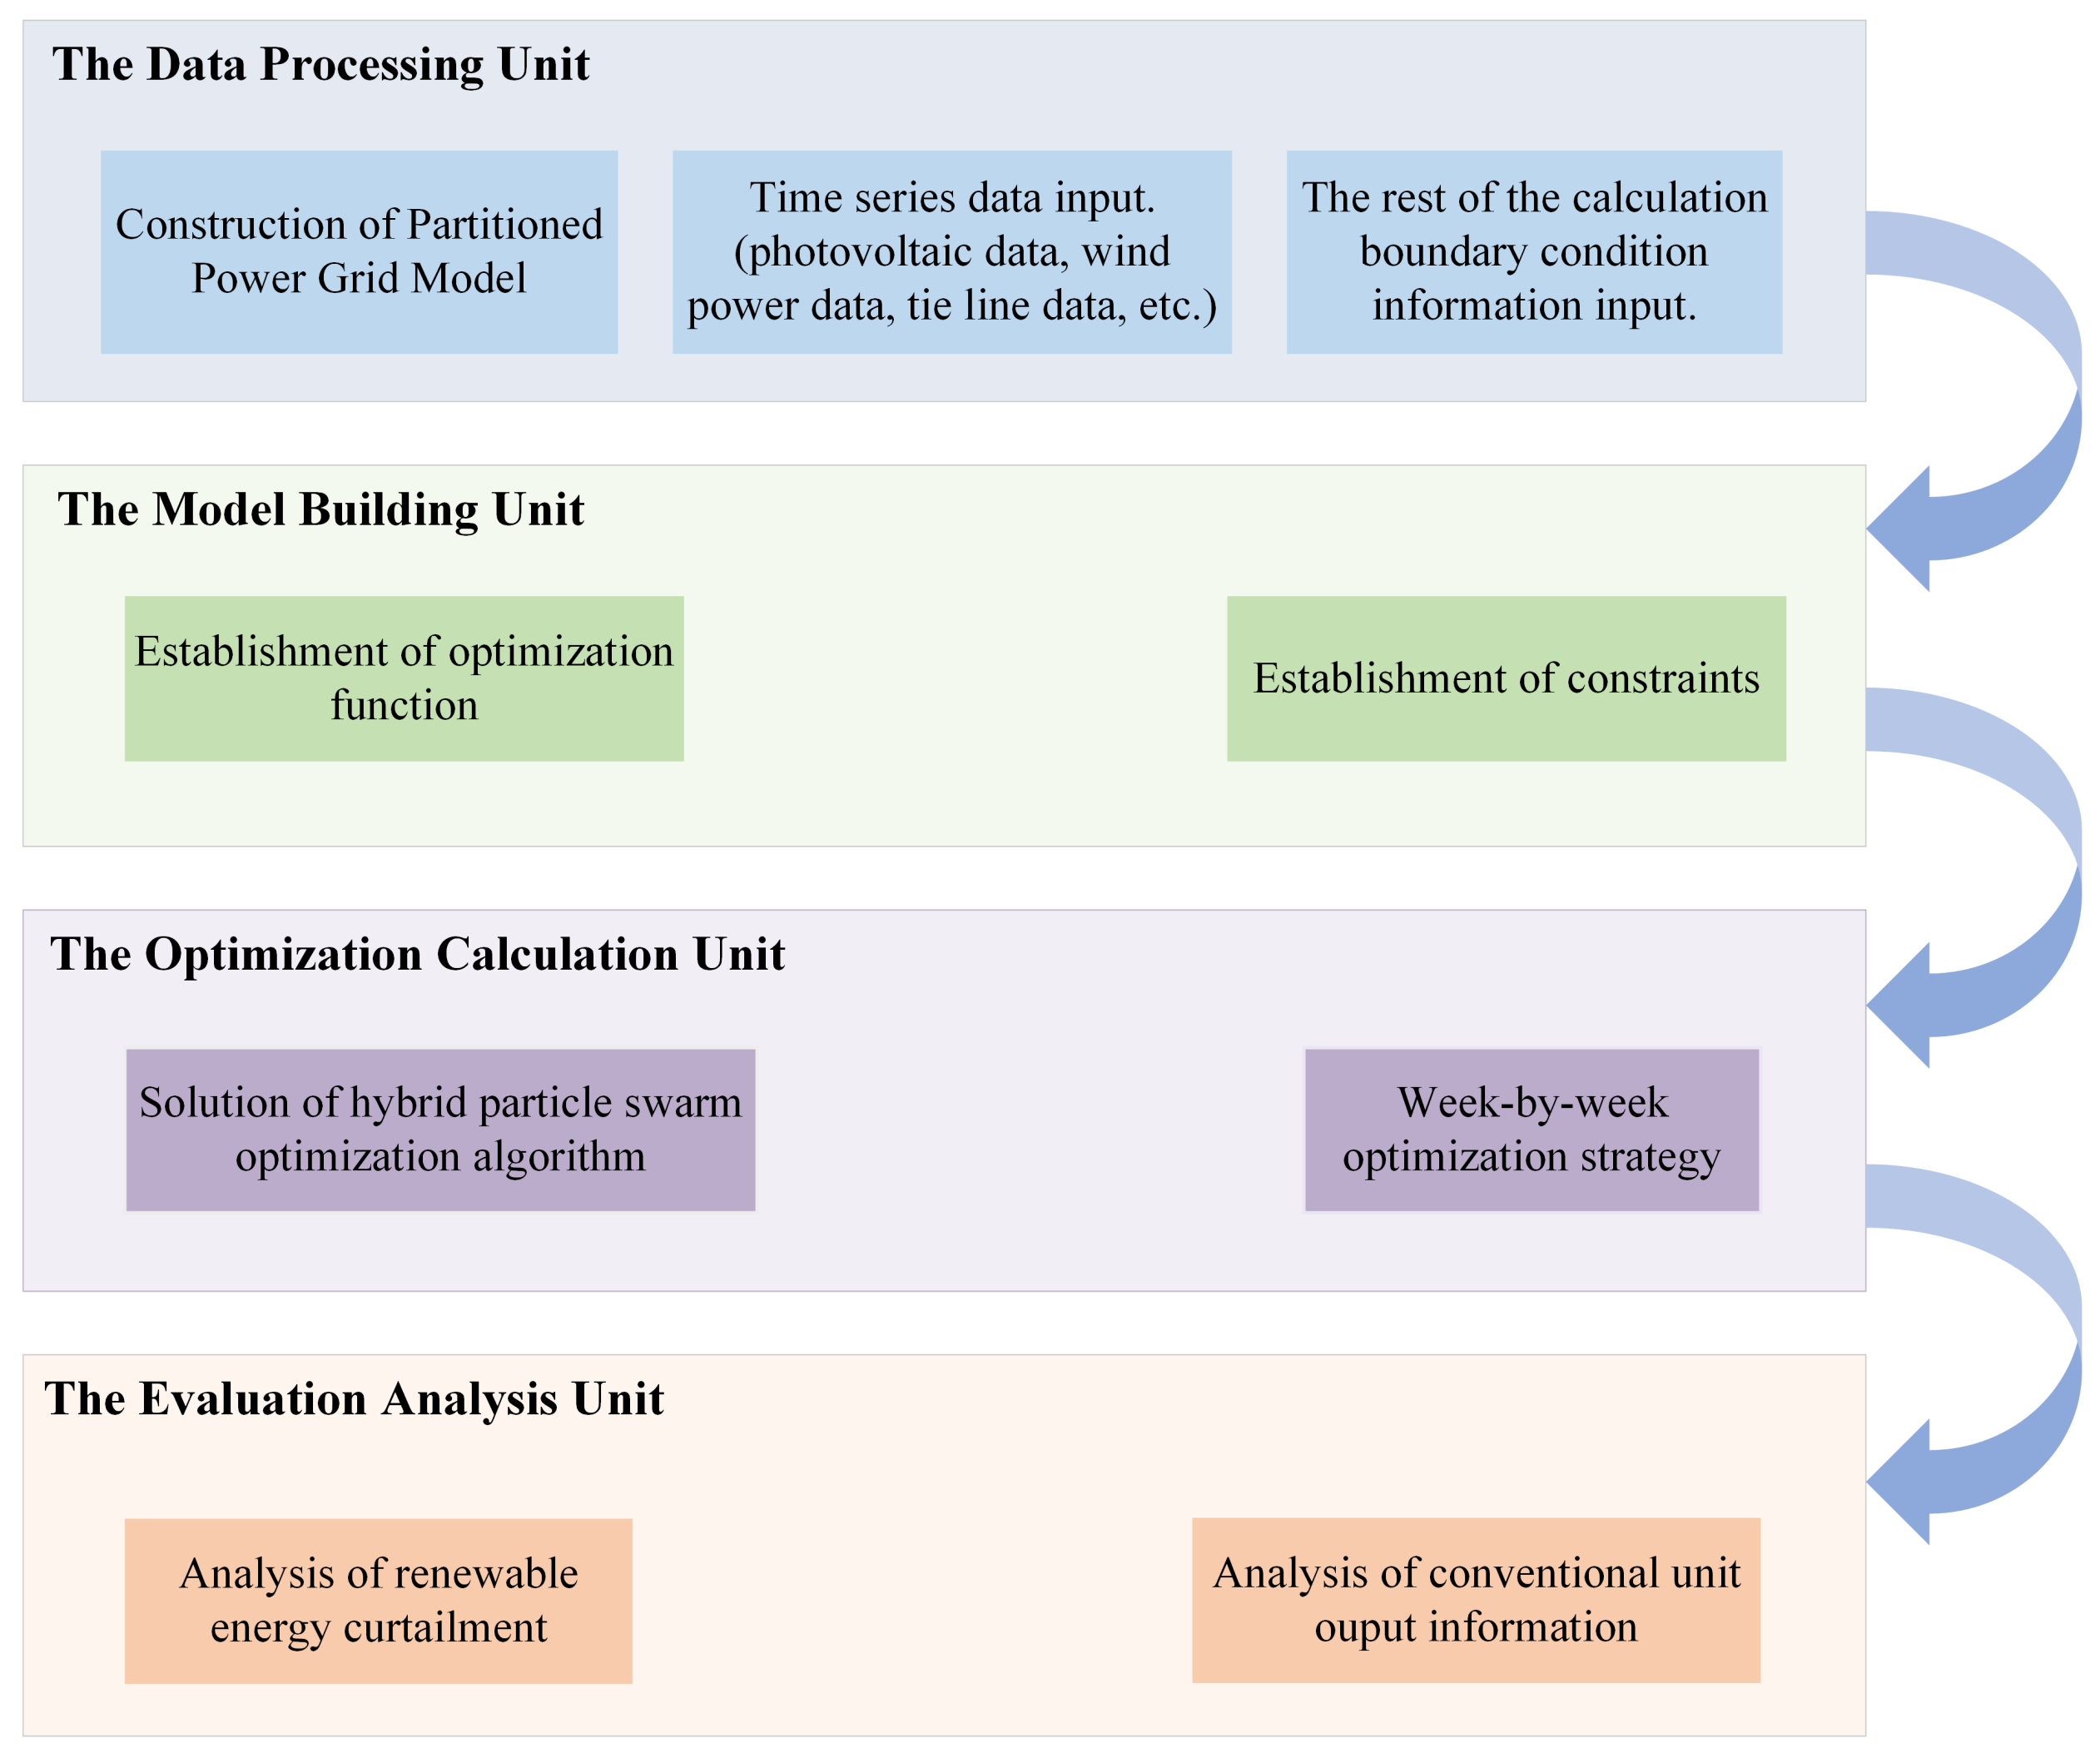
2.3. Calculation Method

The structure of the renewable-energy accommodation-capability calculation method and evaluation method proposed in this paper is shown in Figure 2. The calculation process mainly includes four units. The first is the data processing unit. The main work in this unit includes the construction of the partitioned power grid model, the input of time series data such as wind and PV power, and the setting of other boundary conditions. The second is the model establishment unit, which mainly completes the establishment of optimization objectives and constraints. Then, the optimization calculation unit follows, in which the paper designs a week-by-week optimization strategy and a hybrid particle swarm optimization algorithm. The final step includes the evaluation and analysis unit of the absorption capacity, which mainly analyzed the curtailment information of renewable-energy sources and the output of conventional units.
In the optimization calculation unit of the renewable-energy accommodation-capability model, the initial population size of the hybrid PSO algorithm used in this paper is set to 500, and the maximum number of iterations is set to 1000. At the same time, the convergence precision is set to ensure that the particles can jump out of the loop, and the calculation time can be shortened. This paper combines the strategy of week-by-week optimization in the hybrid PSO algorithm. Each optimization iteration considers the load of the next week (7 days), the theoretical output power of renewable energy, the system reserve capacity, the minimum startup mode of conventional units, and the power constraints of conventional units. After the optimization of the week is completed, all optimization information with respect to this week will be extracted and saved and then transferred to the next week as the initial optimization value of the next week to optimize the data of the entire year in turn. The optimization information includes the startup and shutdown status of the unit, the pumping and discharging status of the pumped storage unit, the power generation capacity of the conventional unit, and so on. The results calculated by the week-by-week optimization strategy have high accuracy and can shorten the calculation time. The calculation process is shown in Figure 3.

3. Modelling Renewable-Energy Accommodation Capabilities

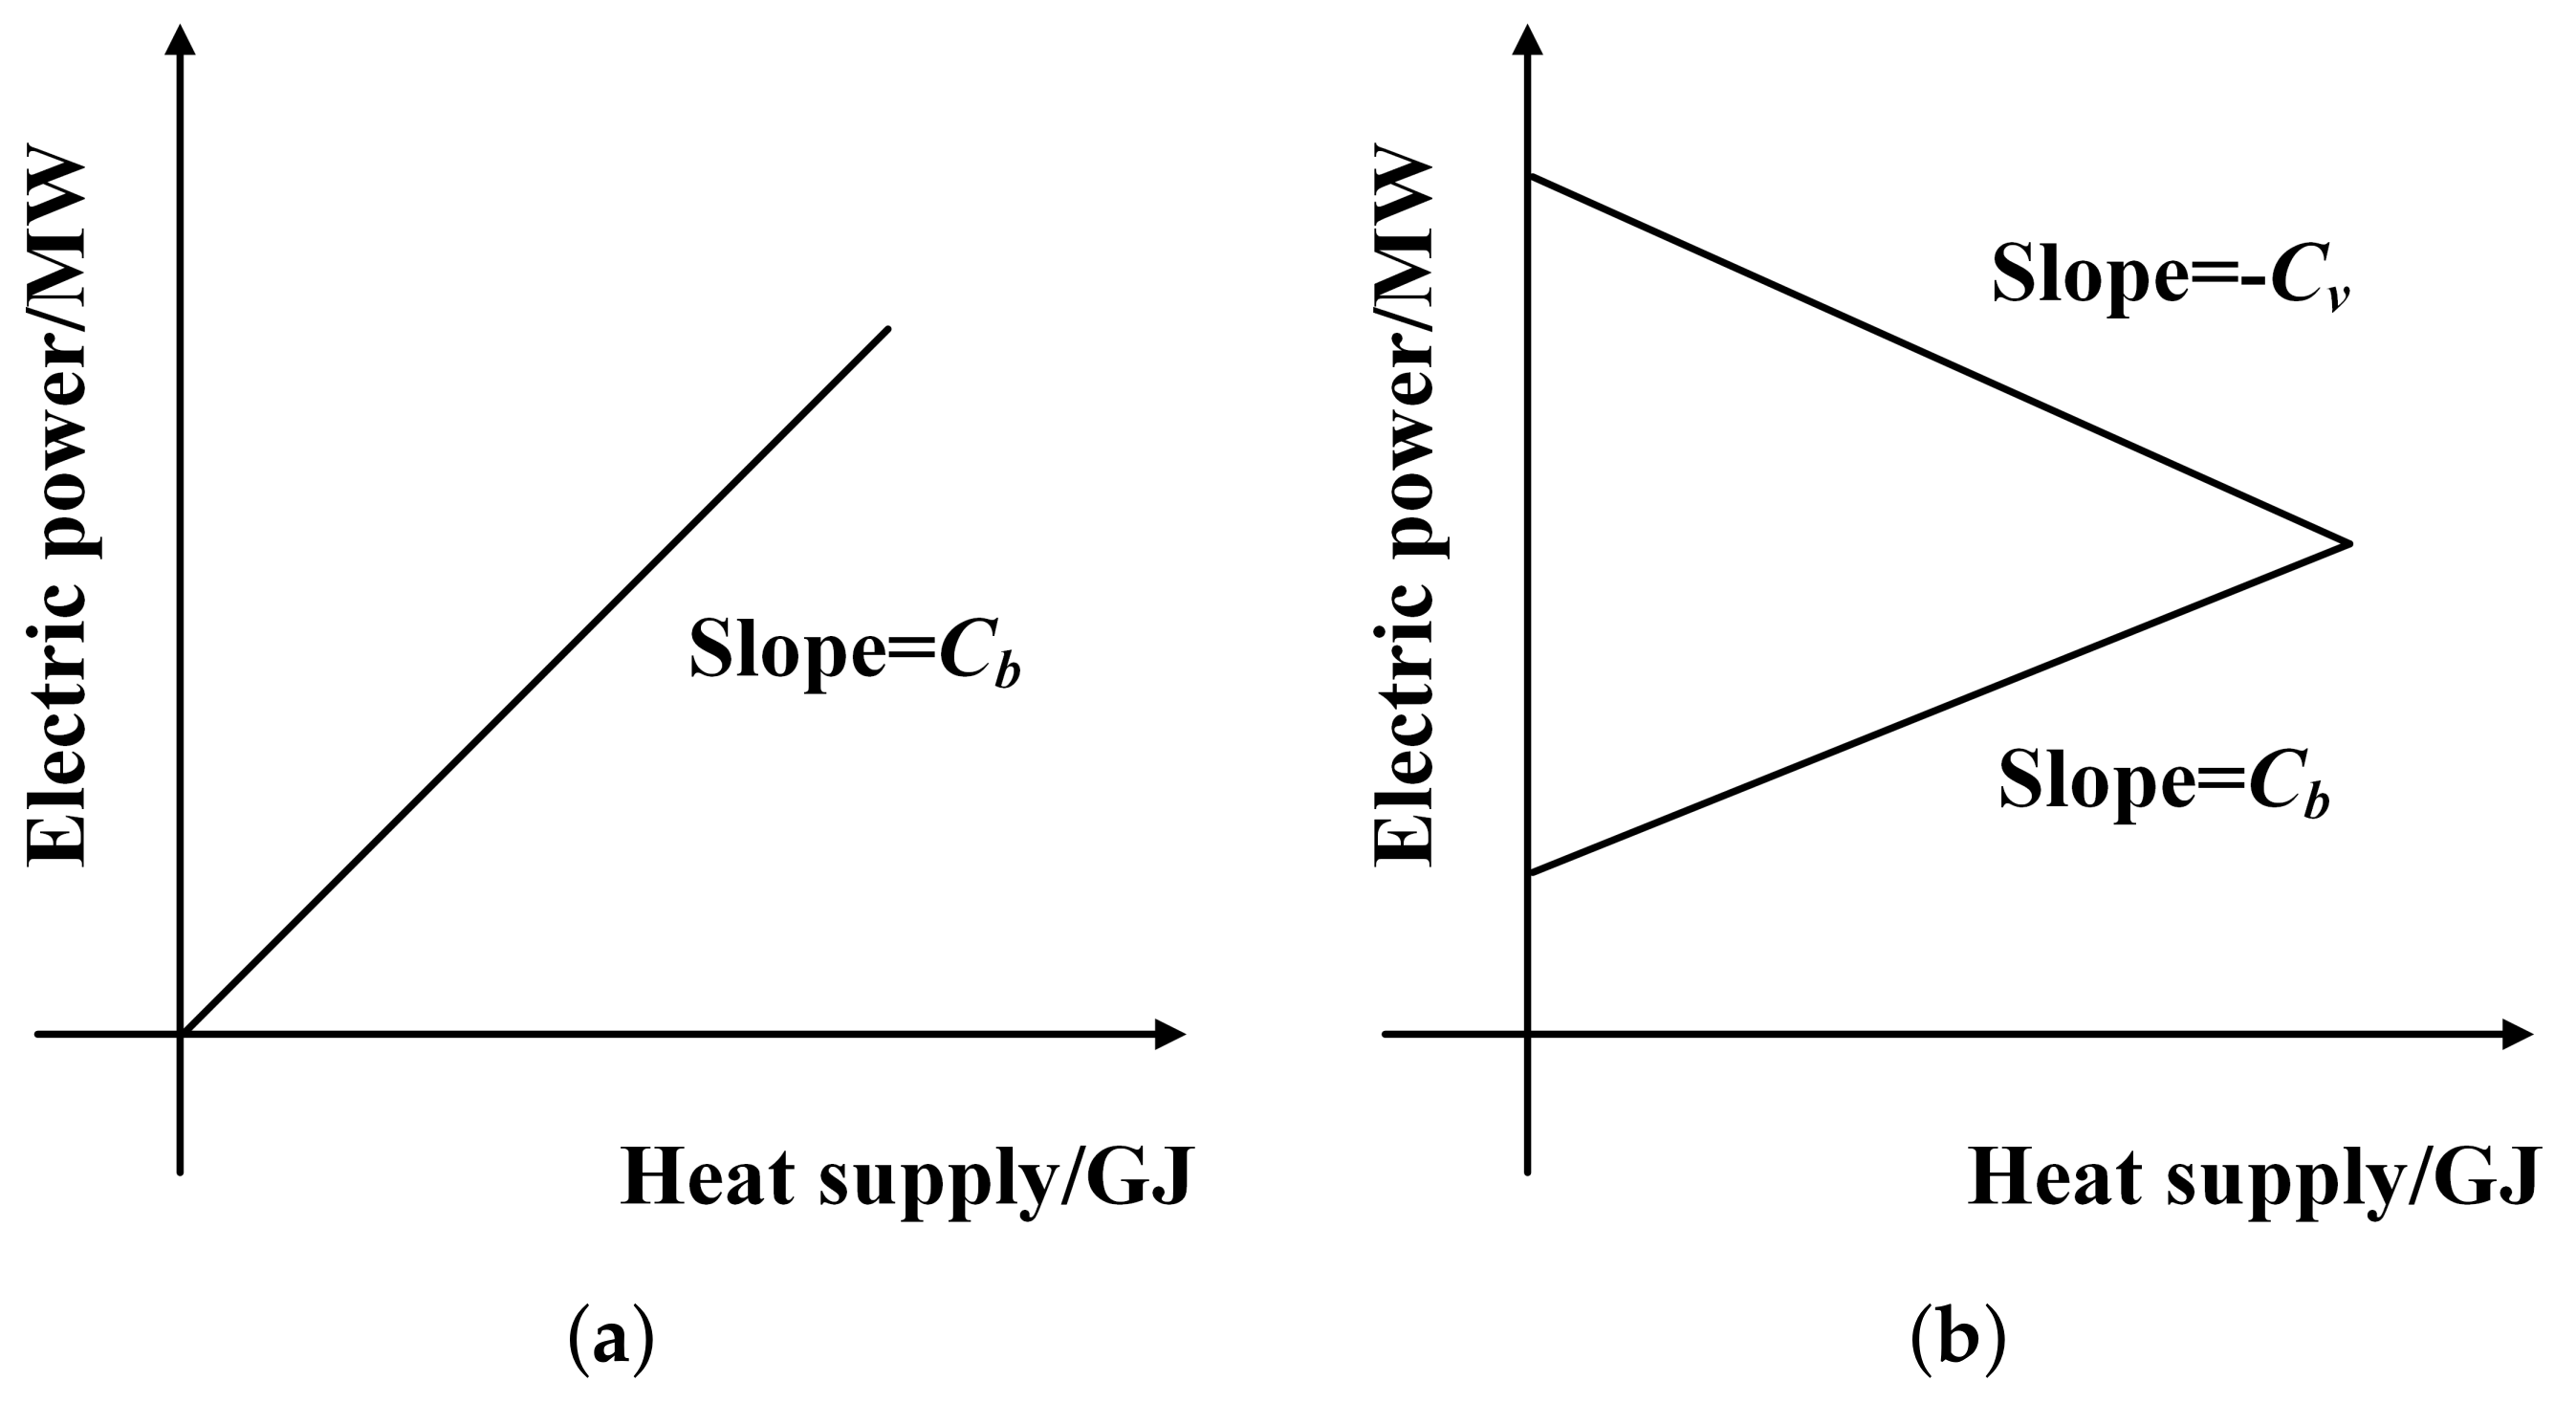
3.1. Conventional Unit Model

Thermal power units are still the main part of power generation in the current grid and play an important role in accommodating renewable energy. The thermal power generator group consists of condensing steam turbine units for power generation and back pressure turbine and pumping unit units for heat supplies. As shown in Figure 4a, the relationship between the electric power and heat suuply of the back pressure turbine is expressed as follows:
P i , t = H i , t × C b
where C b is the ratio of electric power and heat suuply of the unit, H i , t is the heat suuply of the unit, and P i , t is the electric power of the unit.
As shown in Figure 4b, the relationship between electric power and the heat suuply of the pumping unit is different from that of the back pressure turbine. The relationship can be expressed as follows:
P i , t S i Mx + H i , t × C b P i , t S i Ex H i , t × C v
where S i Mx and S i Ex are the minimum and maximum power output of the unit, respectively.
As hydroelectric power stations are divided into runoff hydroelectric power stations without regulating capacity and adjustable hydroelectric power stations with regulating reservoirs, the power of different hydroelectric power stations is different. The operation of hydroelectric power stations is closely related to water resources. The power generation of runoff hydroelectric power stations is basically determined by the river’s flow. Although there is no minimum output limit for the adjustable hydroelectric power stations with a regulating reservoir, the inflow and capacity of the reservoir are factors limiting its output, as shown in Equation (8):
W s + W in t P t rese W s + 1 W min W s W max
where W s is the initial power generation capacity of the reservoir, W in is the power generation capacity of the newly added water in the reservoir, t P t rese is the actual power generation capacity in the current cycle, W s + 1 is the initial power generation capacity of the reservoir in the next cycle, W min is the minimum power generation capacity of the reservoir, and W max is the maximum power generation of the reservoir.

3.2. Renewable-Energy Model

In the time series production simulation, the output power of renewable energy is regarded as a sequence that changes with time, and the variation characteristics of the sequence should be consistent with the variation characteristics of the renewable energy resources in the region. Currently, the research methods of wind-power time-series output-power prediction include stochastic difference equation methods, Markov chain Monte Carlo method, etc. Although these methods comprehensively consider factors such as wind speed randomness, volatility, seasonality, and other factors when simulating the wind power time series curve, it is difficult to achieve long-term forecasting due to the low existing technical conditions and forecasting accuracy. As shown in Figure 5, the annual time-series output curve of renewable energy used in this paper is based on the historical curve of a certain region, and it is obtained by analysis.
PV output power is affected by light radiation intensity, weather conditions, climate temperature, etc., and has serious instability. Currently, the predicted solar power generation technology mainly includes PV power generation and photothermal power generation. Although the principle and technology are different, its power generation output is the same as that related to lighting. As shown in Figure 6, the PV power time-series curve proposed in this paper is similar to the wind-power time-series curve. It is also based on the historical curve of the region, and then it is obtained by using statistics and analysis.

3.3. Optimization Model

By conducting the above analysis, this paper takes the maximum annual accommodation of renewable energy as the goal and establishes a time-series production simulation model, that is, the total amount of renewable energy accommodation capacity in all periods of time in each region is the largest, and its objective function is shown in (9).
f = max t = 1 T n = 1 N P w t , n + P pv t , n
While taking the maximum renewable energy accommodation capacity as the optimization goal, this paper also considers the constraints of power balance, system reserve capacity, thermal power unit output, thermal power unit ramping, and other constraints to simulate the actual operation of the power grid point by point. The system’s spinning reserve capacity constraint is expressed as follows:
n = 1 N j = 1 J P j , max t , n · S j t , n P w t , n P pv t , n n = 1 N P l t , n P r e n = 1 N j = 1 J P j , min t , n · S j t , n + P w t , n + P pv t , n n = 1 N P l t , n N r e
where P j max t , n is the percentage of the maximum output of the jth type unit in the sub-grid n at time t to the installed capacity. S j t , n is the number of the jth type unit operating in the sub-grid n at the time t. P l t , n is the total load in the district grid n at the time t. P re and N re are the positive and negative spare capacity of the system, respectively.
The system power balance constraint needs to consider the interconnection line power transmitted across regions and the grid connection of wind power and PV power generation at the same time:
j = 1 J P j t , n · S j t , n + P w t , n + P pv t , n + L i t = P l t , n
where P j t , n is the output of the jth unit at time t in the partitioned power grid n, and L i t is the power of the ith restricted section.
In Equations (13) and (14), the output of conventional units is mainly limited by its maximum and minimum technical output constraints, which are expressed as follows:
0 Δ P j t , n P j , max t , n P j , min t , n × S j t , n
P j t , n = P j , min t , n · S j t , n + Δ P j t , n
where Δ P j t , n is the optimal power size of the jth conventional unit at time t in power grid n, P j t , n is the output of the jth type of unit in power grid n at time t, and P j , max and P j , min are the maximum and minimum technical output of the jth unit, respectively.
Equations (15) and (16) provide the ramp rate constraint of the output power of the conventional unit:
P j t + 1 , n P j t , n Δ P j up n
P j t , n P j t + 1 , n Δ P j down n
where Δ P j , up and Δ P j , down are the up-slope rate and the down-slope rate of the jth unit, respectively.
The starting and stopping constraints of the unit are shown in (17):
0 S j t , n S j max n
where S j max n is the total number of jth units at time t in the partitioned power grid, n.
When the output of renewable energy in a certain area is sufficient, it can be considered to send excess power. When the load is high and the system adjustment capacity in the area cannot meet the power balance, the tie line can be considered to receive power. The outgoing power is subject to the power constraints of the outgoing transmission line:
L j , min L i t L j , max
where L j , min and L j , max are the upper and lower limits of the transmission capacity of the ith transmission line, respectively, and the current reference direction is set as the inflow area as the positive direction, and the outflow area is set as the negative direction.
Thus far, the renewable-energy accommodation-capacity model based on time-series production simulation has been established. Mathematically, this model boils down to solving the mixed integer linear programming (MILP) problem. Solving the mixed integer programming model mainly includes two types: exact algorithm and heuristic algorithm. The exact algorithm can obtain the exact optimal solution of the model, but its disadvantage lies in the problems in which many decision variables cannot be dealt with quickly under the existing conditions. Therefore, this paper adopts the particle swarm algorithm in the heuristic algorithm to solve the problem. On the basis of the conventional particle swarm optimization, this paper changes the constant inertia weight to adaptive inertia weight, which avoids the problem of falling into a local optimum in the process of optimization. At the same time, the penalty function method is added to the algorithm, which satisfies the requirements of complex constraints in the proposed optimization model. By improving the algorithm, it has the advantages of fast convergence speed, good stability, and good optimization results, and it is more suitable for the solution of the proposed optimization model.

4. Case Analysis

Taking the power grid of a certain region as an example, this paper establishes a renewable-energy output time-series model, a load time-series model, various types of conventional power-supply models, and power-grid operation models. Based on the historical actual operation data, according to the actual power-on principle of conventional power sources such as thermal power and hydropower, an optimization model is established with the goal of maximizing the accommodation capacity of renewable energy, and the actual load, tie line exchange power, and wind and solar resource data are used to measure the power grid. Renewable energy accommodation capacity. In the simulation calculation, the example combines the time-series variation characteristics of the power-grid operation mode, and under the given boundary conditions of the power system operation, the time-series simulation of various power-supply operation conditions and the balance of power generation and accommodation capacity is carried out. Finally, the simulation calculation obtains the renewable-energy power, which the grid can consume under a certain grid structure, installed capacity, and load level, and then it analyzes the operation of conventional power sources in this year.

4.1. Boundary Conditions

The boundary condition of power grid operation is an important basis for measuring the renewable energy accommodation capacity in the power grid. The boundary conditions required to measure the renewable energy accommodation capacity mainly include system reserve capacity, conventional power supply startup mode, maximum and minimum output power of units, load data, wind and PV output power, and tie-line principle. The boundary conditions used in this example are shown in Table 1.
The time resolution of the time-series data used in the study is 1 h. Figure 8 is the power curve of the tie line, the power received is positive, and the output is negative. The analysis shows that the power of the tie line in this region is in a state of acceptance all year round, which provides room for improvements in the renewable energy accommodation capacity of the region. In addition to the load data, wind and PV power data, and tie-line data, the time-series data used in the calculation also include nuclear power output data and hydropower output data without adjustment capacities. Since the output of nuclear power and hydropower without adjustment capability are relatively stable, both units have no adjustment capability. Therefore, the power of the two are set as 2850 MW and 1000 MW, respectively, and thes do not change with the time series.

4.2. Analysis of Simulation Results

Case A: Calculation of renewable energy accommodation capacity under historical data.
In this case, the annual renewable energy accommodation capacity in the region is calculated based on the boundary conditions given above, and the calculation time is 14 min, which verifies the efficiency of the calculation method of accommodation capacity proposed in this paper. Figure 9 and Figure 10 show the unit output curve and the renewable energy curtailment curve for the entire time period under the historical data. Figure 9a,b are the output curves of hydropower units and thermal power units, respectively. The output curves of various units conform to the conventional unit adjustment priority rules set in this paper; that is, the output of hydropower units is prioritized. When the hydropower unit can no longer be adjusted, adjust the output of the thermal power unit. Through the output curve of the unit, the peak shaving margin of the power grid in each time period can be analyzed to provide a reference for the power grid to consume renewable energy. Figure 10a,b, respectively, show the power abandonment information of wind power and PV in this case, and the figure shows the power abandonment amount at each moment in the calculation time. Obviously, compared with the two seasons of spring and autumn, the curtailed electricity of renewable energy in the two seasons with high load in summer and winter is significantly reduced. In this case, if dispatching is carried out according to the optimized unit output, the total amount of wind and PV power curtailment in the region for the entire year is 3.37 × 10 5 MWh and 1.51 × 10 6 MWh, respectively, and the curtailment ratio is 13.51% and 8.77%, respectively. The calculation results take into account the annual characteristics of renewable energy and constraints related to time series, follow the actual situation, and they are suitable for renewable energy accommodation and power system scheduling.
Case B: Calculation of the renewable energy accommodation capacity after adjusting the power of the tie line.
In order to further reduce the proportion of electricity curtailment from renewable energy, this experiment will adjust the power of the tie line in the boundary conditions under the premise of complying with the actual situation of the area and recalculates the renewable energy accommodation capacity of the area. In this experiment, the power of the tie line is set to be adjustable within a range of plus or minus 500 MW. The final calculation results are shown in Figure 11 and Figure 12. The time used for this calculation is 18 min, which is not that different from the calculation time of Case A. Figure 11a,b show the full-time output curves of the hydroelectric power unit and thermal power unit under Case B, which still conform to the actual situation in the region. Figure 12a,b are the curtailment information of wind power and PV power in this case. By adjusting the power of the tie line, the curtailment of the two renewable energy sources decreased, the curtailment ratio of wind power dropped from 13.51% to 5.22%, and the curtailment ratio of PV dropped from 8.77% to 5.12%. Although the renewable energy in this area has not been fully absorbed, the experimental results of this case show that the power of the tie line has a significant effect on the accommodation capacity of renewable energy.

5. Conclusions

This paper studies the evaluation method of the accommodation capacity of large-scale renewable energy in the power grid. The evaluation method of renewable energy accommodation capacity proposed in this paper can simulate the operation status of the power grid point by point and conduct quantitative analysis on it. According to the analysis of the influencing factors of the renewable energy accommodation capacity, the grid aggregation model is established, and the evaluation indicators of the renewable energy consumption capacity is given. On this basis, this paper comprehensively considers the boundary conditions of power grid operation and the power balance of the power grid, and then it establishes a renewable energy accommodation model based on time-series production simulations with the goal of the maximum annual accommodation of renewable energy. In the solution process, the week-by-week optimization strategy is combined with the hybrid particle swarm optimization algorithm to realize the rapid solution of the model. Finally, taking the historical data of a certain region as an example, the correctness and reliability of the proposed evaluation method are verified. The method proposed in this paper can be used to calculate and analyze the new energy-accommodation capacity of provincial, regional, and national power grids. The research results can not only provide references for power-grid dispatching and operation but also provide a basis for power-grid planning departments.
In the research of large-scale renewable energy accommodation capacity, only the energy balance and power balance of the grid are considered. The system’s balance and other factors when connecting to the existing power grid require further in-depth analysis and research, which will be examined in future research.

Author Contributions

Data curation, C.T.; Formal analysis, Y.D. and J.Q.; Investigation, C.T., W.Z. and H.Z.; Methodology, D.Z.; Project administration, D.Z.; Resources, F.G.; Software, Q.Z.; Supervision, W.Z.; Validation, Y.D., F.G. and J.Q.; Writing—original draft, Q.Z. All authors have read and agreed to the published version of the manuscript.

Funding

This research was funded by ENERGY FOUNDATION, grant number G-2019-33293, and the Key Research and Development Program of Zhejiang Province, grant number 2019C01149.

Data Availability Statement

Not applicable.

Conflicts of Interest

The authors declare no conflict of interest.

References

  1. Huang, Z.; Huang, L. Individual new energy consumption and economic growth in China. N. Am. J. Econ. Financ. 2020, 54, 101010. [Google Scholar] [CrossRef]
  2. Xue, F.; Feng, X.; Liu, J. Influencing Factors of New Energy Development in China: Based on ARDL Cointegration and Granger Causality Analysis. Front. Energy Res. 2021, 9, 475. [Google Scholar] [CrossRef]
  3. Xu, X.L.; Qiao, S.; Chen, H.H. Exploring the efficiency of new energy generation: Evidence from OECD and non-OECD countries. Energy Environ. 2020, 31, 389–404. [Google Scholar] [CrossRef]
  4. Su, X.; Bai, X.; Liu, C.; Zhu, R.; Wei, C. Research on Robust Stochastic Dynamic Economic Dispatch Model Considering the Uncertainty of Wind Power. IEEE Access 2019, 7, 147453–147461. [Google Scholar] [CrossRef]
  5. Dingbang, C.; Cang, C.; Qing, C.; Lili, S.; Caiyun, C. Does new energy consumption conducive to controlling fossil energy consumption and carbon emissions?—Evidence from China. Resour. Policy 2021, 74, 102427. [Google Scholar] [CrossRef]
  6. Moretti, L.; Astolfi, M.; Vergara, C.; Macchi, E.; Pérez-Arriaga, J.I.; Manzolini, G. A design and dispatch optimization algorithm based on mixed integer linear programming for rural electrification. Appl. Energy 2019, 233–234, 1104–1121. [Google Scholar] [CrossRef]
  7. Haghighat Mamaghani, A.; Avella Escandon, S.A.; Najafi, B.; Shirazi, A.; Rinaldi, F. Techno-economic feasibility of photovoltaic, wind, diesel and hybrid electrification systems for off-grid rural electrification in Colombia. Renew. Energy 2016, 97, 293–305. [Google Scholar] [CrossRef]
  8. Fang, D.; Guan, X.; Peng, Y.; Chen, H.; Ohtsuki, T.; Han, Z. Distributed Deep Reinforcement Learning for Renewable Energy Accommodation Assessment With Communication Uncertainty in Internet of Energy. IEEE Internet Things J. 2021, 8, 8557–8569. [Google Scholar] [CrossRef]
  9. Lin, L.; Guan, X.; Hu, B.; Li, J.; Wang, N.; Sun, D. Deep reinforcement learning and LSTM for optimal renewable energy accommodation in 5G internet of energy with bad data tolerant. Comput. Commun. 2020, 156, 46–53. [Google Scholar] [CrossRef]
  10. Hou, L.; Li, W.; Zhou, K.; Jiang, Q. Integrating flexible demand response toward available transfer capability enhancement. Appl. Energy 2019, 251, 113370. [Google Scholar] [CrossRef]
  11. Sobhy, A.; Megahed, T.F.; Abo-Zahhad, M. Overhead transmission lines dynamic rating estimation for renewable energy integration using machine learning. Energy Rep. 2021, 7, 804–813. [Google Scholar] [CrossRef]
  12. Zhou, X.; Ma, Y.; Wang, H.; Li, Y.; Yu, J.; Yang, J. Optimal scheduling of integrated energy system for low carbon considering combined weights. Energy Rep. 2022, 8, 527–535. [Google Scholar] [CrossRef]
  13. Bu, Y.; Zhang, X. On the Way to Integrate Increasing Shares of Variable Renewables in China: Activating Nearby Accommodation Potential under New Provincial Renewable Portfolio Standard. Processes 2021, 9, 361. [Google Scholar] [CrossRef]
  14. Liu, P.; Chu, P. Wind power and photovoltaic power: How to improve the accommodation capability of renewable electricity generation in China? Int. J. Energy Res. 2018, 42, 2320–2343. [Google Scholar] [CrossRef]
  15. Liu, Y.; Guan, X.; Li, J.; Sun, D.; Ohtsuki, T.; Hassan, M.M.; Alelaiwi, A. Evaluating smart grid renewable energy accommodation capability with uncertain generation using deep reinforcement learning. Future Gener. Comput. Syst. 2020, 110, 647–657. [Google Scholar] [CrossRef]
  16. Dong, Y.; Shan, X.; Yan, Y.; Leng, X.; Wang, Y. Architecture, Key Technologies and Applications of Load Dispatching in China Power Grid. J. Mod. Power Syst. Clean Energy 2022, 10, 316–327. [Google Scholar] [CrossRef]
  17. Luo, L.; Abdulkareem, S.S.; Rezvani, A.; Miveh, M.R.; Samad, S.; Aljojo, N.; Pazhoohesh, M. Optimal scheduling of a renewable based microgrid considering photovoltaic system and battery energy storage under uncertainty. J. Energy Storage 2020, 28, 101306. [Google Scholar] [CrossRef]
  18. You, F.; Si, X.; Dong, R.; Lin, D.; Xu, Y.; Yang, Y.; Yang, D. A State-of-Charge-Based Flexible Synthetic Inertial Control Strategy of Battery Energy Storage System. Front. Energy Res. 2022, 603. [Google Scholar] [CrossRef]
  19. Al-Shetwi, A.Q.; Hannan, M.; Jern, K.P.; Mansur, M.; Mahlia, T. Grid-connected renewable energy sources: Review of the recent integration requirements and control methods. J. Clean. Prod. 2020, 253, 119831. [Google Scholar] [CrossRef]
  20. Bakhshaei, P.; Askarzadeh, A.; Arababadi, R. Operation optimization of a grid-connected photovoltaic/pumped hydro storage considering demand response program by an improved crow search algorithm. J. Energy Storage 2021, 44, 103326. [Google Scholar] [CrossRef]
  21. Wang, X.; Liu, S.; Wang, R.; Liu, C.; Zhao, Y.; Hu, Y.; Chen, Q. Research on dynamic characteristics and stability of MMC photovoltaic grid-connected system based on rotational synchronous generator model. Electr. Power Syst. Res. 2019, 173, 183–192. [Google Scholar] [CrossRef]
  22. Lin, H.; Wang, C.; Wen, F.; Tseng, C.L.; Hu, J.; Ma, L.; Fan, M. Risk-Limiting Real-Time Economic Dispatch in a Power System with Flexibility Resources. Energies 2019, 12, 3133. [Google Scholar] [CrossRef]
  23. Yu, C.; Lai, X.; Chen, F.; Jiang, C.; Sun, Y.; Zhang, L.; Wen, F.; Qi, D. Multi-Time Period Optimal Dispatch Strategy for Integrated Energy System Considering Renewable Energy Generation Accommodation. Energies 2022, 15, 4329. [Google Scholar] [CrossRef]
  24. Qu, M.; Ding, T.; Huang, L.; Wu, X. Toward a Global Green Smart Microgrid: An Industrial Park in China. IEEE Electrif. Mag. 2020, 8, 55–69. [Google Scholar] [CrossRef]
  25. Chamandoust, H.; Derakhshan, G.; Hakimi, S.M.; Bahramara, S. Tri-objective scheduling of residential smart electrical distribution grids with optimal joint of responsive loads with renewable energy sources. J. Energy Storage 2020, 27, 101112. [Google Scholar] [CrossRef]
  26. Thomas, D.; Deblecker, O.; Ioakimidis, C.S. Optimal operation of an energy management system for a grid-connected smart building considering photovoltaics’ uncertainty and stochastic electric vehicles’ driving schedule. Appl. Energy 2018, 210, 1188–1206. [Google Scholar] [CrossRef]
  27. Wang, J.; Wu, Z.; Du, E.; Zhou, M.; Li, G.; Zhang, Y.; Yu, L. Constructing a V2G-enabled regional energy Internet for cost-efficient carbon trading. CSEE J. Power Energy Syst. 2020, 6, 31–40. [Google Scholar] [CrossRef]
  28. Jiang, Y.; Guo, L. Research on Wind Power Accommodation for an Electricity-Heat-Gas Integrated Microgrid System With Power-to-Gas. IEEE Access 2019, 7, 87118–87126. [Google Scholar] [CrossRef]
Figure 1. Structure diagram of the aggregation model of a power grid.
Energies 15 06987 g001
Figure 2. Structure diagram of the calculation method of the renewable-energy accommodation capacity.
Energies 15 06987 g002
Figure 3. The flowchart of optimization calculation unit.
Energies 15 06987 g003
Figure 4. The relationship between electric power and heat suuply of different types of units. (a) Back pressure turbine. (b) Pumping unit.
Energies 15 06987 g004
Figure 5. The annual wind power output curve in a certain region.
Energies 15 06987 g005
Figure 6. The annual PV power output curve in a certain region.
Energies 15 06987 g006
Figure 7. The annual load curve.
Energies 15 06987 g007
Figure 8. The annual power curve of tie line.
Energies 15 06987 g008
Figure 9. The output power curve of the unit in the entire time period of case A. (a) The output power curve of hydroelectric power units. (b) The output power curve of hydroelectric thermal power units.
Energies 15 06987 g009
Figure 10. Full-time curtailment curve of renewable energy in Case A. (a) The curve of wind-power curtailment. (b) The curve of PV power curtailment.
Energies 15 06987 g010
Figure 11. The output power curve of the unit in the entire time period of case B. (a) The output power curve of hydroelectric power units. (b) The output power curve of hydroelectric thermal power units.
Energies 15 06987 g011
Figure 12. Full-time curtailment curve of renewable energy in Case B. (a) The curve of wind-power curtailment. (b) The curve of PV power curtailment.
Energies 15 06987 g012
Table 1. The boundary conditions for renewable energy accommodation capacity calculation.
Boundary ConditionsCalculation Conditions
System spare capacityThe positive and negative reserve capacities are 5000 MW and 1000 MW, respectively.
The maximum and minimum output power of the unitAccording to the actual minimum operation mode, the specific data are shown in Table 2 and Table 3.
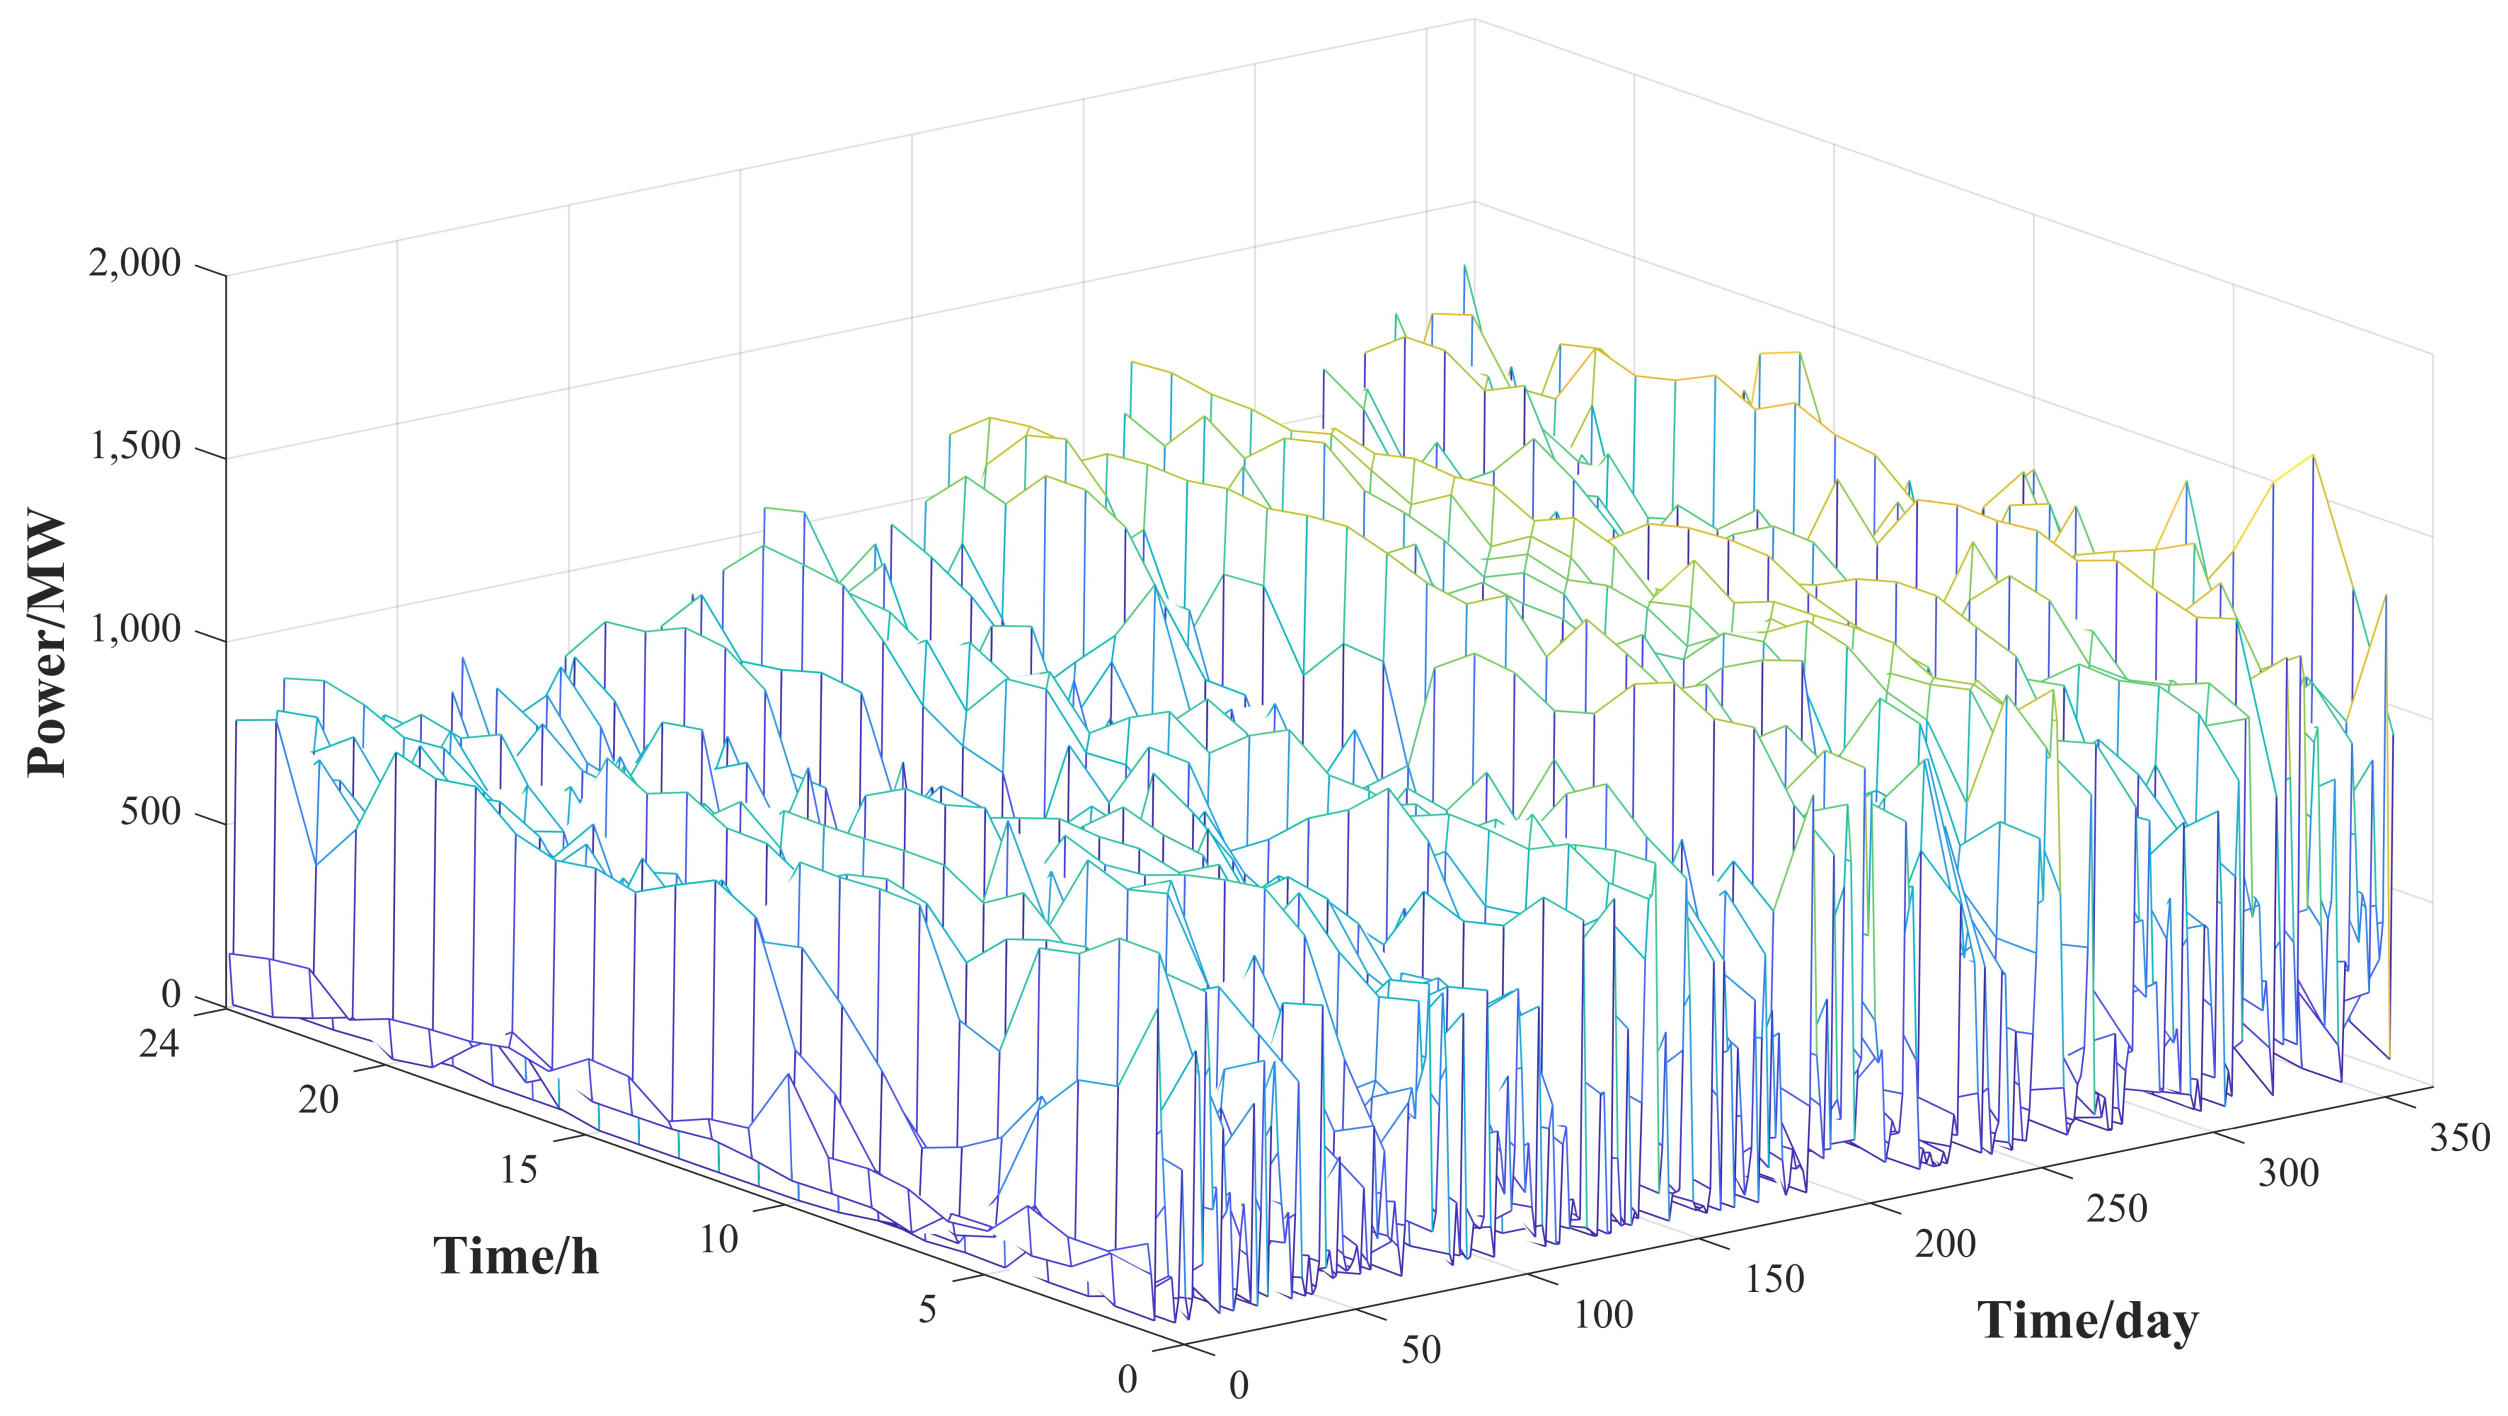
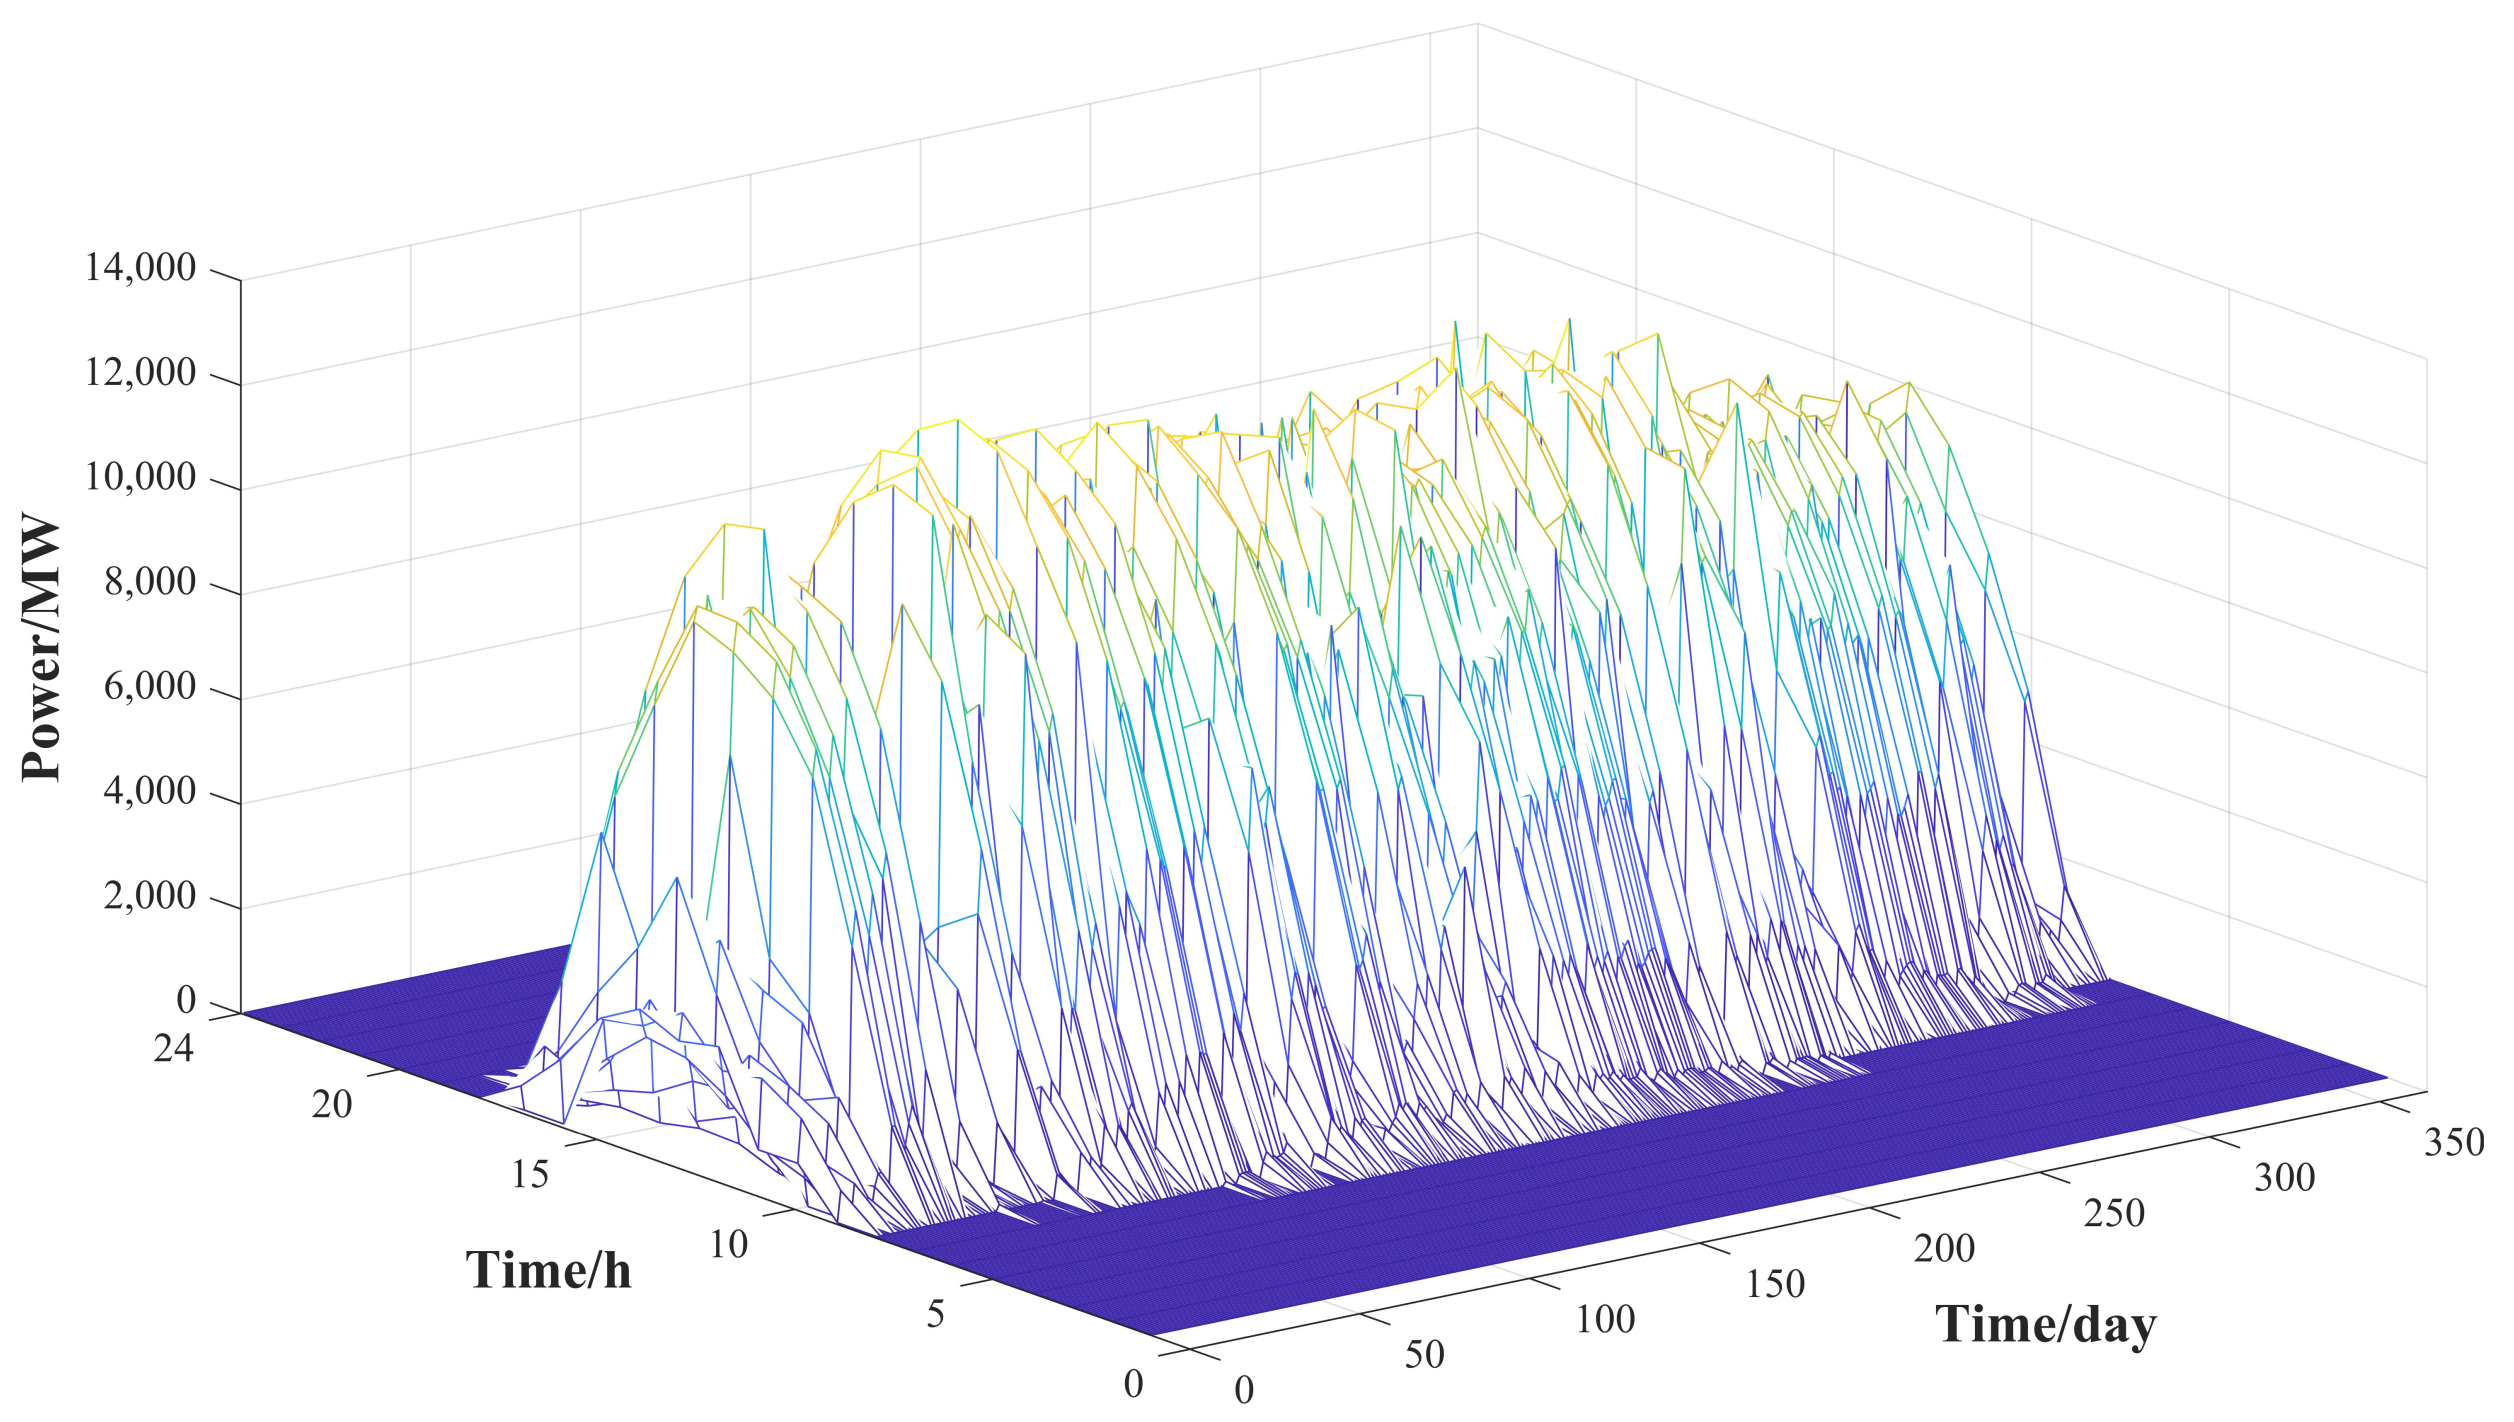
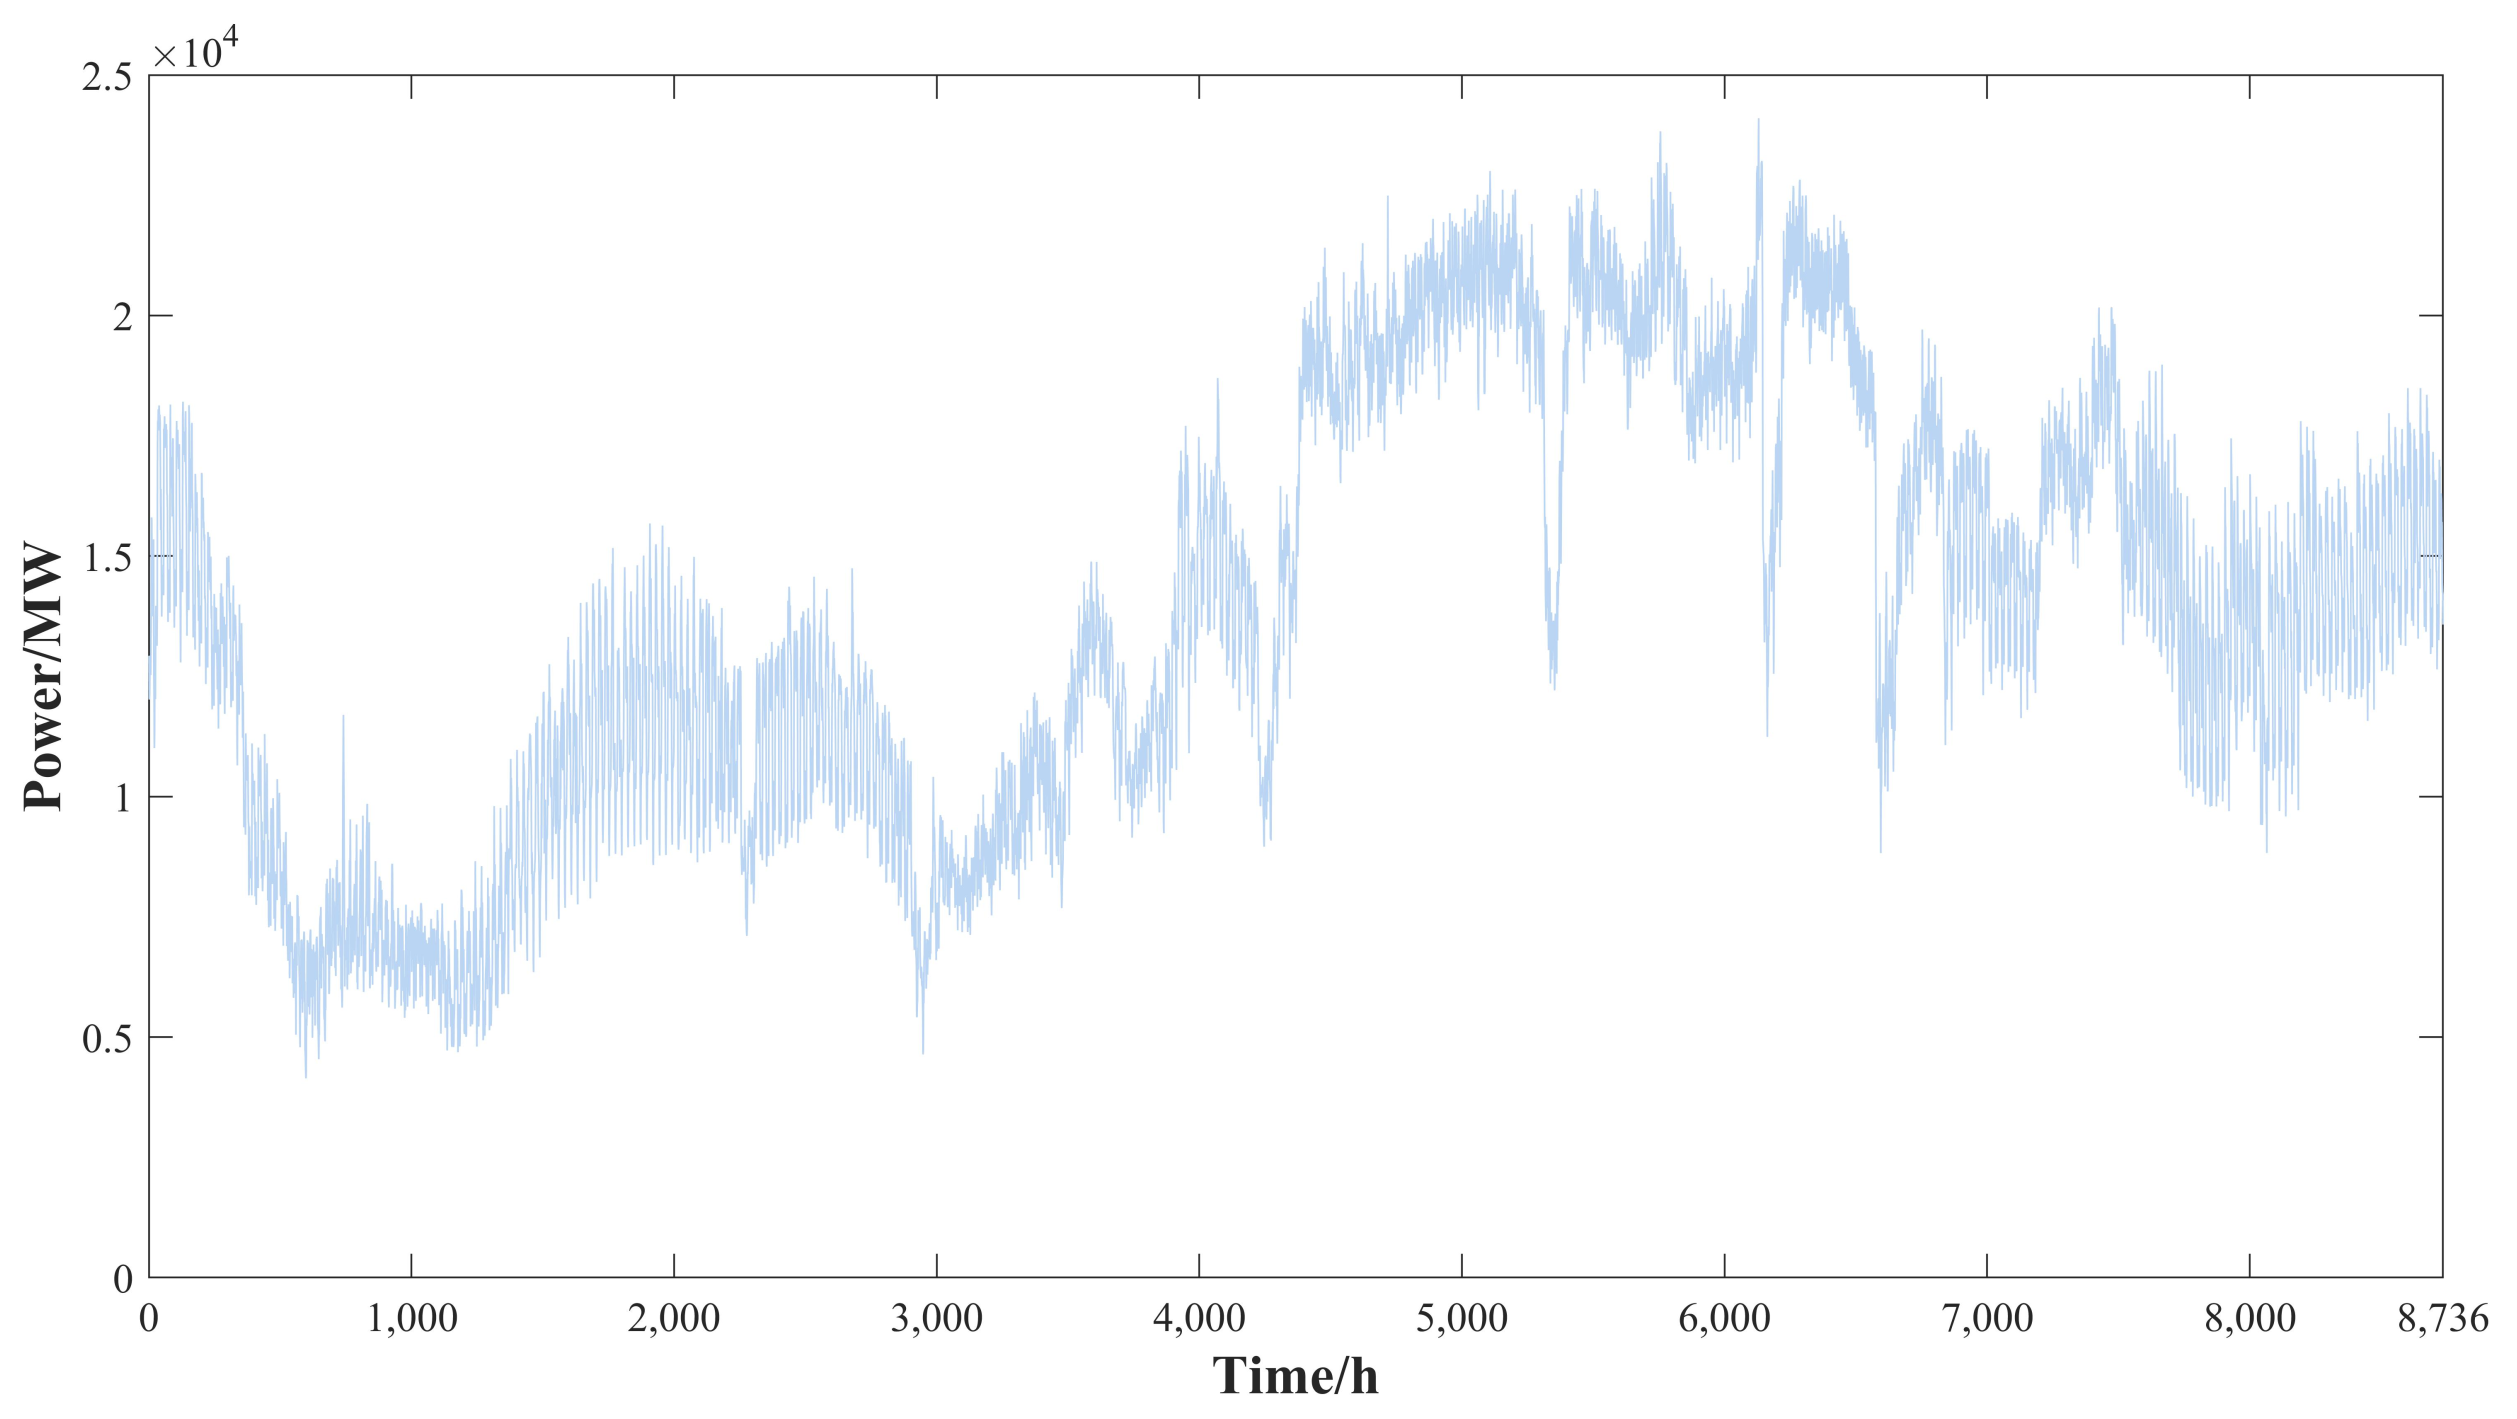
Wind and PV power outputThe actual output of wind power and PV for one year is shown in Figure 5 and Figure 6.
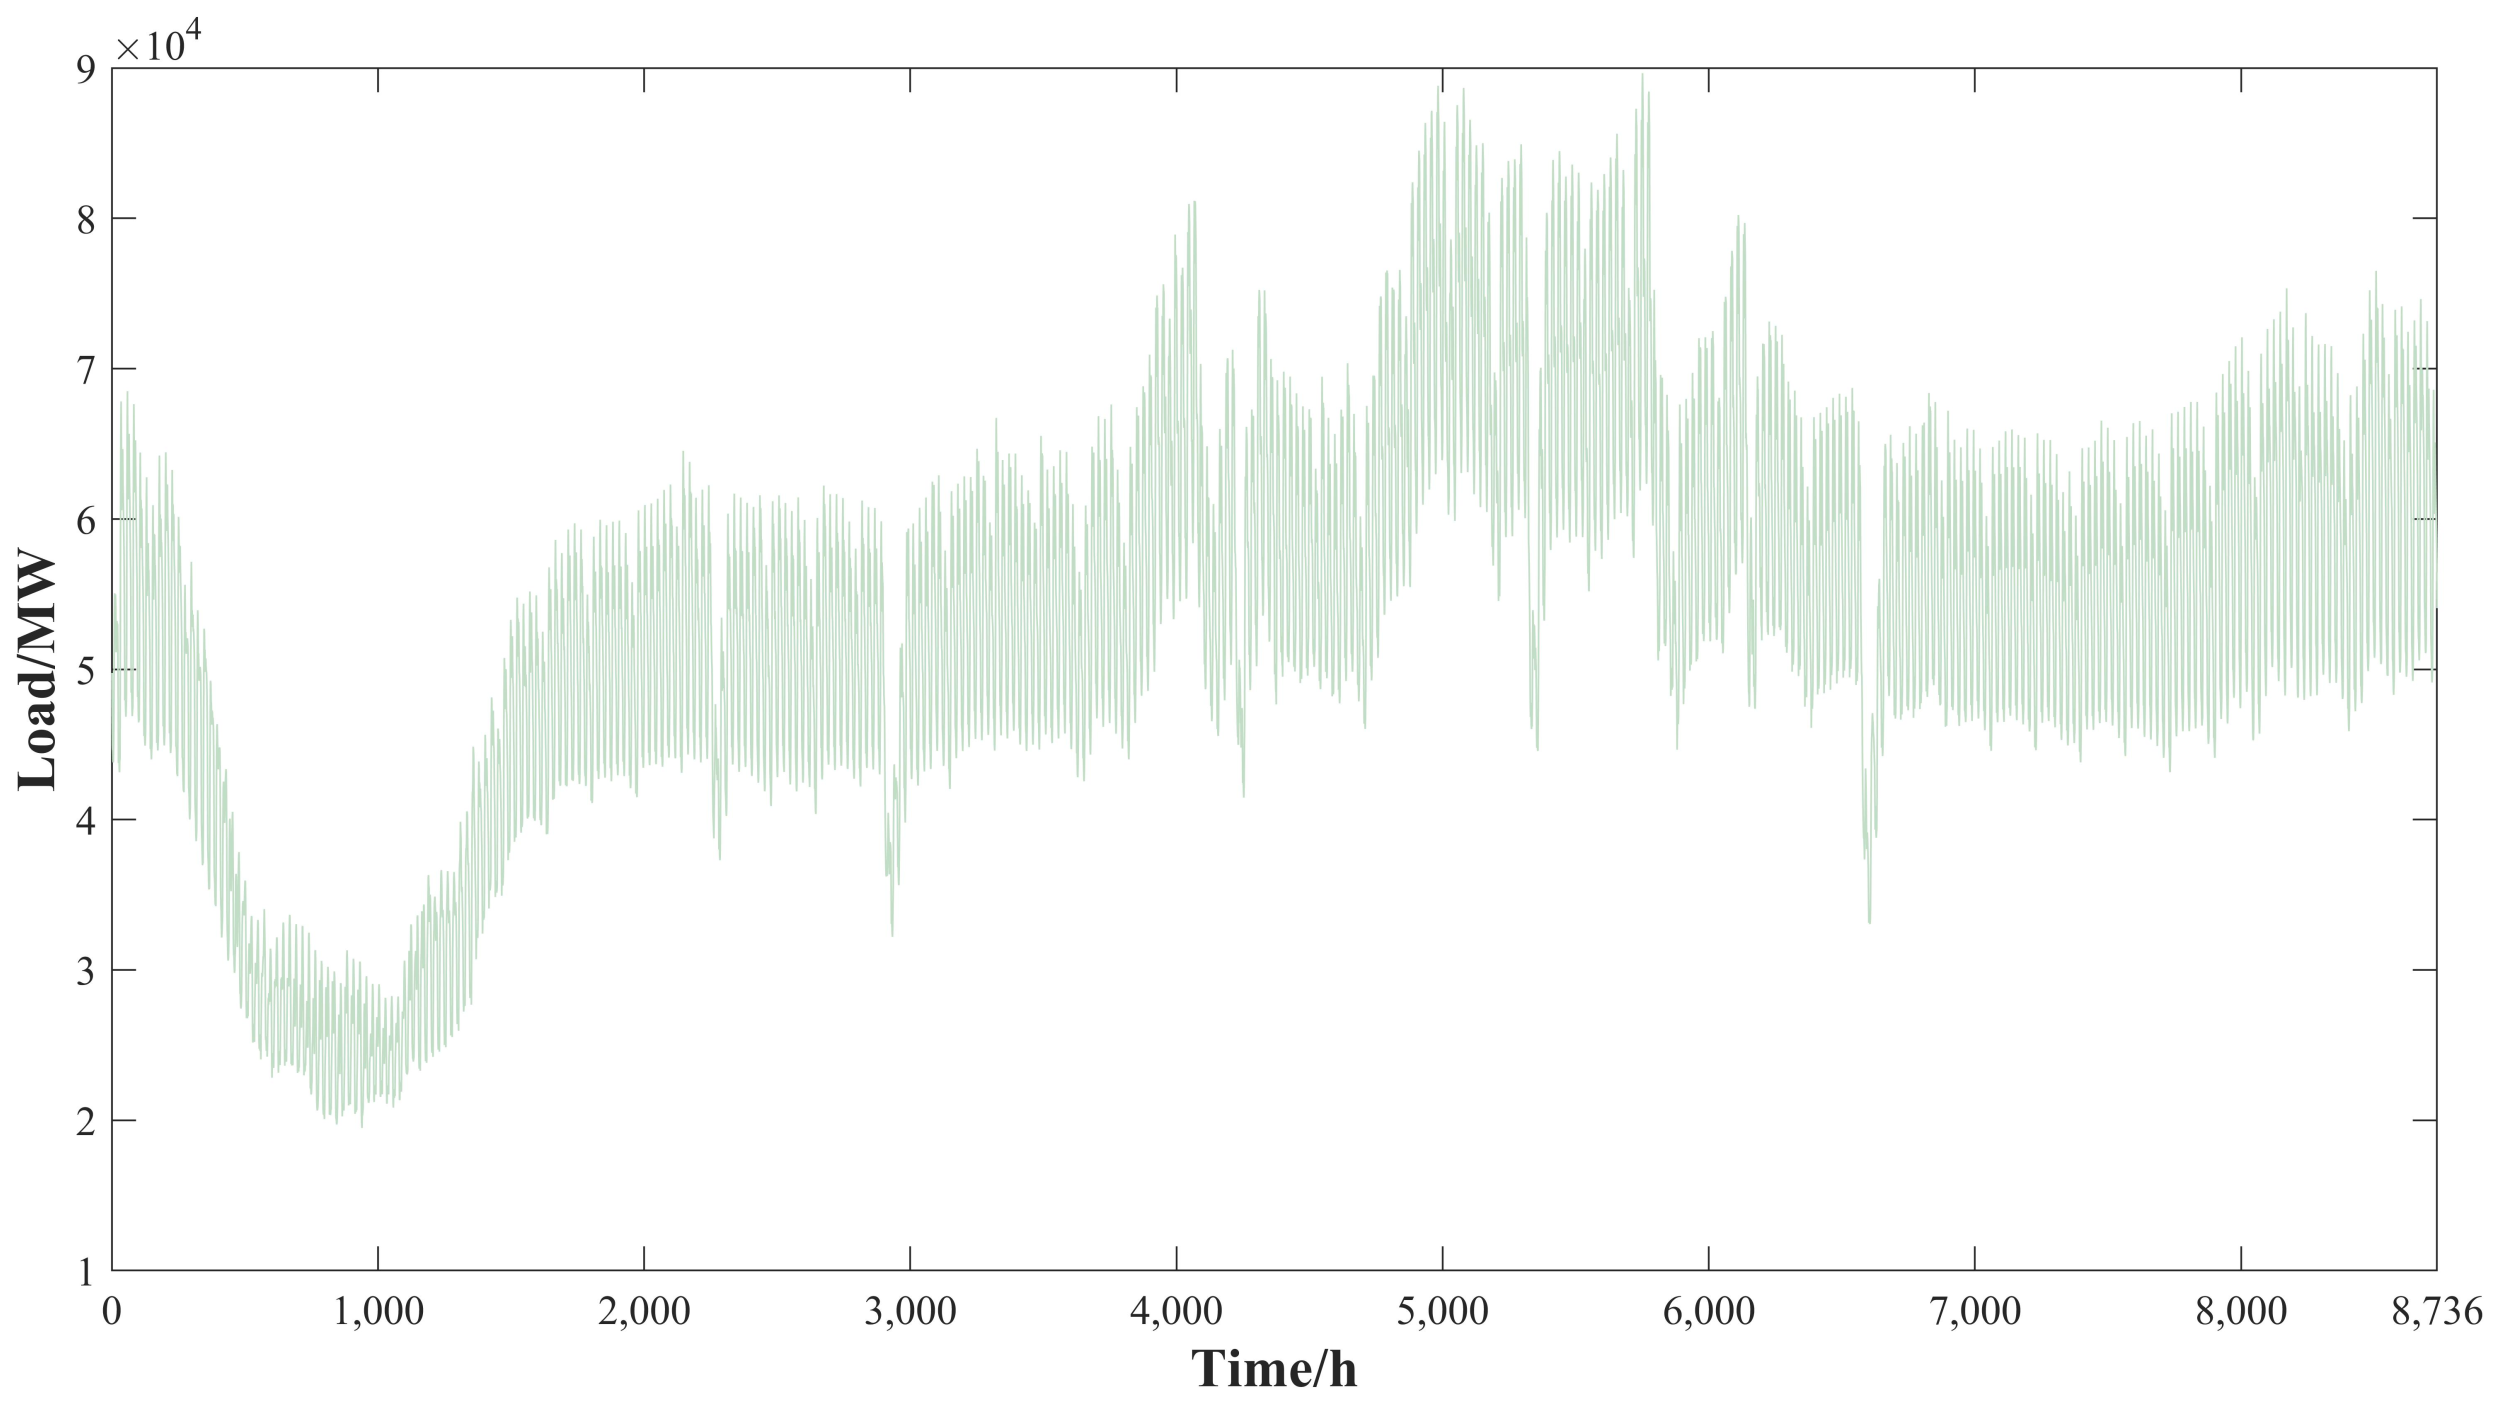
LoadThe annual actual load curve as shown in Figure 7
Tie line principleThe annual actual contact line data, as shown in Figure 8.
Conventional unit start-up methodIn this example, the unit does not set the minimum start–stop period.
Renewable energy restricted section limitIn this example, the power grid is calculated in one area, and there is no section limit.
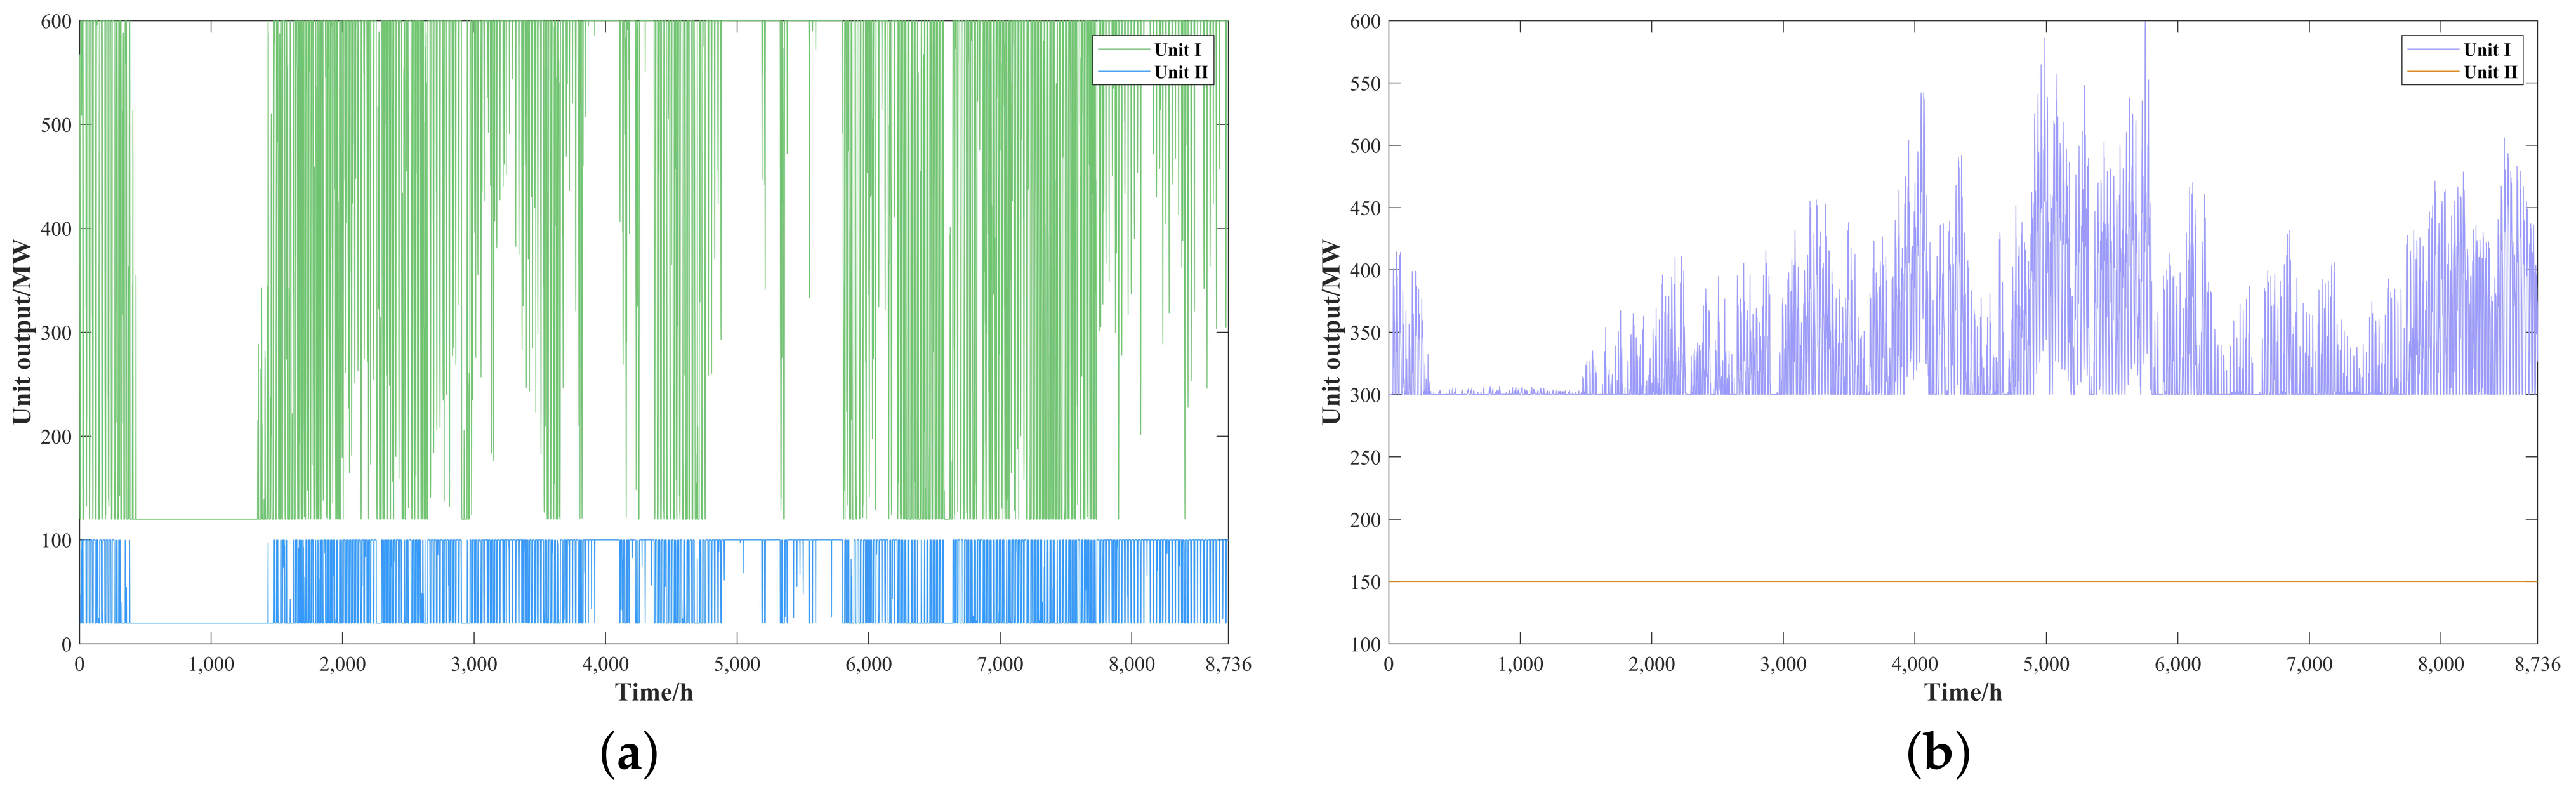
Table 2. The configuration information of conventional units.
Data TypeThermal Power Unit IThermal Power Unit IIHydroelectric Power Unit IHydroelectric Power Unit II
Number of units100111011
Single-machine capacity (MW)600300600100
Maximum output power (%)100100100100
Minimum output power (%)50502020
Ramp rate (MW/min)±60±30±60±10
Table 3. The configuration information of pumped storage power station.
Data TypeData NameData Values
Unit informationNumber of units16
Single-machine capacity (MW)300
Power conversion efficiency (%)70
Maximum output power (%)70
Minimum output power (%)0
Storage capacity informationInitial storage capacity (MWh)0
Maximum storage capacity (MWh)10,000
Minimum storage capacity (MWh)0
Publisher’s Note: MDPI stays neutral with regard to jurisdictional claims in published maps and institutional affiliations.

