Article

Effect of Filter Medium on Water Quality during Passive Biofilter Activation in a Recirculating Aquaculture System for Oncorhynchus mykiss

by
Arkadiusz Nędzarek
1,*,
Małgorzata Bonisławska
1,
Agnieszka Tórz
1,
Adam Tański
2 and
Krzysztof Formicki
2
1
Department of Aquatic Bioengineering and Aquaculture, Faculty of Food Sciences and Fisheries, West Pomeranian University of Technology in Szczecin, Kazimierza Królewicza 4, 71-550 Szczecin, Poland
2
Department of Hydrobiology, Ichthyology and Biotechnology of Reproduction, Faculty of Food Sciences and Fisheries, West Pomeranian University of Technology in Szczecin, Kazimierza Królewicza 4, 71-550 Szczecin, Poland
*
Author to whom correspondence should be addressed.
Energies 2022, 15(19), 6890; https://doi.org/10.3390/en15196890
Submission received: 14 July 2022 / Revised: 12 September 2022 / Accepted: 15 September 2022 / Published: 20 September 2022

Abstract

:

Highlights

What are the main findings?
  • The high specific surface area of the biofilter media has a positive effect on nitrification.
  • The smooth surface of the biofilter medium reduces the efficiency of nitrification.
What is the implication of the main finding?
  • Passive biofilter activation can be used in salmonid RAS.
  • P and C concentrations do not limit nitrogen transformation processes.

Abstract

High-performance biofilters for water purification in recirculating aquaculture systems (RAS) ensure the safety of cultures of highly nutritious fish. As the most critical step in the functioning of biofilters is their activation, the objective of this study was to evaluate the suitability of commercial artificial media, namely RK Plast (BR-1), Mutag-BioChip30 (BR-2), and LevaPor (BR-3), for the passive activation of biofilters used in rainbow trout farming. Changes in NH4+-N, NO2-N, NO3 -N, phosphorus, and carbon concentrations were analyzed. In the first period, an increase in NH4+-N concentration was recorded, before an increase in NO2-N concentration (maximum concentrations ranged 0.728–1.290 and 0.982–5.198 mg N dm−3, respectively), followed by a reduction and stabilization to a level safe for the fish (both below 0.100 mg N dm−3). Concurrently, a steady increase in NO3-N concentration was noted, with a maximum concentration between 6.521 and 7.326 mg N dm−3. Total phosphorus and total carbon ranged from 0.423 to 0.548 mg P dm−3, and from 43.8 to 45.2 mg C dm−3. The study confirmed the feasibility of using the tested artificial biofilter media for rainbow trout farming in RAS with passive biofilter activation. Biofilter activation efficiency was highest for the media with the highest specific surface area (BR-2 and BR-3). The removal of ammonium nitrogen and nitrite nitrogen was above 90%. Nitrogen biotransformation was not limited by phosphorus or carbon concentrations.

1. Introduction

Fish is a very significant food source, with an annual growth in consumption of about 2.1%. In 2018, 82 million tonnes of fish were produced from aquaculture, accounting for almost 50% of global production [1].
The over-exploitation of natural fish reserves and the ever-increasing environmental restrictions on traditional aquaculture are favoring the development of intensive aquaculture in recirculation systems (RAS), where the negative impact on the environment is much lower than in open systems. At the same time, the introduction of technological innovations and the rising standards of fish farming in RAS are an opportunity to obtain fish products that are safe for consumer health. Modern recirculating aquaculture integrates a number of devices in an automated system, such as microfilters, smart feeding devices, and water degassing, quality treatment and monitoring systems, as well as biofilters necessary for biological water purification [2,3,4].
Biofilters convert ammonia nitrogen to nitrite nitrogen and then to the less toxic nitrate nitrogen for the fish [5,6]. This process, known as nitrification, is carried out by biofilm-forming bacteria on the biofilter medium. The efficiency of the biofilter is related to the surface area that the bacteria colonize. The greater the surface area of the medium used, the greater the area for colonization by bacteria and contact with the medium, resulting in a biofilter with more bacteria removing ammonia from the system [7,8].
Bacterial substrates are non-corroding materials, such as fiberglass, ceramic, rock, or plastic, with increasingly popular plastic molds producing a variety of shapes with a high surface area per unit of volume (usually referred to as the specific surface area—SSA). However, biofiltration media with a higher SSA can be more easily clogged by the bacteria (biofouling) than media with lower SSA, resulting in a reduced biofilter performance. There must, therefore, be a balance between a high SSA and an operationally reliable biofilter [6,8].
One important step in the operation of a water treatment system in a RAS, is the activation of the biofilter, with one strategy involving passive activation (the cold start method) in which the fish culture is conducted without a previously activated biofilter. This method has the advantage of using bacteria that are introduced into the culture system along with the fish. However, due to the potential for high increases in ammonia and nitrite concentrations, it requires a higher water exchange rate and a reduction in feed intake until the biofilter is activated [9,10].
It should also be borne in mind that seed sludge for the inoculation of bioreactors in RAS is not always available, and that seed sludge from municipal or industrial wastewater treatment systems is not recommended because it may contain pathogens. Thus, the method of passive activation, despite some limitations, may be the only one that can be used, especially for breeding fish with high environmental requirements, for euryhaline species (such as salmon), and also when it is desirable to protect the culture from the influence of foreign microflora. Passive activation can reduce stress not only for the fish, but also the microorganisms already inhabiting the bioreactors [10,11].
The aim of this study then was to evaluate the passive activation of selected biofilter beds in a recirculating aquaculture system used for culturing cold-water salmonid fish (rainbow trout, Oncorhynchus mykiss), and to compare changes in the concentration of nitrogen, phosphorus, and carbon during this process, between the shapes and specific surface areas of the various plastic substrates (non-porous medium with a smooth surface, hard porous medium and soft porous medium with activated carbon). The experiments were performed as part of a pilot study to select the most suitable bed for the water treatment system in the O. mykiss breeding facility under construction.

2. Materials and Methods

Laboratory-scale recirculating systems for rainbow trout culturing were used to study the process of biofertilizer passive activation. The systems were located in the isothermal laboratory of the Faculty of Food Sciences and Fisheries, West Pomeranian University of Technology in Szczecin (Poland). The efficiencies of the biochemical processes in the biofilters were evaluated by analyzing the variability of particular physicochemical parameters of the water circulating in the culture systems.

2.1. Recirculating System

Each recirculating system consisted of a circular fish rearing tank (capacity 1 m3) filled with distilled tap water to a volume of 0.54 m3, and two bioreactors with a test medium (Figure 1). The bioreactor was a FLUVAL FX-6 from Rolf C. Hagen Corp. (Mansfield, MA, USA) canister filter with a total volume of 0.02 m3. The volume of the media baskets in the bioreactor was 0.0059 m3. The water flow rate through the bioreactor was 0.00055 m3 s−1. The bioreactor outflows were set so that the water in the fish pool circulated clockwise, forcing the fish to position themselves in the water current. Ten percent of the water was replaced with fresh water each day. The water in the culture tanks was continuously oxygenated using atmospheric air dispersion, maintaining a dissolved oxygen concentration between 90–98%. Water temperature was maintained at 12 ± 2 °C and water pH was in the range of 7–8. The rearing was carried out in a day/night 12/12 h day/night light cycle.
Twenty fish, with an initial average length of 235 ± 1 mm and an average weight of 168.7 ± 0.5 g, were reared in each tank. The fish were fed 4 times a day with a total of 50 g of Aller Gold pellets from Aller Aqua (feed for rainbow trout fattening).
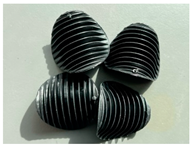
The following commercial media were assessed for filtration: RK-Plast (BR-1), Mutag-BioChip30 (BR-2), and LevaPor (BR-3). The general characteristics of the media are shown in Table 1.

2.2. Hydrochemical Parameters

Water samples were collected once a week for 14 weeks from the outflow and inlet of the bioreactor. Nitrite nitrogen (NO2-N), nitrate nitrogen (NO3-N), ammonium nitrogen (NH4+-N), total nitrogen (TN), total reactive phosphorus (TRP), total phosphorus (TP), total inorganic carbon (TIC), and total organic carbon (TOC) were determined in the sampled water. Chemical analyses were performed according to methodologies recommended by APHA [12]. A HITACHI (Tokyo, Japan) UV-VIS U-2900 spectrophotometer was used for colorimetric analyses. Carbon and TN determinations were performed in infrared using a VarioTOC SELECT from ELEMENTAR (Langenselbold, Germany).

2.3. Statistical Analysis

The results obtained from this study were analyzed using one-way ANOVA, Tukey’s post hoc tests, using Statistica v13.3 software from TIBCO Software Inc. (Palo Alto, CA, USA). We evaluated the significance of differences in the concentration of the determined hydrochemical indicators (i) between the water flowing into and out of the bioreactors, (ii) and differences between the tested bioreactor media. The differences were considered significant at p < 0.05. Linear regressions were also determined for variation in the inorganic forms of nitrogen over a function of time.

3. Results and Discussion

Comparing the concentrations of nitrogen, phosphorus, and carbon in the water flowing into the bioreactors with their concentrations in the water flowing out of the bioreactors revealed no significant differences (p > 0.05) (see Appendix A Table A1). This effect is explained by the short water retention time in the bioreactors, which is necessary to ensure an optimal level of oxygenation in the biofilter zone, and which is essential for efficient nitrogen biotransformation. For example, Dias et al. [13] showed that the rate of nitrification increases with an increase in the flow capacity of the recirculation system, as this promotes water circulation and oxygen distribution in all areas of the media.
Following this, the paper then focused on: (i) changes in the concentration of N, P, and C as a function of the duration of the experiment, and (ii) differences in the concentration of these indicators between the tested media.

3.1. Changes in the Concentrations of N, P, and C during the Experiment

Generally, as shown in Table 2, the indicators determined had a high range of concentration variability (wider for nitrogen, and narrower for phosphorus and carbon). For example, the concentration ranges (data for BR-1; in mg N, P, or C dm−3) ranged from 0.009 to 5.198 for NO2-N, from 0.072 to 0.533 for TRP, and from 23.7 to 45.2 for TIC.
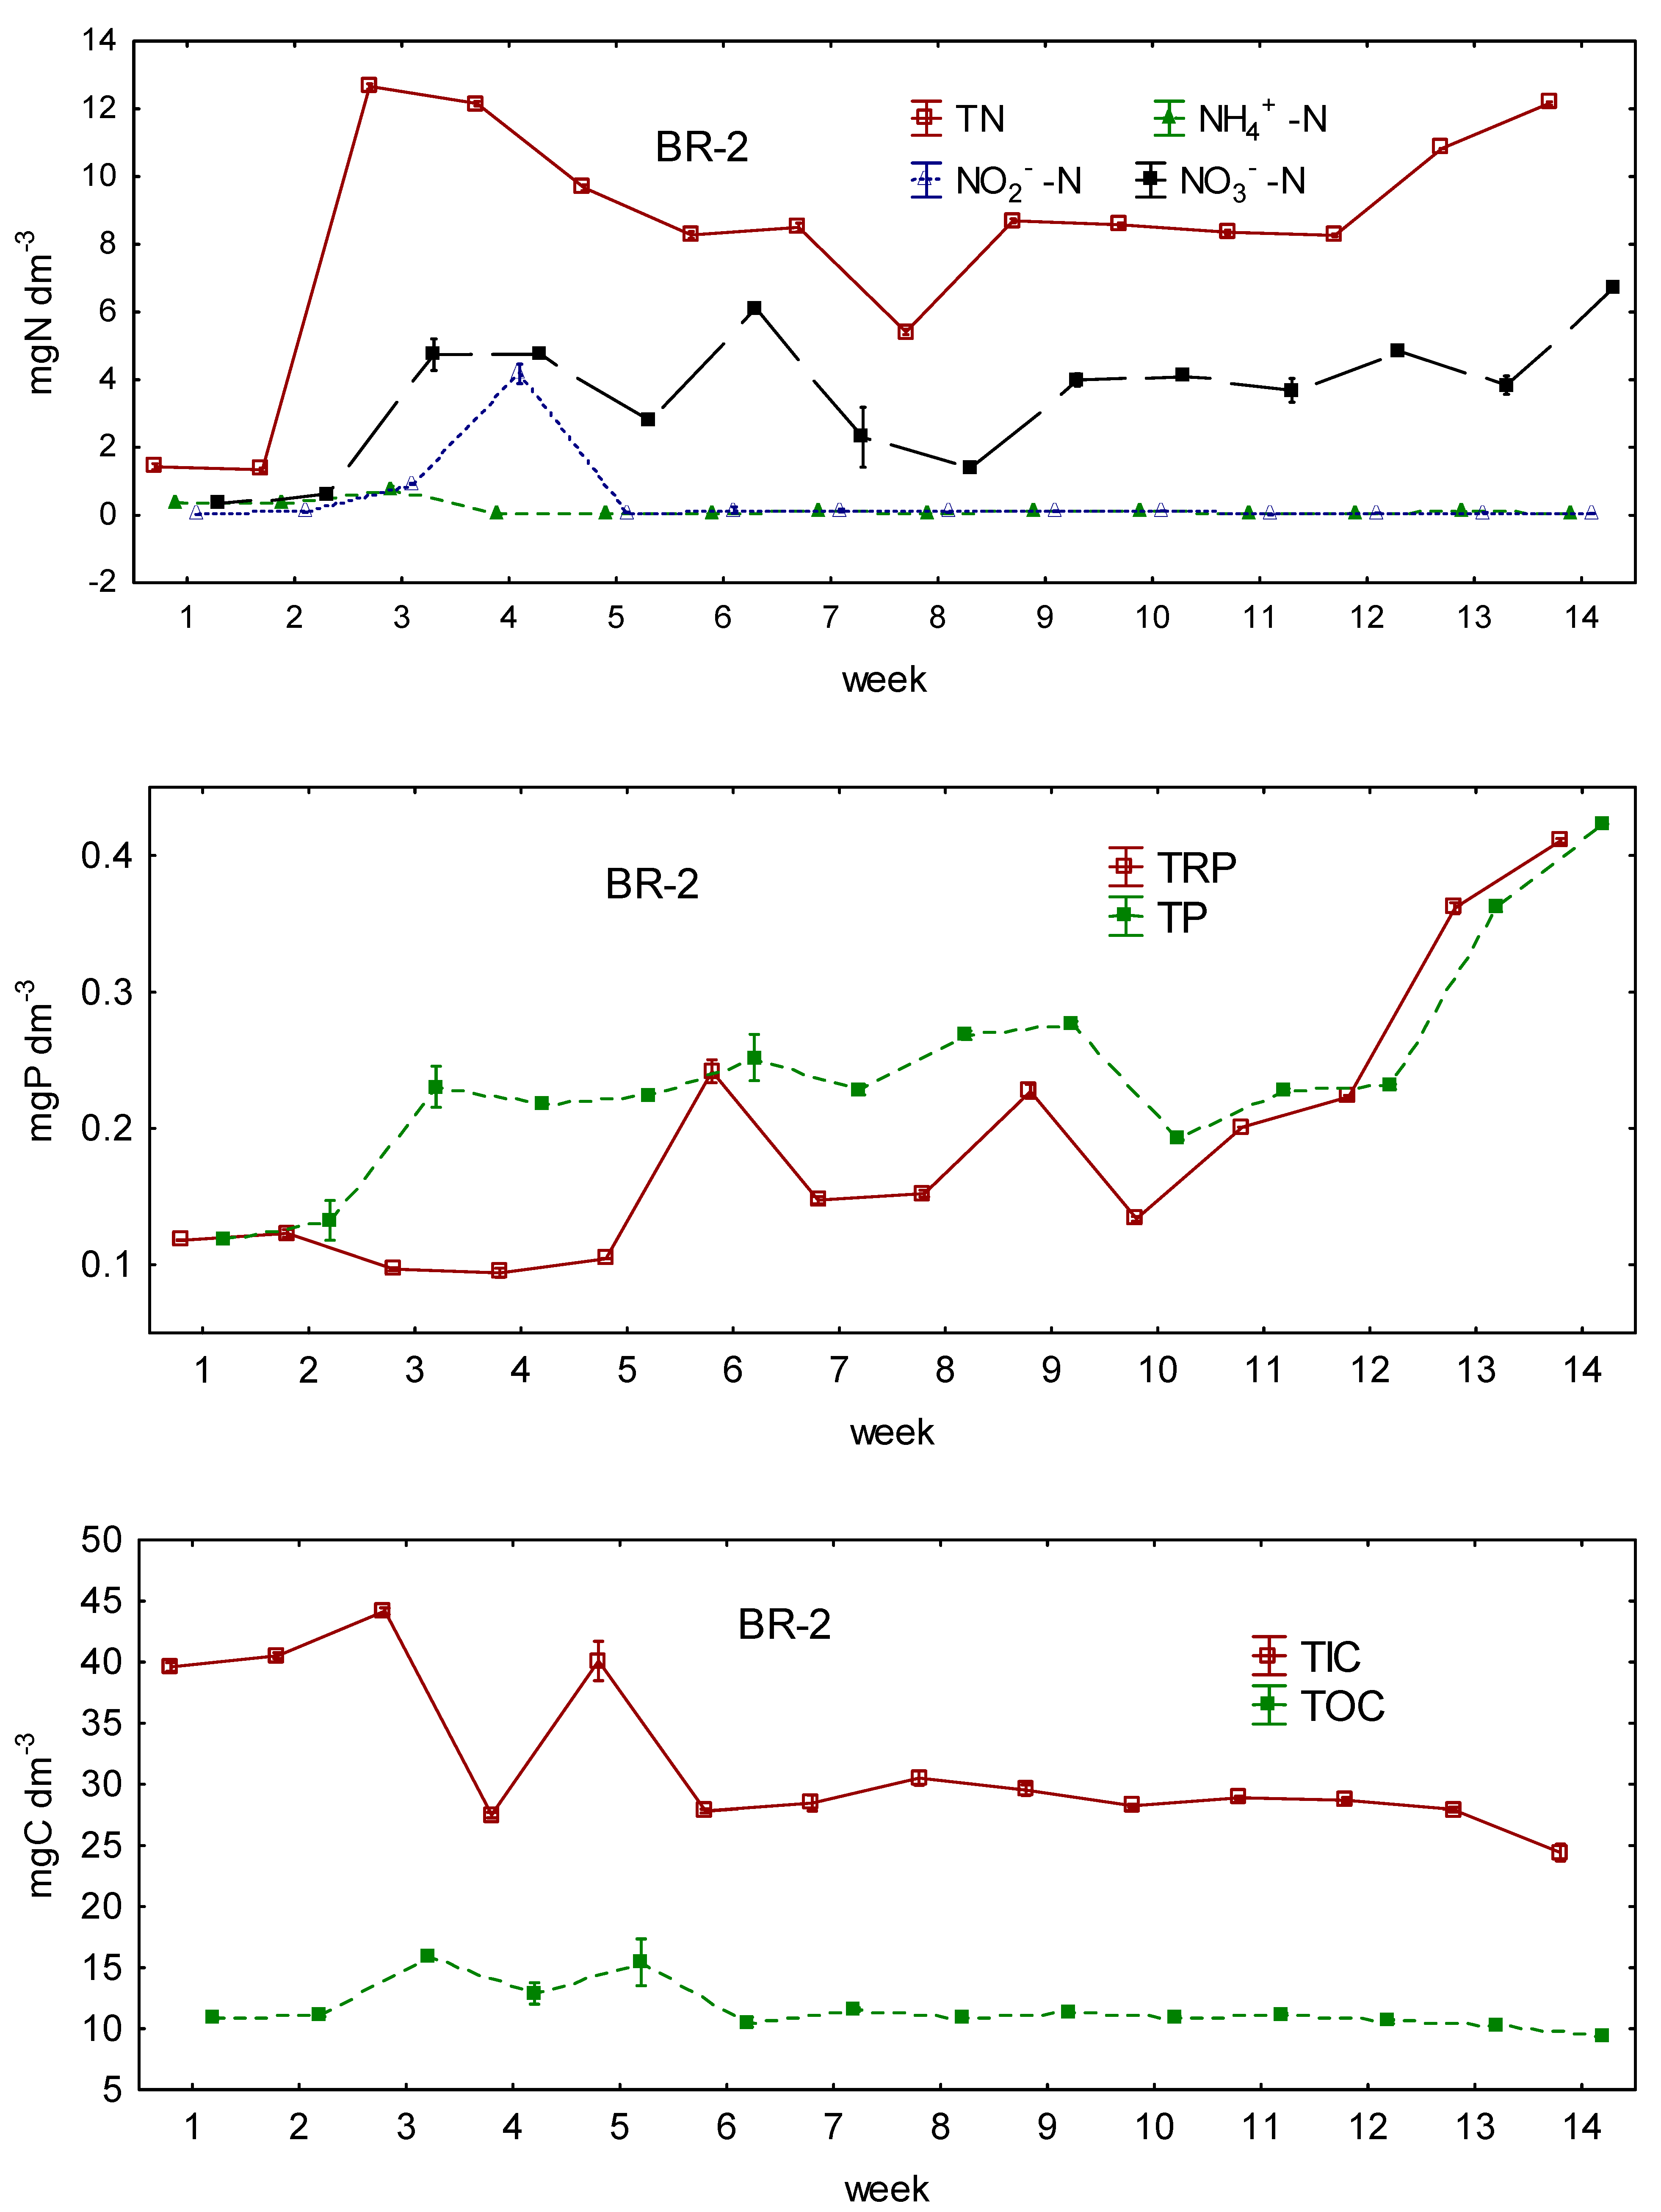
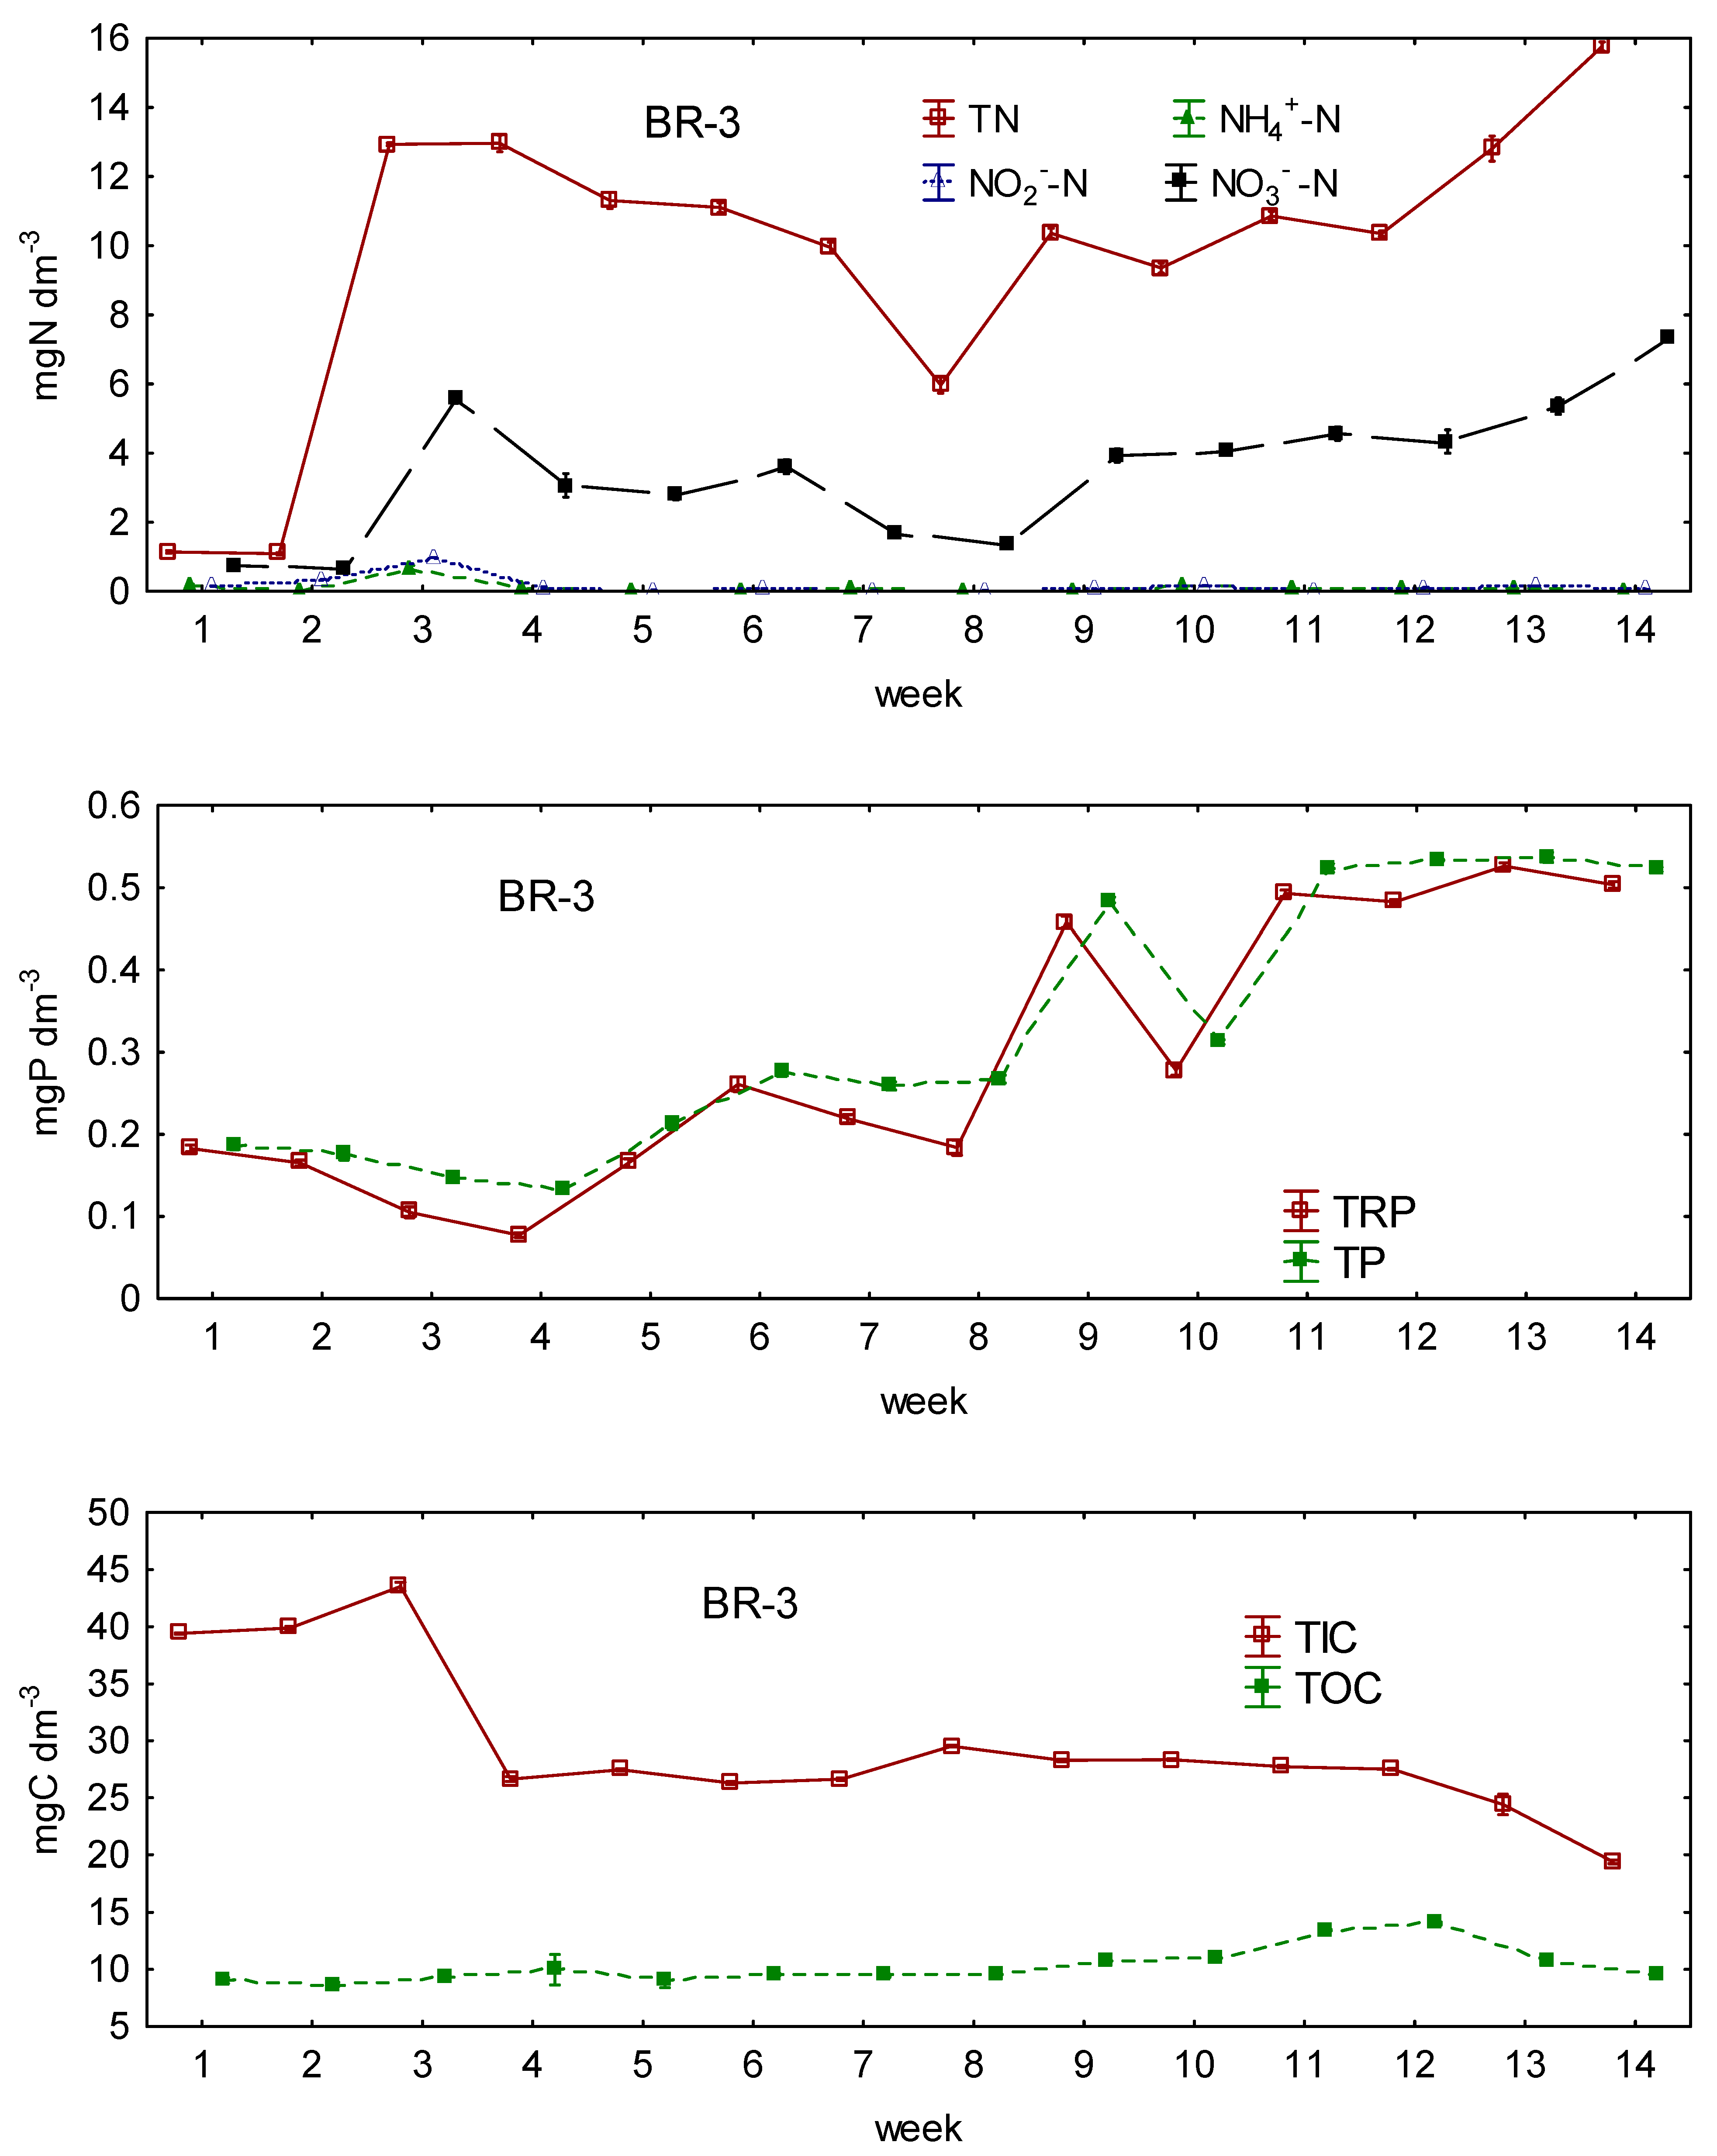
Three distinct trends of changes were observed. (1) For ammonium nitrogen and nitrite nitrogen, the concentrations first increased to a maximum value (for ammonium nitrogen, 1.290, 0.834, and 0.728 mg N dm−3; and for nitrite nitrogen, 5.198, 4.382, and 0.982 mg N dm−3; for BR-1, BR-2, and BR-3, respectively), and then decreased to a relatively stable level by the end of the experiment. This stabilization occurred at 8 weeks for BR-1, at 5 weeks for BR-2, and at 4 weeks for BR-3. At the respective times, the mean concentrations (in mg N dm−3) of ammonium nitrogen were 0.071, 0.068, and 0.056, and nitrite nitrogen at 0.092, 0.079, and 0.079 for BR-1, BR-2, and BR-3, respectively. The reduction of ammonium nitrogen from maximum values to steady-state concentrations was 94.5% (BR-1), 91.8% (BR-2), and 92.3% (BR-3). The respective reductions in nitrite nitrogen were 98.2% (BR-1 and BR-2), and 91.9% (BR-3). (2) For NO3--N, TN, TRP, and TP, the observed trends were characterized by a slow increase in concentration, reaching maximum values at the end of the experiment. (3) For TIC and TOC, the maximum values were shown during the first weeks of the experiment, followed by a decrease in concentration and a relatively sustained stabilization for the following weeks. A reduction in carbon concentration in the systems occurred after 6 weeks for both BR-1 and BR-2, and after 4 weeks for BR-3, to about 26–28 mg C dm−3 for TIC, and about 10 mg C dm−3 for TOC (Appendix A Figure A1).
The observed trends of changes in the concentration of the noted forms of nitrogen, phosphorus, and carbon are characteristic of the biofilter activation stage in RAS systems [4]. The sources of these elements are fish metabolic products and uneaten feed [14]. For example, Avnimelech and Ritvo [15] report that the average intake of organic carbon, nitrogen, and phosphorus from the feed by fish are approximately 13%, 29%, and 16%, respectively. With unrestricted access to carbon and phosphorus, nitrogen compounds can be efficiently transformed by microorganisms and used for biomass production [16]. At the same time, during the biofilter activation phase, an increase in ammonium nitrogen concentration is observed in the first phase, preceding the increase in nitrite nitrogen concentration; then, the concentrations decrease to a stable low level that was safe for fish. The time of the first phase of this process can last about 2 weeks [14]; however, it can be prolonged at lower temperatures and in passive activation [9,10,17], similar to our study.
It should also be borne in mind that in RAS systems, the wide range of N and P concentrations is associated with the fish species among other things, and, thus, on the culture conditions needed to breed the species (e.g., water temperature, feed chemistry) and the operating conditions of the RAS system (e.g., biofilter volume, water retention time). As an example, in the first weeks of culture using experimental RAS systems for rearing goldfish (Carassius auratus auratus) and koi (Cyprinus carpio koi), Sikora et al. [18] recorded nitrite nitrogen concentrations of 7.3 and 10.7 mg N dm−3, respectively, and ammonia nitrogen at >27 mg N dm−3. Even higher concentrations of ammonia nitrogen (>35 mg N dm−3) were recorded by Owatari et al. [19] in a Nile tilapia (Oreochromis niloticus) culture system. On the other hand, Żarski et al. [20] recorded low concentrations of ammonia nitrogen (0.5 mg N dm−3) and nitrite nitrogen (0.3 mg N dm−3) in an experiment with juvenile stages of ide (Leuciscus idus). In our experiment, ammonia nitrogen concentrations in the first weeks of culturing were consistent with other studies on RAS systems for O. mykiss, as in the study by Pulkkinen et al. [21], who reported about 1.2 mg N dm−3. At the same time, the nitrite nitrogen concentrations in our study were at a higher level than in the study of Pulkkinen et al. [21] (about 1.0 mg dm−3). The differences may have been the result of the more intensive biochemical transformation of nitrogen compounds conditioned by the higher water temperature in their study (16 °C). Moreover, the concentrations of ammonium nitrogen and nitrite nitrogen in the steady state recorded by us were consistent, for example, with the results of Fernandes et al. [22] (0.12 and 0.26 mg N dm−3, respectively), and also with the results of Pulkkinen et al. [21,23], who emphasized that the biofilters they tested were effective and produced circulating water that met the requirements of cultured O. mykiss. The reductions in ammonium nitrogen and nitrite nitrogen obtained in our study were consistent with the results of other authors, who also obtained removals at levels above 90% [21,22,23,24,25].
Concurrently with the reduction of ammonium nitrogen and nitrite nitrogen concentrations, a steady increase in nitrate nitrogen concentration is observed [4,12]. This form of nitrogen is safe for cultured fish, and concentrations as high as >70 mg N dm−3 have been tolerated by fish (see studies by Sikora et al. [18] and Steinberg et al. [26]). Although, Davidson et al. [27], for an O. mykiss culture in RAS, recommend nitrate nitrogen concentrations below 75 mg N dm−3. However, a widely varying range of nitrate nitrogen concentrations is noted in RAS, with nitrate concentrations in closed systems (without partial water exchange) being higher and reaching levels above 50 mg N dm−3 [18,21,22] and even 150 mg N dm−3 [28]. On the other hand, in semi-closed systems (as tested in our study), concentrations are lower, at the level of several milligrams [18,20], because partial water exchange in these RAS is designed to remove nitrate nitrogen which accumulates in the system in the absence of denitrification [17,29].

3.2. Differences in N, P, and C Conversion between Bioreactors

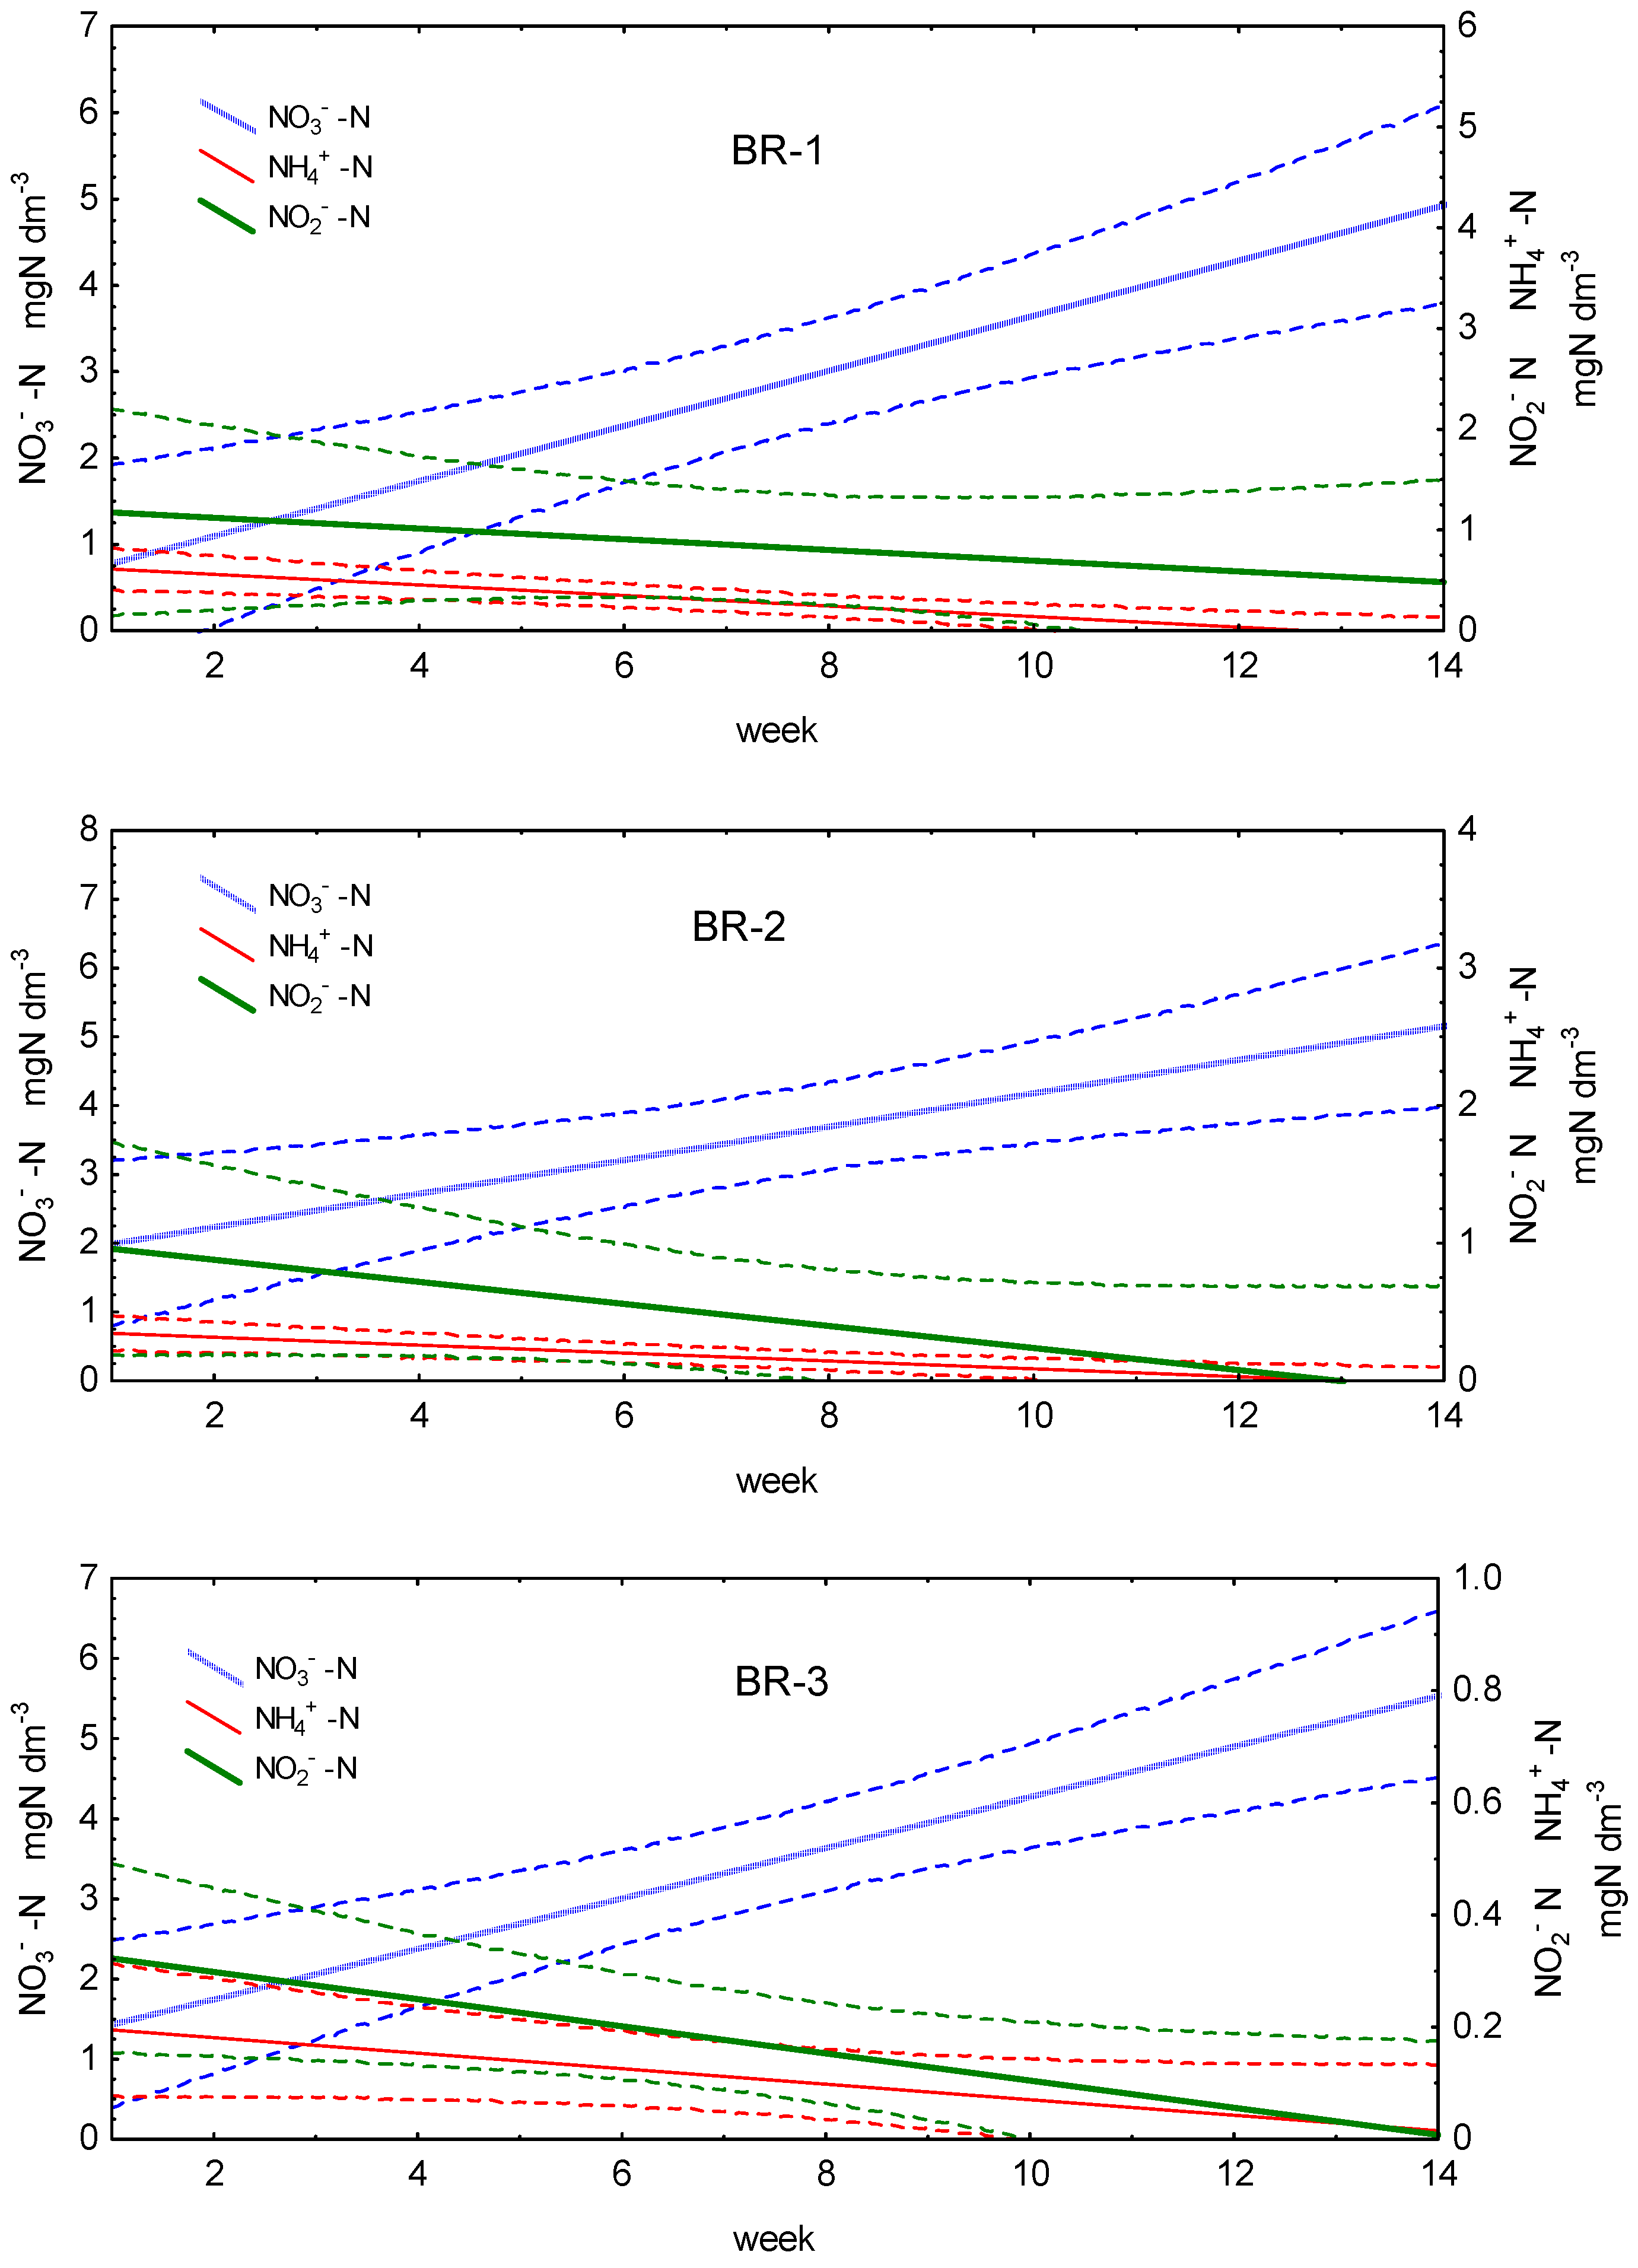
The media plays an important function in filtration systems as the site of the physical processes (e.g., deposition of solid particles), as well as key biochemical processes leading to the transformation of substances present in the water, such as nitrification, during which, ammonium nitrogen and nitrite nitrogen are oxidized to the less toxic nitrate nitrogen [6,17,30]. In our study, as depicted by the linear regressions summarized in Figure 2, we noted consistent trends of decreasing concentrations of toxic forms of nitrogen and increasing concentrations of nitrate nitrogen. Though the conversion rate to nitrate nitrogen were similar in all bioreactors, those with BR-2 and BR-3 media were more effective in reducing nitrite and ammonium nitrogen concentrations. At the same time, the significantly (p < 0.05) lowest concentrations of both these forms of nitrogen were in the system with BR-3, followed by BR-2. In contrast, nitrate nitrogen concentrations did not significantly (p > 0.05) differ between the systems; although, on average, the lowest NO3-N concentration was recorded for BR-1 (Table 2). The reason for the differences may have been the specific surface area of the media. BR-1, with a smooth surface and the lowest SSA, was characterized by a lower degree of transformation of nitrogen compounds. However, it should be pointed out that the porous BR-2 medium (with the highest SSA) may have had its active surface area reduced to a greater extent by biofouling than BR-3, which, in consequence, may have lowered the efficiency of nitrogen transformation (although the differences in concentration of nitrogen forms between them were not significant). The positive effect of an increase in SSA on nitrogen transformation has been shown, for example, by [7,31,32]. The larger surface area of a biofilter increases its functional efficiency, where an increase in the surface area colonized by bacteria increases the contact area of the biofilm with nutrients dissolved in the circulating water, and, thus, the efficiency of the biochemical processes of nitrogen conversion. The structure of the medium (e.g., the BR-3 medium is made of soft sponge) is also significant, and may promote a more intense flow of water through open and interconnected structures, leading to an increase in nitrification rates [5,8]. In contrast, the presence of excessively large voids with a simultaneously smooth surface (as may have been the case for the smooth BR-1 medium) may have resulted in a lower water renewal [33].
It should also be emphasized that in the observed changes in the concentration of inorganic nitrogen forms, the retention on the biofilter media was low. These dissolved forms of nitrogen are retained only on nanofiltration membranes. For example, a 450 Da membrane in a RAS water treatment system reduced ammonia nitrogen by 44% and nitrate nitrogen by 9% [34].
For phosphorus and carbon, there was mostly no significant variation between the tested media. Only mean TRP and TP concentrations were significantly (p < 0.05) higher in the water filtered using BR-3 medium compared to the other systems. TIC concentrations did not differ between the tested media (p > 0.05), and mean TOC concentrations were significantly (p < 0.05) higher for BR-1 and BR-2 compared to BR-3 (Table 2). Overall, the demonstrated lack of reduction in P and C can be considered a positive phenomenon, as these compounds are not threatening factors for fish, and a deficit could negatively affect the desired biochemical processes of nitrogen transformation.
It should be emphasized that in the process of transformation of ammonium and nitrite nitrogen to nitrate nitrogen, a relatively low C/N ratio is desirable, as it provides the desired nitrate concentration in RAS [10,17,29]. In our study, TOC concentrations were at similar levels also recorded in other O. mykiss culture systems (e.g., Santorio et al. [35] recorded TOC concentrations of 8.14 mg C dm−3), and the average TOC/TN values were 1.4 for BR-1, 1.3 for BR-2, and 1.1. for BR-3, and should be considered favorable. Indeed, Navada et al. [10], for example, showed a marked decrease in nitrification efficiency with an increase in the C/N ratio from 0 to 3. Similarly, Rojas-Tirado et al. [36] postulate that RAS effluent with a C/N ratio below 3, given a sufficient supply of oxygen, will ensure equilibrium in the bioreactor and rapid and stable nitrification.

4. Conclusions

Commercial media with different specific surface areas (700 m2 m−3 for BR-1; 5500 m2 m−3 for BR-2; 2700 m2 m−3 for BR-3) were tested for passive activation capabilities in water treatment bioreactors in recirculating rainbow trout culture systems. For ammonium nitrogen and nitrite nitrogen, after increases in concentration during the first 2–3 weeks of culturing, a reduction in concentration to less than 0.1 mg N dm−3 was recorded. The reductions in ammonium nitrogen were 94.5% (BR-1), 91.8% (BR-2), and 92.3% (BR-3), and the reductions in nitrite nitrogen were 98.2% (BR-1 and BR-2) and 91.9% (BR-3). For nitrate nitrogen, there was a steady trend of increasing concentrations with the duration of the experiment to maximum concentrations (in mg N dm−3) of 6.521 (BR-1), 6.778 (BR-2), and 7.326 (BR-3).
Efficient nitrification was recorded for each media variant, with the concentrations of nitrate nitrogen and the toxic forms of ammonium nitrogen and nitrite nitrogen at steady state levels safe for the cultured fish. The efficiency of nitrification depended on the specific surface area of the artificial media, which can be ranked in the following descending order of efficiency: BR-3 ≥ BR-2 > BR-1. The recorded concentrations of phosphorus and carbon allow us to conclude that their availability for microorganisms should not be a limiting factor in bioprocesses occurring in purification systems. At the same time, the low average TOC/TN ratio (1.4 for BR-1, 1.3 for BR-2, and 1.1 for BR-3) did not adversely affect nitrification.
The conducted research indicates the possible application of passive activation of the biofilter bed in recirculating fish farming systems with high environmental requirements, but further research is recommended to confirm this on other salmonid species. The presented results will be confronted in the future with the effects of biofilters working under conditions of technological culturing of O. mykiss.

Author Contributions

Conceptualization, A.N., M.B., A.T. (Agnieszka Tórz), A.T. (Adam Tański) and K.F.; Data curation, A.N., M.B., A.T. (Agnieszka Tórz) and A.T. (Adam Tański); Formal analysis, A.N. and A.T. (Agnieszka Tórz); Funding acquisition, K.F.; Investigation, A.N.; Methodology, A.N., M.B., A.T. (Adam Tański) and K.F.; Project administration, K.F.; Visualization, A.N. and A.T. (Adam Tański); Writing—original draft, A.N. All authors have read and agreed to the published version of the manuscript.

Funding

The study was conducted within the project no., 00002-6521.1-OR1600001/17/20, financed by Sectoral Operational Programme “Fisheries and See 2014-2020” and by the Polish Ministry of Science in Poland through a subsidy for the West Pomeranian University of Technology Szczecin, Faculty of Food Sciences and Fisheries.

Data Availability Statement

The data presented in this study are available on request from the corresponding author.

Conflicts of Interest

The authors declare no conflict of interest.

Appendix A

Table A1. Comparison of hydrochemical concentrations (mean values ± standard deviation) between water flowing into the bioreactor (inflow) and water flowing out of the bioreactor (outflow), and a summary of the results of one-way ANOVA (F and P).
BioreactorNO2-NNO3-NNH4+-NTNTRPTPTICTOC
mg N dm−3mg P dm−3mg C dm−3
BR-1inflow0.8112.8570.2767.7770.2130.25232.211.2
±1.401±2.065±0.363±3.624±0.128±0.117±6.2±1.4
outflow0.8452.8500.2667.8030.2140.25132.511.0
±1.42±2.072±0.347±3.554±0.130±0.119±6.0±1.2
F1.0241.0061.1121.0391.0371.0301.0521.397
P0.9490.9990.9360.9840.9900.9910.9020.720
BR-2inflow0.4323.5630.1578.3500.1860.24132.111.8
±1.042±1.854±0.195±3.531±0.097±0.079±6.3±2.2
outflow0.4453.5780.1598.3150.1900.25031.711.4
±1.157±1.990±0.224±3.512±0.099±0.078±6.3±1.7
F1.2311.1521.3181.0101.0231.0281.0141.688
P0.9760.9830.9870.9940.9310.9410.8870.569
BR-3inflow0.1683.5740.1039.7490.2920.32629.610.5
±0.249±1.956±0.155±4.261±0.163±0.158±6.6±1.6
outflow0.1623.4180.1079.6730.2940.32729.610.1
±0.252±1.928±0.185±4.260±0.164±0.158±6.6±1.7
F1.0161.0291.4161.0001.0111.0001.0041.017
P0.9460.8340.9490.9630.9640.9950.9650.606
Figure A1. Changes in the concentration of the determinants of the water quality of RAS systems with selected tessellated RK Plast (BR-1), Mutag-BioChip30 (BR-2), and LevaPor (BR-3) filtration fillings (TN—nitrogen toxin; TRP—total reactive phosphorus; TP—total phosphorus; TIC—total inorganic carbon; TOC—total organic carbon) (square—mean; whisker—mean ± standard deviation).
Energies 15 06890 g0a1aEnergies 15 06890 g0a1bEnergies 15 06890 g0a1c

References

  1. FAO. The State of World Fisheries and Aquaculture 2020: Sustainability in Action; FAO: Rome, Italy, 2020. [Google Scholar] [CrossRef]
  2. Sirakov, I. Flesh quality in rainbow trout (Oncorhynchus mykiss W.) and brown trout (Salmo trutta m. fario L.) cultivated in recirculation aquaculture system. Int. J. Curr. Microbiol. Appl. Sci. 2015, 4, 50–57. [Google Scholar]
  3. Wang, C.; Li, Z.; Wang, T.; Xu, X.; Zhang, X.; Li, D. Intelligent fish farm—The future of aquaculture. Aquac. Int. 2021, 29, 2681–2711. [Google Scholar] [CrossRef]
  4. Minaz, M.; Kubilay, A. Operating parameters affecting biofloc technology: Carbon source, carbon/nitrogen ratio, feeding regime, stocking density, salinity, aeration, and microbial community manipulation. Aquac. Int. 2021, 29, 1121–1140. [Google Scholar] [CrossRef]
  5. Zou, Y.; Hu, Z.; Zhang, J.; Xie, H.; Guimbaud, C.; Fang, Y. Effects of pH on nitrogen transformations in media-based aquaponics. Bioresour. Technol. 2016, 210, 81–87. [Google Scholar] [CrossRef]
  6. Zhu, S.-M.; Deng, Y.-L.; Ruan, Y.-J.; Guo, X.S.; Shi, M.M.; Shen, J.Z. Biological denitrification using poly(butylene succinate) as carbon source and biofilm carrier for recirculating aquaculture system effluent treatment. Bioresour. Technol. 2015, 192, 603–610. [Google Scholar] [CrossRef]
  7. Ridha, M.T.; Cruz, E.M. Effect of biofilter media on water quality and biological performance of the Nile tilapia Oreochromis niloticus L. reared in a simple recirculating system. Aquac. Eng. 2001, 24, 157–166. [Google Scholar] [CrossRef]
  8. Boaventura, T.P.; Miranda-Filho, K.C.; Oréfice, R.L.; Luz, R.K. Influence of porosity of low-density polyethylene media on the maturation process of biofilters used in recirculating aquaculture systems. Aquac. Int. 2018, 26, 1035–1049. [Google Scholar] [CrossRef]
  9. DeLong, D.P.; Losardo, T.M. How to Start a Biofilter; United States Department of Agriculture Southern Regional Aquaculture Center: Stoneville, MS, USA, 2012; p. 4. [Google Scholar]
  10. Navada, S.; Vadstein, O.; Spanu, C.; Mikkelsen, Ø.; Kolarevic, J. Biofilms remember: Osmotic stress priming as a microbial management strategy for improving salinity acclimation in nitrifying biofilms. Water Res. 2020, 176, 115732. [Google Scholar] [CrossRef]
  11. Li, C.; Liang, J.; Lin, X.; Xu, H.; Tadda, M.A.; Lan, L. Fast start-up strategies of MBBR for mariculture wastewater treatment. J. Environ. Manage. 2019, 248, 109267. [Google Scholar] [CrossRef]
  12. APHA. Standard Methods for Examination of Water and Wastewater, 20th ed.; American Public Health Association: Washington, DC, USA, 1999; p. 1325. ISBN 978-0875532356. [Google Scholar]
  13. Dias, J.; Bellingham, M.; Hassan, J.; Barrett, M.; Stephenson, T.; Soares, A. Influence of carrier media physical properties on start-up of moving attached growth systems. Bioresour. Technol. 2018, 266, 463–471. [Google Scholar] [CrossRef] [Green Version]
  14. Masser, M.P.; Rakocy, J.; Losardo, T.M. Recirculating Aquaculture Tank Production Systems; United States Department of Agriculture Southern Regional Aquaculture Center: Stoneville, MS, USA, 1999; p. 10. [Google Scholar]
  15. Avnimelech, Y.; Ritvo, G. Shrimp and fish pond soils: Processes and management. Aquaculture 2003, 220, 549–567. [Google Scholar] [CrossRef]
  16. Schneider, O.; Sereti, V.; Eding, E.H.; Verreth, J.A.J. Molasses as C source for heterotrophic bacteria production on solid fish waste. Aquaculture 2006, 261, 1239–1248. [Google Scholar] [CrossRef]
  17. Ruiz, P.; Vidal, J.M.; Sepulveda, D.; Torres, C.; Villouta, G.; Carrasco, C.; Aguilera, F.; Ruiz-Tagle, N.; Urrutia, H. Overview and future perspectives of nitrifying bacteria on biofilters for recirculating aquaculture systems. Rev. Aquac. 2020, 12, 1478–1494. [Google Scholar] [CrossRef]
  18. Sikora, M.; Nowosad, J.; Biegaj, M.; Kucharczyk, D.; Dębowski, M. The possibility of application of agglomerate elastomers (EPP) as media for biological bed in aquaculture. Aquac. Res. 2018, 49, 2988–2994. [Google Scholar] [CrossRef]
  19. Owatari, M.S.; Jesus, G.F.A.; de Melo Filho, M.E.S.; Lapa, K.R.; Martins, M.L.; Mouriño, J.L.P. Synthetic fibre as biological support in freshwater recirculating aquaculture systems (RAS). Aquac. Eng. 2018, 82, 56–62. [Google Scholar] [CrossRef]
  20. Żarski, D.; Kucharczyk, D.; Targońska, K.; Chyła, B.; Dobrołowicz, A. Dynamics of changes in nitrogen and phosphorus compounds during intensive rearing of ide, Leuciscus idus (L.), in a recirculating system. Arch. Polish Fish. 2008, 16, 459–467. [Google Scholar] [CrossRef]
  21. Pulkkinen, J.T.; Eriksson-Kallio, A.M.; Aalto, S.L.; Tiirola, M.; Koskela, J.; Kiuru, T.; Vielma, J. The effects of different combinations of fixed and moving bed bioreactors on rainbow trout (Oncorhynchus mykiss) growth and health, water quality and nitrification in recirculating aquaculture systems. Aquac. Eng. 2019, 85, 98–105. [Google Scholar] [CrossRef]
  22. Fernandes, P.M.; Pedersen, L.; Pedersen, P.B. Influence of fixed and moving bed biofilters on micro particle dynamics in a recirculating aquaculture system. Aquac. Eng. 2017, 78, 32–41. [Google Scholar] [CrossRef]
  23. Pulkkinen, J.T.; Kiuru, T.; Aalto, S.L.; Koskela, J.; Vielma, J. Startup and effects of relative water renewal rate on water quality and growth of rainbow trout (Oncorhynchus mykiss) in a unique RAS research platform. Aquac. Eng. 2018, 82, 38–45. [Google Scholar] [CrossRef]
  24. Shitu, A.; Zhu, S.; Qi, W.; Abubakar, M.A.; Liu, D. Performance of novel sponge biocarrier in MBBR treating recirculating aquaculture systems wastewater: Microbial community and kinetic study. J. Environ. Manag. 2020, 275, 111264. [Google Scholar] [CrossRef]
  25. Fu, H.; Wang, J.; Ren, H.; Ding, L. Acceleration of start-up of moving bed biofilm reactor at low temperature by adding specialized quorum sensing bacteria. Bioresour. Technol. 2022, 358, 127249. [Google Scholar] [CrossRef] [PubMed]
  26. Steinberg, K.; Zimmermann, J.; Meyer, S.; Schulz, C. Start-up of recirculating aquaculture systems: How do water exchange rates influence pikeperch (Sander lucioperca) and water composition? Aquac. Eng. 2018, 83, 151–159. [Google Scholar] [CrossRef]
  27. Davidson, J.; Good, C.; Welsh, C.; Summerfelt, S.T. Comparing the effects of high vs. low nitrate on the health, performance, and welfare of juvenile rainbow trout Oncorhynchus mykiss within water recirculating aquaculture systems. Aquac. Eng. 2014, 59, 30–40. [Google Scholar] [CrossRef]
  28. Stavrakidis-Zachou, O.; Ernst, A.; Steinbach, C.; Wagner, K.; Waller, U. Development of denitrification in semi-automated moving bed biofilm reactors operated in a marine recirculating aquaculture system. Aquac. Int. 2019, 27, 1485–1501. [Google Scholar] [CrossRef]
  29. He, Q.; Zhang, D.; Main, K.; Feng, C.; Ergas, S.J. Biological denitrification in marine aquaculture systems: A multiple electron donor microcosm study. Bioresour. Technol. 2018, 263, 340–349. [Google Scholar] [CrossRef] [PubMed]
  30. Li, W.; Shi, C.; Yu, Y.; Ruan, Y.; Kong, D.; Lv, X.; Xu, P.; Awasthi, M.K.; Dong, M. Interrelationships between tetracyclines and nitrogen cycling processes mediated by microorganisms: A review. Bioresour. Technol. 2021, 319, 124036. [Google Scholar] [CrossRef] [PubMed]
  31. Nguyen, T.T.; Ngo, H.H.; Guo, W.; Johnston, A.; Listowski, A. Effects of sponge size and type on the performance of an up-flow sponge bioreactor in primary treated sewage effluent treatment. Bioresour. Technol. 2010, 101, 1416–1420. [Google Scholar] [CrossRef]
  32. Massoompour, A.R.; Borghei, S.M.; Raie, M. Enhancement of biological nitrogen removal performance using novel carriers based on the recycling of waste materials. Water Res. 2020, 170, 115340. [Google Scholar] [CrossRef]
  33. Chen, X.; Kong, L.; Wang, X.; Tian, S.; Xiong, Y. Accelerated start-up of moving bed biofilm reactor by using a novel suspended carrier with porous surface. Bioprocess Biosyst. Eng. 2015, 38, 273–285. [Google Scholar] [CrossRef]
  34. Bonisławska, M.; Nędzarek, A.; Rybczyk, A. Assessment of the use of precipitating agents and ceramic membranes for treatment of effluents with high concentrations of nitrogen and phosphorus from recirculating aquaculture systems. Aquac. Res. 2019, 50, 1248–1256. [Google Scholar] [CrossRef]
  35. Santorio, S.; del Rio, A.V.; Amorim, C.L.; Arregui, L.; Castro, P.M.L.; Mosquera-Corral, A. Pilot-scale continuous flow granular reactor for the treatment of extremely low-strength recirculating aquaculture system wastewater. J. Environ. Chem. Eng. 2022, 10, 107247. [Google Scholar] [CrossRef]
  36. Rojas-Tirado, P.; Bovbjerg, P.; Vadstein, O.; Pedersen, L. Microbial dynamics in RAS water: Effects of adding acetate as a biodegradable carbon-source. Aquac. Eng. 2019, 84, 106–116. [Google Scholar] [CrossRef]
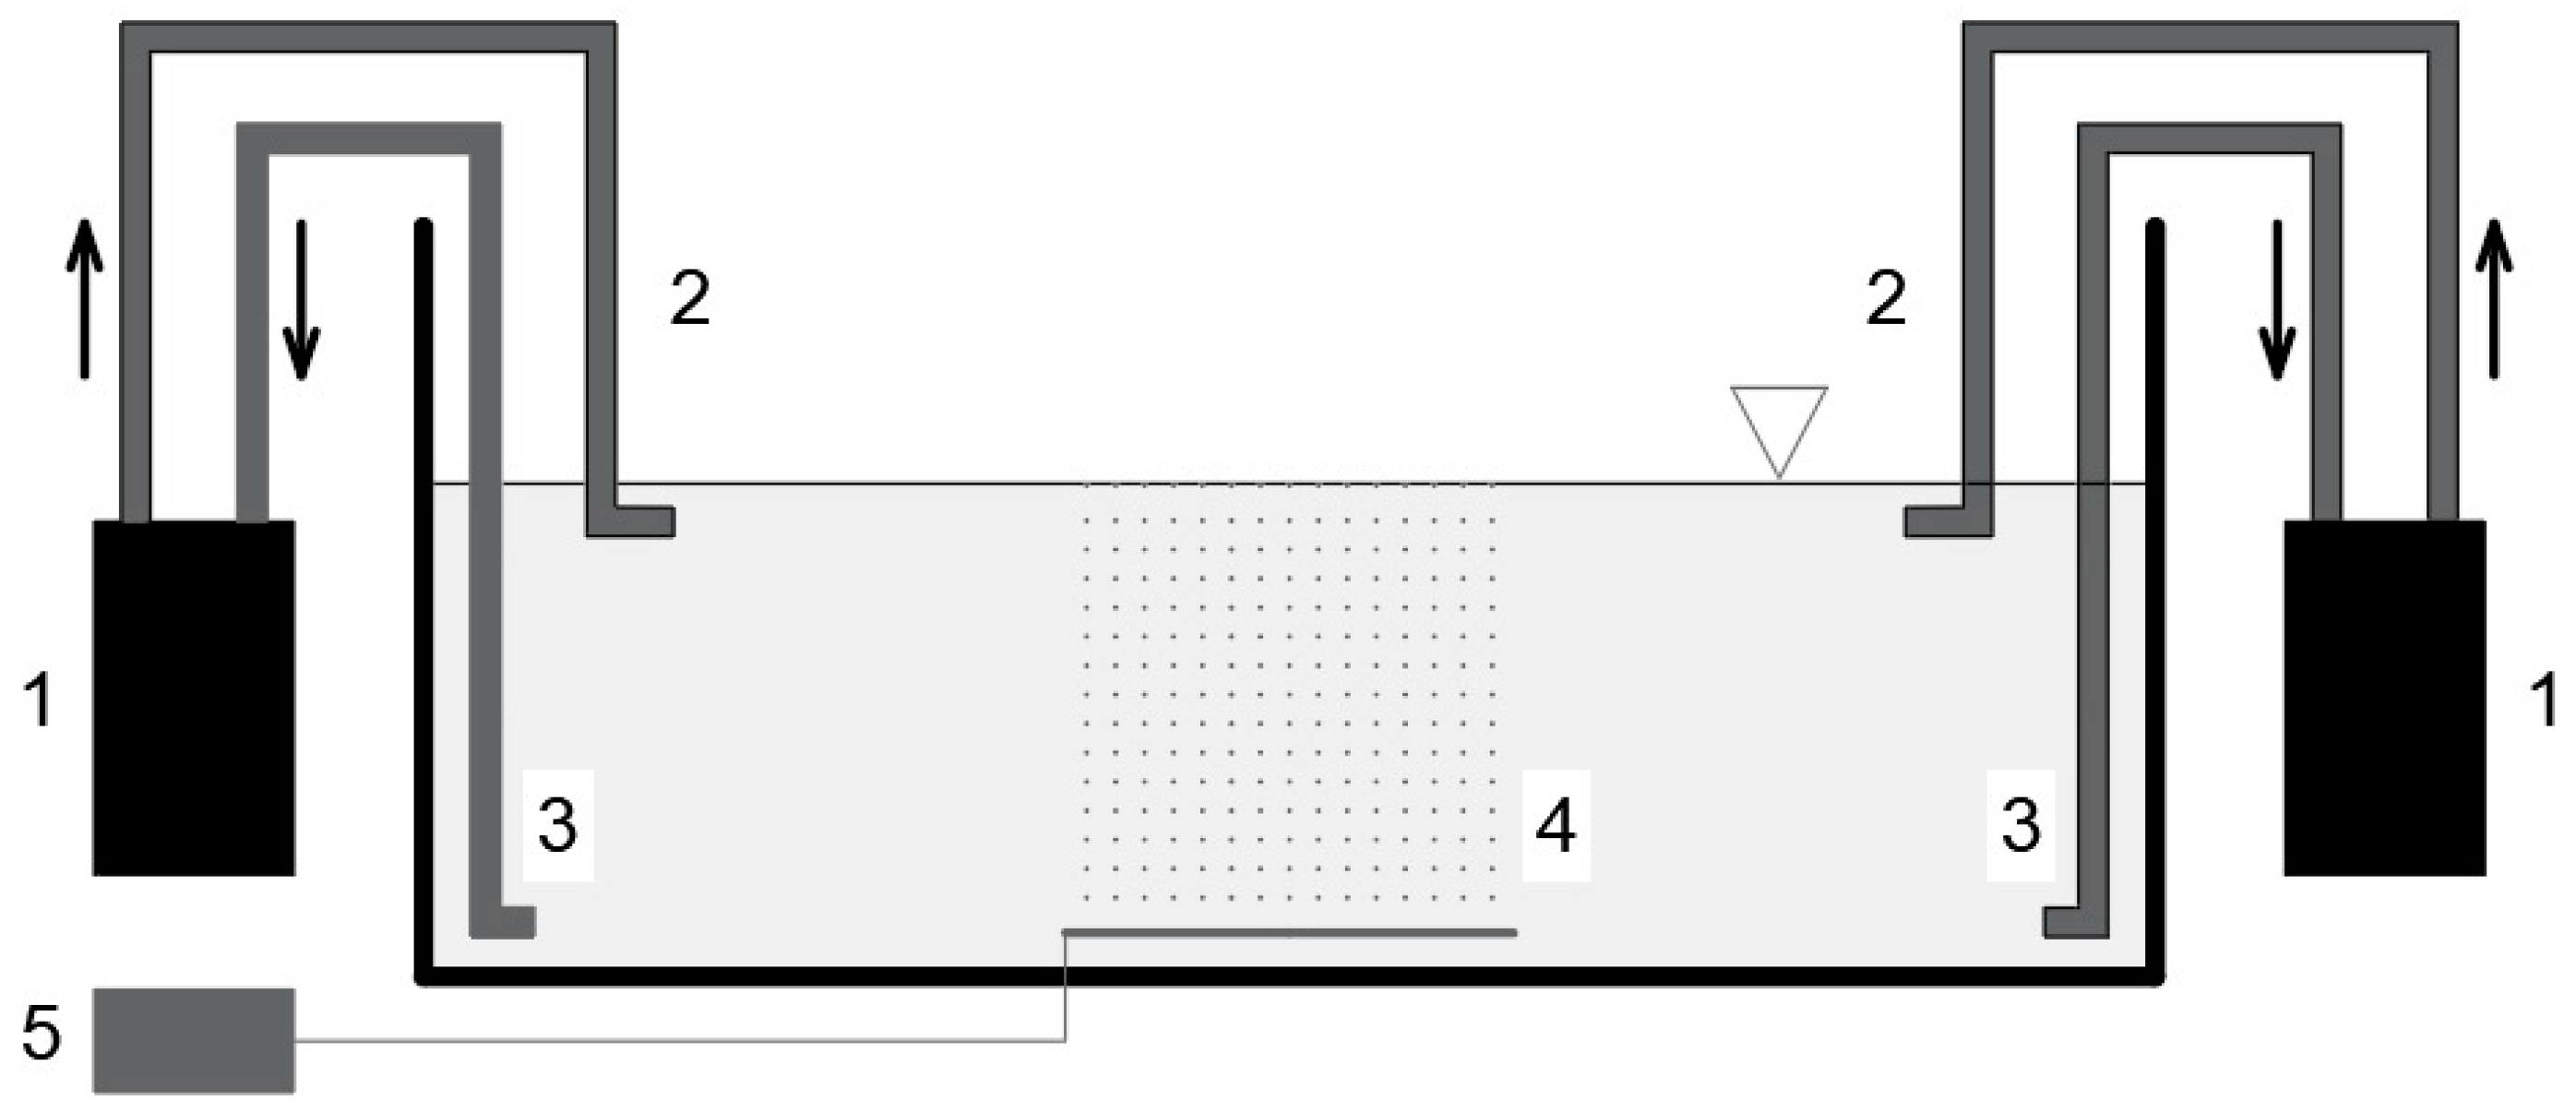
Figure 1. Diagram of the experimental culture system: 1—bioreactor; 2—bioreactor water outlet; 3—water intake from the culture tank; 4—atmospheric air diffuser; 5—air pump.
Energies 15 06890 g001
Figure 2. Linear regressions of the variation of inorganic forms of nitrogen in water of RAS systems with selected tessellated filter media, RK Plast (BR-1), Mutag-BioChip30 (BR-2), and LevaPor (BR-3).
Energies 15 06890 g002
Table 1. Comparison of selected commercial bioreactor media in the recirculating aquaculture systems.
RK PlastMutag-BioChip30LevaPor
BR-1BR-2BR-3
Shapesaddleround chipscube
Sizemm30 × 1530 × 1.120 × 20 × 7
Weight kg m−314516526–28
Surface (SSA)m2 m−370055002700
CompositionPolypropylenePolyethylenePolyurethane + activated carbon
Energies 15 06890 i001Energies 15 06890 i002Energies 15 06890 i003
Table 2. Concentrations of the studied forms of nitrogen, phosphorus, and in the water of recirculating systems with bioreactors with selected filtration media: RK Plast (BR-1), Mutag-BioChip30 (BR-2), and LevaPor (BR-3).
Bioreactor
BR-1BR-2BR-3
NO2-Nmg N dm−3range0.009–5.1980.012–4.3820.016–0.982
mean0.828 b0.439 ab0.165 a
median0.1280.0860.076
SD1.3821.0810.246
NO3-Nmg N dm−3range0.198–6.5210.335–6.7780.600–7.326
mean2.851 a3.585 a3.496 a
median2.7543.9853.774
SD2.0301.8871.908
NH4+-Nmg N dm−3range0.024–1.2900.026–0.8340.020–0.728
mean0.271 b0.158 ab0.105 a
median0.0840.0750.048
SD0.3500.2060.168
TNmg N dm−3range1.230–12.7491.302–12.7161.067–15.859
mean7.790 a8.310 a9.711 a
median8.3678.56210.617
SD3.5233.4564.182
TRPmg P dm−3range0.072–0.5330.092–0.4120.075–0.529
mean0.187 a0.188 a0.293 b
median0.2140.1500.239
SD0.1270.0960.1560
TPmg P dm−3range0.102–0.5480.119–0.4230.132–0.541
mean0.251 a0.242 a0.326 b
median0.2320.2290.272
SD0.1160.0770.152
TICmg C dm−3range23.7–45.223.9–44.419.3–43.8
mean32.3 a31.9 a29.6 a
median30.028.927.6
SD6.06.36.5
TOCmg C dm−3range9.5–14.69.2–18.88.6–14.1
mean11.1 b11.6 b10.3 a
median11.011.09.6
SD1.22.11.6
a,b different symbols in rows indicate significant differences between the tested bioreactor media (ANOVA, Tukey HSD test, p < 0.05).
Publisher’s Note: MDPI stays neutral with regard to jurisdictional claims in published maps and institutional affiliations.