Article

Three-Dimensional Modeling for the Internal Shorting Caused Thermal Runaway Process in 20Ah Lithium-Ion Battery

1
Key Laboratory of Ocean Energy Utilization and Energy Conservation of Ministry of Education, Dalian University of Technology, Dalian 116023, China
2
State Key Laboratory of Multiphase Flow in Power Engineering, Xi’an Jiaotong University, Xi’an 710049, China
3
School of Mechanical Engineering, Nanjing University of Science and Technology, Nanjing 210094, China
*
Authors to whom correspondence should be addressed.
Energies 2022, 15(19), 6868; https://doi.org/10.3390/en15196868
Submission received: 31 August 2022 / Revised: 15 September 2022 / Accepted: 17 September 2022 / Published: 20 September 2022

Abstract

:
Better understanding of how internal short circuit causes thermal runaway will benefit the engineering for safer lithium-ion batteries. In this study, three-dimensional (3D) numerical simulations of a 20Ah lithium battery under internal shorting condition are performed. The effects of internal short circuit area, resistance, penetration depth, convective heat transfer coefficient and internal short circuit position, on the thermal runaway are investigated with the simulations in this work. This study demonstrates that the average cell temperature is only weakly affected by the internal short circuit area, penetration depth, and position. On the other hand, the internal short circuit resistance and the convective heat transfer coefficient have large impacts on the thermal runaway propagation in the lithium-ion battery. A high convective heat transfer coefficient can effectively suppress the thermal runaway propagation. However, such a high convective heat transfer coefficient is hard to achieve at the cell surface.

1. Introduction

The world is at a critical time for climate and energy. Since the beginning of the 19th century, average global temperatures have increased by 1.1 °C, with obvious effects on weather and climate. Excessive development and consumption of energy and environmental pollution have become topics of widespread concern at present and in the future [1,2,3]. Therefore, the lithium-ion battery is one of the most promising options for powering electric vehicles, which has the benefits of high operating voltage, high capacity, extended life cycle, and environmental friendliness [4,5]. However, lithium-ion batteries are questioned because they are prone to thermal runaway, impeding the popularization and further development of electric vehicles [6]. The term “thermal runaway” means the overheating occurrence in which the lithium-ion battery’s internal ensuing chain reaction accelerates the rate at which the battery’s temperature rises [7]. To more clearly illustrate the thermal runaway phenomenon of lithium-ion batteries, Feng, X et al. [8] built a 3D reaction kinetics-based thermal runaway model. Compared with the experimental data, the model predicted well the thermal responses of the prismatic battery under the ARC (Accelerating Rate Calorimeter) test. MacNeil and G-H. Kim [9,10] proposed one-equation and four-equation models based primarily on the Arrhenius equation, which have been frequently used to analyze lithium-ion battery thermal runaway and have been expanded to multi-dimensional lithium-ion batteries by ANSYS Fluent [11] and other platforms.
The study finds that the overcharge, over-discharge, internal short circuit, external short circuit, aging, high and low temperature environment and extrusion deformation of lithium batteries are major causes of thermal runaway [12]. According to the statistics of reference [13], internal short circuit was to blame for 52% of lithium-ion battery thermal runaway incidents, while external short circuit was to blame for 26% of those incidents. One of the common damages to a battery is short circuit, which may be proven, and overall lithium-ion battery security is put at jeopardy. However, internal shorting has a lengthy early incubation period, which gives sufficient time for its detection and prediction as a prevalent cause of thermal runaway. Hence, studying the mechanism, process and detection methods of internal short circuit is of great significance for improving the overall safety of lithium-ion batteries and reducing the occurrence of electric vehicle accidents [14]. At the same time, there are many causes which result in internal short circuits. Mechanical abuse leads to battery deformation and foreign body intrusion, forming positive and negative electrical connections [15,16,17]. Electrochemical abuse can give rise to lithium precipitation and dendrite growth, resulting in internal shorting between negative and positive electrodes [18]. Thermal abuse can result in rupture of the separator, contributing to positive and negative electrode contact, both eventually causing internal short circuits [19]. Additionally, the internal shorting process of a battery is a sophisticated physical and chemical process that integrates multiple disciplines, including electrochemistry, thermodynamics and heat conduction [20,21].
To date, a multitude of scholars have carried out research such as experiments and simulations. Jones, Harry P [22] proposed the Blunt rod test. H. Maleki [23] developed two spherical indenters to squeeze the square battery. Binbin Mao et al. [24,25] adopted the traditional acupuncture method. The experimental test of these methods is quite different from the actual self-initiated process of an internal short circuit. Researchers have proposed a variety of internal short-circuit simulation experimental methods that are different from mechanical abuse testing methods so as to make up for this defect. C. J. Orendorff [26] studied an internal short circuit by heating low melting point metal arranged inside the lithium-ion battery. B. Barnett [27] arranged metal particles in the interior of a lithium-ion battery, and then repeatedly charged and discharged. Zhang M et al. [28] developed memory alloys to be inserted into the interior of the lithium-ion battery. P. Ramadas et al. [29] perforated the lithium-ion battery separator to create an internal short circuit. Huang, Z et al. [30] investigated how the higher the SOC (State of Charge) value of the battery, the higher the possibility and risk of thermal runaway of the LiFePO4 battery after penetration between the simulation and acupuncture experiments, and detected that the temperature peak is proportional to the SOC of the lithium-ion battery. Due to the large cost of conducting internal short circuit experiments on lithium batteries, it is necessary to perform numerical simulations on it. Tommy Georgios Zavalis [31] built up a 2D model of a NCA(LiNi0.8Co0.15Al0.05O2) lithium-ion battery, and conducted a simulation study on three situations of external short circuit, acupuncture and internal short circuit caused by aluminum metal impurities, but did not include the thermal runaway. It was discovered that the three cases’ variations in short circuit current over time were quite comparable. Wei Zhao et al. [32,33] developed a 3D electrochemical–thermal coupled model to investigate the process of internal shorting, and discovered that the internal shorting resistance and the number of short circuit electrode layers had the greatest impact on the electrochemical and thermal performance of lithium-ion batteries. Wenxin Mei [34] investigated how, the larger the diameter of the nail, the lithium battery showed greater heat dissipation when the lithium-ion battery does not experience thermal runaway. Xuning Feng et al. [35,36,37,38] developed a 3D model for internal short circuit propagation during thermal runaway. It has been discovered that modifying the separator to raise the thermal runaway trigger temperature, lowering the overall electricity liberated during thermal runaway, increasing the standard of heat release, and adding an additional heat-insulation between adjacent batteries, can all help to reduce the generation of thermal runaway. Hao Hu [39] aimed to obstruct the dissemination of the thermal reaction chain inside the single cell by lowering the temperature of the four phases of the battery’s thermal runaway process.
To sum up, few simulation studies have been conducted by combining the electrochemical heat generation model of the initial short circuit process with the chain heat release model of thermal runaway. In this study, the short circuit process of a 20 Ah large capacity lithium-ion battery is modeled, and the shorting resistance of the internal shorting is simulated by the patch function of ANSYS Fluent. If a 2D model is used to simulate the thermal runaway of short circuit in the battery, the electrochemical, dynamic heat transfer and convective heat dissipation processes in the height direction are ignored. In this way, a series of chemical reactions that occur inside the battery due to thermal runaway cannot be accurately described, and it does not fit the experimental data well. Therefore, a 3D electrochemical heat simulation is carried out in the initial stage of the short circuit. Next, the thermal runaway resulting from the internal shorting and the propagation process of the temperature inside the battery is simulated. Finally, the effects of the internal short circuit area, resistance, convective heat transfer coefficient, penetration depth, and short-circuit location on thermal runaway of lithium batteries are carefully discussed with the simulations. The aim of the research is to find the key factors that affect the thermal runaway of the single cell, provide a reference for researchers to study the propagation mechanism of thermal runaway and suppress the thermal runaway of the single cell, and make the occurrence of battery thermal runaway accidents less frequent.

2. Modeling Method

2.1. ECM Model

The difficulty of lithium-ion battery modeling comes from its involvement of multi-scale and multi-physics problems. The multi-scale problem in this study is handled with a multi-scale multi-domain (MSMD) modeling scheme provided in ANSYS Fluent. For the electrochemical scale of the problem, the ECM (Equivalent Circuit Model) is adopted in this study. In the ECM model, the lithium-ion battery is modeled as a circuit form [40], and the electrochemical thermal behavior of the lithium battery can be well simulated. Figure 1 depicts the diagram of the geometry and mesh for the modeling of lithium-ion batteries. The prismatic battery has a thickness of 7.2 mm, a height of 129 mm and a width of 218 mm [40]. The mathematical formulation of the ECM [41] approach is:
V = V O C V ( S O C ) V 1 V 2 R S ( S O C ) I ( t )
d V 1 d t = 1 R 1 ( S O C ) C 1 ( S O C ) V 1 1 C 1 ( S O C ) I ( t )
d V 2 d t = 1 R 2 ( S O C ) C 2 ( S O C ) V 2 1 C 2 ( S O C ) I ( t )
d ( S O C ) d t = I ( t ) / 3600 Q r e f
In these Equations, V O C V , R s , R 1 , C 1 , R 2 , C 2 are functions of SOC, the experimental data refer to ref [40] for parameters of different discharges, and these SOC equations are fitted using the following Equations:
V O C V = 3.5 + 0.31 S O C 0.0178 S O C 2 1.031 S O C 3 1.031 exp ( 24 S O C )
R s = 0.035 + 0.1562 exp ( 24.37 S O C )
R 1 = 0.04669 + 0.3208 exp ( 29.14 S O C )
R 2 = 0.04984 + 6.604 exp ( 155.2 S O C )
C 1 = 703.6 752.9 exp ( 13.51 S O C )
C 2 = 4475 6056 exp ( 27.12 S O C )
j E C h = I Q total Q r e f V o l
q ˙ E C h = j E C h [ V o c v ( φ + φ ) T d U d T ]
The internal short circuit process of the battery is simulated by the electrochemical process using the ECM model and the patch command in ANSYS Fluent. After the 1 s ECM model turned on, it is turned off, and then the simulation only employed the thermal runaway model.

2.2. Internal Short Circuit Model

The patch function in ANSYS Fluent is used to simulate the internal short circuit process of the lithium-ion battery in order to characterize it. Figure 2 displays the mesh and short circuit geometry for the modeling of lithium-ion batteries. When an internal short circuit occurs in a lithium-ion battery, it is equivalent to the high rate discharge under extremely small resistance, and a great deal of heat will be produced, resulting in thermal runaway.
The short circuit current density and heat source terms are as follows:
j s h o r t = a j s h o r t = a ( ϕ + ϕ ) / r c
q ˙ s h o r t = a ( ϕ + ϕ ) 2 / r

2.3. Thermal Runaway Model

This study replicates the heat runaway that happens when acupuncture is applied to a battery. There are two steps to the entire heat generating process. The lithium battery is short-circuited in the first stage as a result of the needling, and heat is produced at the nail-hole interface. The temperature of the battery increases rapidly as a result of the heat produced. In the second stage, the temperature rise caused by the electrochemical reaction causes the chain of exothermic reactions one by one. As a result, the side reaction is quite severe if the lithium-ion battery experiences thermal runaway. In order to accurately simulate the thermal runaway of batteries, it is crucial to be able to thoroughly analyze the chain of exothermic reactions inside the lithium-ion batteries. This study adopts a four reaction model to simulate the thermal runaway behaviors inside the lithium-ion battery cell, while the parameters and initial values for the thermal runaway model are shown in Table 1.
  • Solid electrolyte interface (SEI) decomposition reaction:
    d c s e i d t = A s e i · exp [ E s e i R T ] c s e i m s e i
  • Anode-electrolyte reaction:
    d c n e d t = A n e · exp [ t s e i t s e i , r e f ] exp [ E n e R T ] c n e m n e
  • Cathode-electrolyte reaction:
    d α d t = A p e · exp ( E p e / R T ) α m p e , 1 ( 1 α ) m p e , 2
  • Electrolyte decomposition reaction:
    d c c e d t = A e · exp [ E e R T ] c e m e
    As the anode and electrolyte reactions proceed, the SEI layer is growing:
    t s e i = t s e i , 0 + ( c n e g , 0 c n e g )
    The total heat (in W/m3) produced by the thermal runaway can be calculated:
    q ˙ a b u s e = H s e i W s e i | d c s e i d t | + H n e W n e | d c n e d t | + H p e W p e | d α d t | + H e W e | d c e d t |

2.4. Internal Short Circuit Thermal Runaway Model

Finally, the above model is synthesized as follows:
( σ + φ + ) = ( j E C h j s h o r t )
( σ φ ) = j E C h j s h o r t
ρ C p T t ( k T ) = σ + | ϕ + | 2 + σ | ϕ | 2 + q ˙ E C h + q ˙ s h o r t + q ˙ a b u s e
Table 2 is a list of the lithium-ion battery parameters used in this investigation. The flow chart of the model is shown in the Figure 3.
In this study, the internal shorting area is 10 mm × 10 mm, the internal shorting resistance is 0.01 Ω , the penetration depth is 100%, and the convective heat transfer coefficient is h = 100 W/( m 2 · K ) as the benchmark arithmetic example. Then, we change one of the variables at a time, observe its changes, and discuss the impact of the short circuit location on the thermal runaway of the lithium-ion battery. Figure 2 and Figure 4 depict the models of the internal shorting position.

2.5. Initial and Boundary Conditions
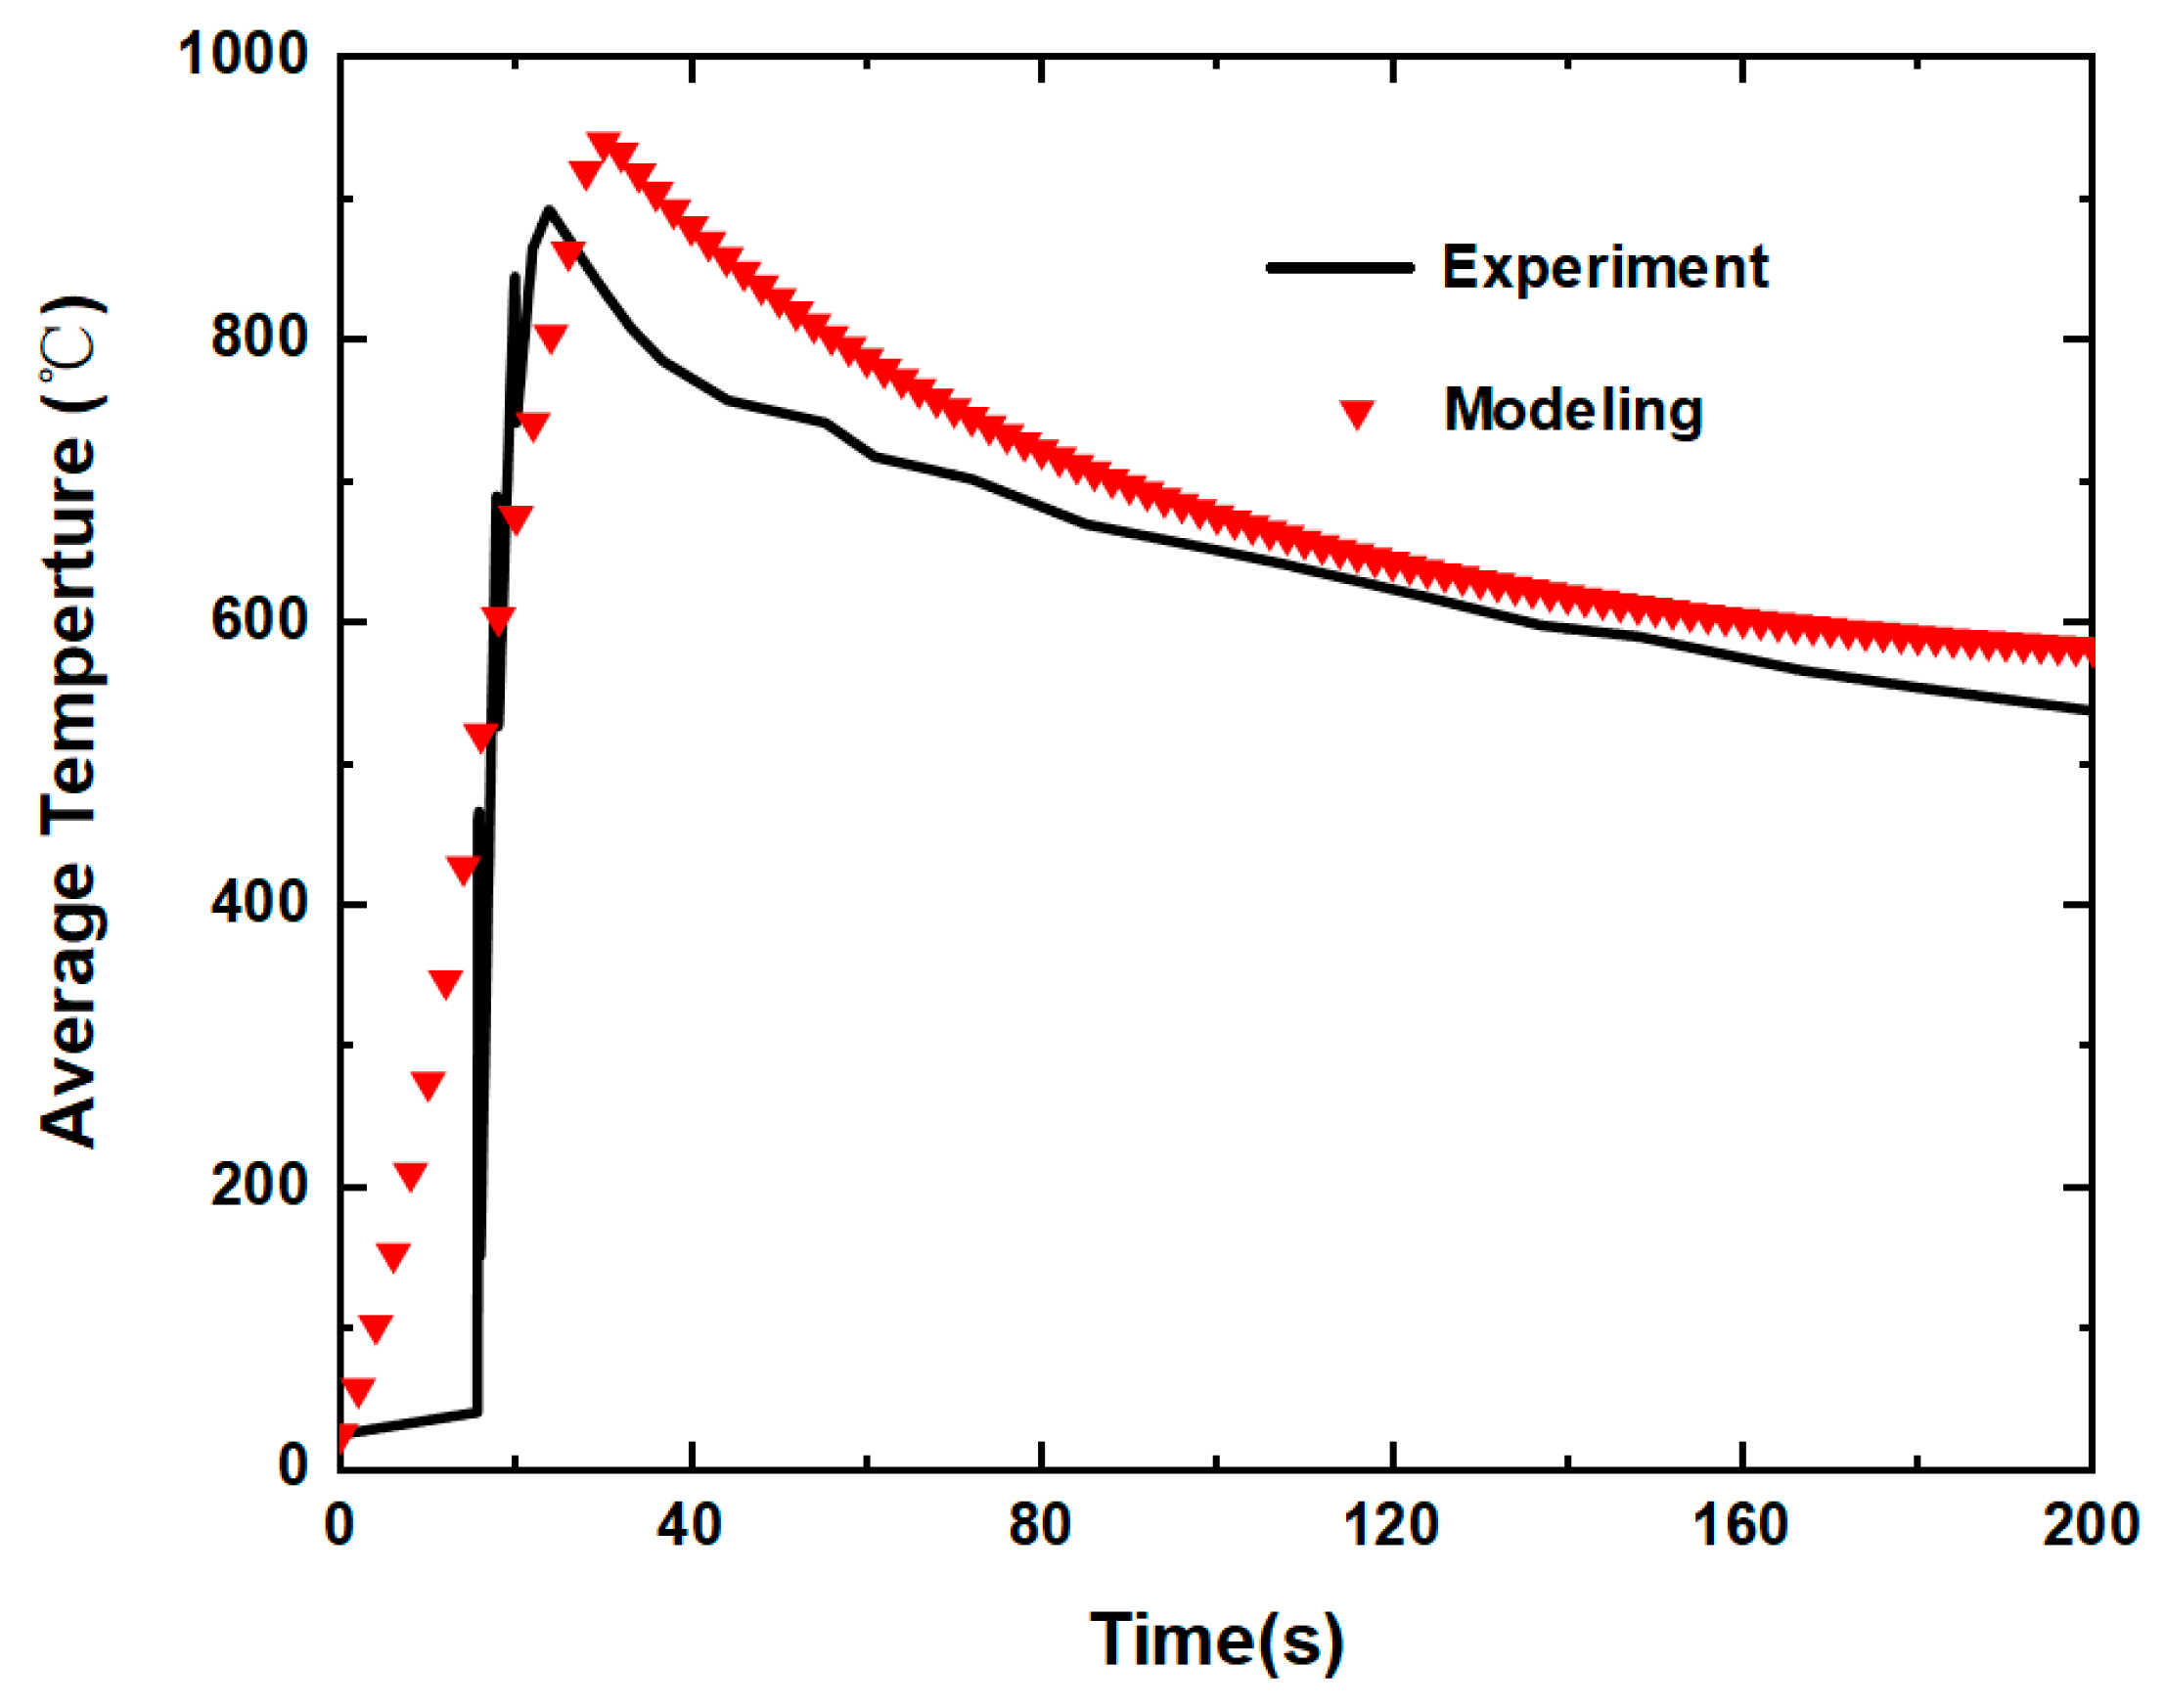
  • Assume the initial condition is T = 25 °C [49,50].
  • The boundary conditions are selected as the third type of boundary conditions: [49,50].
k T n = h ( T T )

2.6. Model Validity

To validate the thermal abuse model, we simulate the thermal runaway experiment of acupuncture in reference [51], where a standard square battery is acupunctured to generate thermal runaway. Thereafter, the battery temperature will rise rapidly. After the temperature reaches the maximum, it will start to decrease due to the depletion of the materials in the battery. Figure 5 shows the average temperature of the battery for the basic model simulated in this paper and the experimental data in reference [51]. The comparison between the simulation results and the experimental results show good agreement.

3. Results and Discussions

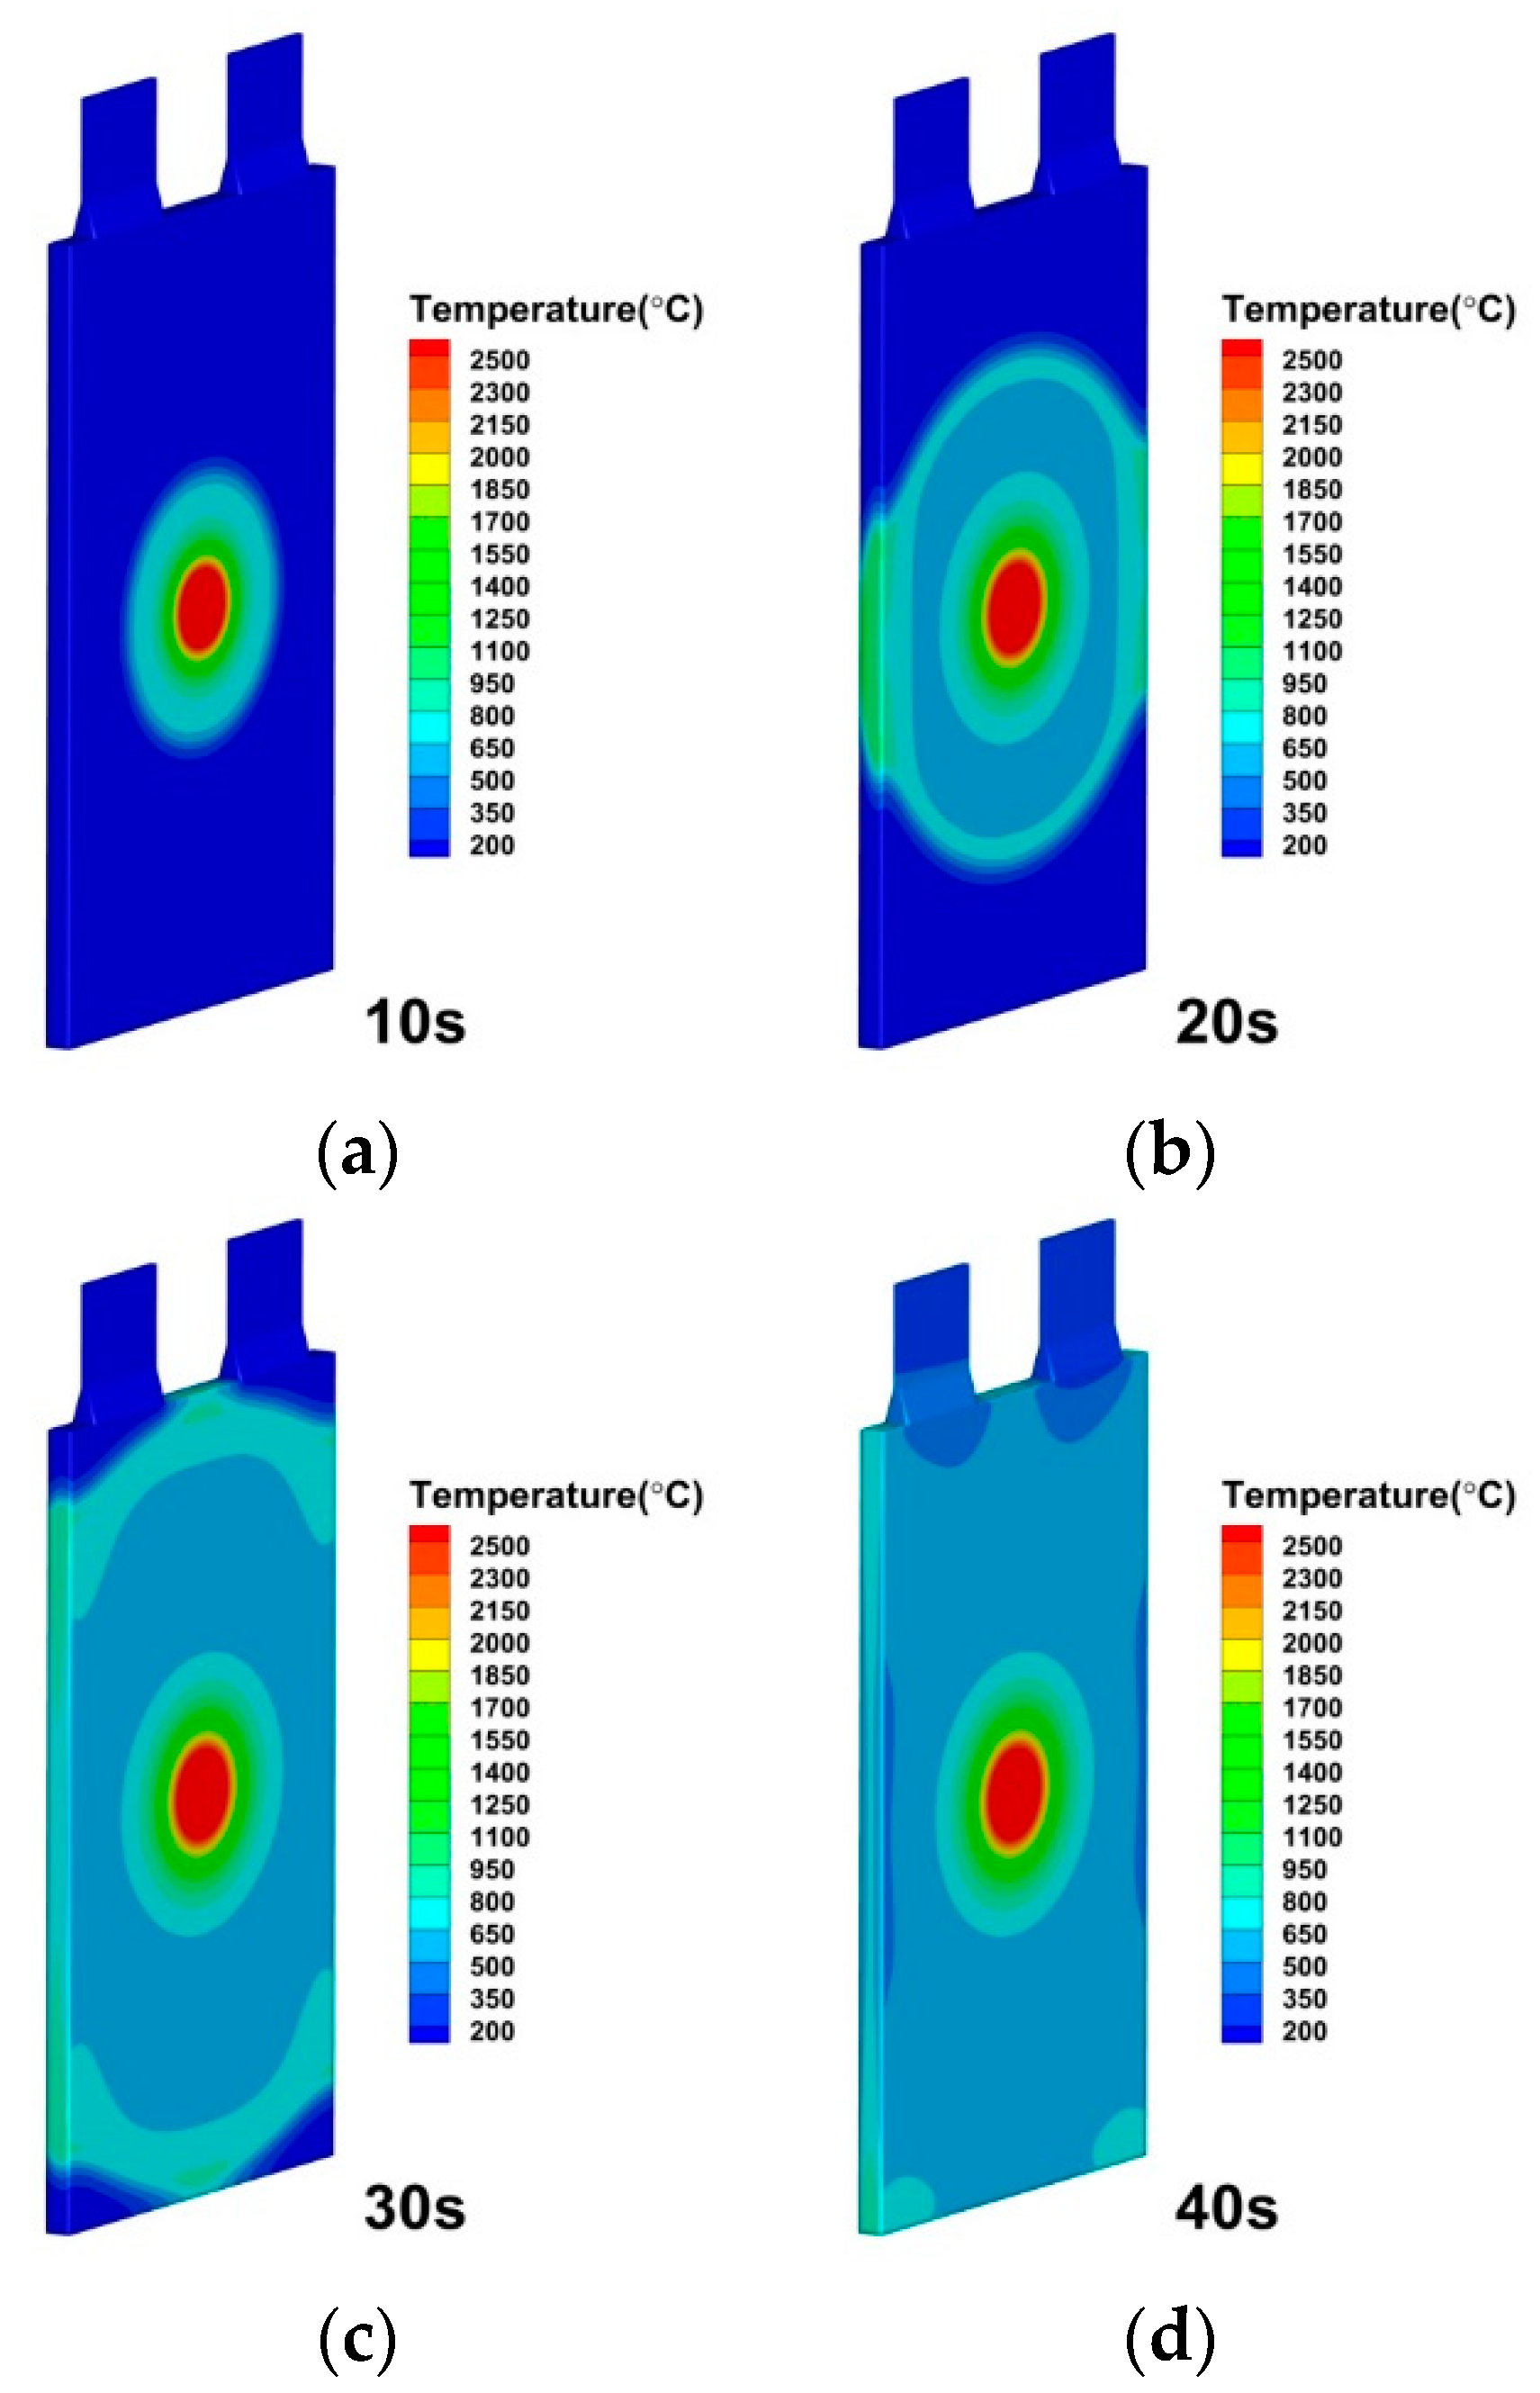
3.1. Effect of Internal Short Circuit Area

The modeling approach carefully investigates and discusses the impacts of the internal short circuit area. The investigation is performing simulations specifying the internal short circuit area as 2 mm × 2 mm, 3 mm × 3 mm, 5 mm × 5 mm, and 10 mm × 10 mm, while keeping all other conditions identical. When a short circuit occurs, the current increases sharply, and the chemical reaction generates reaction heat and joule heat which drives the temperature to rise rapidly until reaching the peak temperature. After reaching its peak, the battery’s internal reaction heat slowly dissipates, causing the temperature to decrease. As seen in Figure 6, the fact that the lithium-ion battery’s average temperature is roughly the same 50 s before thermal runaway suggests that the internal short circuit area of the battery has minimal effect on the average temperature. The lithium-ion battery average temperature increases after 50 s of thermal runaway in direct proportion to the size of the internal short circuit area. It demonstrates that a significant quantity of heat is generated inside the lithium-ion battery after the thermal runaway starts. The average temperature rises because more heat is produced in larger areas, as implied by the analysis implied in Equation (14). According to the study, thermal runaway is not significantly influenced by the internal short circuit area.
As seen in Figure 7 and Figure 8, the temperature in the cell is rather uneven, with the internal short circuit region experiencing the maximum temperature. Thermal runaway is not significantly influenced by the internal short circuit area. In the vicinity of the internal short circuit, a large amount of heat is suddenly released within 1 s and induces highly localized high temperature. Then, by means of heat conduction, the temperature is dispersed over a larger surface inside the lithium-ion battery. Huang, Z [30] also found a weak effect on the peak temperature of the battery with different diameters of nails in experiment.

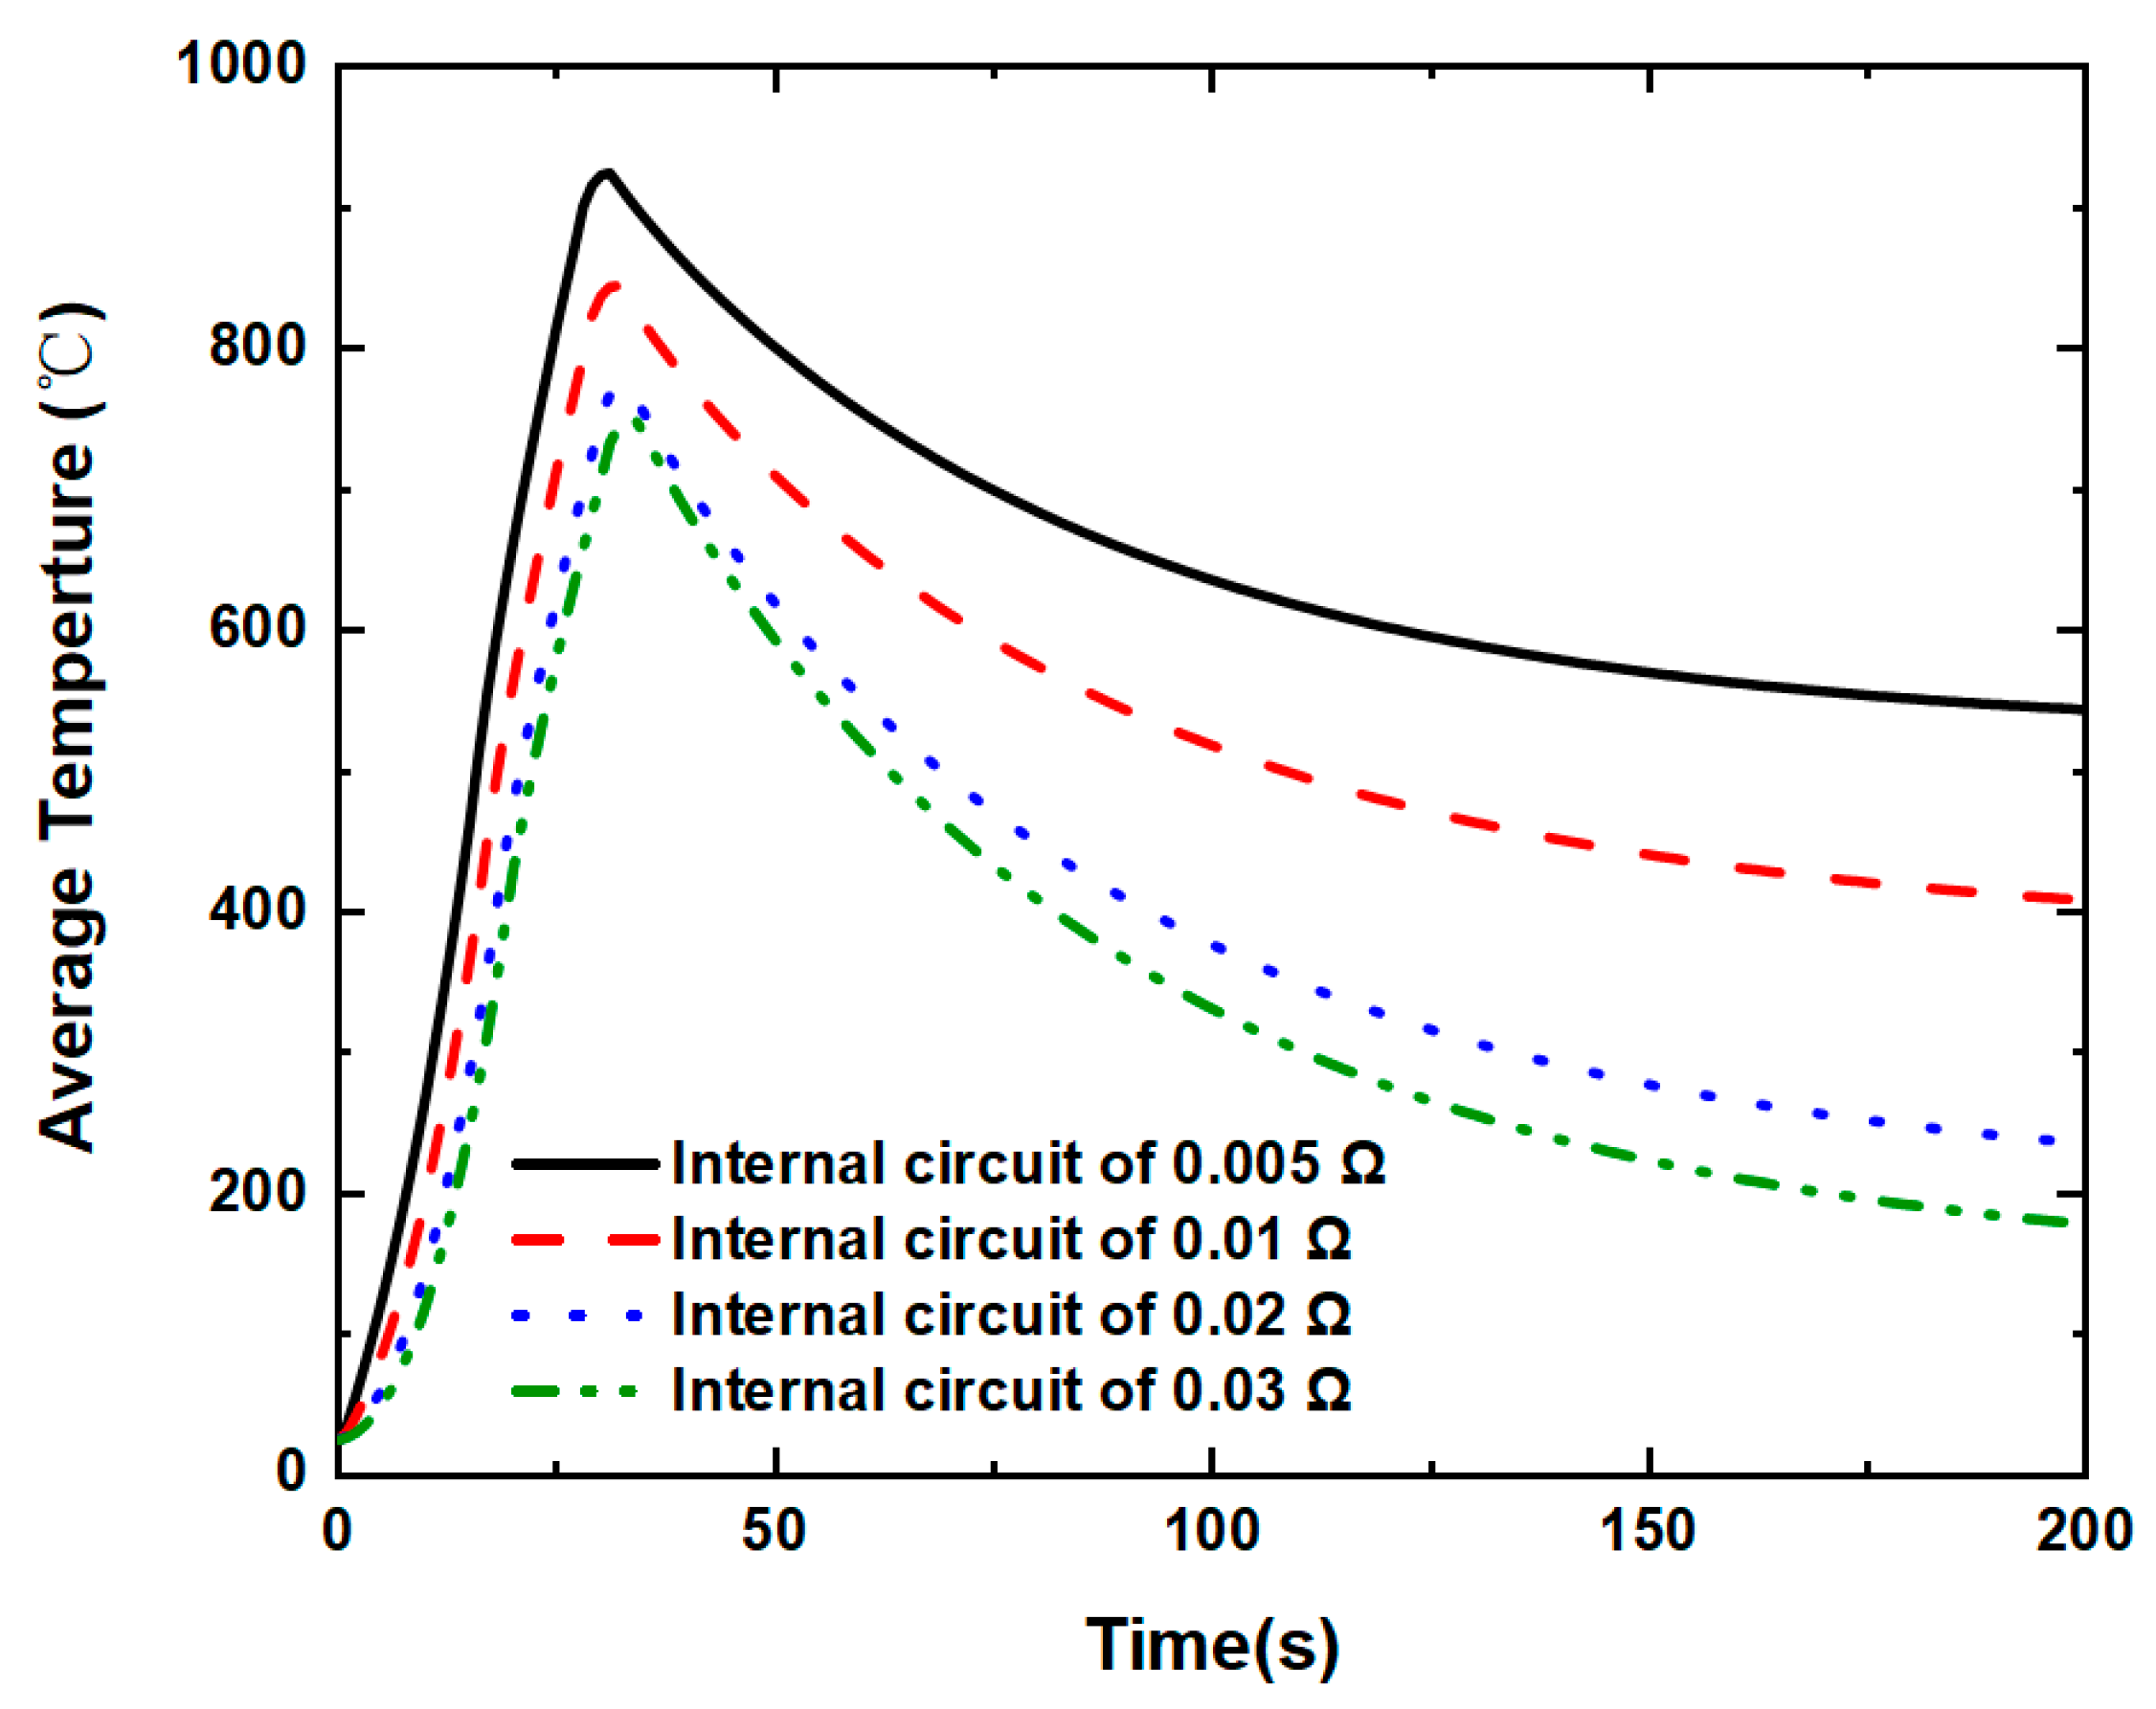
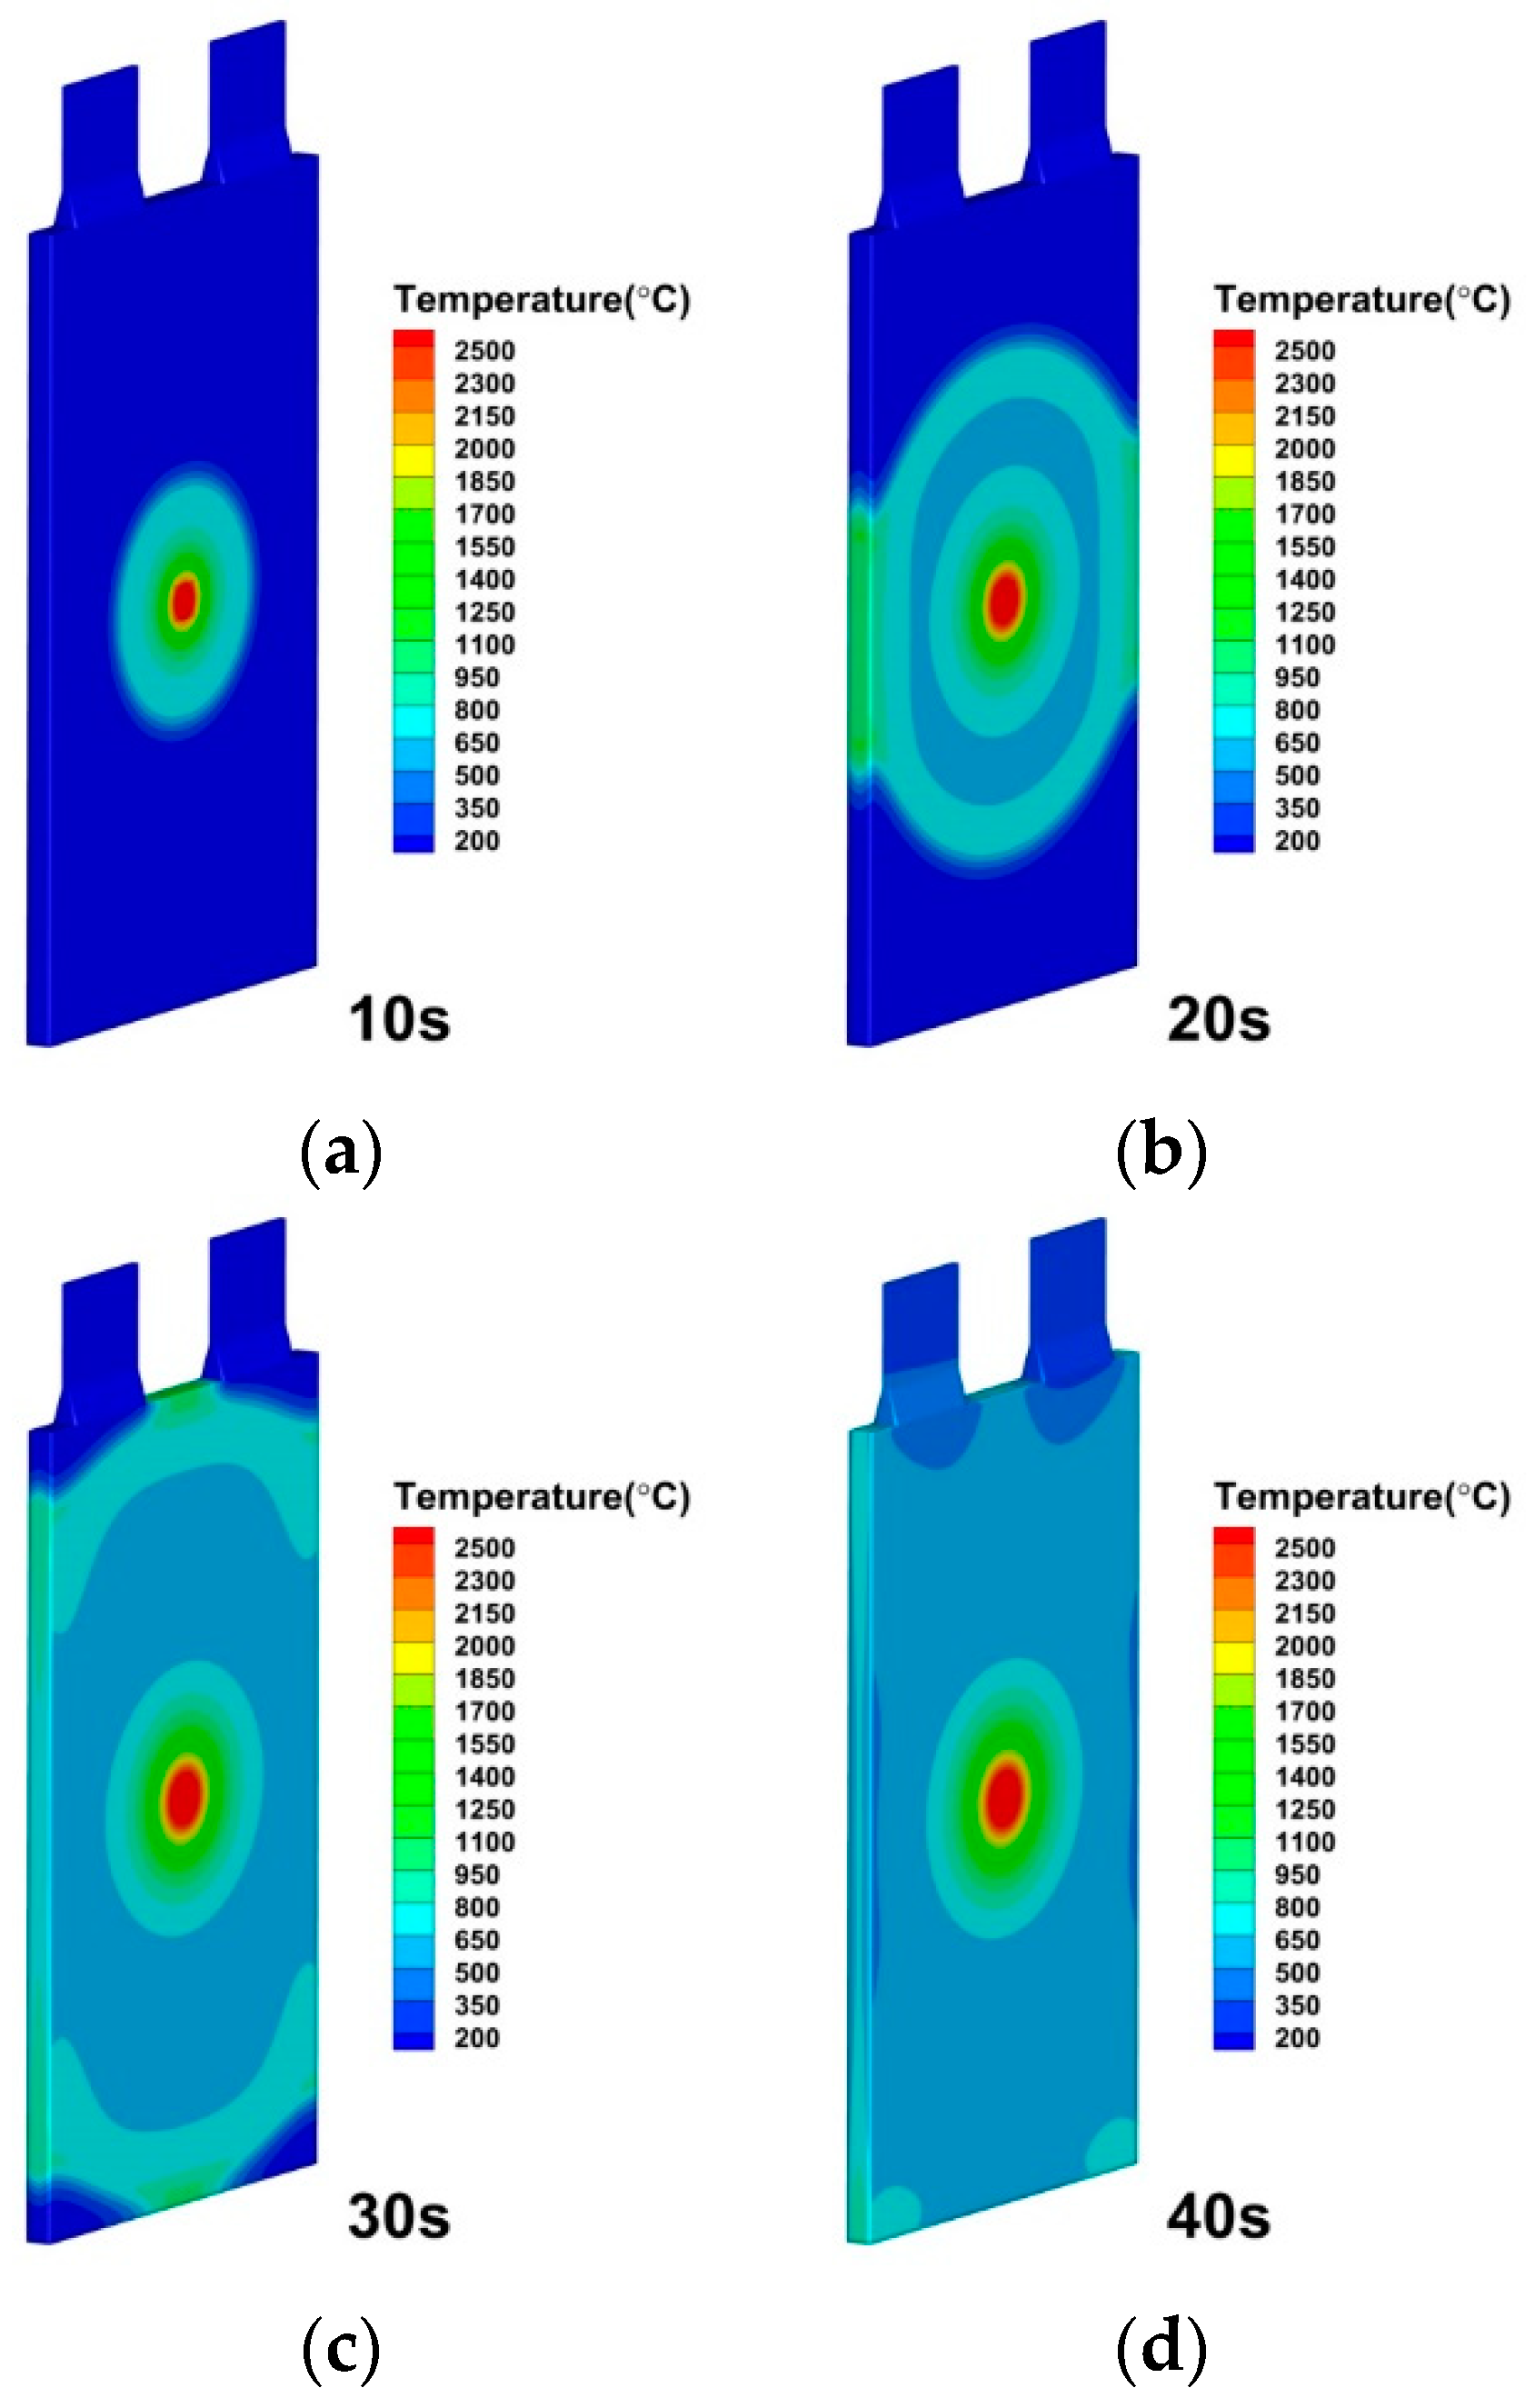
3.2. Effect of Internal Short Circuit Resistance

As seen in Figure 9, Figure 10 and Figure 11, the internal short circuit resistance has a significant impact on the lithium-ion battery during the internal short circuit induced thermal runaway. The effects of internal short circuit resistance are specifically investigated and discussed by the modeling approach. The internal short circuit resistances of 0.005, 0.01, 0.02 and 0.03 Ω were specified for the internal short resistance while all other variables were kept identical. The maximum temperature of the battery, or more precisely, the rise in temperature of the short-circuit component, can be found to be significantly influenced by the internal short circuit resistance. According to the analysis implied in Equations (13) and (14), the internal short circuit current of lithium-ion batteries reduces as short-circuit resistance increases. The principal source of heat generation at the early stage of the internal short circuit is the joule heat produced by the internal short circuit current, which is inversely proportional to the internal short circuit resistance. The capability for heat production increases with decreasing resistance (increasing conductivity). The lithium-ion battery average temperature and local maximum temperature are larger because its internal short circuit is equivalent to high current discharge, and the degree of change is evident.

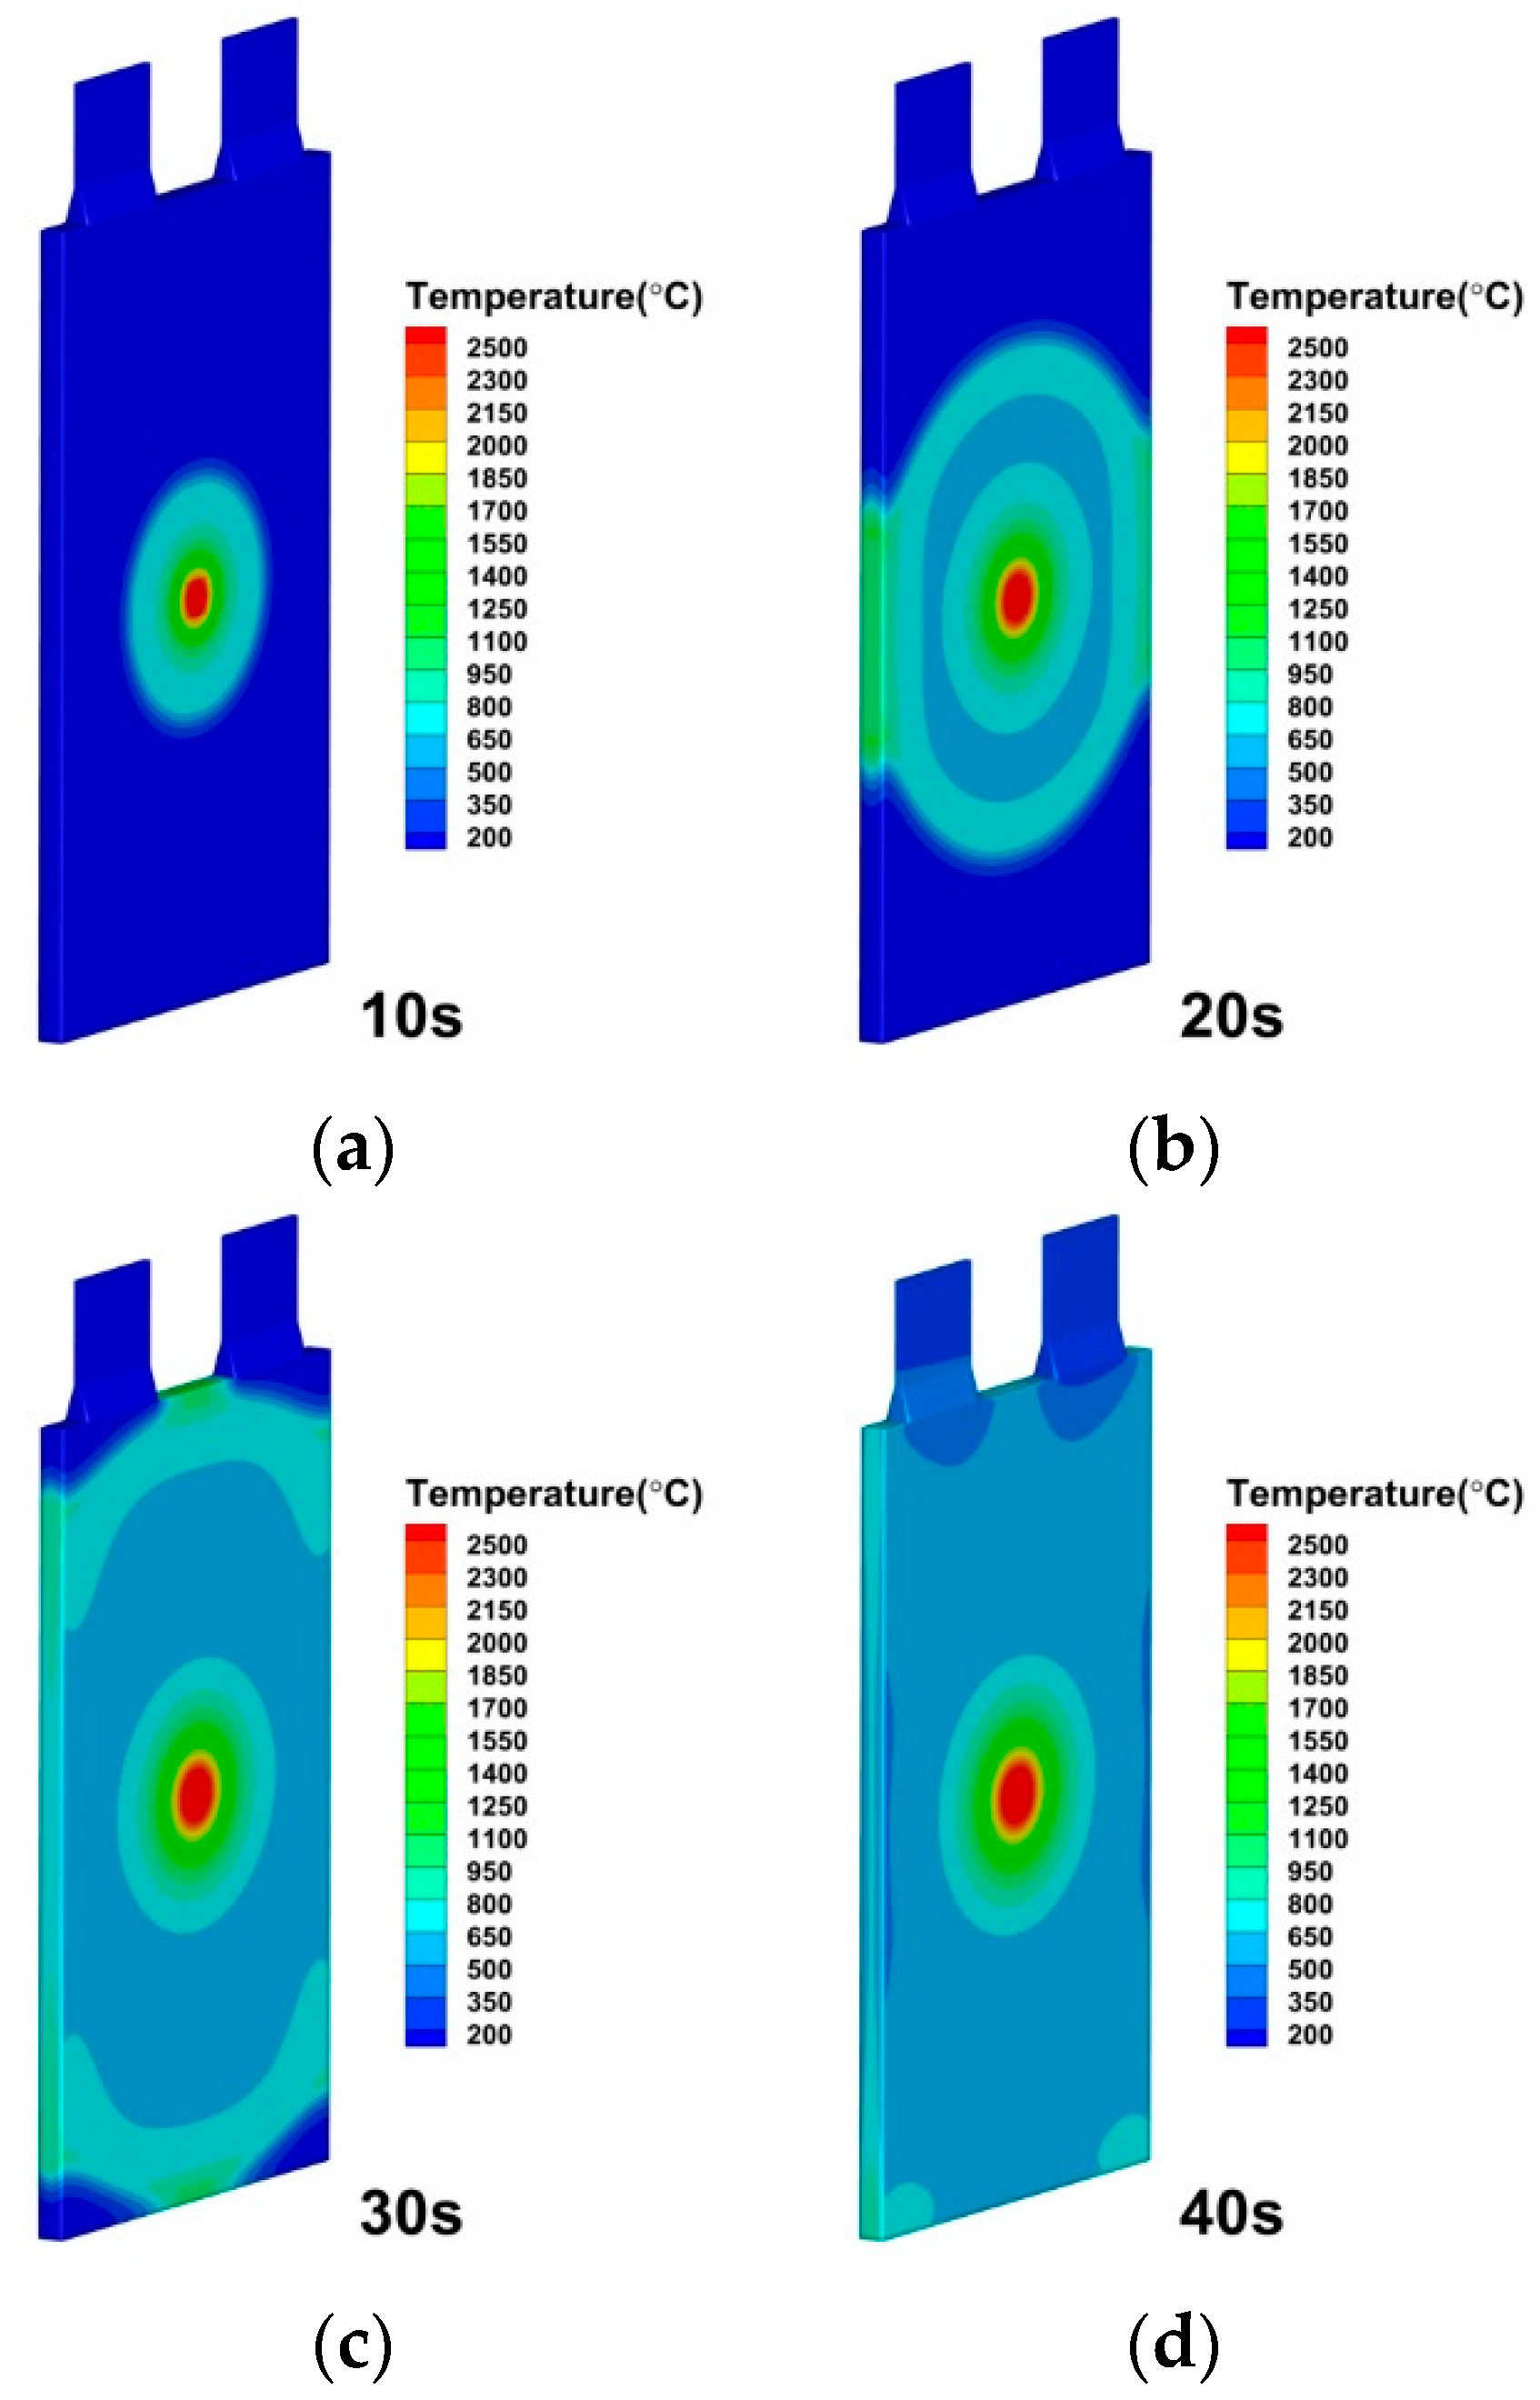
3.3. Effect of Internal Short Circuit Penetration Depth

As shown in Figure 12, the lithium-ion battery is less affected by the depth of the internal short circuit penetration during the internal short circuit-induced thermal runaway process. The effects of internal short circuit resistance are specifically studied and discussed by the modeling approach. The internal short circuit penetration depths of 25%, 50%, 75% and 100% were specified for simulations, while keeping all other variables identical. The average temperature is discovered to be larger with more internal short circuit penetration depth. The average temperature is almost the same when the penetrating depths are 50% and 75%. The impact is minimal due to the thinness of the lithium battery and the similar depths of these two penetrations. On the other hand, the maximum temperature is the same for the four penetration depths. The temperature fields’ evolutions shown in Figure 13 and Figure 14 are also very alike.

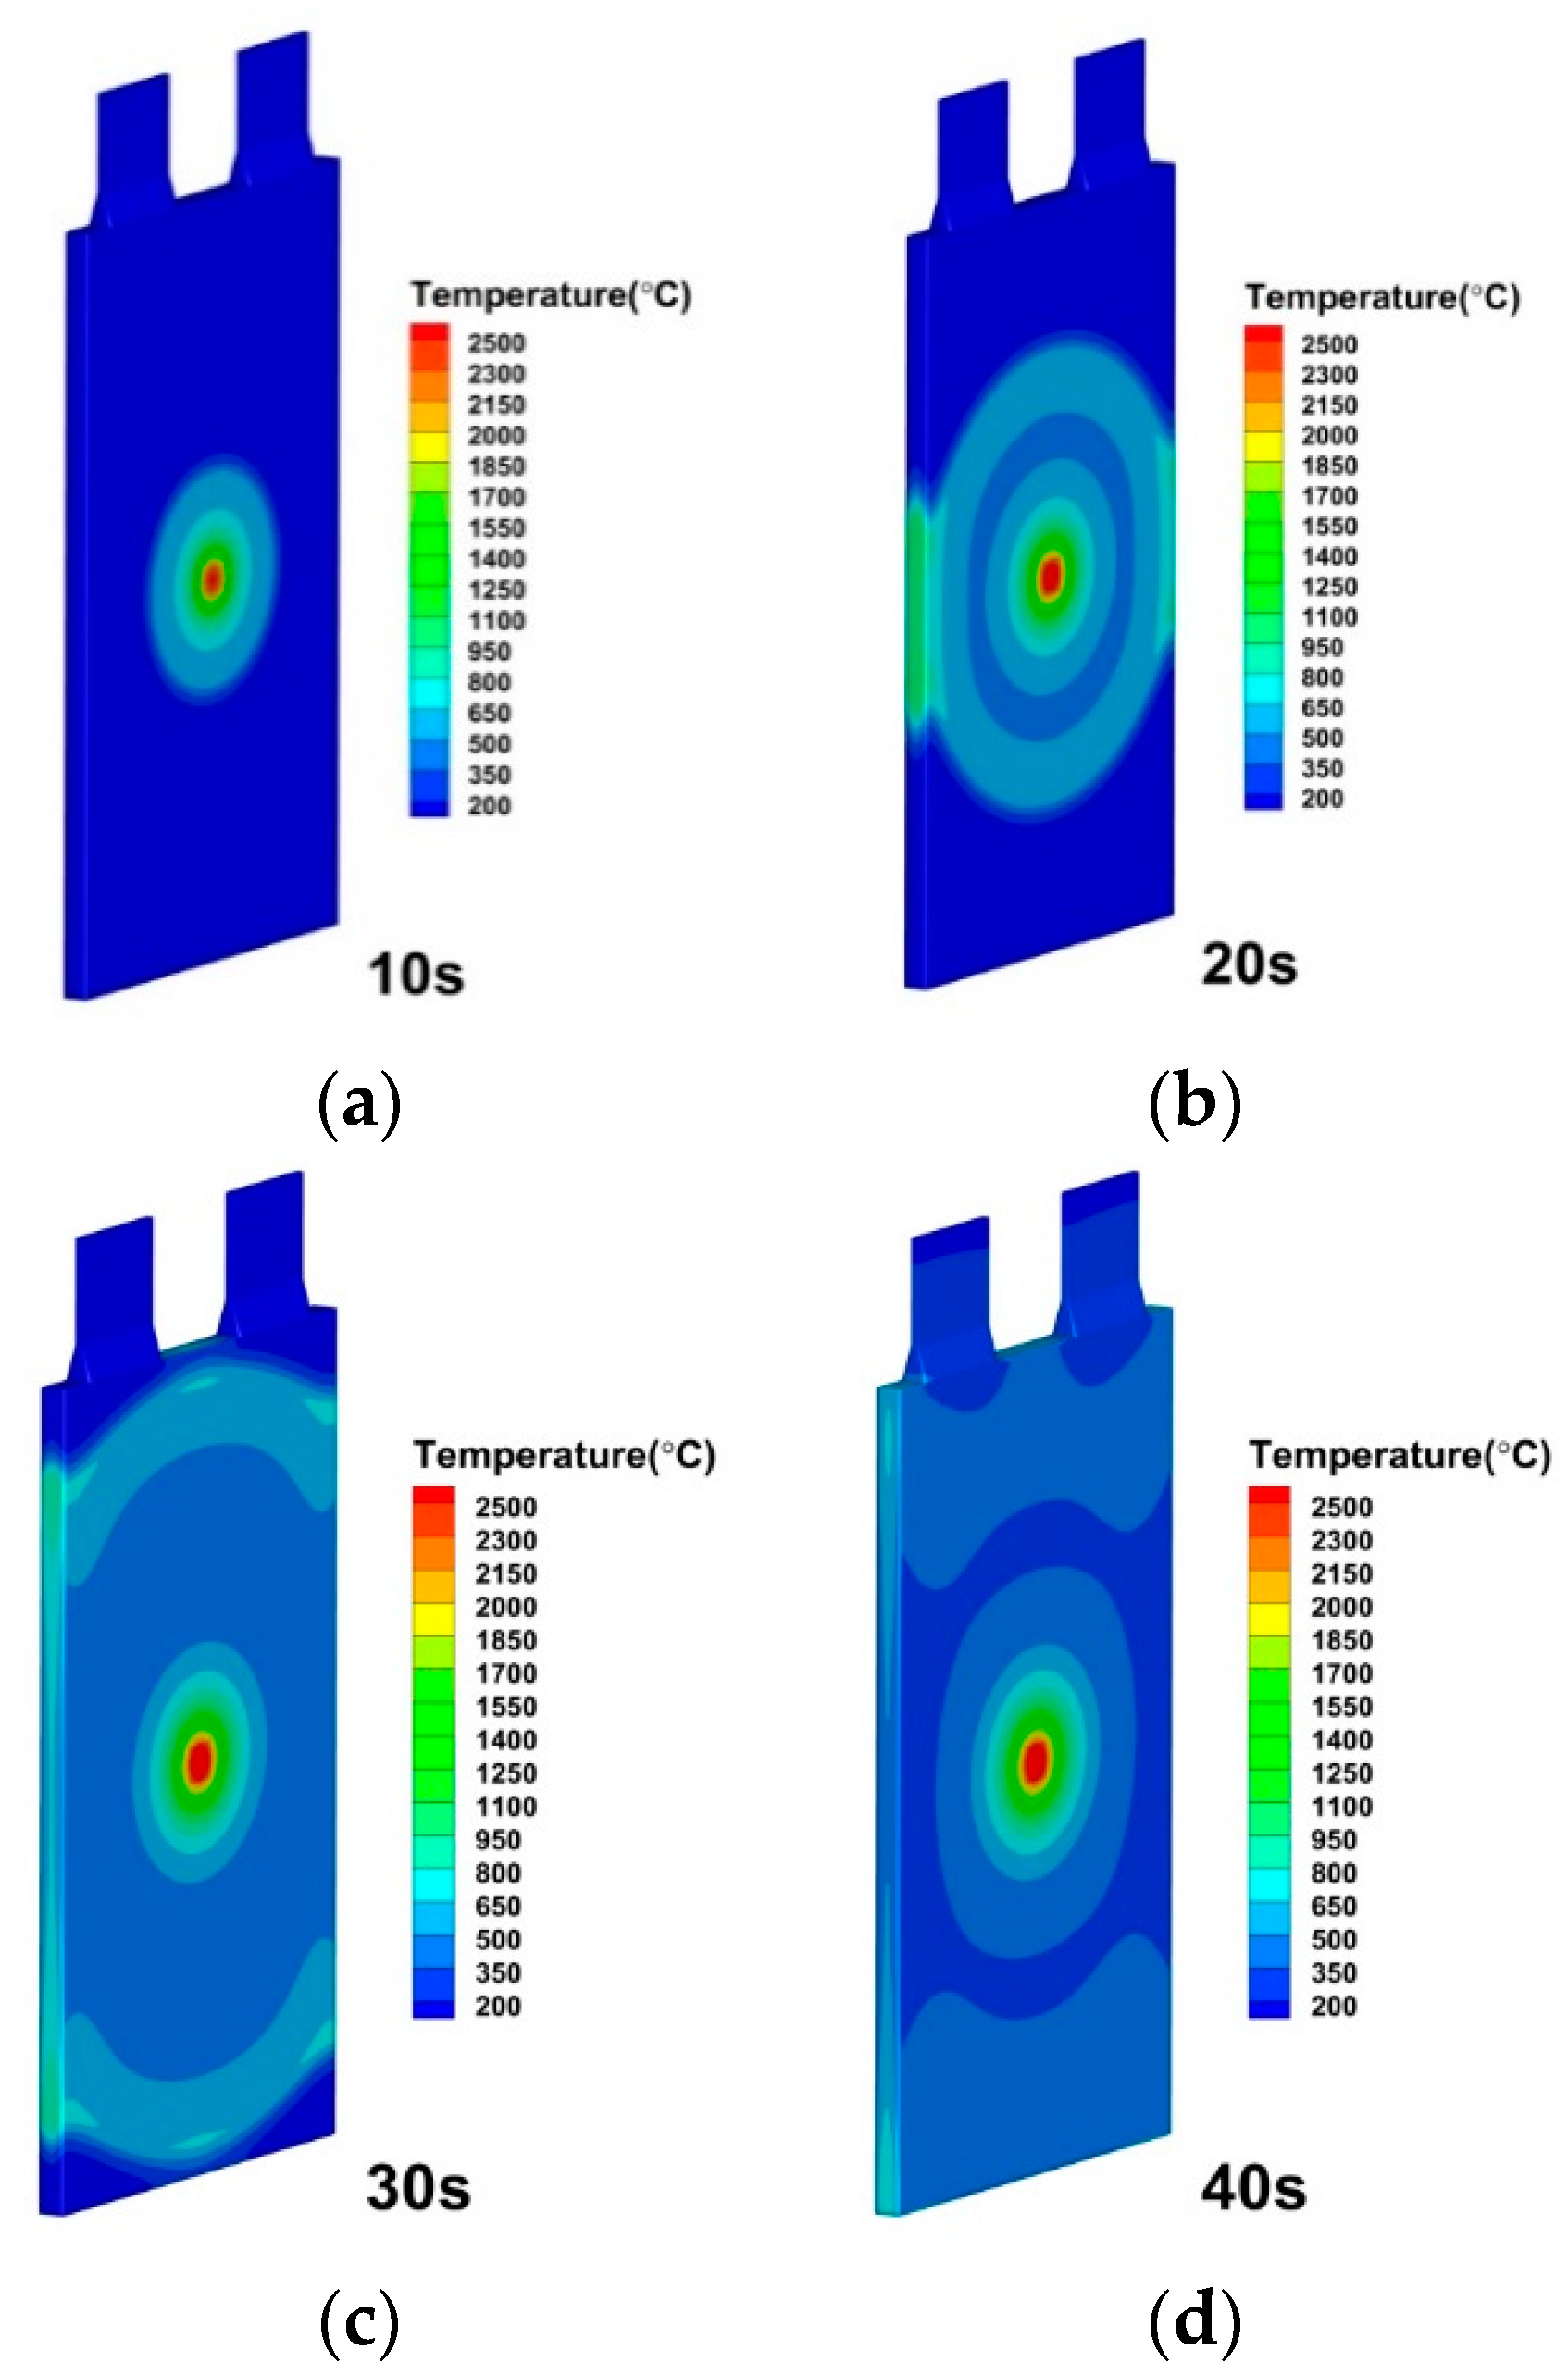
3.4. Effect of Convective Heat Transfer Coefficient

The modeling approach especially studies and discusses the impacts of the convective heat transfer coefficient. The convective heat transfer coefficients of h = 100 W/( m 2 K ), h = 200 W/( m 2 K ), h = 500 W/( m 2 K ), h = 1000 W/( m 2 K ), h = 2000 W/( m 2 K ), h = 5000 W/( m 2 K ) and h = 10,000 W/( m 2 K ) are specified for simulation, while all other variables are kept to be the same. The convective heat transfer coefficient, as depicted in Figure 15, has a greater impact on the thermal runaway caused by the internal short circuit in lithium-ion batteries. The different heat transfer coefficient represents different cooling method on the battery cell surface. It is seen in Figure 16, Figure 17 and Figure 18 that the temperature propagation is significantly reduced by increasing the heat transfer coefficient from 100 W/( m 2 K ) to 200 and 500 W/( m 2 K ). Furthermore, as shown in Figure 19, the temperature on the cell is suppressed to be below 500 K before 40 s. Moreover, thermal runaway produces a high temperature, which eventually dissipates. Therefore, with sufficient cooling and thorough heat dissipation techniques, the huge heat generated by the thermal runaway of a lithium-ion battery can be greatly minimized. Suppressing thermal runaway propagation in the single lithium-ion battery cell is crucial for improving lithium-ion battery thermal management.

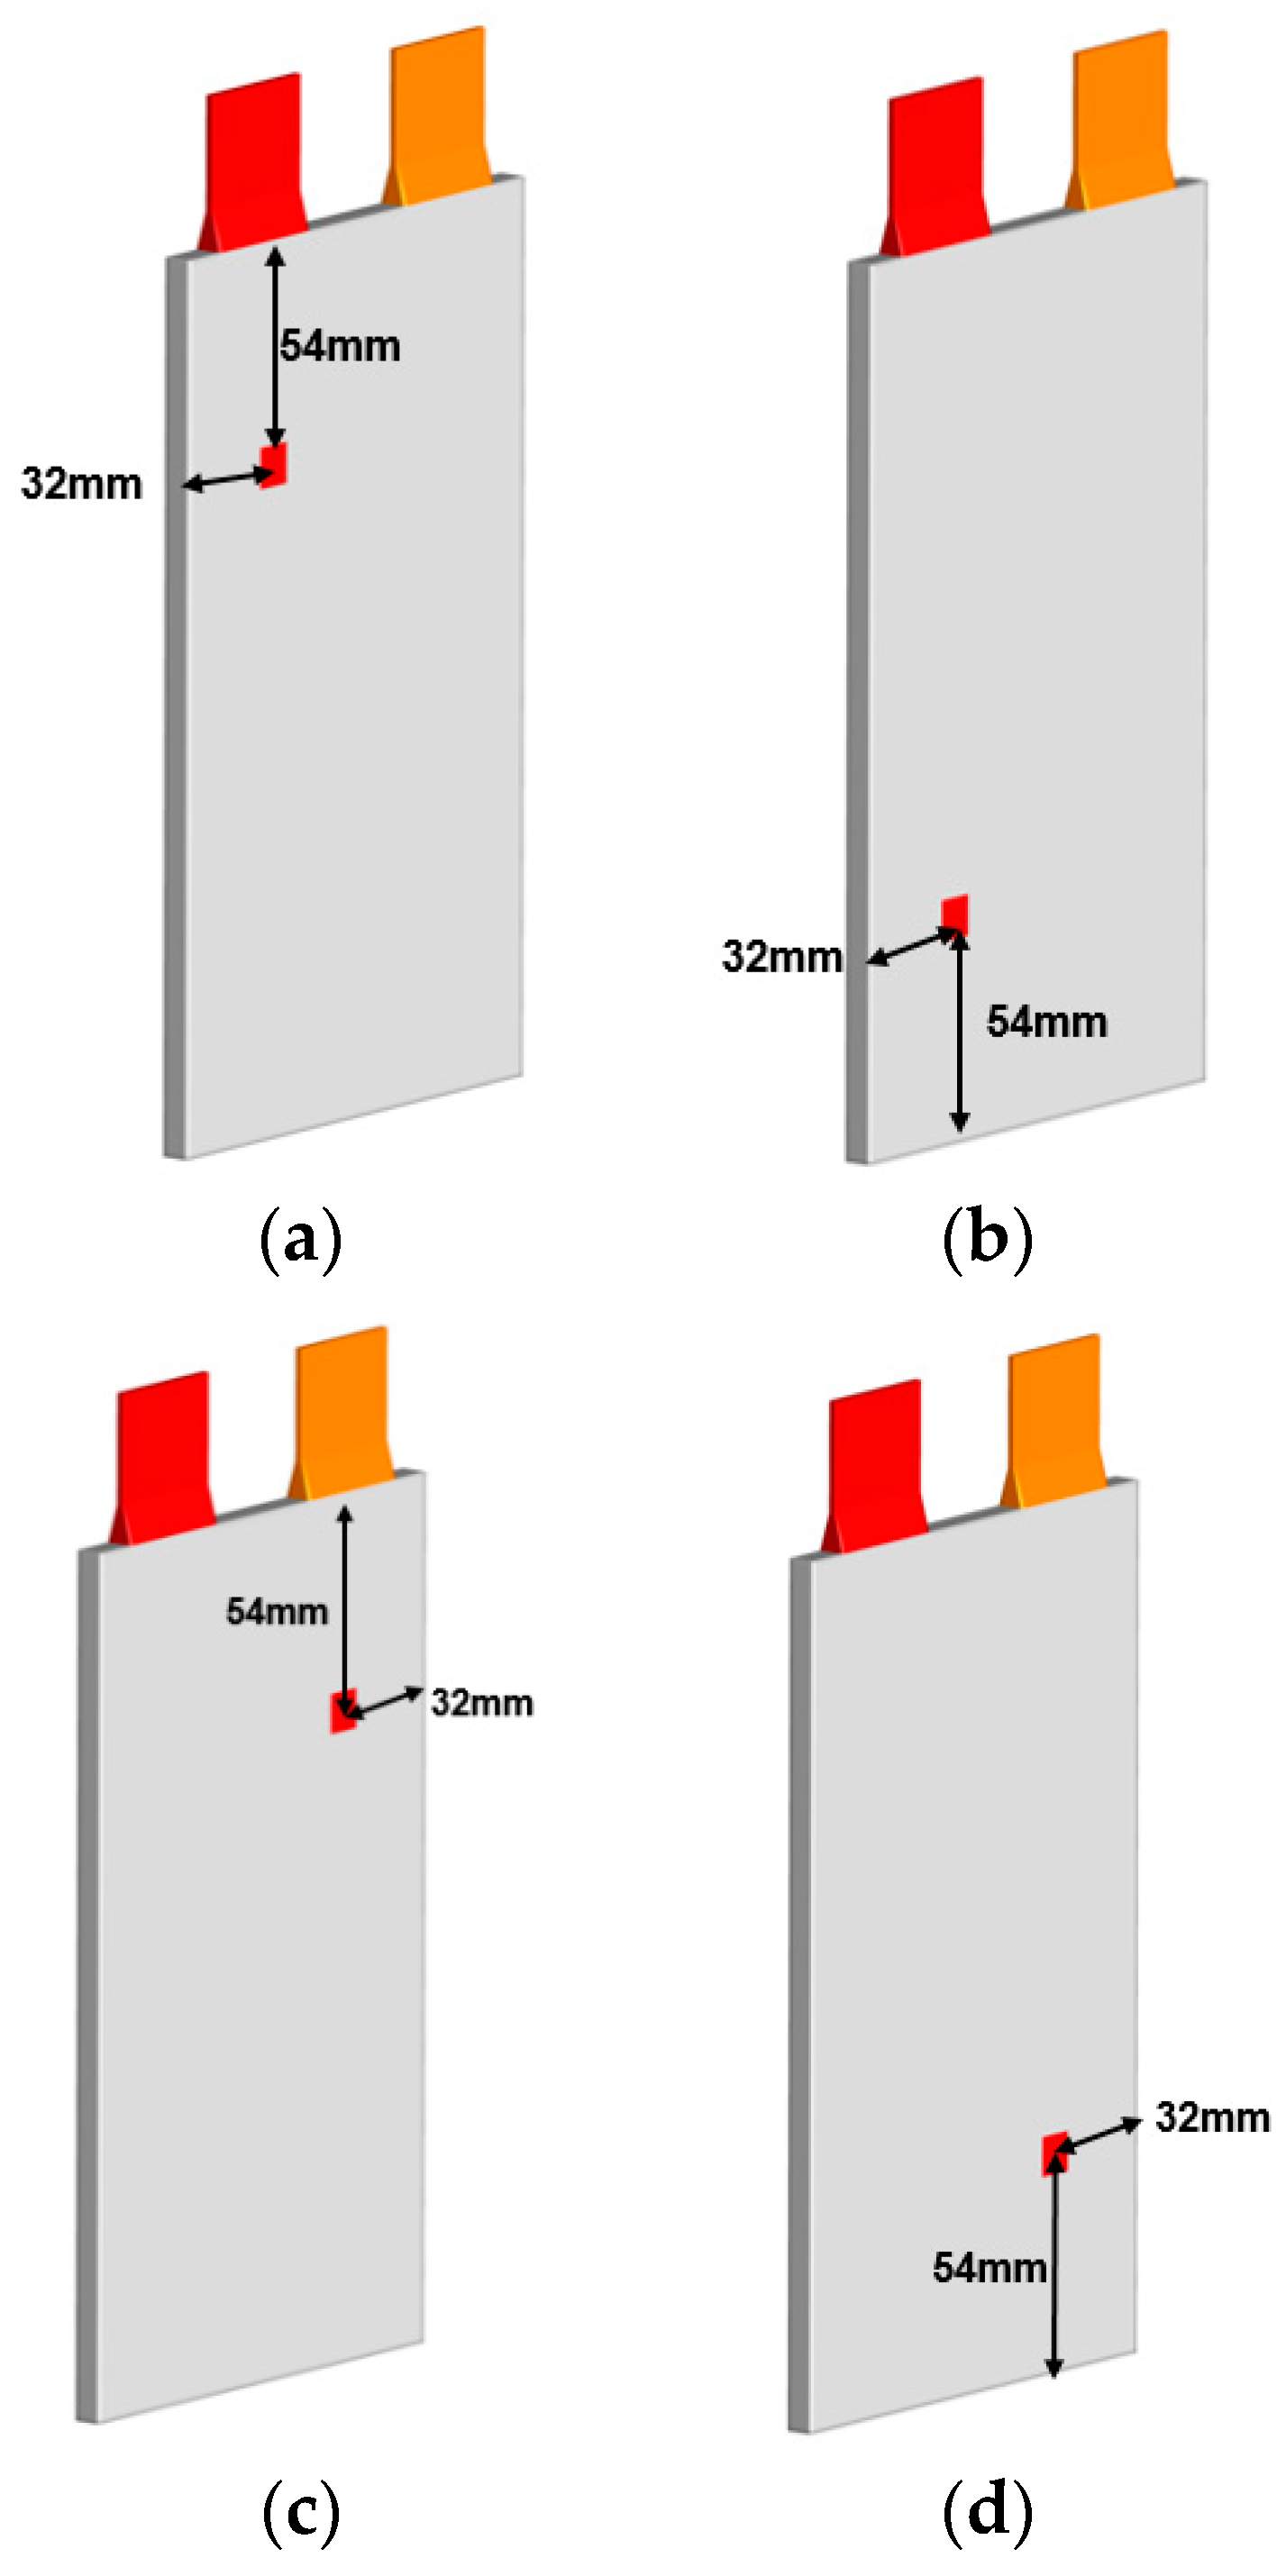
3.5. Effect of Internal Short Circuit Position

Figure 20 illustrates how little difference the internal short circuit position makes to the lithium-ion battery’s average temperature during the thermal runaway process that the internal short circuit of the battery causes. The modeling approach carefully studies and discusses the impacts of internal short circuit position. The internal short circuit positions of middle, higher left, lower left, higher right, and lower right are specified for the simulation, while all other variables are kept the same. It is found that the internal short circuit position has no significant impact on the battery’s electrochemical characteristics or thermal runaway. However, compared to the other four positions, the middle internal short circuit position has the highest average temperature for the lithium-ion battery. The temperature evolutions on the battery cell are shown in Figure 21, Figure 22, Figure 23 and Figure 24. Thermal runaway will happen when the battery is acupunctured, regardless of whatever section of the battery is acupunctured.

4. Conclusions

In this study, a multi-scale battery modeling structure is utilized to establish a 3D model of a 20 Ah cell internal shorting and thermal runaway process. By using the ECM approach and the patch method to model initial electrochemical reactions caused by the internal short circuits, this model is used to simulate the initial process of a lithium-ion battery’s abrupt rise in temperature and drop in voltage. In order to simulate the further temperature evolution caused by the thermal runaway, the four-equation [19] thermal runaway model is then run independently after stopping the ECM model. The impacts of internal short circuit area, resistance, penetration depth, convective heat transfer coefficient, and location are investigated by the modeling approach. The following conclusions are drawn.
  • When the internal shorting area changes, the initial 50 s of the battery internal shorting area has little impact on the battery average temperature. After 50 s, the heat created inside the cell increases proportionately to the size of the short circuit area. For that reason, the lithium-ion battery average temperature is higher. Huang, Z [30] conducted 18,650 batteries acupuncture experiments on nails with the different diameters of 3 mm, 5 mm, and 8 mm, and found that the peak temperatures were 135.9 °C, 133.6 °C, and 131.8 °C, respectively, showing a negligible effect on the peak temperature of the battery.
  • When the internal shorting resistance increases, it leads to a decrease in short-circuit current, and a reduction in the ability to generate heat. As a result, lithium-ion battery average temperature decreases, which resembles references [32,33].
  • When the internal short circuit penetration depth changes, its average temperature rises as a function of the percentage of lithium battery penetration. Additionally, the average is roughly equal at 50% and 75% penetration, indicating that the influence of the penetration depth is weak.
  • When the convective heat transfer coefficient changes, an increase in the exterior convection heat transfer coefficient lowers the lithium-ion battery’s average temperature. The implication is that adequate cooling conditions can effectively prevent the emergence of thermal runaway, which is similar to reference [35].
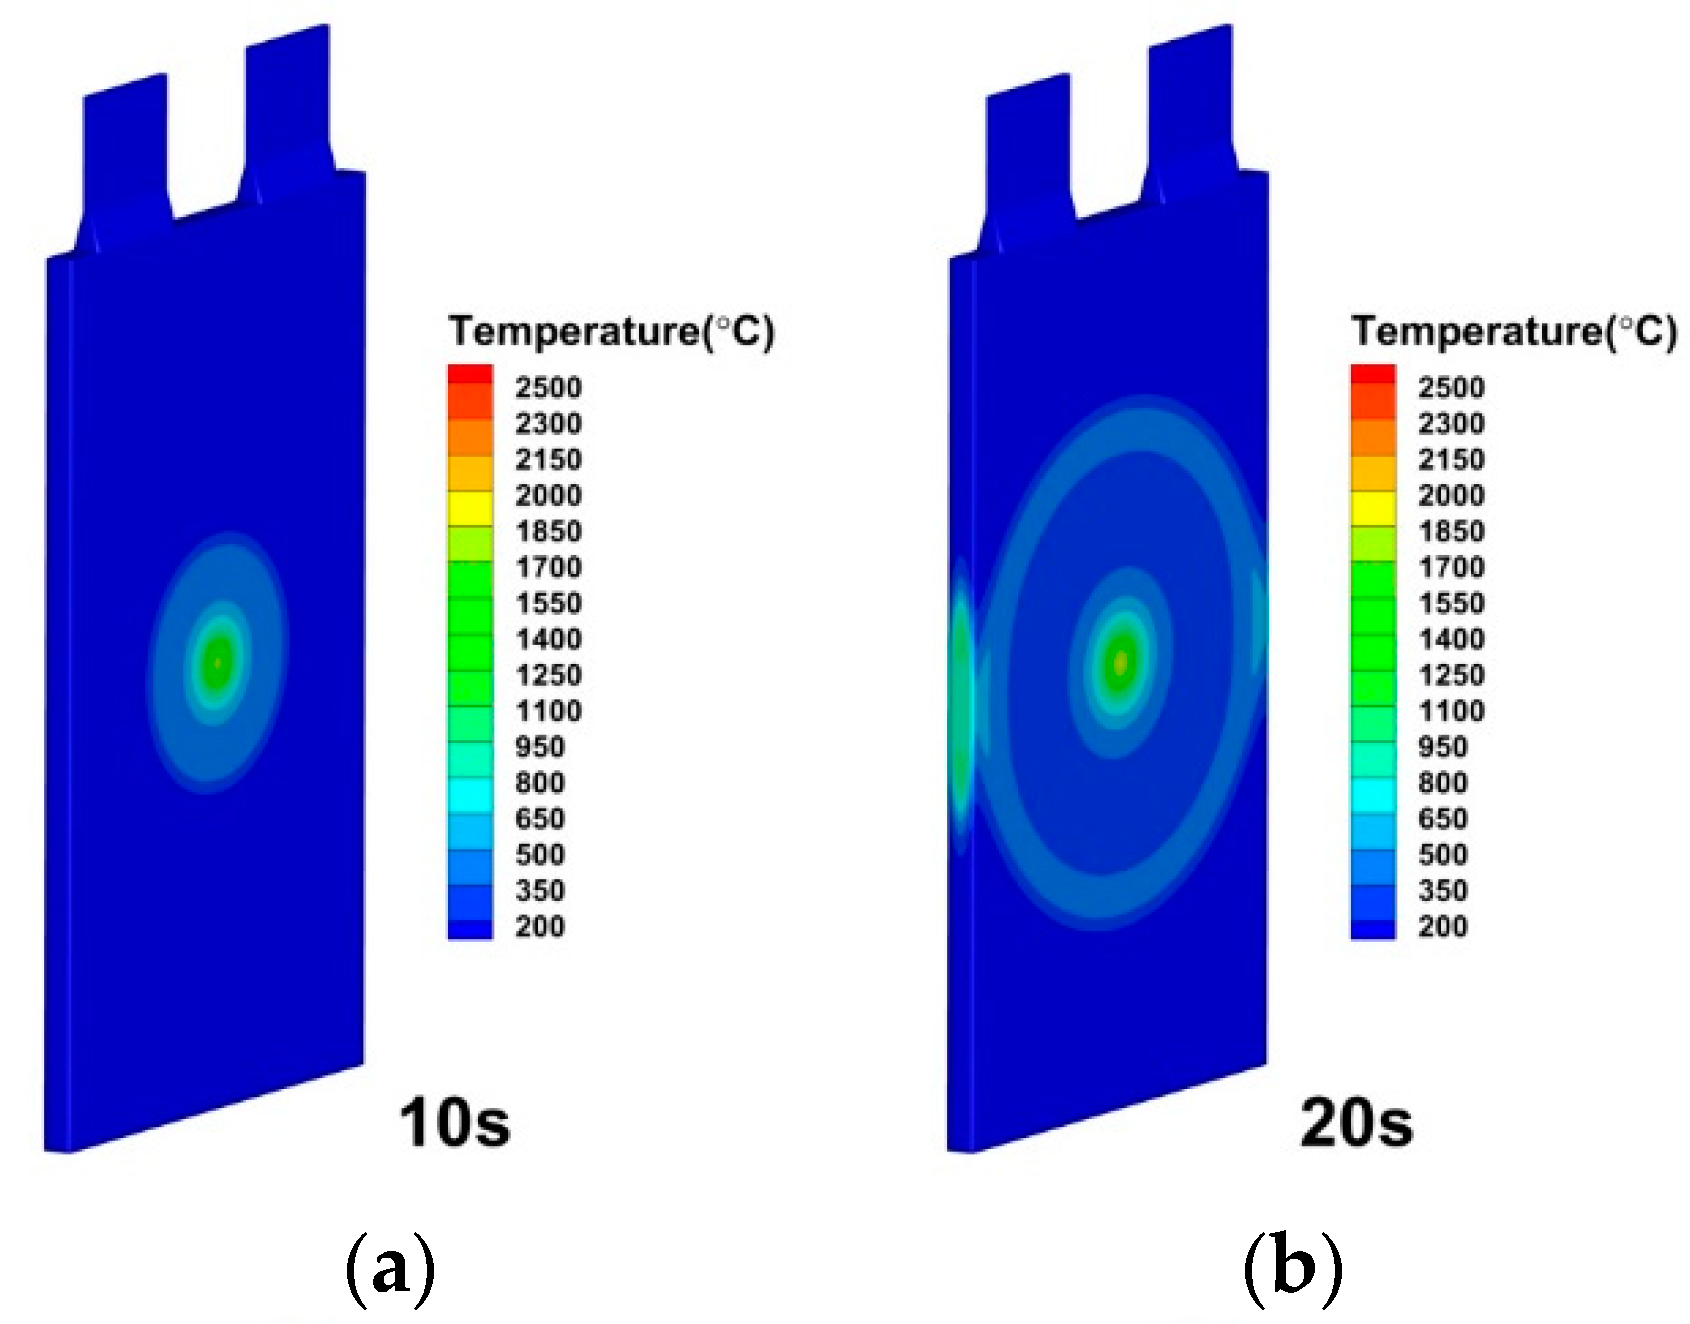
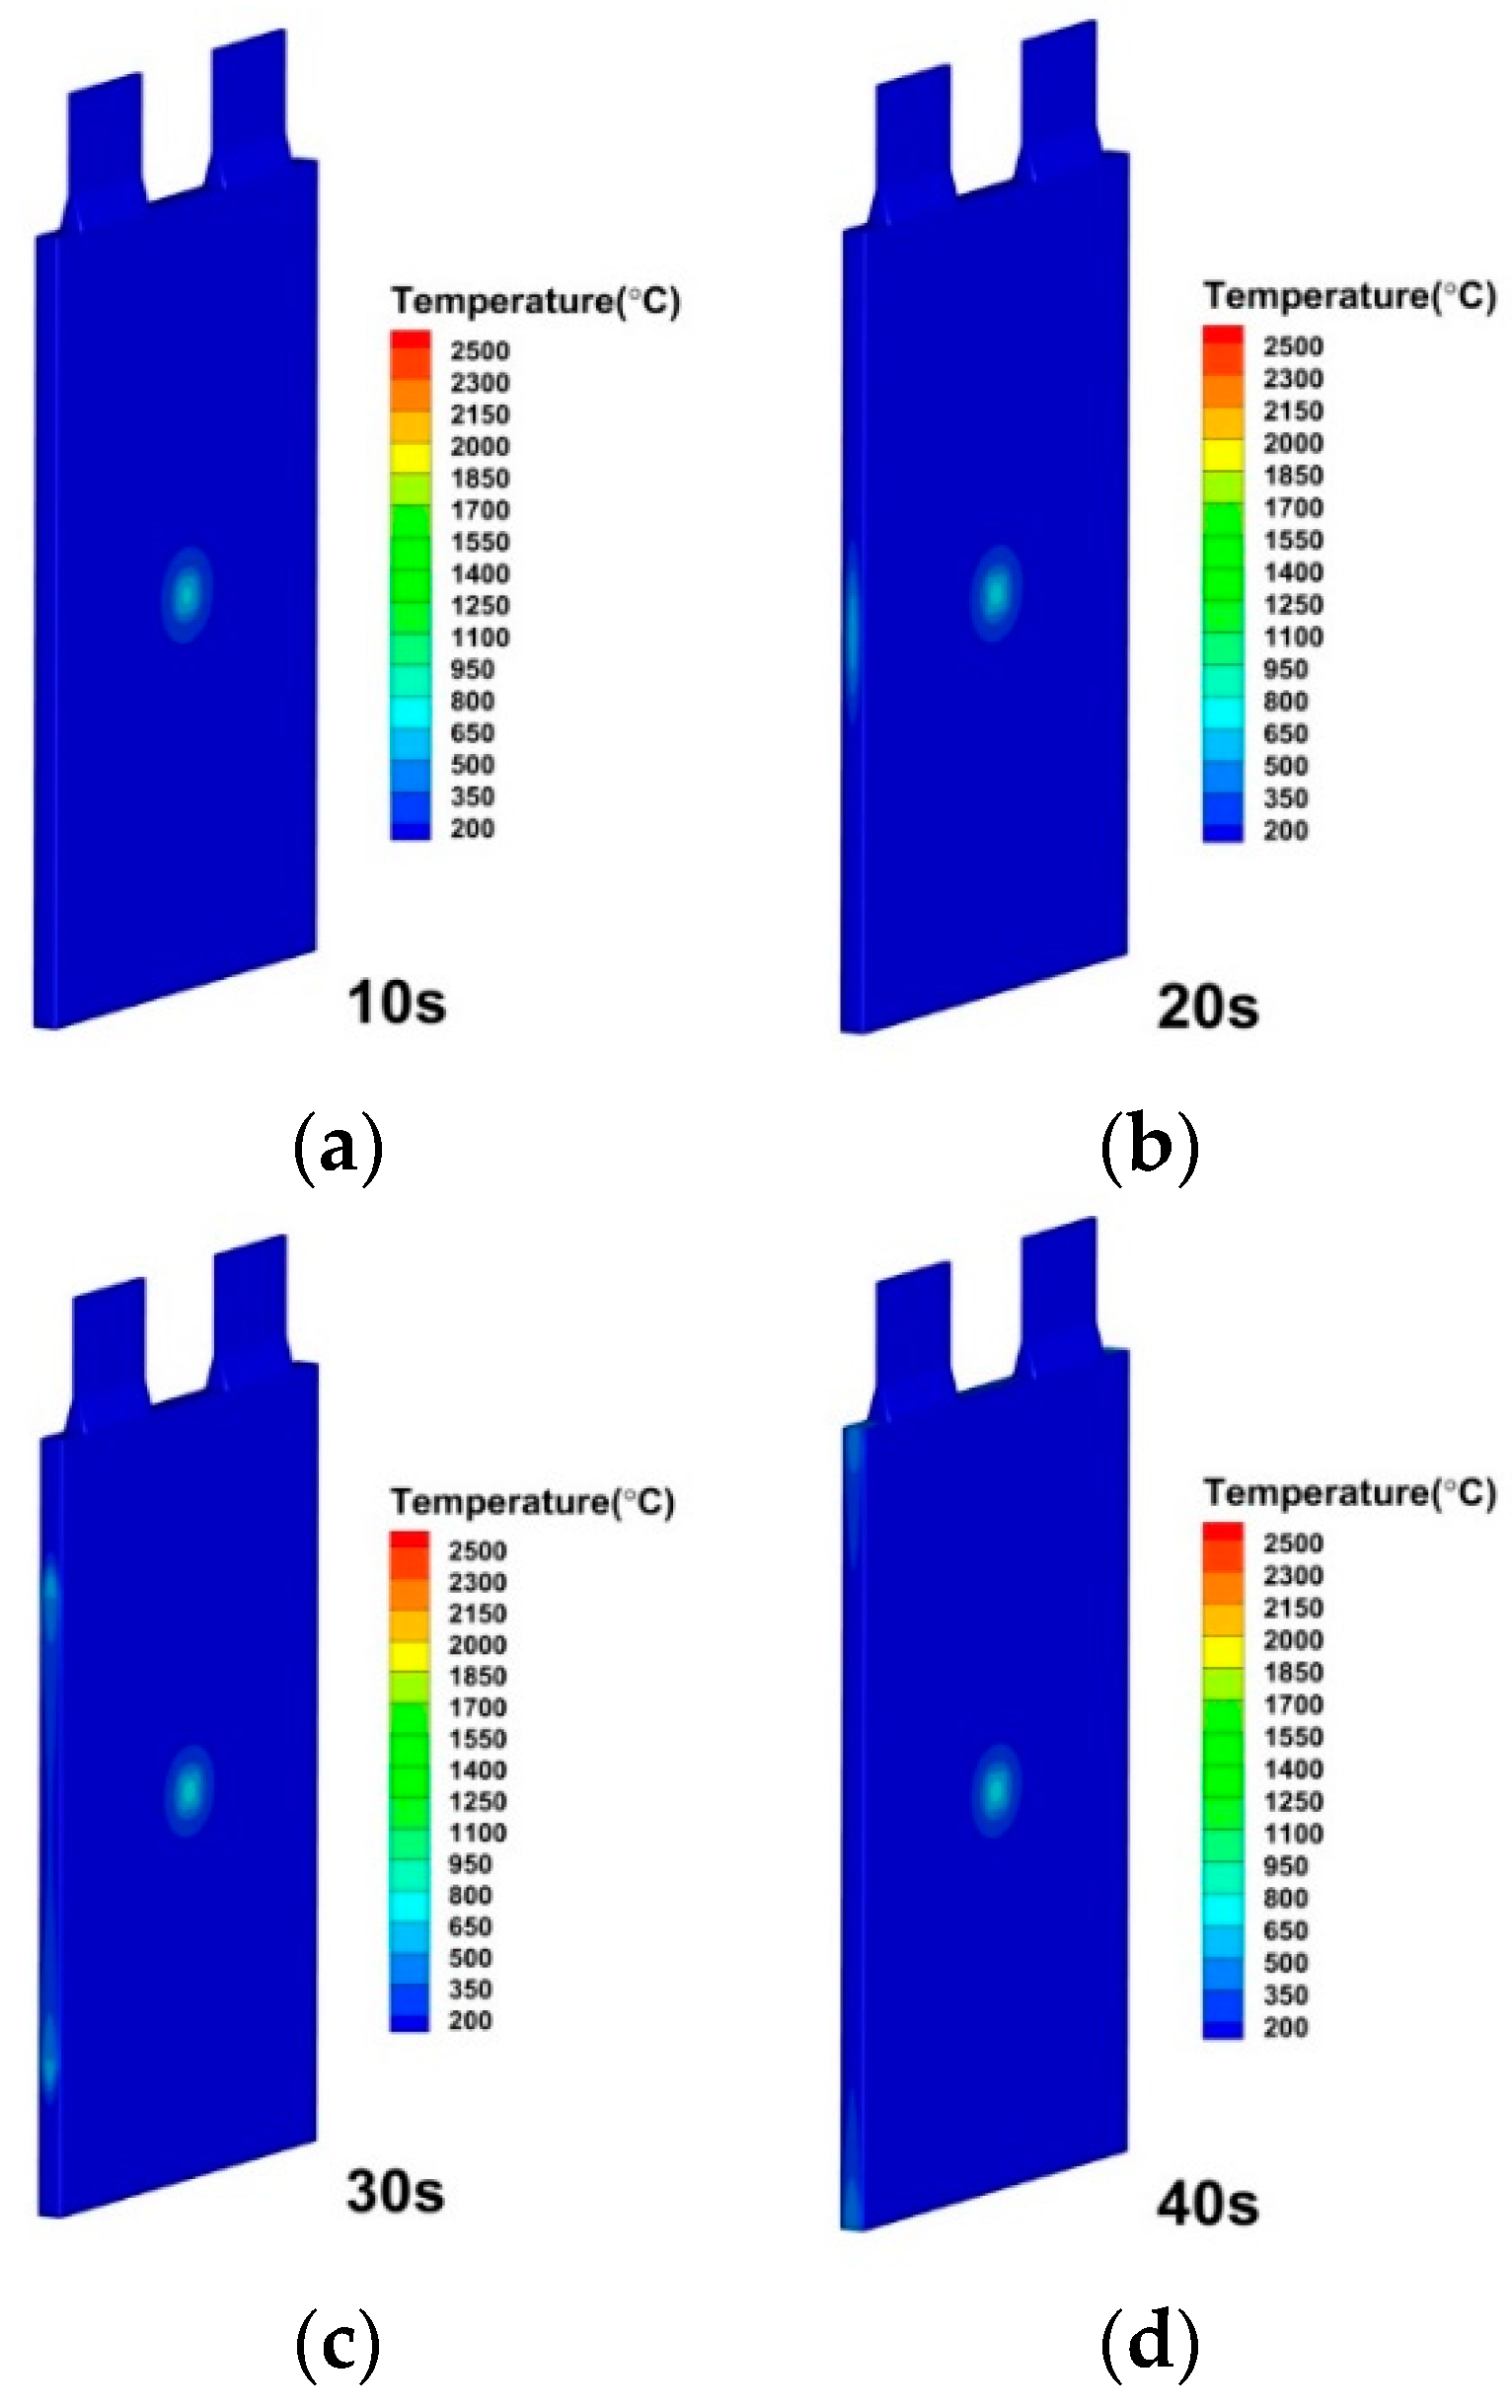
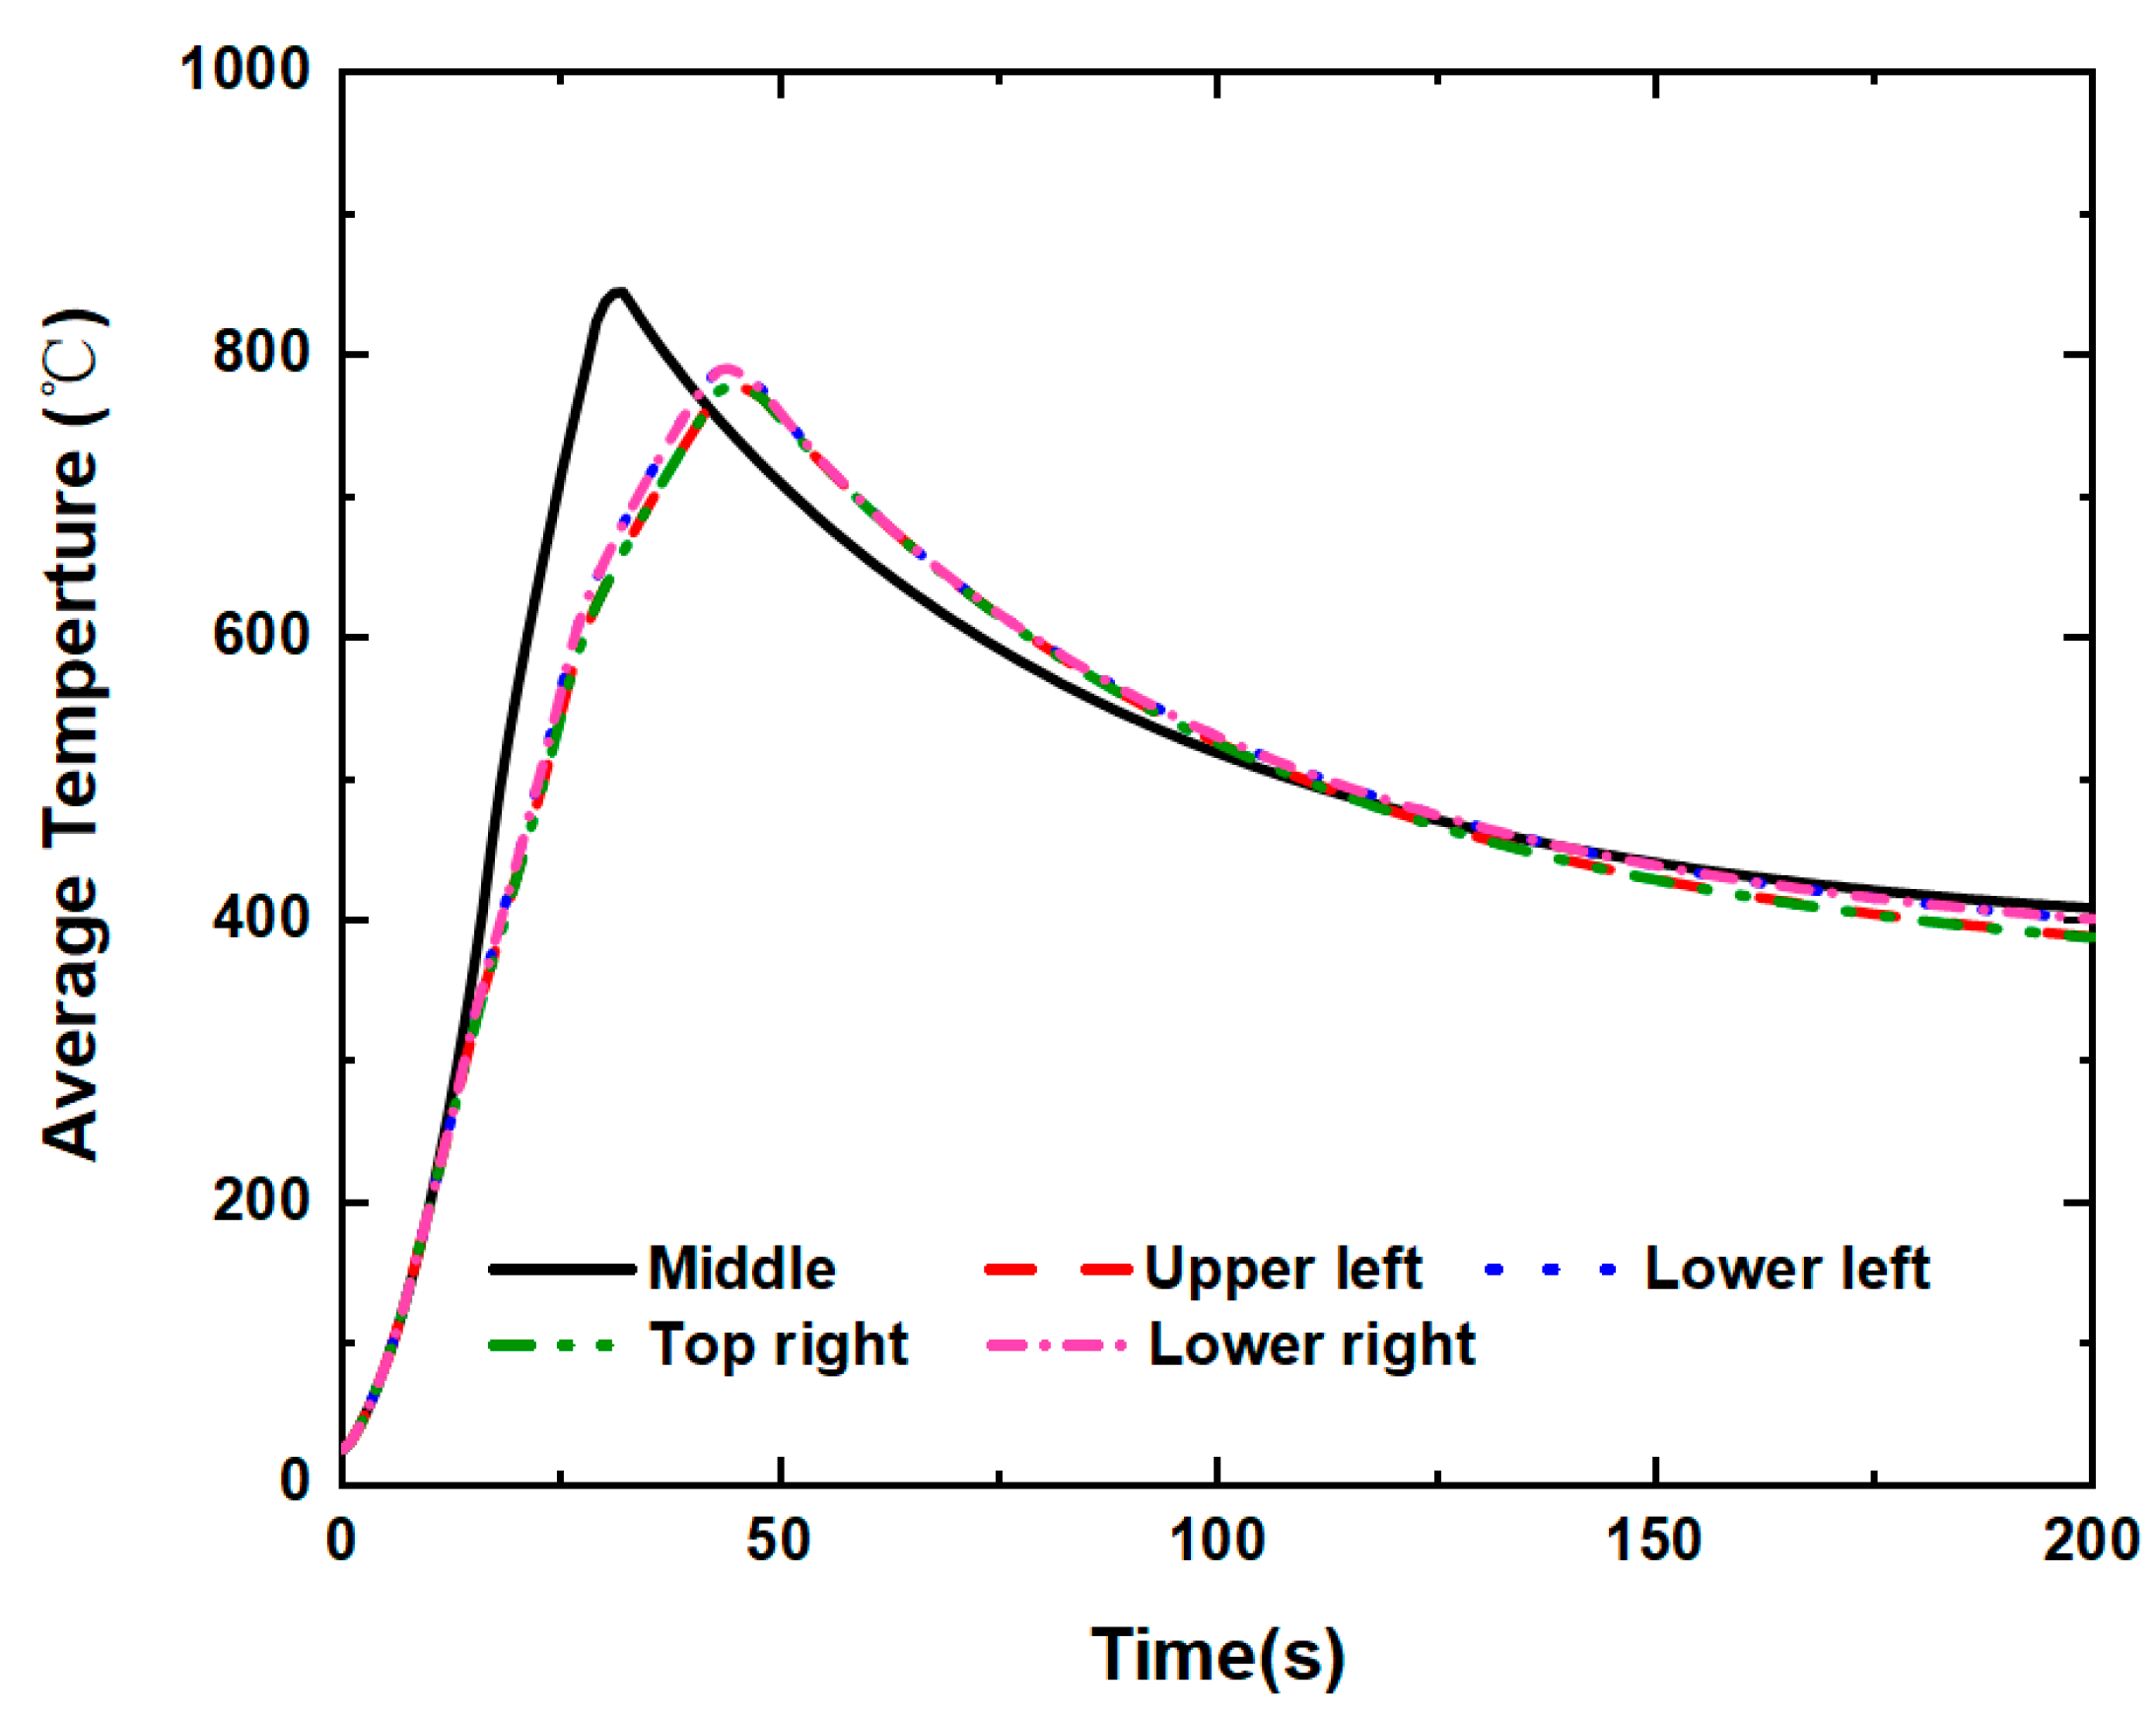
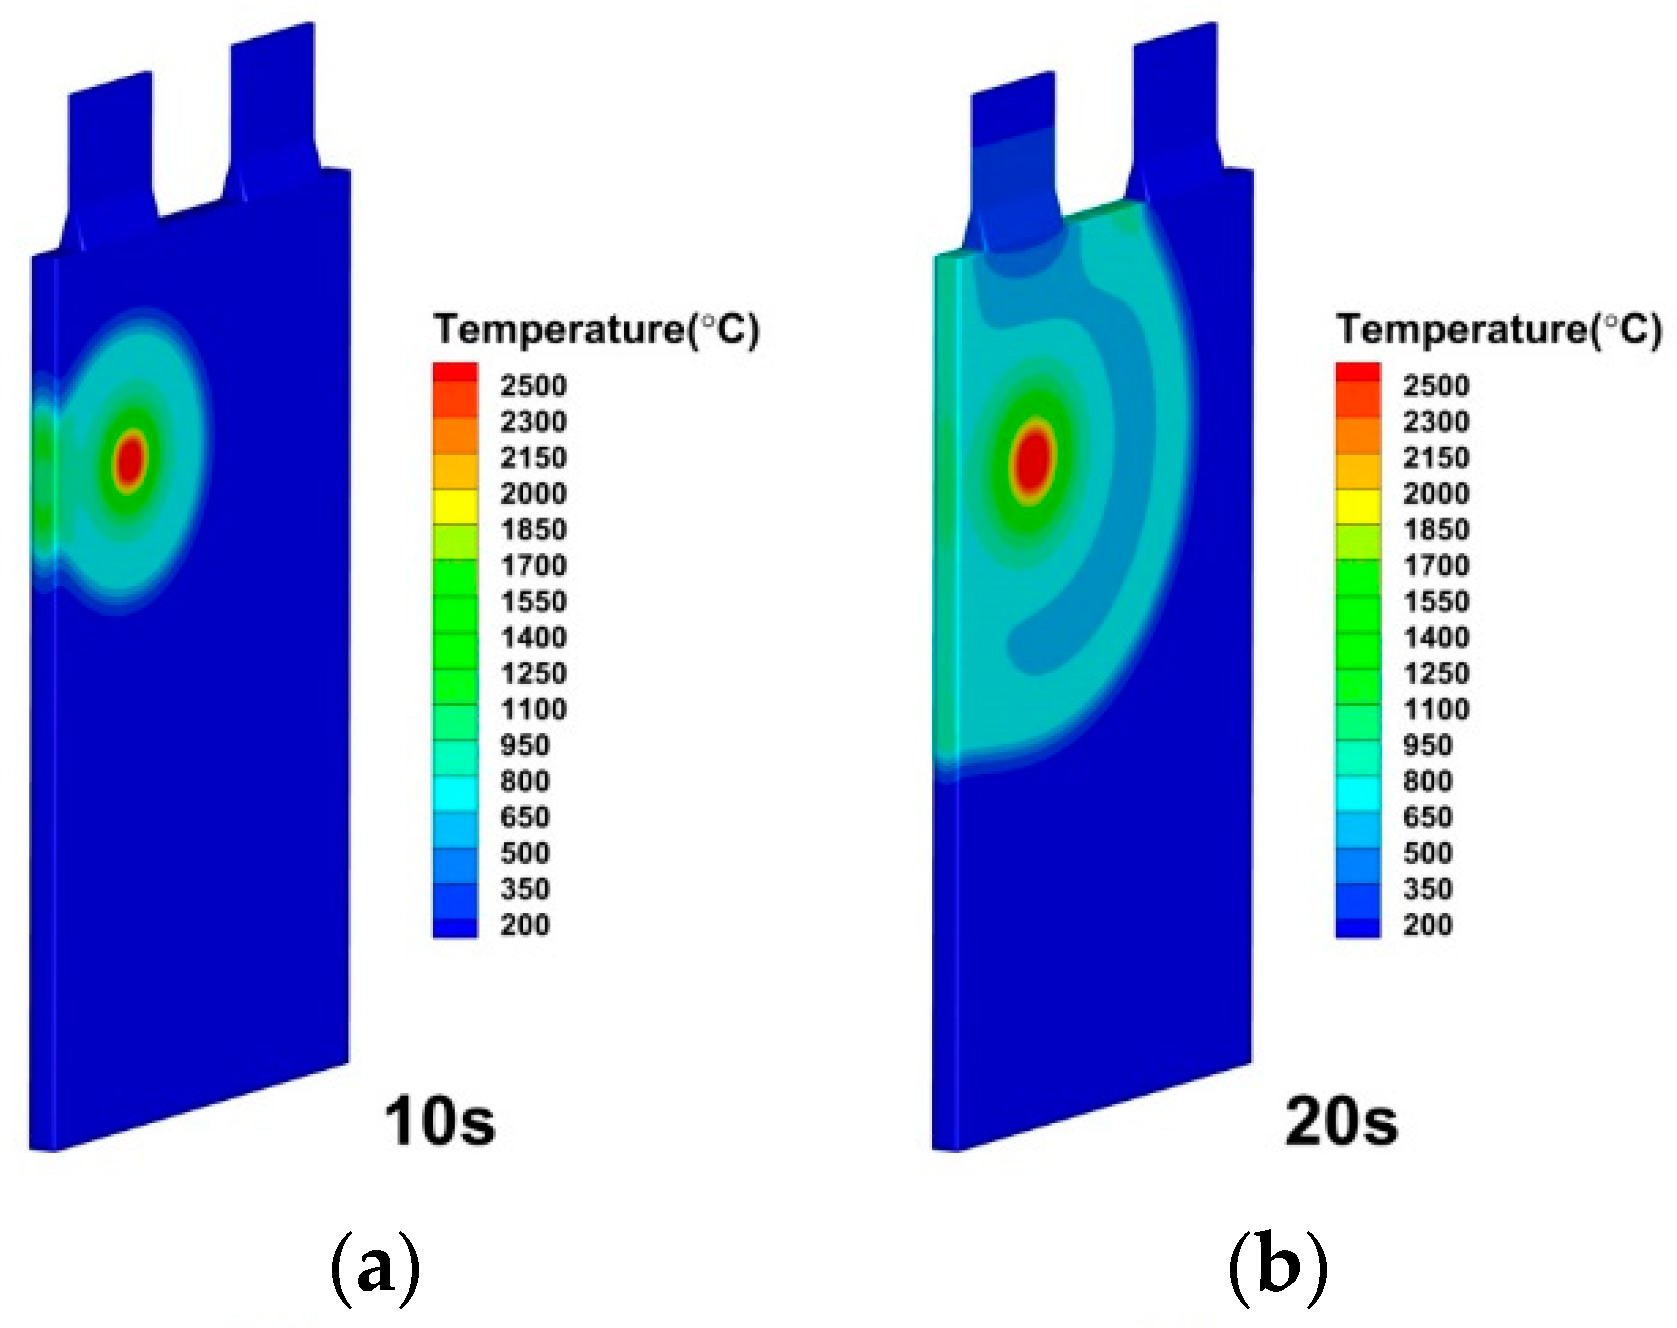
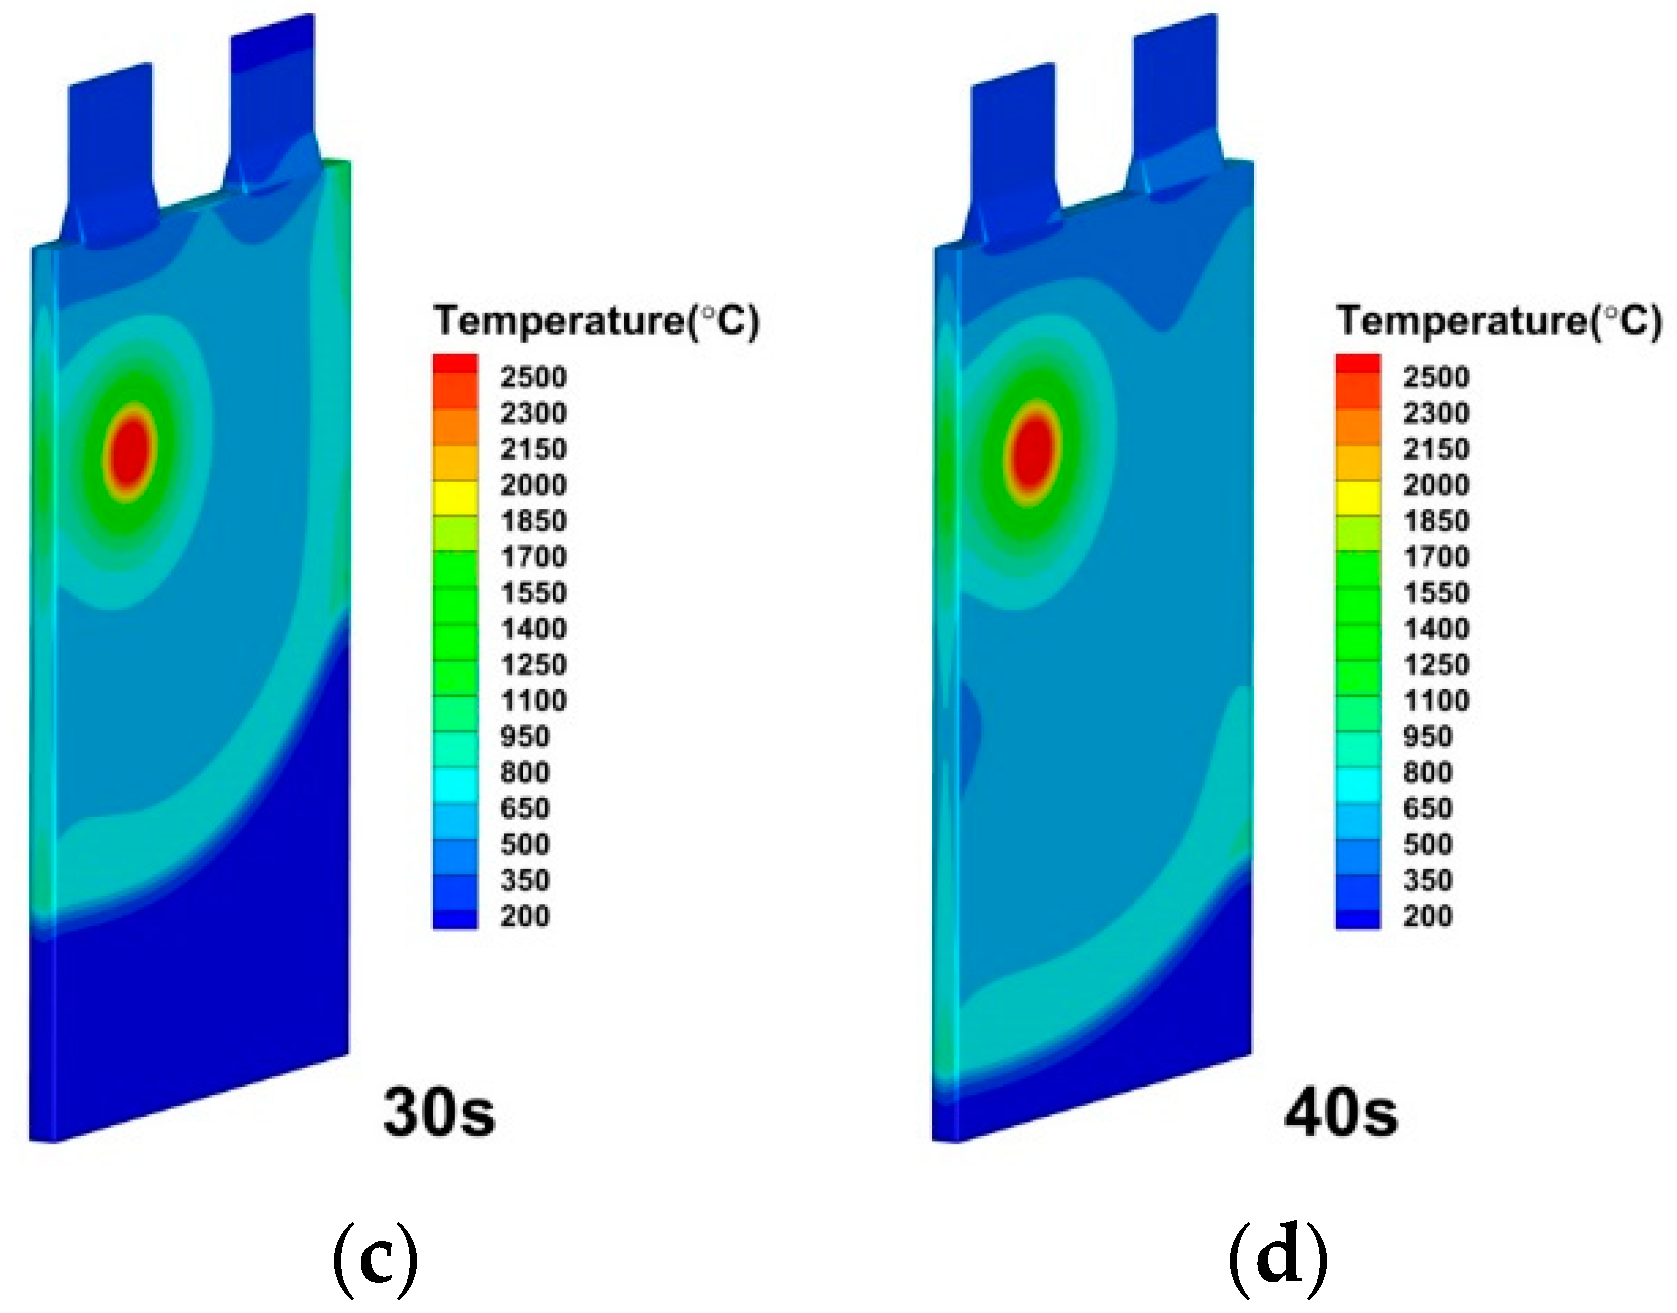
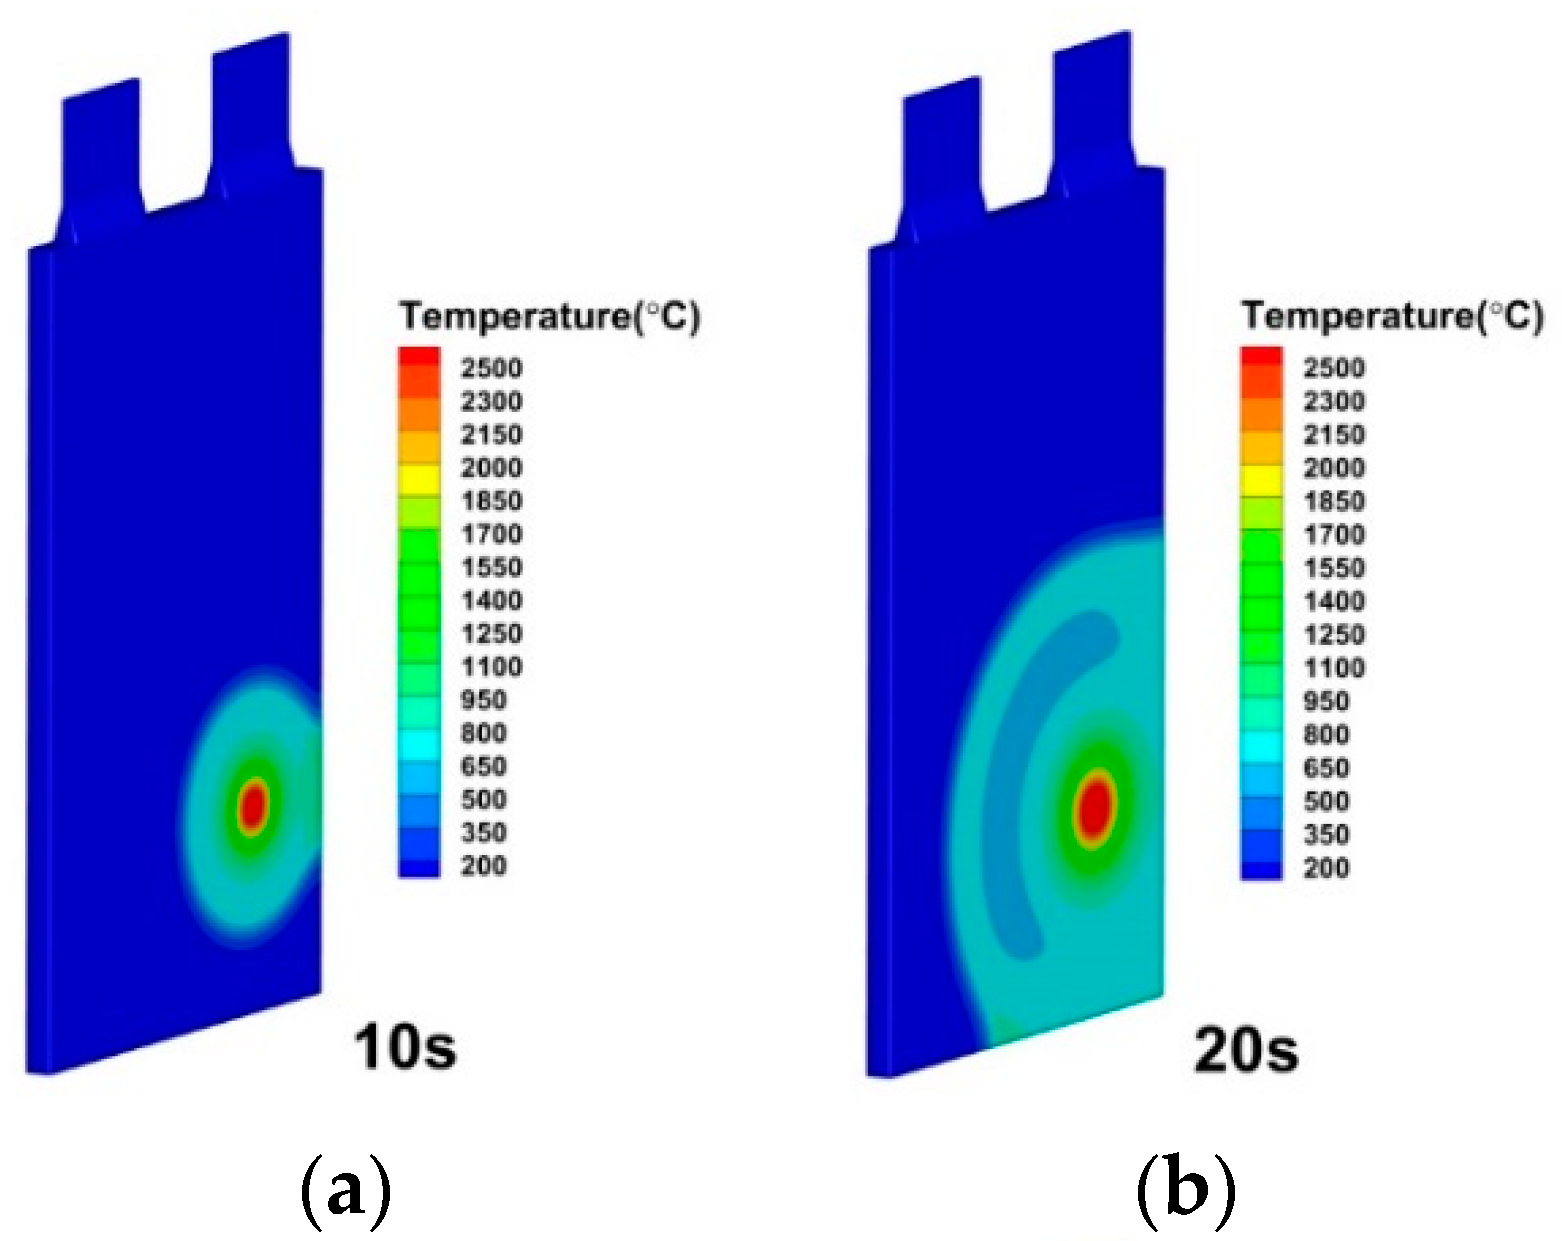
  • When the internal short circuit position changes, the average temperature of the batteries is almost the same. However, the average temperature in the middle of the internal shorting position is significantly greater than that in the other four positions. Thermal runaway will happen when the battery is acupunctured, regardless of which section of the battery is acupunctured. Yao Dan [52] considered that no matter where acupuncture occurs, the average temperature peak is similar and the fluctuation is weak, which resembles our results in this work.

Author Contributions

Investigation, X.L., H.H. and Z.H.; Formal analysis, Z.Z.; Methodology, Z.Z. and W.W.; Software, L.G. and Y.L. (Yang Li); Supervision, Y.L. (Yubai Li) and Y.S.; Writing—original draft, X.L.; Writing—review and editing, Z.Z., W.W., Y.L. (Yubai Li) and Y.S. All authors have read and agreed to the published version of the manuscript.

Funding

This research is funded by the National Natural Science Foundation of China (Grant No. 52106226, 51876027, 52176058) and the Fundamental Research Funds for the Central Universities, China (DUT20RC(3)095, DUT20JC21).

Institutional Review Board Statement

Not applicable.

Informed Consent Statement

Not applicable.

Data Availability Statement

Not applicable.

Conflicts of Interest

The authors declare no conflict of interest.

Abbreviations

Numerical Symbol Description.
V O C V Open circuit voltage
I Current
σ + Positive electrode effective conductivity
σ Anode effective conductivity
Φ + Positive phase potential
Φ Negative phase potential
j E C h Volumetric current transfer rate due to electrochemical reaction
q ˙ E C h Electrochemical reaction heat
j short Current transfer rate due to internal short circuit in battery
q ˙ short Heat generation rate due to internal short circuit in battery
q ˙ a b u s e Heat generated by thermal runaway reactions under thermal abuse
Q total Lithium-ion battery total capacity
Q r e f Lithium-ion battery reference capacity
V o l Volume

References

  1. Busch, C.; Jun, M.; Harvey, H.; Min, H. China’s Carbon Neutral Opportunity; Energy Innovation: Policy and Technology, LLC.: San Francisco, CA, USA, 2021. [Google Scholar]
  2. Tian, H. The world energy pattern has undergone profound changes. World Knowl. 2022, 9, 21–23. [Google Scholar]
  3. Zou, C.; Xiong, B.; Xue, H.; Zheng, D.; Ge, Z.; Wang, Y. The position and role of new energy in carbon neutralization. Pet. Explor. Dev. 2021, 48, 411–420. [Google Scholar] [CrossRef]
  4. Chen, Y.; Kang, Y.; Zhao, Y.; Wang, L.; Liu, J.; Li, Y.; Liang, Z.; He, X.; Li, X. A review of lithium-ion battery safety concerns: The issues, strategies, and testing standards. J. Energy Chem. 2021, 59, 83–99. [Google Scholar] [CrossRef]
  5. Lai, X. Mechanism, modeling, detection, and prevention of the internal short circuit in lithium-ion batteries: Recent advances and perspectives. Energy Storage Mater. 2021, 35, 470–499. [Google Scholar] [CrossRef]
  6. Zhang, G.; Wei, X.; Tang, X.; Zhu, J.; Chen, S.; Dai, H. Internal short circuit mechanisms, experimental approaches and detection methods of lithium-ion batteries for electric vehicles: A review. Renew. Sustain. Energy Rev. 2021, 141, 110790. [Google Scholar] [CrossRef]
  7. Fang, W.; Ramadass, P.; Zhang, Z. Study of internal short in a Li-ion cell-II. Numerical investigation using a 3D electrochemical-thermal model. J. Power Sources 2014, 248, 1090–1098. [Google Scholar] [CrossRef]
  8. Feng, X.; Fang, M.; He, X.; Ouyang, M.; Lu, L.; Wang, H. Thermal runaway features of large format prismatic lithium ion battery using extended volume accelerating rate calorimetry. J. Power Sources 2014, 255, 294–301. [Google Scholar] [CrossRef]
  9. Kim, G.; Pesaran, A.; Spotnitz, R. A threedimensional thermal abuse model for lithium-ion cells. J. Power Sources 2007, 170, 476–489. [Google Scholar] [CrossRef]
  10. MacNeil, D.D.; Dahn, J.R. Test of Reaction Kinetics Using Both Differential Scanning and Accelerating Rate Calorimetries as Applied to the Reaction of LixCoO2 in Non-aqueous Electrolyte. J. Phys. Chem. 2001, 105, 4430–4439. [Google Scholar] [CrossRef]
  11. Xu, M.; Zhang, Z.; Wang, X.; Jia, L.; Yang, L. A pseudo threedimensional electrochemicalthermal model of a prismatic LiFePO4 battery during discharge process. Energy 2015, 80, 303–317. [Google Scholar] [CrossRef]
  12. Bai, J.; Wang, Z.; Gao, T.; Bai, W.; Wang, J. Effect of mechanical extrusion force on thermal runaway of lithium-ion batteries caused by flat heating. J. Power Sources 2021, 507, 230305. [Google Scholar] [CrossRef]
  13. Santhanagopalan, S.; Ramadass, P.; Zhang, J.Z. Analysis of internal short-circuit in a lithium ion cell. J. Power Sources 2009, 194, 550–557. [Google Scholar] [CrossRef]
  14. Barré, A.; Deguilhem, B.; Grolleau, S.; Gérard, M.; Suard, F.; Riu, D. A review on lithiumion battery ageing mechanisms and estimations for automotive applications. J. Power Sources 2013, 241, 680–689. [Google Scholar] [CrossRef]
  15. Liu, B.; Jia, Y.; Yuan, C.; Wang, L.; Gao, X.; Yin, S. Safety issues and mechanisms of lithium-ion battery cell upon mechanical abusive loading: A review. Energy Storage Mater. 2020, 24, 85–112. [Google Scholar] [CrossRef]
  16. Kisters, T.; Sahraei, E.; Wierzbicki, T. Dynamic impact tests on lithium-ion cells. Int. J. Impact Eng. 2017, 108, 205–216. [Google Scholar] [CrossRef]
  17. Xu, J.; Liu, B.; Wang, L.; Shang, S. Dynamic mechanical integrity of cylindrical lithium-ion battery cell upon crushing. Eng. Fail. Anal. 2015, 53, 97–110. [Google Scholar] [CrossRef]
  18. Zhao, R.; Liu, J.; Gu, J. Simulation and experimental study on lithium ion battery short circuit. Appl. Energy 2016, 173, 29–39. [Google Scholar] [CrossRef]
  19. Coman, P.T.; Darcy, E.C.; Veje, C.T. Numerical analysis of heat propagation in a battery pack using a novel technology for triggering thermal runaway. Appl. Energy 2017, 203, 189–200. [Google Scholar] [CrossRef]
  20. Zhu, J.; Wierzbicki, T.; Li, W. A review of safety-focused mechanical modeling of commercial lithium-ion batteries. J. Power Sources 2018, 378, 153–168. [Google Scholar] [CrossRef]
  21. Shi, Y.; Noelle, D.J.; Wang, M.; Le, A.V.; Yoon, H.; Zhang, M.; Meng, Y.S. Exothermic behaviors of mechanically abused lithium-ion batteries with dibenzylamine. J. Power Sources 2016, 326, 514–521. [Google Scholar] [CrossRef]
  22. Jones, H.P.; Thomas, C.; Mahmod, T. Critical review of commercial secondary lithium-ion battery safety standards. Mak. Saf. Matter 2010, 680, 55. [Google Scholar]
  23. Cai, W.; Wang, H.; Maleki, H.; Howard, J.; Lara-Curzio, E. Experimental simulation of internal short circuit in Li-ion and Li-ion-polymer cells. J. Power Sources 2011, 196, 7779–7783. [Google Scholar] [CrossRef]
  24. Mao, B.; Chen, H.; Cui, Z.; Wu, T.; Wang, Q. Failure mechanism of the lithium ion battery during nail penetration. Int. J. Heat Mass Transf. 2018, 122, 1103–1115. [Google Scholar] [CrossRef]
  25. Finegan, D.P.; Tjaden, B.; Heenan, T.M.M.; Jervis, R.; Michiel, M.D.; Rack, A. Tracking Internal Temperature and Structural Dynamics during Nail Penetration of Lithium-Ion Cells. J. Electrochem. Soc. 2017, 164, A3285–A3291. [Google Scholar] [CrossRef]
  26. Orendorff, C.J.; Roth, E.P.; Nagasubramanian, G. Experimental triggers for internal short circuits in lithium-ion cells. J. Power Sources 2011, 196, 6554–6558. [Google Scholar] [CrossRef]
  27. Hyung, Y.; Mankame, A.; Rona, M.; Barnett, B.; Sriramulu, S. Factors that influence thermal runaway during a nail penetration test. In Electrochemical Society Meeting Abstracts; The Electrochemical Society, Inc.: Boston, MA, USA, 2011; Volume 220, p. 413. [Google Scholar]
  28. Zhang, M.; Du, J.; Liu, L.; Stefanopoulou, A.; Siegel, J.; Lu, L. Internal Short Circuit Trigger Method for Lithium-Ion Battery Based on Shape Memory Alloy. J. Electrochem. Soc. 2017, 164, A3038–A3044. [Google Scholar] [CrossRef]
  29. Ramadass, P.; Fang, W.; Zhang, Z.J. Study of internal short in a Li-ion cell I. Test method development using infra-red imaging technique. J. Power Sources 2014, 248, 769–776. [Google Scholar] [CrossRef]
  30. Huang, Z.; Li, H.; Mei, W.; Zhao, C.; Sun, J. Thermal Runaway Behavior of Lithium Iron Phosphate Battery During Penetration. Fire Technol. 2020, 56, 2405–2426. [Google Scholar] [CrossRef]
  31. Zavalis, T.G.; Behm, M.; Lindbergh, G. Investigation of short-circuit scenarios in a lithium-ion battery cell. J. Electrochem. Soc. 2012, 159, A848. [Google Scholar] [CrossRef]
  32. Zhao, W.; Luo, G.; Wang, C. Modeling Internal Shorting Process in Large-Format Li-Ion Cells. J. Electrochem. Soc. 2015, 162, A1352–A1364. [Google Scholar] [CrossRef]
  33. Zhao, W.; Luo, G.; Wang, C. Modeling Nail Penetration Process in Large-Format Li-Ion Cells. J. Electrochem. Soc. 2014, 162, A207–A217. [Google Scholar] [CrossRef]
  34. Wang, J.; Mei, W.; Cui, Z.; Shen, W.; Duan, Q.; Jin, Y. Experimental and numerical study on penetration-induced internal short-circuit of lithium-ion cell. Appl. Therm. Eng. 2020, 171, 115082. [Google Scholar] [CrossRef]
  35. Feng, X.; Lu, L.; Ouyang, M. A 3D thermal runaway propagation model for a large format lithium ion battery module. Energy 2016, 115, 194–208. [Google Scholar] [CrossRef]
  36. Zhang, M.; Liu, L.; Stefanopoulou, A.; Siegel, J.; Lu, L.; He, X. Fusing Phenomenon of Lithium-Ion Battery Internal Short Circuit. J. Electrochem. Soc. 2017, 164, A2738–A2745. [Google Scholar] [CrossRef]
  37. Yan, W.; Wang, Z.; Chen, S. Quantitative analysis on the heat transfer modes in the process of thermal runaway propagation in lithium-ion battery pack under confined and semi-confined space. Int. J. Heat Mass Transf. 2021, 176, 121483. [Google Scholar] [CrossRef]
  38. Zhang, M.; Ouyang, M.; Lu, L.; He, X.; Feng, X.; Liu, L. Battery Internal Short Circuit Detection. ECS Trans. 2017, 77, 217–223. [Google Scholar] [CrossRef]
  39. Hu, H.; Xu, X.; Sun, X.; Li, R.; Zhang, Y.; Fu, J. Numerical study on the inhibition control of lithium-ion battery thermal runaway. ACS Omega 2020, 5, 18254–18261. [Google Scholar] [CrossRef]
  40. Li, Y.; Zhou, Z.; Wu, W. Three-Dimensional Thermal Modeling of Internal Shorting Process in a 20Ah Lithium-Ion Polymer Battery. Energies 2020, 13, 1013. [Google Scholar] [CrossRef]
  41. Gomez, J.; Nelson, R.; Kalu, E.E. Equivalent circuit model parameters of a high-power Li-ion battery: Thermal and state of charge effects. J. Power Sources 2011, 196, 4826–4831. [Google Scholar] [CrossRef]
  42. Chiu, K.; Lin, C.; Yeh, S.; Lin, Y.; Chen, K. An electrochemical modeling of lithium-ion battery nail penetration. J. Power Sources 2014, 251, 254–263. [Google Scholar] [CrossRef]
  43. Ren, D.; Feng, X.; Liu, L.; Hsu, H.; Lu, L.; Wang, L.; Ouyang, M. Investigating the relationship between internal short circuit and thermal runaway of lithium-ion batteries under thermal abuse condition. Energy Storage Mater. 2021, 34, 563–573. [Google Scholar] [CrossRef]
  44. Kwak, E.; Kim, J.H.; Hong, S.H.; Oh, K.Y. Detailed modeling investigation of thermal runaway pathways of a lithium iron phosphate battery. Int. J. Energy Res. 2022, 46, 1146–1167. [Google Scholar] [CrossRef]
  45. Zhang, Y.; Mei, W.; Qin, P.; Duan, Q.; Wang, Q. Numerical modeling on thermal runaway triggered by local overheating for lithium iron phosphate battery. Appl. Therm. Eng. 2021, 192, 116928. [Google Scholar] [CrossRef]
  46. Xu, J.; Lan, C.; Qiao, Y.; Ma, Y. Prevent thermal runaway of lithium-ion batteries with minichannel cooling. Appl. Therm. Eng. 2017, 110, 883–890. [Google Scholar] [CrossRef]
  47. Kim, U.S. Effect of electrode configuration on the thermal behavior of a lithium-polymer battery. J. Power Sources 2008, 180, 909–916. [Google Scholar] [CrossRef]
  48. Kim, U.S. Modeling the Dependence of the Discharge Behavior of a Lithium-Ion Battery on the Environmental Temperature. J. Electrochem. Soc. 2011, 158, A611–A618. [Google Scholar]
  49. Taheri, P.; Bahrami, M. Temperature Rise in Prismatic Polymer Lithium-Ion Batteries: An Analytic Approach. SAE Int. J. Passeng. Cars-Electron. Electr. Syst. 2012, 5, 164–176. [Google Scholar] [CrossRef]
  50. Lopez, C.F.; Jeevarajan, J.A.; Mukherjee, P.P. Characterization of Lithium-Ion Battery Thermal Abuse Behavior Using Experimental and Computational Analysis. J. Electrochem. Soc. 2015, 162, A2163–A2173. [Google Scholar] [CrossRef]
  51. Finegan, D.P.; Darcy, E.; Keyser, M.; Tjaden, B.; Heenan, T.M. Characterising thermal runaway within lithium-ion cells by inducing and monitoring internal short circuits. Energy Environ. Sci. 2017, 10, 1377–1388. [Google Scholar] [CrossRef]
  52. Dan, Y. Numerical Simulation and Risk Control of Thermal Runaway of Ternary Lithium Battery. Master’s Thesis, Xi’an University of Architecture and Technology, Xi’an, China, 2021. [Google Scholar] [CrossRef]
Figure 1. (a) Equivalent electrical circuit; (b) Geometry; (c) Mesh of multi-scale multi-domain lithium-ion battery modeling.
Energies 15 06868 g001
Figure 2. (a) Geometric; (b) Mesh of the internal short circuit lithium-ion battery modeling.
Energies 15 06868 g002
Figure 3. (a) Flow chart of the model [40]; (b) schematic diagram of the coupled model.
Energies 15 06868 g003
Figure 4. (ad) are the upper left, lower left, upper right, and lower right position internal short circuit of the lithium-ion battery.
Energies 15 06868 g004
Figure 5. Comparison of the results from basic model with those from Finegan, D.P. et al. [51].
Energies 15 06868 g005
Figure 6. Under different internal short circuit areas, average temperature of the lithium-ion battery.
Energies 15 06868 g006
Figure 7. Temperature distributions of lithium-ion battery under internal short circuit area by 2 mm × 2 mm at (a) 10 s; (b) 20 s; (c) 30 s; (d) 40 s.
Energies 15 06868 g007
Figure 8. Temperature distributions of lithium-ion battery under internal short circuit area by 10 mm × 10 mm at (a) 10 s; (b) 20 s; (c) 30 s; (d) 40 s.
Energies 15 06868 g008
Figure 9. Under different internal short circuit resistances, average temperature of the lithium-ion battery.
Energies 15 06868 g009
Figure 10. Temperature distributions of lithium-ion battery under internal short circuit resistance by 0.005 Ω at (a) 10 s; (b) 20 s; (c) 30 s; (d) 40 s.
Energies 15 06868 g010
Figure 11. Temperature distributions of lithium-ion battery under internal short circuit resistance by 0.03 Ω at (a) 10 s; (b) 20 s; (c) 30 s; (d) 40 s.
Energies 15 06868 g011
Figure 12. Under different internal short circuit penetration depth, average temperature of the lithium-ion battery.
Energies 15 06868 g012
Figure 13. Temperature distributions of lithium-ion battery under internal short circuit penetration depth by 25% at (a) 10 s; (b) 20 s; (c) 30 s; (d) 40 s.
Energies 15 06868 g013
Figure 14. Temperature distributions of lithium-ion battery under internal short circuit penetration depth by 100% at (a) 10 s; (b) 20 s; (c) 30 s; (d) 40 s.
Energies 15 06868 g014
Figure 15. Under convective heat transfer coefficient, average temperature of the lithium-ion battery.
Energies 15 06868 g015
Figure 16. Temperature distributions of lithium-ion battery under convective heat transfer coefficient by 100 W/(m2·K) at (a) 10 s; (b) 20 s; (c) 30 s; (d) 40 s.
Energies 15 06868 g016
Figure 17. Temperature distributions of lithium-ion battery under convective heat transfer coefficient by 200 W/(m2·K) at (a) 10 s; (b) 20 s; (c) 30 s; (d) 40 s.
Energies 15 06868 g017
Figure 18. Temperature distributions of lithium-ion battery under convective heat transfer coefficient by 500 W/(m2·K) at (a) 10 s; (b) 20 s; (c) 30 s; (d) 40 s.
Energies 15 06868 g018aEnergies 15 06868 g018b
Figure 19. Temperature distributions of lithium-ion battery under convective heat transfer coefficient by 2000 W/(m2·K) at (a) 10 s; (b) 20 s; (c) 30 s; (d) 40 s.
Energies 15 06868 g019
Figure 20. Under internal short circuit positions, average temperature of the lithium-ion battery.
Energies 15 06868 g020
Figure 21. Temperature distributions of lithium-ion battery under internal short circuit position by higher left at (a) 10 s; (b) 20 s; (c) 30 s; (d) 40 s.
Energies 15 06868 g021aEnergies 15 06868 g021b
Figure 22. Temperature distributions of lithium-ion battery under internal short circuit position by lower left at (a) 10 s; (b) 20 s; (c) 30 s; (d) 40 s.
Energies 15 06868 g022
Figure 23. Temperature distributions of lithium-ion battery under internal short circuit position by higher right at (a) 10 s; (b) 20 s; (c) 30 s; (d) 40 s.
Energies 15 06868 g023
Figure 24. Temperature distributions of lithium-ion battery under internal short circuit position by lower right at (a) 10 s; (b) 20 s; (c) 30 s; (d) 40 s.
Energies 15 06868 g024aEnergies 15 06868 g024b
Table 1. Physical and kinetic parameters and initial values for thermal runaway model obtained from Refs [42,43,44,45,46].
SymbolValueDescription
H s e i 2.57 × 10 5 ( J / kg ) SEI-decomposition heat release
W s e i 6.104 × 10 2 ( kg / m 3 ) Specific carbon content in jellyroll
A s e i 1.667 × 10 15 ( 1 / s ) SEI-decomposition frequency factor
E s e i 1.3508 × 10 5 ( J / mol ) SEI-decomposition activation energy
H n e 1.714 × 10 6 ( J / kg ) Negative-electrolyte heat release
W n e 6.104 × 10 2 ( kg / m 3 ) Specific carbon content in jellyroll
A n e 2.5 × 10 13 ( 1 / s ) Negative-electrolyte frequency factor
E n e 1.3508 × 10 5 ( J / mol ) Negative-electrolyte activation energy
H p e 3.14 × 10 5 ( J / kg ) Positive-electrolyte heat release
W p e 1.438 × 10 3 ( kg / m 3 ) Specific positive active content in jellyroll
A p e 6.667 × 10 13 ( 1 / s ) Positive-electrolyte frequency factor
E p e 1.396 × 10 5 ( J / mol ) Positive-electrolyte activation energy
H e 1.55 × 10 5 ( J / kg ) Electrolyte decomposition heat release
W e 4.069 × 10 2 ( kg / m 3 ) Specific electrolyte content in jellyroll
A e 5.14 × 10 25 ( 1 / s ) Electrolyte decomposition frequency factor
E e 2.74 × 10 5 ( J / mol ) Electrolyte decomposition activation energy
c n e g , 0 0.15Initial value
c n e g 0.75Initial value
m s e i 1Initial value
c s e i 0 0.15Initial value
m n e 1Initial value
t s e i 0.033Initial value
m e 1Initial value
c e 0 1Initial value
m p e 1 1Initial value
Table 2. Physical properties for the lithium-ion battery cell [47,48].
ρ (kg/m3)c (J/kg/K) k i n p l a n e (W/m/K) k t h r o u g h p l a n e (W/m/K) σ + (S/m) σ + (S/m)
209267818.50.51.19 × 1069.83 × 105
Publisher’s Note: MDPI stays neutral with regard to jurisdictional claims in published maps and institutional affiliations.

