Abstract
Increasingly stringent pollutant emission limits and CO2 reduction policies are forcing the automotive industry toward cleaner and decarbonized mobility. The goal is to achieve carbon neutrality within 2050 and limit global warming to 2 °C (possibly 1.5 °C) with respect to pre-industrial levels as stated in both the European Green Deal and the Paris Agreement and further reiterated at the COP26. With the aim of simultaneously reducing both pollutants and CO2 emissions, a large amount of research is currently carried out on low-temperature highly efficient combustions (LTC). Among these advanced combustions, one of the most promising is Gasoline Compression Ignition (GCI), based on the spontaneous ignition of a gasoline-like fuel. Nevertheless, despite GCI proving to be effective in reducing both pollutants and CO2 emissions, GCI combustion controllability represents the main challenge that hinders the diffusion of this methodology for transportation. Several works in the literature demonstrated that to properly control GCI combustion, a multiple injections strategy is needed. The rise of pressure and temperature generated by the spontaneous ignition of small amounts of early-injected fuel reduces the ignition delay of the following main injection, responsible for the torque production of the engine. Since the combustion of the pre-injections is chemically driven, the ignition delay might be strongly affected by a slight variation in the engine control parameters and, consequently, lead to misfire or knocking. The goal of this work was to develop a control-oriented ignition delay model suitable to improve the GCI combustion stability through the proper management of the pilot injections. After a thorough analysis of the quantities affecting the ignition delay, this quantity was modeled as a function of both a thermodynamic and a chemical–physical index. The comparison between the measured and modeled ignition delay shows an accuracy compatible with the requirements for control purposes (the average root mean squared error between the measured and estimated start of combustion is close to 1.3 deg), over a wide range of operating conditions. As a result, the presented approach proved to be appropriate for the development of a model-based feed-forward contribution for a closed-loop combustion control strategy.
1. Introduction
Increasingly stringent emission regulations, together with more demanding testing procedures and the increase in greenhouse gas concentrations in the atmosphere are driving the automotive industry toward a cleaner and decarbonized way of transportation with an always higher level of powertrain electrification. Battery Electric Vehicles (BEVs) [1] and Fuel Cell Electric Vehicles (FCEVs) [2] are considered the most promising technical solutions to achieve the target fixed at the COP26 conference [3]. However, their wide diffusion is still hindered by high costs per mile and long refueling times compared to the standard technologies for passenger cars. Therefore, over the last few years, the research community has focused on the development of innovative combustion methodologies, commonly named Low-Temperature Combustions (LTCs), based on internal combustion engines (ICE) and aimed at obtaining hybrid powertrains with high efficiency and low pollutants. Typically based on compression ignition engines, LTCs are characterized by high thermal efficiency and low engine-out emissions (especially NOx and particulate matter). However, since LTCs are based on the auto-ignition of a lean air–fuel mixture, the management of the combustion process represents the main barrier that hindered the diffusion of such methodologies for industrial applications.
Characterized by the spontaneous ignition of a fully homogeneous lean air–fuel mixture, the most studied LTC is Homogeneous Charge Compression Ignition (HCCI) combustion [4]. Despite the great potential of running HCCI in very lean conditions on pollutants and fuel consumption reduction, the high sensitivity to slight variations of the cylinder thermal conditions (which might lead to both misfire and heavy knock) limits its applicability to a very small operating range [5,6,7]. One of the most suitable approaches to overcome HCCI limitations is Gasoline Compression Ignition combustion (GCI) [8,9], which is promoted using a properly calibrated sequence of high-pressure direct injections. Furthermore, unthrottled conditions and a very lean air–fuel mixture, typically with low reactivity fuels, are responsible for the remarkable reductions in pollutants and fuel consumption running GCI compared to conventional diesel combustion (CDC).
In GCI combustion, through a multiple-injection pattern with pilot and main injections, the combustion process can be managed to obtain a smooth and reliable energy release. Since GCI is a compression-ignited process, the heat released by the small amount of fuel introduced with pilot injections plays a crucial role in the whole combustion management. As a matter of fact, the rise of in-cylinder pressure and temperature generated by the fuel injected with pilot injections strongly affects the auto-ignition mechanisms, reducing the ignition delay of the following injection, which burns in less homogeneous conditions, thus generating smoother combustion [10,11]. Many works have shown that the wrong positioning and dosing of pilot injections could compromise GCI combustion stability [12,13,14]. Therefore, the design of the injection pattern (especially pilot injections) plays a key role to maximize the benefits of this LTC methodology over a wide range of operating conditions.
Despite GCI usually being operated with a number of injections very similar to CDC, the longer ignition delay (ID) of low reactivity fuels (compared to diesel) might lead to a very retarded ignition of the first injection, especially when GCI is run in cold operating conditions, compromising efficiency and stability of the whole combustion process. Many works in the literature show that it is possible to guarantee GCI stability in a wide operating range through a proper calibration (fuel-injected and angular position) of the pilot injections [13]. Though effective, this approach is characterized by high costs, mainly because it requires a huge experimental activity, testing GCI (over its whole operating range) in very different conditions. Furthermore, an experimental approach can not guarantee a good estimation accuracy when the engine operates far from the calibration conditions. As a result, to improve the performance of the control strategies and reduce the costs of engine calibration, model-based approaches are considered the most effective methodologies. Several works proposed an ID model-based estimation based on an empirical mapping of the Arrhenius equation’s parameters [15,16,17]. However, the use of empirically determined Arrhenius parameters does not ensure the general validity of the approach, mainly because the ID depends on the local quality of the heterogeneous charge which characterizes GCI combustion.
This work presents a model-based ID model aimed at improving the performance and controllability of GCI combustion. With the purpose of developing the ID model, a standard 1.3 L light-duty turbocharged diesel engine was modified to run GCI combustion, and experimental tests were carried out to investigate the effect of the main control parameters on ID. The whole experimental campaign was conducted performing a specifically developed testing methodology called “Switching pattern” [18], aimed at highlighting the ignition dynamics of the first GCI combustion stage (the chemically driven combustion phase). Based on the results coming from the ID sensitivity analysis, two key parameters, named and , were developed. Such parameters, which can be determined using the information coming from standard sensors already present onboard (no additional hardware cost), summarize the chemical–physical and thermodynamic properties of the air–fuel mixture which have an impact on ID. Then, using the results coming from the switching pattern tests, the ID estimation model was calibrated and validated cycle-by-cycle showing good accordance with the measured ID in very different engine conditions. Since the presented model can be easily calibrated and implemented in an ECU (compared to standard approaches based on the Arrhenius equation) and, in addition, all its inputs depend on quantities that can be directly measured onboard, this approach represents an effective feed-forward contribution for a GCI controller aimed at the improvement of combustion stability.
2. Experimental Layout
The experimental activity was performed on a 1.3 L, 4-cylinder, turbocharged, compression ignited engine installed in a test cell. The main technical characteristics of the engine under study are summarized in Table 1.

Table 1.
Engine technical characteristics.
In order to perform the GCI combustion, multiple injections of low-reactivity fuel were applied by means of the standard Common-Rail Multi-Jet high-pressure system with 4 solenoid injectors (center-mounted, one for each cylinder) fueled with commercial RON95 gasoline. By using this system, it is possible to accurately control the GCI combustion process through two pilot injections (very small quantities, approximately 1 or 2 mg/stroke) followed by the main injection. The engine is also equipped with a variable geometry turbine actuator (VGT), suitable to manage the intake pressure, and a high-pressure exhaust gas recirculation (EGR) system, which recirculates exhaust gas to the intake manifold. Many works report that to maximize the benefits of GCI in terms of NOx and particulate matter reduction, high EGR rates are mandatory [8,9,19]. Unfortunately, the EGR strongly affects the ID, mainly because of its different chemical composition and temperature. As a result, this effect needs to be properly compensated (typically correcting the injection strategies) to avoid compromising combustion stability. To properly characterize the impact of exhaust gas recirculation on the ignition delay, different EGR rates were tested.
As reported in the literature [12,20], GCI combustion needs high boost pressure and intake temperature to promote gasoline autoignition. This aspect becomes crucial, especially during cranking, idle or at low loads when the exhaust gas energy is not enough to drive the turbocharger to reach the target value of boost pressure. To overcome these limitations, a roots blower (S/C, Eaton Compressor M24) was added (upstream of the dynamic compressor) to the intake line of the engine. The volumetric compressor, driven by an electric motor (5.5 kW and maximum rotational speed equal to 3000 rpm), was controlled by the engine control unit (ECU) to guarantee the gasoline autoignition even during the cranking phase of the engine. Once the engine overcomes the cranking stage or the engine load is high enough to target the boost pressure through the centrifugal compressor, the external supercharger is switched off and bypassed. Consequently, the boost pressure can be directly controlled with the VGT, replacing the standard layout of the engine. Since the intake temperature also plays a crucial role in GCI combustion stability, to properly control the intake air temperature in any engine operating condition, a diathermic oil thermoregulation unit (TEMPCO T-REG HCE 609/15-O) was installed in the intake line of the engine (between the centrifugal compressor and the intake manifold). Figure 1 shows the integration of these two components and the complete experimental setup of the engine in the test cell.
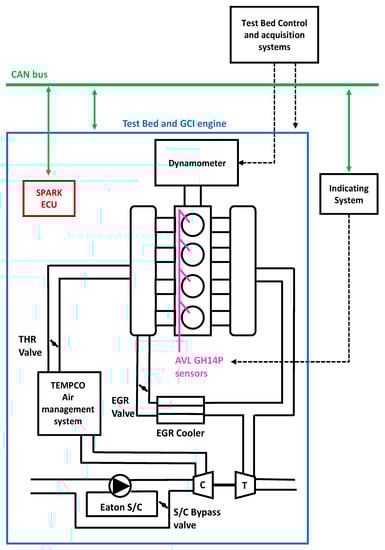
Figure 1.
Scheme of the developed GCI engine and control system layout.
To guarantee maximum flexibility in the management of the entire engine (combustion and actuators), the production ECU was replaced by a fully programmable ECU (SPARK by Alma Automotive). Based on National Instruments hardware and programmable via LabView software, such an open ECU has allowed the development of the control strategies to manage the GCI combustion overcoming the limitations that usually occur when a production ECU with standard control software is used. To monitor the engine behavior, standard sensors were acquired by the ECU and all the actuators (i.e., VGT, injectors, high-pressure pump, EGR) were managed following the implemented strategies. Furthermore, since the aim of this work is to study the ignition mechanism of a GCI combustion in depth, 4 in-cylinder pressure sensors (AVL GH14P), one per cylinder, were installed, acquired at 200 kHz, and real-time analyzed by the indicating system. At 2000 rpm, the mentioned sampling frequency corresponds to an angular distance between the samples approximately equal to 0.34 degrees. As will be widely discussed in the following section, such angular resolution leads to a very accurate start of combustion (SOC) detection. Moreover, through the analysis of the combustion process, the main combustion indexes such as IMEP, CA50, and pressure peak location, were calculated (by the indicating system) and sent in real-time to the ECU via CAN bus, running specific closed-loop combustion control strategies (combustion controllers) suitable to operate the engine at a target of the center of combustion and load. The global management of the engine test cell, such as eddy-current brake control, test cell environmental conditions monitoring, additional engine-mounted sensors acquisition and logging, was performed by the test bench system controller which communicates via CAN bus with both the engine ECU and indicating system improving the testing operations and safety. Figure 1 also shows the control systems and test cell communication layout developed to test GCI combustion.
3. Ignition Delay Analysis for GCI Combustion
As explained in the previous section of the paper, GCI combustion can be controlled through a properly calibrated injection strategy. A multiple injection pattern, composed of at least three injections: two pilots and one main, proved to be effective in stabilizing both gasoline auto-ignition and combustion (torque and CA50). Many works in the literature discuss the key role of the combustion of the pre-injections which shortens the ignition delay of the following main injection (that burns during its injection, in a partially premixed way) resulting in a rise in pressure and temperature. As a result, once a reference set of injection parameters is defined, an accurate prediction of the angular position at which the fuel introduced with the first injection will start burning (ID model) would be very helpful to correct the base injection strategy when the operating condition is far from the reference (different environmental conditions, coolant/oil temperatures, …), the goal being to guarantee combustion stability. To study the ignition dynamics of a lean air–fuel mixture in detail, a specifically developed engine control strategy, called “Switching Pattern”, was run to quantify the ID of the first combustion stage (chemically driven) without chemical or physical interactions generated by the amount of fuel injected through the main injection pulse. Through the analysis of the in-cylinder pressure signals in different engine conditions (e.g., fuel pressure, intake temperature and pressure, EGR, …) it was possible to clearly identify how each parameter impacts ID. The results coming from the sensitivity analysis allowed for developing the ID model presented in this work.
3.1. Switching Pattern Methodology
As widely reported in the literature, due to the use of multiple injections, the heat released during GCI combustion is normally characterized by two stages: premixed and diffusive [19,21]. Figure 2 shows the Rate of Heat Release (RoHR) for a test run in GCI mode, at 2000 rpm and IMEP = 12 bar, activating three injections per cycle (two pilot injections and one main). The calculation of the net heat release (RoHR) was performed through the well-known formula, reported in Equation (1) [16], where represents the specific heat ratio, V and p are the combustion chamber volume and pressure, respectively, and dV and dp are their derivatives.
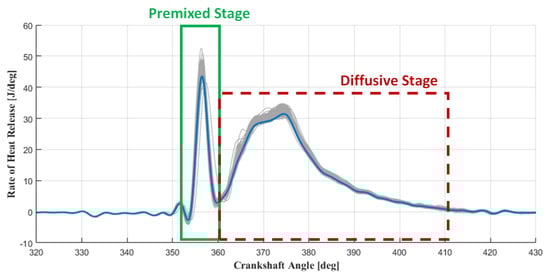
Figure 2.
Rate of heat release curve testing GCI combustion at 12 bar of IMEP and 2000 rpm.
As it can be observed in Figure 2, due to their high ignition delay, that pilot injections burn together (the unfavorable thermodynamics conditions generate high ID and, therefore, the pilot injection IDs are almost equal), releasing energy in a premixed way. After that, the rise of in-cylinder temperature and pressure reduces the ignition delay of the following main injection, and the second stage of the GCI combustion is characterized by a smoother energy release (diffusive stage).
As defined in Equation (2), the ignition delay represents the distance between two angles: the Start of Injection (SOI) and the Start of Combustion (SOC), respectively. Despite its simple definition, several approaches were considered with the aim of calculating ID, mainly because of the different possible SOC definitions proposed in the literature [22,23,24]. Since the amount of fuel injected with pilot injections (using a conventional GCI multiple injection pattern) is high enough (~2 mg/str) to generate a significant premixed combustion portion (Figure 2), during this work, the ID was defined as the angular distance between the SOI and the crankshaft angle at which a RoHR equal to 5 J/deg is reached (). Equation (2) shows the ID and SOC definitions considered during the whole paper. Figure 3 clarifies the SOC detection strategy for a typical GCI combustion. If the first stage of the combustion reaches (and overcomes) the defined combustion velocity threshold, the rise of pressure and temperature will reduce the ignition delay of the following injection, making GCI stable and controllable.
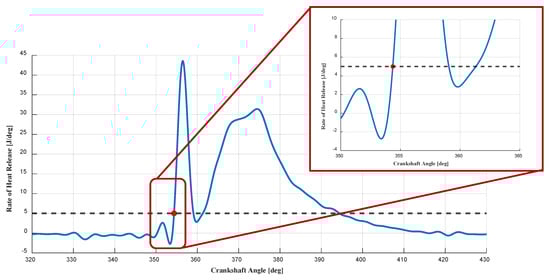
Figure 3.
ROHR curve and corresponding ROHR threshold for determining the SOC.
Once the proper methodology for the calculation of the ID was selected, with the aim of developing a control-oriented ignition delay model, the experimental activity was focused on verifying the main dependencies of ID on the engine control parameters. To do so, a wide set of engine conditions were tested by performing a specifically designed engine control strategy called “Switching Pattern” [18]. During these tests, the GCI engine was run at a stable operating point, using the calibration obtained during previous activities [11,13,19], and every 100 engine cycles the main injection was turned off keeping active the previous ones (both pilot injections) for only one cycle, called “Switched cycle”, while all other engine parameters were kept constant. It is important to underline that the switching strategy was applied always on the same cylinder (cylinder 3 in this case). As a result, the proposed ID model is unaffected by uncertainties resulting from cylinder-to-cylinder differences, which are always present in a real engine. Figure 4 shows, as an example, a scheme of the injection commands measured during a test operated activating the switching strategy (offline in this case, without running the engine). Here, cycles n − 1 and n + 1 represent the complete injection pattern (Pilot + Pre + Main), and cycle n is the switched cycle (Pilot + Pre only).
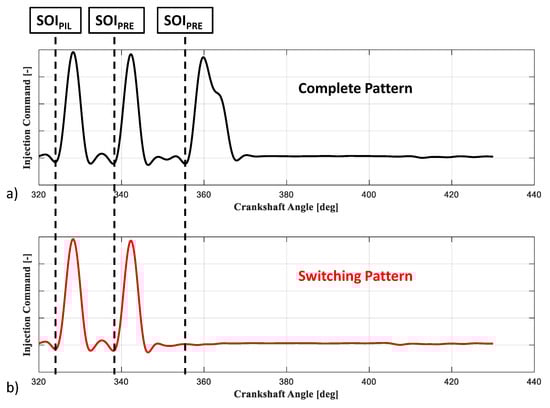
Figure 4.
Scheme of the switching pattern methodology: (a) comparison between the injection commands of both complete (cycle n − 1 and n + 1) and (b) switched pattern (cycle n).
As many works in the literature demonstrate, including some by the present authors [10,11,12,13], the premixed stage of GCI combustion is mainly driven by the chemical composition of the air–fuel mixture and the thermodynamics of the combustion chamber. Here, the combustion of the “Switched cycle” occurs with the same amount of internal residual gases and thermodynamic conditions of a cycle run activating the complete injection pattern (Pilot–Pre–Main) but without the chemical–physical interactions generated by the injected fuel during the main injection. As a result, the ID of the switched cycle represents the ID of the fuel injected with the pilot injections (responsible for GCI stability).
Figure 5 reports a comparison between the RoHR of engine cycles recorded during a switching test operated running the engine at 2000 rpm, IMEP 14 bar, CA50 14 deg bTDC and gasoline pressure 500 bar. As can be observed, the red trace represents the RoHR of the switched cycle while the black and grey ones are instantaneous and averaged RoHRs, respectively. By the analysis of this condition, it is easy to see that when the combustion stages are well separated (retarding the SOI of the main injection, the CA50 will reach a higher volume), the chemical–physical interactions produced by the main injection on the premixed combustion stage are negligible compared to the standard GCI combustion (dual stage combustion) and, therefore, SOC can be successfully identified through the analysis of the switched cycle. As a result, using the switching strategy, it was possible to study the ignition phase of the GCI combustion in depth (mainly determined by the combustion of the pilot injections), even when changing engine control parameters which could strongly modify the combustion shape, producing closer combustion stages in which the mutual interaction between premixed and diffusive combustions might compromise the SOC detection.
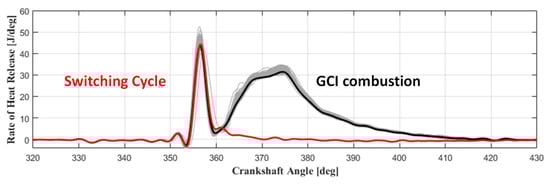
Figure 5.
Comparison between average RoHR running the engine with the complete injection pattern (black) and RoHR of the switching cycle (red).
3.2. Ignition Delay Sensitivity Analysis
With the aim of developing a control-oriented ID model, a wide experimental activity was carried out performing the above-described switching pattern testing methodology highlighting the behavior of the ignition stage of GCI combustion on the engine under study. As described by the literature related to the spontaneous ignition of a lean air–fuel mixture [4,7,20], the ID of GCI combustion with a typical engine layout (using a high-pressure injection system, multiple injection pattern and EGR) mainly depends on: (i) gasoline injection pressure; (ii) injection phasing; (iii) intake temperature; (iv) intake pressure; (v) mass and temperature of residual gases trapped in the combustion chamber; (vi) air humidity; and (vii) EGR rate.
3.2.1. Gasoline Pressure
As widely documented in the literature [11,25,26], the variation of gasoline pressure modifies fuel vaporization, penetration and, consequently, the local air–fuel ratio, which determines the number of ignition points in the combustion chamber. As a result, gasoline pressure must be properly chosen to promote the formation of local air–fuel ratios suitable to generate pilot injection combustion with high efficiency and stability. Previous activities, carried out by the present authors, quantify the impact of the gasoline pressure on the combustion process analyzing the combustion of pilot injections in the same engine [11,13]. Such activities highlighted that vaporization and penetration of the fuel in the combustion chamber are improved using higher fuel pressures. Consequently, the ignition delay is usually reduced by higher injection pressure (up to 700–800 bar). However, when the fuel pressure is further increased (up to 900–1000 bar), better air–fuel mixing accelerates the formation of ultra-lean regions in which the combustion can not propagate, compromising the stability and the efficiency of the combustion. Therefore, the rail pressure has to be properly selected, assuring the formation of a number of ignition points able to trigger and support the combustion. Based on previously analyzed experimental results (with the same engine layout: pistons, fuel system, intake and exhaust manifolds and turbocharger) [13], the experimental tests specifically designed for the development of the control-oriented ID model were operated using a gasoline pressure equal to 500 bar, which proved to be suitable to stabilize the combustion process while getting the benefits of GCI combustion on pollutants and efficiency over a wide range of operating conditions.
3.2.2. Injection Phasing
To correctly control GCI combustion, proper management of the injections is needed. In particular, a stable and reliable GCI combustion was reached using a multiple injection pattern, usually composed of three injections: two small early injections (Pilot and Pre) and one Main injection, usually located near the TDC. A proper selection of the pilot injection phasing allows for robust and reliable management of GCI combustion, usually covering medium- and high-load conditions [9,19,27]. On the contrary, incorrect pilot injection positioning might compromise combustion stability and engine reliability. Since the first injections burn as HCCI combustion, their phasing (angular position in the engine cycle) plays a crucial role in GCI combustion management, mainly because they determine the thermodynamic conditions (temperature and pressure during the compression stroke) of the charge when the fuel is injected.
3.2.3. Intake Temperature
As reported in the literature, when performing combustion techniques characterized by spontaneous ignition, the intake temperature plays a crucial role in ignition delay [13,20]. Once the air–fuel mixture is created, the cylinder thermodynamic conditions affect the autoignition process modifying the required energy to start the combustion. According to the well-known Arrhenius expression [16] in Equation (3), where k is the kinetic constant, A is the preexponential factor, T is the absolute temperature, is the activation energy, and is the universal gas constant, high intake temperature reduces the ID of the mixture.
By using the thermoregulation unit (TEMPCO), the effect of the intake temperature was verified though specifically designed tests, in which the same engine operating point (IMEP 12 bar at 2000 rpm) was tested at two different intake temperatures: THigh and TLow, respectively, 77 and 50 °C.
Table 2 reports the comparison of the control parameters used to evaluate the effect of intake temperature variations on ID. It is possible to note that among the listed variables, the only difference is related to the intake temperature which was increased by roughly 25 °C going from the low-temperature test to the high-temperature one. Through the analysis of the RoHR reported in Figure 6, the effect of the intake temperature on the ID was confirmed. Moreover, by looking at Figure 6, it is clearly shown that the intake temperature significantly modifies the way in which the heat is released during the combustion process. A higher intake temperature means that the fuel injected during the pilot and pre-injections will vaporize and mix with the charge quickly and will start to burn earlier (shorter ID) and faster (higher RoHR peak). Furthermore, since the energy released during the first combustion stage is enough to significantly reduce the ID of the main injection, the diffusive stages are similar in both conditions.
Table 2.
Engine operating conditions testing the effect of two different levels of intake temperature on ID.
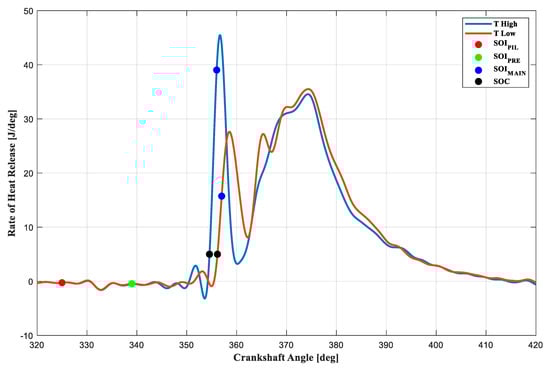
Figure 6.
RoHR curves at different intake temperatures.
Figure 7 shows the cycle-by-cycle evaluation of ID, following the SOC definition given by Equation (2) for both analyzed conditions and it can be observed that the reduction of the ignition delay, when increasing the intake temperature, is remarkable. Considering the reported conditions, the tested temperature increase (typical variation when the engine is used on public roads) leads to a 7% reduction in the ID, and therefore, the effect of intake temperature on ID can not be neglected.
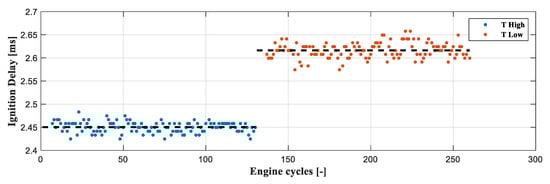
Figure 7.
Effect of different intake temperatures on ID.
3.2.4. Intake Pressure
As suggested by the Arrhenius formula shown in Equation (3), since the energy required to overcome the autoignition conditions is mainly related to the thermodynamics of the air–fuel mixture, the rise of pressure and temperature will produce a similar effect on the ID. With the aim of verifying that dependency in the engine under study, a boost pressure scan was performed while the other control parameters were kept approximately constant. Table 3 summarizes the operating conditions during the boost pressure sweep test. It is important to mention that during the boost pressure sweep (which was kept constant at a target value by the boost controller), the control parameters of the main injection were changed through the closed-loop controllers (CL) to maintain the engine at constant IMEP and CA50 (an SOI Main variation equal to four degrees was applied during the sweep). Reducing the boost pressure, the combustion efficiency will be lower mainly because of the lower amount of fresh air () which hinders the mixing process between air and injected fuel, producing richer mixtures (i.e., low oxygen content).
Table 3.
Engine operating conditions during boost pressure sweep.
To quantify the effect of boost pressure variation on ID (clearly visible from the RoHR traces in Figure 8), Figure 9 reports the cycle-by-cycle ID evaluation. From the observation of Figure 9, it clearly arises that a 0.1 bar of boost pressure increase leads to an ID reduction of approximately 0.5 ms. The reported results confirm that also the boost pressure needs to be considered as a fundamental input for a control-oriented ID model.
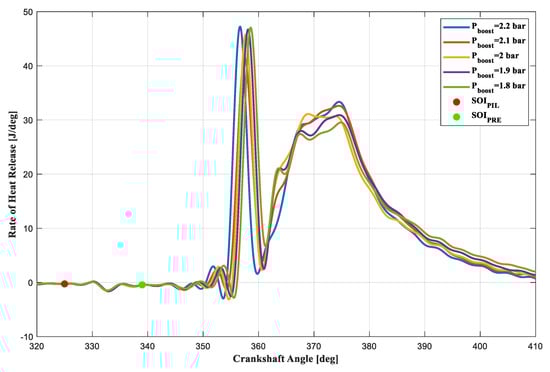
Figure 8.
RoHR curves at different intake pressure.
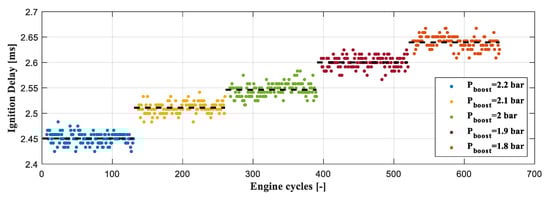
Figure 9.
Effect of different intake pressure on ID.
3.2.5. Mass and Temperature of Residual Gases Trapped in the Combustion Chamber
Since the premixed stage of the GCI combustion is chemically driven, the charge composition might also modify the gasoline autoignition dynamic. In the combustion chamber, fresh air and gasoline are predominant. In addition, internal residual gases (produced during the combustion of the previous cycle) are also always present [16]. Consequently, their impact on the ID must be characterized. As it is well known since residuals are typically composed of carbon dioxide coming from the exhaust stroke of the previous engine cycle (which remains in the combustion chamber), their temperature and quantity (with respect to the fresh air) impact the charge temperature and chemical composition [19,28,29]. Therefore, to separately verify the effects of temperature and amount of residuals on ID, two different kinds of tests running the GCI engine were carried out. Firstly, experiments were focused on highlighting the effect of different residual gases temperature on ID. Typically determined by engine load and position of the center of combustion, the temperature of the residuals depends on the temperature reached at the end of the combustion process. Keeping the GCI engine at a stable operating point (2000 rpm, IMEP 12 bar, CA50 14 deg bTDC), the switching strategy was enabled in one of the four cylinders (cylinder 3) while the other engine parameters were kept at fixed values. Figure 10 shows the RoHR of the recorded engine cycles before and after the switched cycle, as well as the switched cycle.
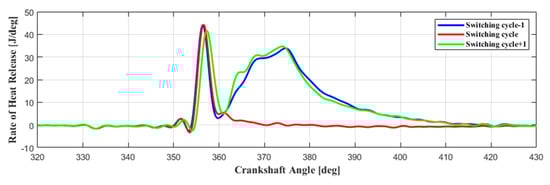
Figure 10.
Effect of different residual gases temperature: RoHR for cycles before (blue) and after (green) the switching cycle (red).
As can be seen, the premixed stage of the engine cycles with hot residuals (blue and red traces), generated by an efficient combustion process at high engine load (IMEP = 14 bar in this case), are very similar both in terms of ID and RoHR peak. On the contrary, looking at the combustion after the switched cycle (green line), the first combustion stage is delayed and slower (a lower maximum RoHR peak is reached) compared to the previous cycles. Despite the fact that the switched cycle (red line) burns with high efficiency, the exhaust gas temperature will be very low (compared to the previous ones), mainly because of the lack of the main injection. Once these residuals are mixed with the fresh air (switching cycle + 1) a colder charge will be generated with, consequently, a longer ID. Moreover, the lack of extra temperature contribution given by the residuals also hinders the formation of proper local air–fuel zones which can release energy (too low local temperature makes it impossible for the combustion), and therefore, the maximum RoHR reached of the premixed stage is lower. However, despite the lower and delayed premixed combustion performed with cold residuals, the energy released is high enough to keep the following diffusive stage stable (almost equal to blue trace with hot residuals). Very slight differences can be observed only near 365 c.a. deg where the diffusive stage is a bit faster, probably because the heat released by the premixed stage is not high enough to completely minimize the ignition delay of the fuel injected through the main injection.
As mentioned before, the ID of the GCI combustion is strictly related to the chemistry of the air–fuel mixture formed in the combustion chamber, which also contains residuals. Many works in the literature quantify the amount of residual gases through the ideal gas law as the mass trapped inside the combustion chamber at the end of the exhaust stroke (volume of the combustion chamber, ) when the piston reaches the top dead center by using the information of the in-cylinder pressure sensor () and the exhaust temperature (), see Equation (4) [16].
Thus, to verify the dependency of the ID on the mass of residuals, the GCI engine was run in stable operating conditions and the amount of residual was varied only by changing the exhaust pressure. Table 4 summarizes the operating conditions during the test on the investigation of different residual quantities. It is important to mention that to guarantee the same intake pressure with different exhaust pressures, the boost controller (which controls the VGT actuator) was turned off. Intake and exhaust pressure were manually managed by adjusting the position of the VGT actuator and throttle valve (located before the intake manifold, always wide open during standard GCI operation), which reduces the intake pressure at a target value. Therefore, the pressure ratio can be considered as an index of the mass of residuals contained in the combustion chamber.
Table 4.
Engine operating conditions testing the effect of two different amounts of residuals on ID.
The analysis of Figure 11, where IDs of two different exhaust pressures are compared, clarifies the impact of the amount of residuals on the ID. The rise of hot residuals increases the charge temperature and, consequently, generates a slight reduction of ID. Even if the ratio between residual gases and fresh air is typically around 6% (for the engine under study run in GCI mode), both the temperature and the mass of residual contributions to the ignition dynamics are not negligible.
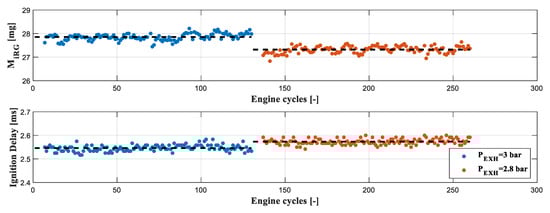
Figure 11.
Effect of different residual gas masses on ID.
3.2.6. Air Humidity
In the spontaneous ignition of a lean air–fuel mixture, the chemical composition of the charge plays a crucial role in the autoignition process. As above described, the charge of GCI combustion, keeping the EGR system closed, is typically composed of fresh air, fuel, and residual gases. Focusing the attention on the chemically driven stage of compression-ignited combustion, since the injected fuel (considering pilot injections only) and residuals are the smaller part of the charge, it was demonstrated that the chemical composition of the fresh air impacts ID [30,31]. In general, the oxygen content of the fresh dry (without water vapor) air defines the chemical load of the combustion. However, a certain amount of water vapor is always present in the air, quantified by the relative humidity, which decreases the oxygen content (in a constant volume as the combustion chamber is) and, therefore, the reactivity of the mixture. As a result, since the water vapor inhibits the formation of a local zone with a favorable air–fuel mixture able to release energy (internal mixing process), its impact on the autoignition dynamic of the premixed stage combustion cannot be neglected. To highlight the effect of humidity on GCI combustion, the same engine operating point was tested with two different levels of relative humidity (Φ). Unfortunately, due to the absence of an air treatment system, humidity could not be directly controlled. However, through the comparison of the same operating condition, reported in Table 5 but recorded on different days (when the relative humidity was different), it was possible to highlight the impact of humidity on ID.
Table 5.
Engine operating conditions testing the effect of two different relative humidity on ID.
Figure 12 shows two different GCI combustions with different relative humidity. By looking at the first combustion stage, due to charge reactivity reduction at high humidity mainly because of the lower oxygen content in the mixture, a remarkable SOC delay can be observed. Furthermore, since water causes an obstacle in the internal mixing process, the premixed stage of the combustion will be slower (lower maximum values of the RoHR curve). It is important to observe that, despite the premixed stage of the combustion being delayed, the RoHR peak of the first combustion stage reaches approximately the same values, assuring the stability of the following diffusive combustion stage. Since the mixing process was hindered because of the presence of a big amount of water, the distance between the two combustion processes (premixed and diffusive) decreases.
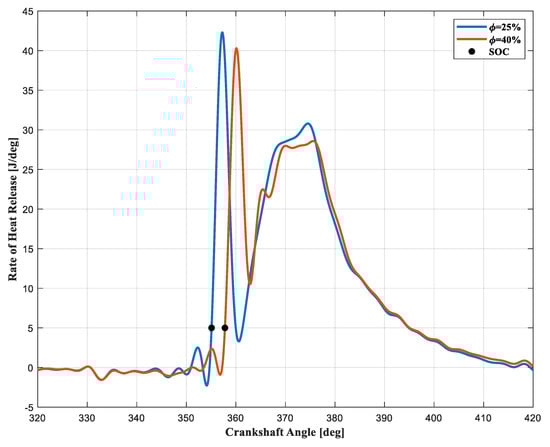
Figure 12.
RoHR curves at different relative humidities.
To quantify the effect of relative humidity variation on ID, Figure 13 reports the cycle-by-cycle ID evaluation. By looking at Figure 13, it can clearly be shown that an increase of 60% in the relative humidity (from 25 to 40%) results in a significant ignition delay rise of approximately 0.25 ms (close to a 10% increase), confirming that the effect of air humidity needs to be considered in the control-oriented ID model.
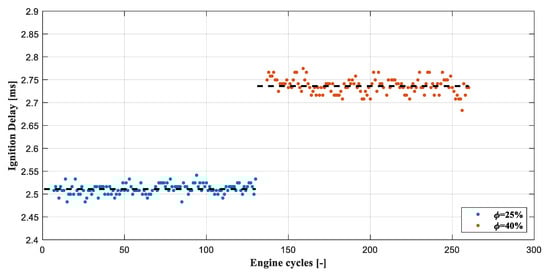
Figure 13.
Effect of different relative humidity on ID.
3.2.7. EGR Rate
As deeply explained in the literature on GCI combustion, such an LTC needs high rates of exhaust gas recirculation to limit the knock tendency and reduce NOx emissions [8,12,19]. Due to the different chemical compositions and temperatures between fresh air and EGR, the internal mixing process of the combustion chamber will be modified with a remarkable impact on the whole combustion, especially at the premixed stage. To highlight the impact of EGR on the ID, an EGR sweep was performed running the GCI engine at a stable operating point. Table 6 shows the operating conditions while the EGR sweep was carried out. During the EGR sweep, the combustion controllers change the main injection parameters (SOI main, varying its value up to eight degrees during the sweep, and ET) to guarantee the target values of IMEP and CA50. Due to the EGR valve opening, the turbine is bypassed by a certain amount of exhaust gases and, therefore, the intake pressure would tend to decrease. Nonetheless, to keep the boost pressure at a constant value, the boost controller changes the VGT position to compensate for the amount of exhaust gas flow lost through the EGR valve. Finally, by using the available measurements, the EGR rate [19] was calculated for each EGR valve position tested.
Table 6.
Engine operating conditions during EGR rate sweep.
As can be clearly observed by looking at Figure 14, the use of EGR delays the SOC. Additionally, as explained in the literature, despite the increment in intake temperature given by the exhaust gas recirculation reducing the ID, by increasing the EGR rate the combustion will be even more delayed [19,32]. This phenomenon could be explained through the worsening of the internal mixing process generated by the EGR, which reduces the oxygen content of the charge. Therefore, the rise of the EGR rate generates a delayed premixed combustion stage. Moreover, given that the chemical inertia of the recirculated gases slows down the formation of the local zones with a favorable air–fuel ratio able to release energy, increasing the EGR rate in the premixed stage will be even more impulsive mainly because a bigger amount of air–fuel mixture auto-ignites simultaneously. The presence of the EGR also has a remarkable effect on the diffusive stage of the combustion. As shown in Figure 14, the presence of EGR also slows down the internal mixing process (between air and fuel) of the main injection, which dominates the diffusive stage. As a result, the second part of the combustion will be slower (lower RoHR trace) and longer (the end of combustion, near zero RoHR, is reached with a bigger crank angle).
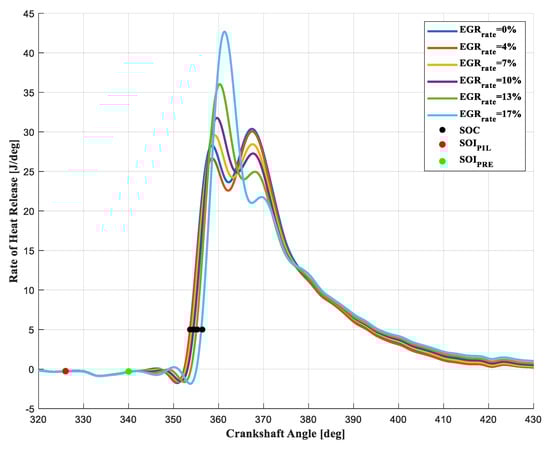
Figure 14.
RoHR curves running GCI with different EGR rates.
Figure 15 quantifies the effect of EGR rate variation on the ID by the cycle-by-cycle ID evaluation for different EGR rates, and it clearly demonstrates that by increasing the EGR rate the ID will be bigger. Since GCI combustion can not be run without high EGR rates, the reported results confirm that the EGR rate must also be considered as a fundamental input for a control-oriented ID model. It is important to bear in mind that, during the intake stroke, part of the available volume inside the cylinder is occupied by hot (with respect to fresh air and EGR) residual gases which rise, increasing the EGR rate (due to the bigger back pressure generated by the VGT to keep boost pressure at a target value). Despite the visible impact on ID reduction due to the residuals, when GCI is run with EGR and an increasing amount of residual gases, their effect is totally compensated by the reduction of the mixture reactivity caused by the EGR. This aspect can be easily observed by the comparison between the ID of 0% and 4% of the EGR rate condition reported in Figure 15. Despite the presence of EGR, which should increase ID, the bigger amount of hot residuals compared to the 0% EGR rate (opening the EGR valve the exhaust pressure rises and consequently residuals increase) compensates for the EGR effect keeping the ID at an almost constant value, the same was recorded without EGR. Once the EGR rate overcomes that condition, the ID will become even greater, following the EGR rate increment.
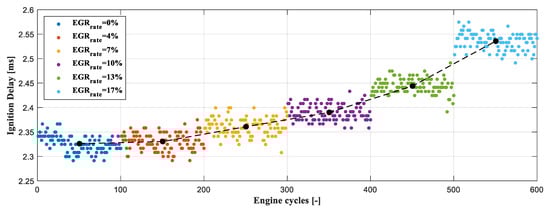
Figure 15.
Effect of different EGR rates on ID.
The goal of this part of the work was to highlight which are the variables that significantly influence the ID of the premixed stage of typical GCI combustion. The following paragraph describes the control-oriented ignition delay model developed to further increase the stability of the GCI combustion in the engine under study.
4. Control-Oriented Ignition Delay Model: Development and Calibration
As widely documented by the literature [4,6], the global behavior of a homogeneous reacting system, such as spontaneous combustion, can be modeled as an Arrhenius-type expression. By using the ideal gas law and the definition of the equivalence fuel/air ratio (φ), the global reaction rate can be assumed to be a function of the pressure, the temperature, and the equivalence ratio. Since the ID is inversely proportional to the rate of the pre-reactions preceding the combustion process, this time ID can be expressed by Equation (5) [16].
However, despite it being proved that this relation could predict the ID of a spontaneous ignition process considering fuel with constant chemical properties (which define ), the variability in the fuel chemistry (commercial gasoline may vary by production batch) and the difficulty of correctly estimating (high uncertainties are always present) the model parameters (A, n, m, and B) reported in Equation (5) makes the presented approach difficult to use for control purposes. As a result, with the aim of developing a control-oriented model for ID estimation, a simpler approach was followed. The above-presented sensitivity analysis allowed us to identify the effects (and their relative dynamics) of the variables which typically affect the ID of GCI combustion. The outcome of that analysis is summarized in Table 7. Due to the different nature of the reported quantities, they can be combined into two classes: thermodynamic and chemical–physical variables. According to the physical approach, the experimental data collected during the ID sensitivity analysis confirmed that ID depends on both thermodynamics and the chemical–physical properties of the air–fuel mixture. As a result, two parameters called and , which summarize such contributions, were developed.
Table 7.
Effects of both thermodynamic and chemical–physical variables on the ignition delay.
The thermodynamic parameter of the model defined by Equation (6), represents the charge temperature in the combustion chamber when the first fuel jet is performed. In Equation (6), the temperature of the mixture when the first fuel jet is introduced into the combustion chamber () is obtained through the isentropic compression of the charge starting from the intake closure (IVC).
While combustion chamber volumes, reported in Equation (8) ( and ) can be directly calculated through geometrical consideration of the engine characteristics (IVC) and control parameters (), the charge temperature is obtained as a weighted average between the charge components, as reported in Equation (7). The components of the charge in the combustion chamber at the intake valve closing reported in Equation (7) are: fresh air , calculated by using the in-cylinder pressure signal with a generic cylinder filling model [19,33,34]) coming from the intake manifold () and residual gases of the previous combustion ( at ).
It is important to mention that in case the EGR rate is equal to 0%, measures only the mass of air entering the cylinder; conversely, whenever the EGR rate is different from 0%, is given by the mass of air (by the ultrasonic flow rate measurement) plus the mass of EGR, Equation (8).
Considering the temperature reported in Equation (7), comes directly from the intake manifold temperature sensor, while is obtained considering the cooling process of residuals until the fresh air is incoming into the combustion chamber [29]. Additionally, once the intake valves are already wide open, the fresh air starts entering the combustion chamber when the intake pressure overcomes the in-cylinder pressure. During the intake stroke (intake valve is open and exhaust valve is closed), the combustion chamber pressure progressively decreases (typically higher than intake) due to the volume increment from the TDC to BDC (slightly lower values are reached in the combustion chamber to generate the air flow). As a result, until a proper pressure value able to generate the air flow through the intake valve in the combustion chamber is reached, the residuals will progressively become colder following the isentropic expansion reported in Equation (9). The contribution of volume increment () responsible for the fresh air flow in the cylinder is reported in Equation (10).
Equations (6) and (9) show two different adiabatic coefficients mainly because different gas (charge or exhaust gases) temperatures might significantly vary and, consequently generate different γ values. To consider that aspect, the γ calculation was performed through the combustion temperature evaluation, reported in Equation (11), by using the gas ideal law from the intake valve closing to the exhaust valve opening (when the system can be considered closed).
Once the experimental in-cylinder temperature was calculated from the data coming from the pressure in the combustion chamber for every cycle, it was possible to evaluate γ during each cycle by means of the following expression reported in Equation (12), in which is modeled using the following polynomial expression shown in Equation (13) [35]. Once the isentropic coefficient during the whole engine cycle is available, by windowing and averaging the γ curve in the considered zone (form IVC to ) it was possible to obtain for each analyzed engine condition ( is obtained using the exhaust gas temperature sensors and considering the standard R constant for exhaust gases). Figure 16 shows the in-cylinder temperature and the corresponding isentropic coefficient within the angular interval ranging from IVC to EVO.
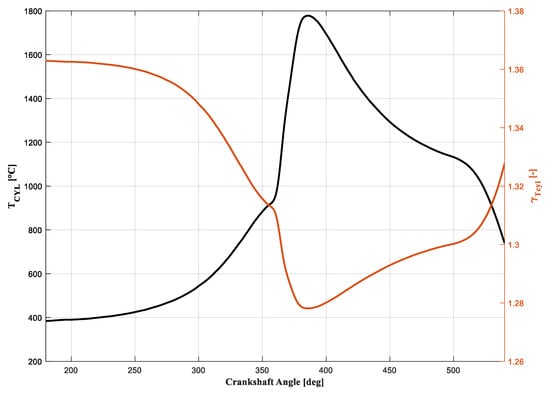
Figure 16.
Variation of in-cylinder temperature and γ within the angular interval IVC-EVO.
Hence, does not only depend on the start of the injection of the first fuel jet (i.e., retarding will result in a higher , but it is also determined by the temperature of the mixture at the intake valve closure (i.e., ); which, in turn, depends on both intake temperature and temperature of residuals as well as the mass entering the cylinder and the mass of residual gases which were already inside the cylinder. The chemical–physical variable of the ID model () aims to quantify the chemical characteristics of the mixture prior to the pilot injection. Considering the dependencies of the ID highlighted during the sensitivity analysis and summarized in Table 7, the chemical potential of the mixture can be expressed by Equation (14), in which is the oxygen content of the fresh air entering the cylinder (reactive part of the mixture, direct consequence of the boost pressure), is the amount of water vapor in the fresh air (ϕ), represents the mass of residual gases and the amount of external EGR. The model parameters and , which will be discussed later, are used to consider the impacts of the residuals and EGR on the mixture chemistry trying to summarize the internal mixing phenomena which affect the ID.
As mentioned before, and can be easily calculated through the information coming from the sensors mounted on the engine. On the other hand, and can be obtained through easy physical considerations. The air inside the test cell, and consequently the air entering the cylinder, is a binary mixture composed of dry air and water vapor; in turn, dry air is mainly composed of (75.5%) and (23.19%) plus other gases whose mass fractions are negligible with respect to those of nitrogen and oxygen. Therefore, it is reasonable to assume that without EGR during the intake stroke, , and water vapor enter inside the cylinder. Accordingly, the mass of air entering the cylinder (without EGR) is reported in Equation (15), in which the sum of represents the mass of dry air.
Since the ratio between nitrogen and oxygen is almost constant, only the mass of oxygen, reported in Equation (16), will be considered as the reactive part of the mixture.
By measuring the environmental conditions of the test bench, such as pressure, temperature, and relative humidity, following Dalton’s approach, it is possible to calculate , following Equations (17) and (18), and consequently . It is important to highlight that all the physical considerations reported in estimating are based on the accurate estimation of the cylinder filling (air trapped inside the combustion chamber), which provides consistent values for .
To obtain , the partial pressure of water vapor () in the air–water mixture and the saturation pressure () can be easily calculated by applying the definition of relative humidity and the general formulation of the water vapor saturation trace as a function of temperature, reported in Equation (19).
Once the model parameters were defined, the ID model was obtained by performing the switching strategy (in that way only the first combustion stage is considered, excluding mutual influences between the two combustion stages, premixed and diffusive) using several engine operating conditions. By using a second-order polynomial function, it was possible to create a link between the ID of the switched cycles and the above-described thermodynamic and chemical–physical parameters ( and ). The analytical expression used to model the ignition delay of GCI combustions is reported in Equation (20), in which the values of the model constant, calibrated using Matlab cftool, are summarized in Table 8.
Table 8.
Constants of ID model.
Table 9 reports the engine operating conditions used to calibrate the ID model performing the switching pattern testing methodology over a wide range of engine operating conditions. As highlighted in the previous section of the paper, since the effect of EGR on ID is almost linear, the control-oriented ID model was calibrated without considering the EGR. To further increase the number of calibration points, additional operating conditions were added running the engine with a complete injection pattern without EGR and retarded combustion (CA50 equal to 14 deg aTDC). In such conditions, reported in Table 10 and called EGR sweep tests, the retarded main injection positioning (which generates retarded CA50) allows for completely separating the GCI combustion stages (premixed and diffusive) and, therefore, accurately identifies the SOC. It is important to mention that all the considered engine conditions are characterized by the same engine speed (2000 rpm) and injection pressure (500 bar). As mentioned before, to maximize the benefits of GCI combustion (efficiency and pollutants), the baseline calibration of the engine must generate stable and reliable dual-stage combustion. As a result, even if engine speed and injection pressure strongly modify the ID of the pre-injections, the baseline injection phasing calibration shall be able to produce dual-stage combustion. As a result, keeping the same combustion behavior (through proper engine calibration), it is reasonable to consider the presented ID model valid, even with different engine speeds and injection pressures that, as documented in the literature, have a non-negligible impact on ID. Future steps of this activity will be aimed to verify the ID model running GCI combustion with different rpm and injection pressures.
Table 9.
Engine operating conditions for ID model calibration running switching pattern methodology.
Table 10.
Engine operating conditions for ID model calibration running GCI mode with EGR rate equal to zero.
As mentioned before, the ID of GCI combustion is strongly affected by the physical and chemical effects of the residual gases and, therefore, the chemical–physical parameter considers such dependencies by using . Since it was demonstrated during the ID sensitivity analysis that both temperature and quantity of residuals modify the gasoline autoignition dynamics, was calibrated with respect to the product between the cylinder pressure ratio (, which defines the amount of residual gases) and the charge temperature when residuals met the fresh charge (). By using the tests listed in Table 9 and Table 10, in which different amounts and temperatures of residuals were performed, it was possible to calibrate .
Figure 17 shows the developed ID model together with the calibration points coming from the before-mentioned tests used to build it. By looking at the model, it is clearly visible that for a given value of equivalent mass, the ignition delay increases if the temperature at the start of injection of the pilot injection reduces. Similarly, for a given , the ignition delay increases if the equivalent mass (which basically represents the amount of oxygen entering the cylinder) reduces. Both the above-described behaviors reflect the ignition dynamics of the spontaneous combustion of a lean air–fuel mixture reported in the literature and, therefore, the presented approach can be reasonably considered valid in describing the ID of GCI combustion. Since it was demonstrated that GCI needs a big amount of external EGR to effectively reduce both pollutants and emissions [8,19], the ID model is sufficiently rugged for use with different EGR rates. As described during the ID sensitivity analysis, the EGR obstacles the internal mixing process retarding the SOC positioning. Moreover, it was demonstrated that by increasing the EGR rate, the SOC rises almost linearly. Therefore, was calibrated as a linear function of EGR rate to bring back SOC at the measured value without EGR. Figure 18 shows the calibration of as a function of EGR rate running the GCI operating condition summarized in Table 10. It is important to observe that the impact of EGR can be neglected at EGR rates lower than 5%. As proved during the ID sensitivity analysis, the increment in charge temperature given by EGR compensates for the chemical inertia of the recirculated exhaust gases. During the ID sensitivity analysis, the mutual effects of residual gases and EGR on ID were demonstrated, especially at very low EGR rates. Mainly because of the amount of EGR (generally bigger than residuals) and its temperature (colder), the impact of residual gases on ID progressively decreases. As a result, must be properly calibrated to reduce the impact of residuals on ID because of differences in internal mixing, chemistry, and local temperature when EGR is used.
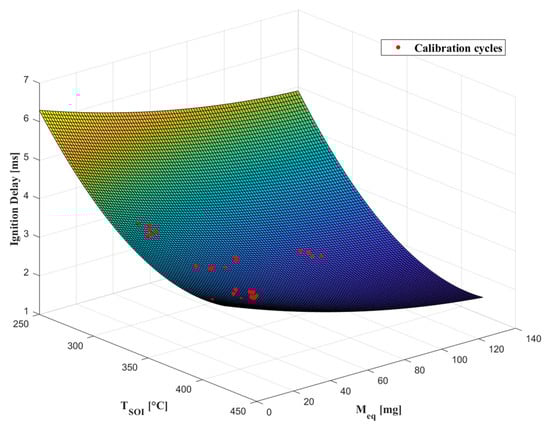
Figure 17.
Control-oriented ID model.
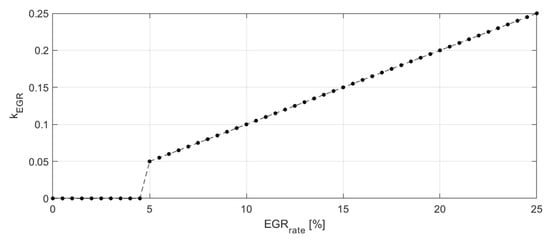
Figure 18.
Calibration of as a function of the EGR rate.
5. Control-Oriented Ignition Delay Model: Results
After defining and calibrating the ignition delay model and its coefficients, the validation of the presented approach was performed through the cycle-to-cycle ID estimation for all the engine operating conditions reported in Table 9 and Table 10. To better clarify how the model can be implemented in real-time, Figure 19 shows a schematic of the SOC estimation methodology (based on the developed ID model) and summarizes the calculation of the two main parameters: and .
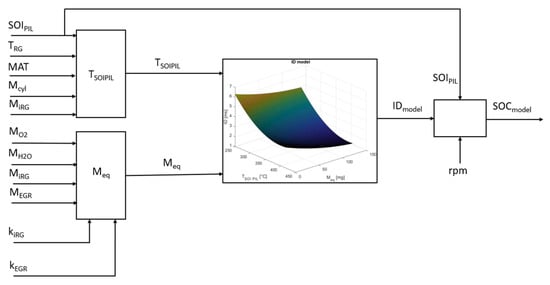
Figure 19.
Schematic of SOC estimation based on ID model and and calculation.
The model accuracy was evaluated as the difference between measured (through in-cylinder pressure signal) and estimated ID, as defined by Equation (21). Since it was demonstrated that the SOC positioning for GCI combustion is crucial to guarantee the whole combustion process stability, the maximum acceptable error between measured and estimated ID at 2000 rpm was set to ±5 degrees.
Figure 20 shows the accuracy of the cycle-to-cycle angular ID estimation, obtained by applying the presented estimation methodology to all the experimental tests run in the GCI model (since all the tests were run at 2000 rpm, there is a direct correspondence between time and angular delay). From observation of Figure 20, you can clearly see that the model accurately predicts the ID of GCI combustion for very different engine conditions, operating with different intake/exhaust conditions and EGR rates: the RMS error between measured and estimated angular ID is around 1.3 deg and the maximum error remains lower than the acceptable limits set to ±5 degrees.
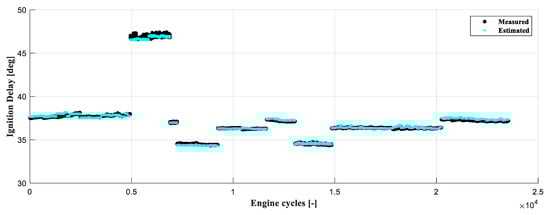
Figure 20.
Accuracy on cycle-by-cycle SOC estimation for switching pattern tests: top subplot comparison between measured and estimated ID, bottom subplot error evaluation.
Since the ID estimation approach schematized in Figure 19 proved to be effective and the accuracy of the obtained results seems to be compatible with the requirements for real-time combustion control, further studies are currently been performed to analyze the impacts of other operating parameters on the ignition delay, such as engine speed and rail pressure so that they can then be properly included in the SOC/ID estimation strategy.
6. Conclusions
The presented work is focused on the development of a control-oriented ignition delay model for one of the most promising Low-Temperature Combustion methodologies, called Gasoline Compression Ignition (GCI). Despite GCI combustion proving to be effective in reducing pollutants and fuel consumption, the main limitation which hinders the diffusion in production applications is related to the control of the combustion process. This work demonstrated that it is possible to stabilize GCI ignition using multiple injections of small amounts of fuel, injected early in the engine cycle. However, since this phenomenon is chemically driven, slight variations of the cylinder thermal conditions or inaccuracies on the injected fuel mass (common in case of small pre-injections) might compromise the mixture ignitability and, consequently, the whole combustion stability, leading to misfire or knocking. Therefore, to improve the stability of the combustion process and further increase its operating range, a control-oriented ID model was developed running a specifically modified light-duty 1.3 L compression-ignited engine.
The first part of the study was mainly aimed at studying the ignition dynamics for spontaneous combustion of a lean air–fuel mixture in the engine under study. Focusing the attention on the first stage of GCI combustion, whose efficiency determines the stability of the whole combustion, it was possible to obtain the relationship between the ID and the main quantities which impact the autoignition of the mixture such as injection phasing, intake air pressure and temperature, relative humidity and EGR rate.
One of the main outcomes of the presented ID sensitivity analysis highlighted that the ignition dynamic, and consequently the ID, of HCCI-like combustion (the pilot injections generate premixed combustion very close to HCCI), depends on both thermodynamics and the chemical–physical properties of the air–fuel mixture. As a result, two parameters called and , which summarize the thermodynamics and chemical–physical properties of the mixture, respectively, were developed. After defining the model parameters by using only the data of the switched cycles running the GCI engine in different operating conditions, the control-oriented ID model was developed and calibrated. The comparison between the measured ID, directly calculated through the in-cylinder pressure and the model-based estimation of the ID, demonstrated a good accuracy over the whole GCI typical operating range (different loads, intake/exhaust conditions and EGR rates were tested). As a result, the proposed control-oriented ID model could be considered an effective feed-forward contribution to the injection control strategy. Despite the presented model demonstrating enough accuracy in predicting ID, the model constants are strongly related to the engine layout, mainly because the engine design (combustion chamber shape, intake ducts shape and lengths, injector position, …) can strongly modify the way in which the energy is released. With the aim of further extending the validity of the presented approach, future steps of this activity will be aimed at verifying the ID model running GCI combustion (keeping constant its typical dual-stage combustion) at different engine speeds and injection pressures.
Author Contributions
Conceptualization, G.S., V.R. and F.P.; methodology, G.S., V.R. and F.P.; investigation, G.S. and V.R.; resources, G.S. and V.R.; data curation, G.S.; writing—original draft preparation, G.S., V.R., V.M. and S.F.; writing—review and editing, F.P., V.R. and S.F.; visualization, G.S., V.R. and V.M.; supervision, F.P. and V.R.; project administration, F.P. and V.R. All authors have read and agreed to the published version of the manuscript.
Funding
This research received no external funding.
Acknowledgments
The authors would like to show their great appreciation to other members of our team for their support of this research.
Conflicts of Interest
The authors declare no conflict of interest.
Nomenclature
| BEVs | Battery Electric Vehicles |
| CAN | Controller Area Network |
| CA50 | Center of combustion |
| CDC | Conventional Diesel Combustion |
| CL | Closed-Loop |
| CO2 | Carbone dioxide |
| Mixture Activation Energy | |
| ECU | Electronic Control Unit |
| EGR | Exhaust Gas Recirculated |
| EGRrate | Mixture dilution Factor |
| ETmain | Energizing Time |
| EVO | Exhaust valve opening |
| FCEVs | Fuel Cell Electric Vehicles |
| GCI | Gasoline partially premixed Compression Ignition combustion |
| HCCI | Homogeneous Charge Compression Ignition |
| ICE | Internal Combustion Engine |
| ID | Ignition Delay |
| Measured Ignition delay | |
| Estimated Ignition delay | |
| IMEP | Indicated Mean Effective Pressure |
| LTCs | Low-Temperature Combustions |
| Amount of fresh Charge | |
| Exhaust Gases Mass | |
| Equivalent Mass (Chemical–Physical Index) | |
| Water Vapor Mass | |
| Oxygen Mass | |
| Oxygen Mass | |
| Residual Gas Mass | |
| Dry Air Mass | |
| N2 | Nitrogen |
| NOx | Nitrogen Oxides |
| O2 | Oxygen |
| Pboost | Boost pressure |
| Pexh | In-cylinder pressure averaged during exhaust stroke |
| PInt | In-cylinder pressure averaged during intake stroke |
| R | Specific Gas Constant |
| Air Specific Gas Constant | |
| Universal Gas Constant | |
| RMS | Root Mean Square Error |
| RoHR | Rate of Heat Release |
| RON | Research Octane Number |
| RPM | Revolutions per Minute |
| S/C | Supercharger |
| SOC | Start of Combustion |
| SOI | Start of Injection |
| Start of Injection angle for Pilot injection | |
| Start of Injection angle for Pre-injection | |
| Start of Injection angle for Main injection | |
| T | Mixture Temperature |
| Gas Temperature during combustion process (from cylinder pressure signal) | |
| Exhaust gas Temperature (from the cylinder pressure signal) | |
| Mixture Temperature at Intake Valve Closing Timing | |
| Manifold Air Temperature | |
| Residual Gases Temperature | |
| Charge Temperature at SOI | |
| Mixture Temperature at | |
| TDC | Top Dead Center |
| V | Cylinder Volume |
| Vcc | Combustion chamber volume |
| Vcyl | Maximum geometrical volume of the cylinder |
| VIVC | Volume at Intake Valve Closing angle |
| Volume at | |
| VGT | Variable Geometry Turbine |
| aTDC | After Top Dead Center |
| bTDC | Before Top Dead Center |
| dP | Derivative pressure |
| dV | Derivative volume |
| cp | Heat capacity at constant pressure |
| cv | Heat capacity at constant volume |
| dp | Pressure derivative |
| ID model error | |
| ID model coefficient for External EGR | |
| ID model coefficient for Residuals | |
| Mass of fresh air | |
| Test cell pressure | |
| Partial pressure of water vapor in the air–water mixture | |
| Air saturation pressure | |
| In-cylinder pressure | |
| Mass fraction of water vapor | |
| ΔV1 | Re-expansion reduction volume contribution |
| γ | Adiabatic index |
| Adiabatic index of mixture during compression stroke | |
| Adiabatic index of mixture during expansion stroke | |
| Angular position at which RoHR reaches 5 J/deg | |
| Relative humidity | |
| Local Air–fuel Ratio |
References
- Available online: https://www.evgo.com/ev-drivers/types-of-evs (accessed on 20 January 2022).
- Available online: https://thedriven.io/2018/08/28/what-is-a-fuel-cell-electric-vehicle (accessed on 20 January 2022).
- Available online: https://www.unep.org/resources/emissions-gap-report-2021 (accessed on 25 January 2022).
- Murya, R.K. Characteristics and Control of Low Temperature Combustion Engines; Springer: Berlin/Heidelberg, Germany, 2018. [Google Scholar]
- Dernotte, J.; Dec, J.; Ji, C. Investigation of the Sources of Combustion Noise in HCCI Engines. SAE Int. J. Engines 2014, 7, 730–761. [Google Scholar] [CrossRef]
- Saxena, S.; Bedoya, I.D. Fundamental phenomena affecting low temperature combustion and HCCI engines, high load limits and strategies for extending these limits. Prog. Energy Combust. Sci. 2013, 39, 457–488. [Google Scholar] [CrossRef]
- Ganesh, D.; Nagarajan, G.; Ibrahim, M.M. Study of performance, combustion and emission characteristics of diesel homogeneous charge compression ignition (HCCI) combustion with external mixture formation. Fuel 2008, 87, 3497–3503. [Google Scholar] [CrossRef]
- Sellnau, M.; Foster, M.; Moore, W.; Sinnamon, J.; Hoyer, K.; Klemm, W. Pathway to 50% Brake Thermal Efficiency Using Gasoline Direct Injection Compression Ignition; SAE Technical Paper 2019-01-1154; SAE International: Warrendale, PA, USA, 2019. [Google Scholar] [CrossRef]
- Ravaglioli, V.; Ponti, F.; Silvagni, G.; Moro, D.; Stola, F.; De Cesare, M. Performance Assessment of Gasoline PPC in a Light-Duty CI Engine; SAE Technical Paper 2022-01-0456; SAE International: Warrendale, PA, USA, 2022. [Google Scholar] [CrossRef]
- Li, C.; Yin, L.; Shamun, S.; Tuner, M.; Johansson, B.; Solsjö, R.; Bai, X.S. Transition from HCCI to PPC: The Sensitivity of Combustion Phasing to the Intake Temperature and the Injection Timing with and without EGR; SAE Technical Paper 2016-01-0767; SAE International: Warrendale, PA, USA, 2016. [Google Scholar] [CrossRef]
- Stola, F.; Ravaglioli, V.; Silvagni, G.; Ponti, F.; De Cesare, M. Analysis of the Effects of Injection Pressure Variation in Gasoline Partially Premixed Combustion; SAE Technical Paper 2021-01-0517; SAE International: Warrendale, PA, USA, 2021. [Google Scholar] [CrossRef]
- Belgiorno, G.; Dimitrakopoulos, N.; Di Blasio, G.; Beatrice, C.; Tunestål, P.; Tunér, M. Effect of the engine calibration parameters on gasoline partially premixed combustion performance and emissions compared to conventional diesel combustion in a light-duty Euro 6 engine. Appl. Energy 2018, 228, 2221–2234. [Google Scholar] [CrossRef]
- Stola, F.; Ravaglioli, V.; Silvagni, G.; Ponti, F.; De Cesare, M. Injection Pattern Investigation for Gasoline Partially Premixed Combustion Analysis; SAE Technical Paper 2019-24-0112; SAE International: Warrendale, PA, USA, 2019. [Google Scholar] [CrossRef]
- Silvagni, G.; Ravaglioli, V.; Ponti, F.; Corti, E.; Raggini, L.; Scocozza, G.; Stola, F.; De Cesare, M. Development of a Predictive Pressure Waves Model for High-Pressure Common Rail Injection Systems. SAE Int. J. Engines 2022, 15. [Google Scholar] [CrossRef]
- Hernandez, J.J.; Sanz-Argent, J.; Carot, J.M.; Jabaloyes, J.M. Ignition delay time correlations for a diesel fuel with application to engine combustion modelling. Int. J. Engine Res. 2010, 11, 199–206. [Google Scholar] [CrossRef]
- Heywood, J. Internal Combustion Engine Fundamentals; McGraw-Hill Education: New York, NY, USA, 1988. [Google Scholar]
- Lee, Y.; Lee, S.; Min, K. Ignition Delay Model of Multiple Injections in CI Engines; SAE Technical Paper 2019-24-0071; SAE International: Warrendale, PA, USA, 2019. [Google Scholar] [CrossRef]
- Ravaglioli, V.; Ponti, F.; Silvagni, G.; De Cesare, M. Development of a Methodology for the Investigation of Residual Gases Effects on Gasoline Compression Ignition. In Proceedings of the ASME 2020 Internal Combustion Engine Division Fall Technical Conference, Virtual, Online, 4–6 November 2020; V001T04A006. ASME: New York, NY, USA, 2020. [Google Scholar] [CrossRef]
- Ravaglioli, V.; Ponti, F.; Silvagni, G.; Moro, D.; Stola, F.; De Cesare, M. Investigation of Gasoline Partially Premixed Combustion with External Exhaust Gas Recirculation. SAE Int. J. Engines 2022, 15. [Google Scholar] [CrossRef]
- Matsuura, K.; Iida, N. Effect of Temperature-Pressure Time History on Auto-Ignition Delay of Air-Fuel Mixture; SAE Technical Paper 2018-01-1799; SAE International: Warrendale, PA, USA, 2018. [Google Scholar] [CrossRef]
- An, Y.; Ali, M.J.; Vallinayagam, R.; AlRamadan, A.; Sim, J.; Chang, J.; Im, H.; Johansson, B. Compression Ignition of Low Octane Gasoline under Partially Premixed Combustion Mode; SAE Technical Paper 2018-01-1797; SAE International: Warrendale, PA, USA, 2018. [Google Scholar] [CrossRef]
- Ponti, F.; Ravaglioli, V.; Cavina, N.; De Cesare, M. Diesel Engine Combustion Sensing Methodology Based on Vibration Analysis. ASME J. Eng. Gas Turbines Power 2014, 136, 111503. [Google Scholar] [CrossRef]
- Oh, S.; Min, K.; Sunwoo, M. Real-time start of a combustion detection algorithm using initial heat release for direct injection diesel engines. Appl. Therm. Eng. 2015, 89, 332–345. [Google Scholar] [CrossRef]
- Luján, J.; Bermúdez, V.; Guardiola, C.; Abbad, A. A methodology for combustion detection in diesel engines through in-cylinder pressure derivative signal. Mech. Syst. Signal Process. 2010, 24, 2261–2275. [Google Scholar] [CrossRef]
- Dempsey, A.B.; Curran, S.J.; Wagner, R.M. A perspective on the range of gasoline compression ignition combustion strategies for high engine efficiency and low NOx and soot emissions: Effects of in-cylinder fuel stratification. Int. J. Engine Res. 2016, 17, 897–917. [Google Scholar] [CrossRef]
- Zhang, J.; Tang, M.; Atkinson, W.; Schmidt, H.; Lee, S.Y.; Naber, J.; Tzanetakis, T.; Sim, J. Experimental Investigation of the Compression Ignition Process of High Reactivity Gasoline Fuels and E10 Certification Gasoline using a High-Pressure Direct Injection Gasoline Injector; SAE Technical Paper 2020-01-0323; SAE International: Warrendale, PA, USA, 2020. [Google Scholar] [CrossRef]
- Liu, J.; Wang, H.; Zheng, Z.; Mao, B.; Li, L.; Yao, M. Effects of Pilot Injection Strategy on Combustion and Emission Characteristics in Gasoline Compression Ignition. Energy Procedia 2017, 142, 1267–1273. [Google Scholar] [CrossRef]
- Yazdani, A.; Naber, J.; Shahbakhti, M.; Dice, P.; Glugla, C.; Cooper, S.; McEwan, D.; Huberts, G. Air Charge and Residual Gas Fraction Estimation for a Spark-Ignition Engine Using In-Cylinder Pressure; SAE Technical Paper 2017-01-0527; SAE International: Warrendale, PA, USA, 2017. [Google Scholar] [CrossRef]
- Sinnamon, J.F.; Sellnau, M.C. A New Technique for Residual Gas Estimation and Modelling in Engines; SAE Technical Paper 2008-01-0093; SAE International: Warrendale, PA, USA, 2008. [Google Scholar] [CrossRef]
- Chang, Y.; Mendrea, B.; Sterniak, J.; Bohac, S.V. Effect of Ambient Temperature and Humidity on Combustion and Emissions of a Spark-Assisted Compression Ignition Engine. ASME J. Eng. Gas Turbines Power 2017, 139, 051501. [Google Scholar] [CrossRef]
- Badra, J.; Elwardany, A.; Sim, J.; Viollet, Y.; Im, H.G.; Chang, J. Effects of In-Cylinder Mixing on Low Octane Gasoline Compression Ignition Combustion; SAE Technical Paper 2016-01-0762; SAE International: Warrendale, PA, USA, 2016. [Google Scholar] [CrossRef]
- Kumar, P.; Sellnau, M. EGR System Optimization for Light-Duty Gasoline Compression Ignition (GCI) Engine; SAE Technical Paper 2021-01-0515; SAE International: Warrendale, PA, USA, 2021. [Google Scholar] [CrossRef]
- Kassa, M.; Hall, C.; Ickes, A.; Wallner, T. In-Cylinder Oxygen Mass Fraction Estimation Method for Minimizing Cylinder-to-Cylinder Variations; SAE Technical Paper 2015-01-0874; SAE International: Warrendale, PA, USA, 2015. [Google Scholar] [CrossRef]
- Vojtisek-Lom, M.; Kotek, M. Estimation of Engine Intake Air Mass Flow using a generic Speed-Density method. J. Middle Eur. Constr. Des. Cars 2014, 12, 7–15. [Google Scholar]
- Pipitone, E.; Beccari, A.; Beccari, S. Reliable TDC Position Determination: A Comparison of Different Thermodynamic Methods through Experimental Data and Simulations; SAE Technical Paper 2008-36-0059; SAE International: Warrendale, PA, USA, 2008. [Google Scholar] [CrossRef] [Green Version]
Publisher’s Note: MDPI stays neutral with regard to jurisdictional claims in published maps and institutional affiliations. |
© 2022 by the authors. Licensee MDPI, Basel, Switzerland. This article is an open access article distributed under the terms and conditions of the Creative Commons Attribution (CC BY) license (https://creativecommons.org/licenses/by/4.0/).