
Effect of Open-Window Gaps on the Thermal Environment inside Vehicles Exposed to Solar Radiation

 , , ,
, , ,
Abstract
:1. Introduction
1.1. Environment inside Vehicles Exposed to Solar Radiation
1.2. Radiation and Ventilation of Vehicles
1.3. Study Aims
2. Methods
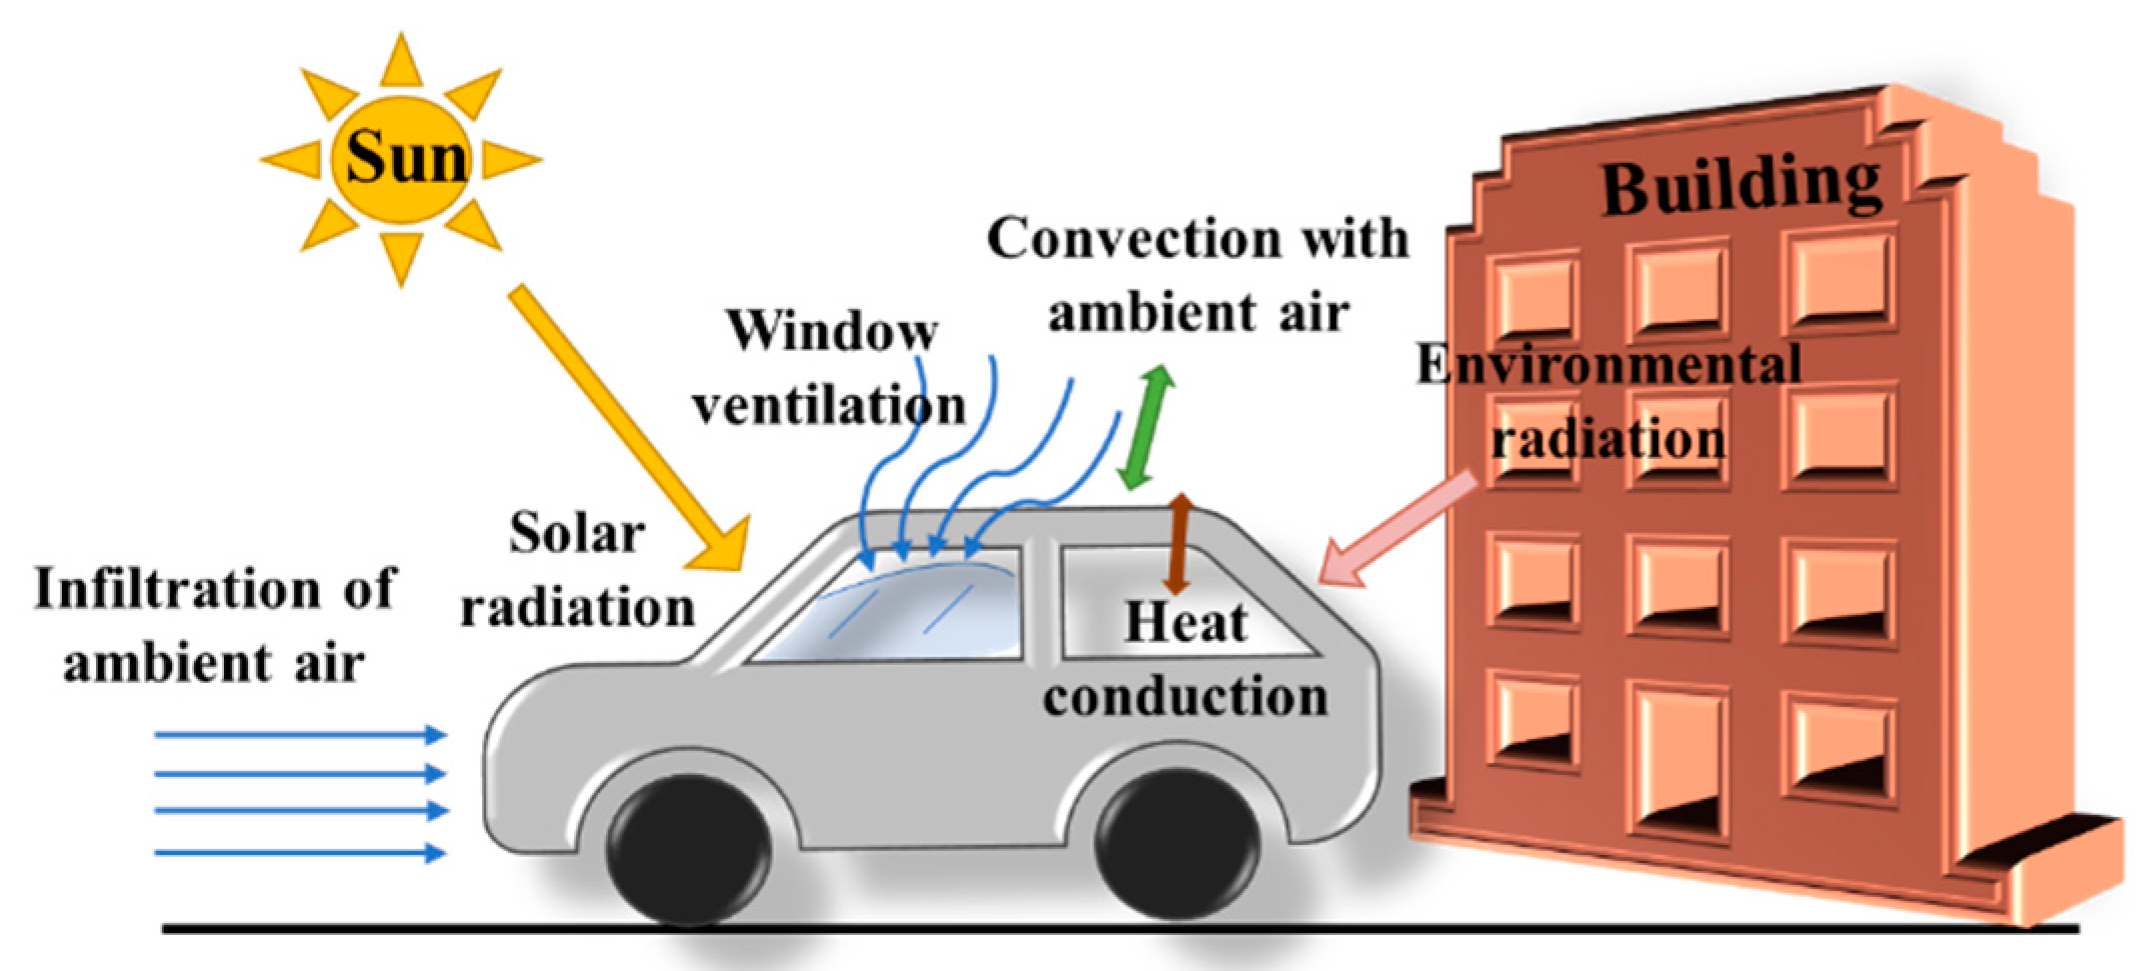
2.1. Heat Transfer Process of a Vehicle Cabin
2.2. Measurement Object and Site
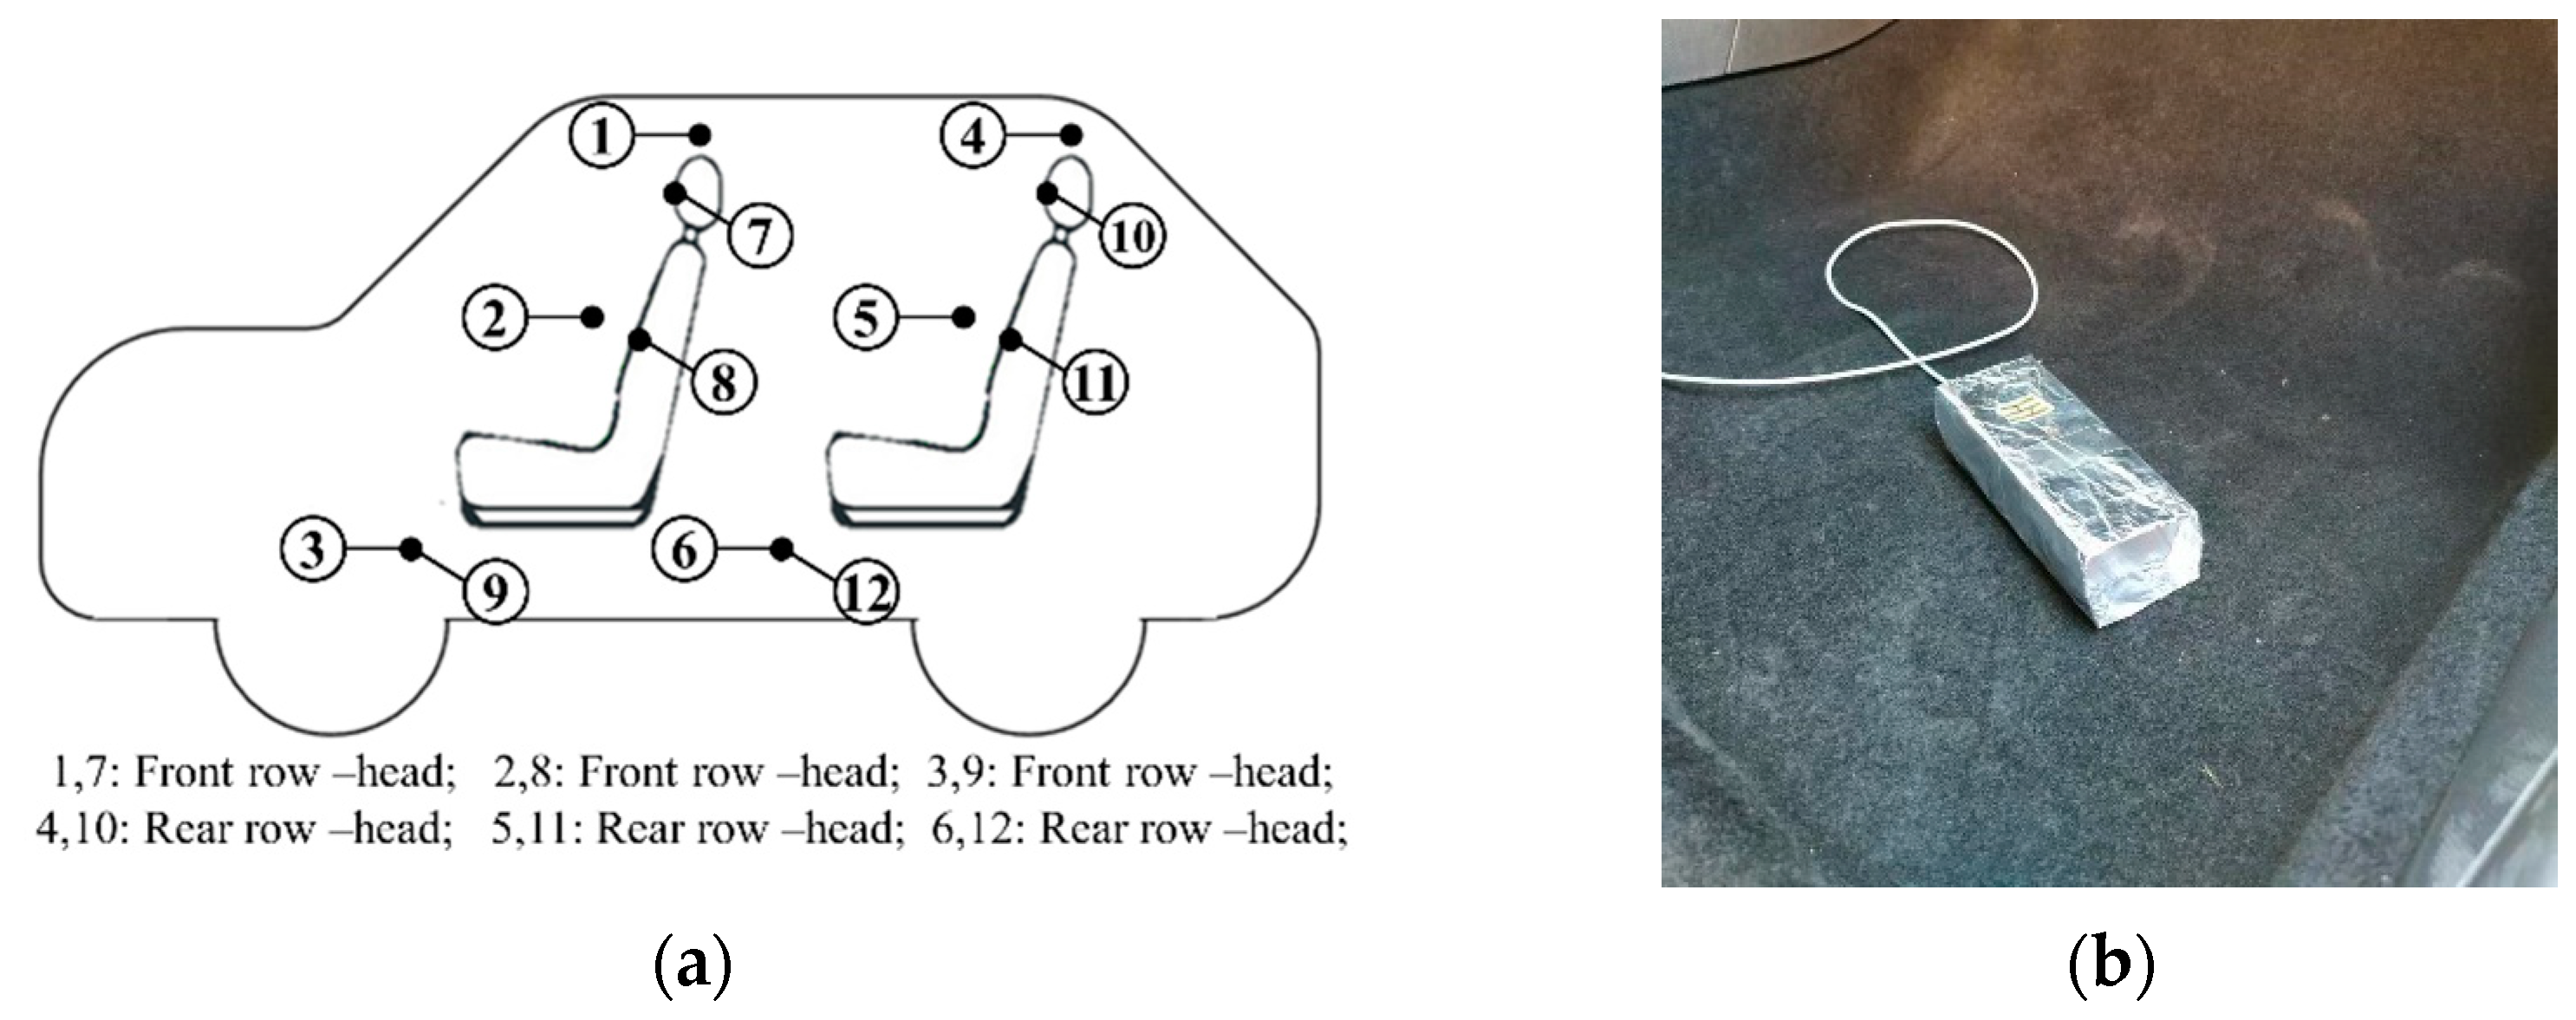
2.3. Data Acquisition and Measurement Equipment
2.4. Experimental Procedure and Measurement Cases
3. Results
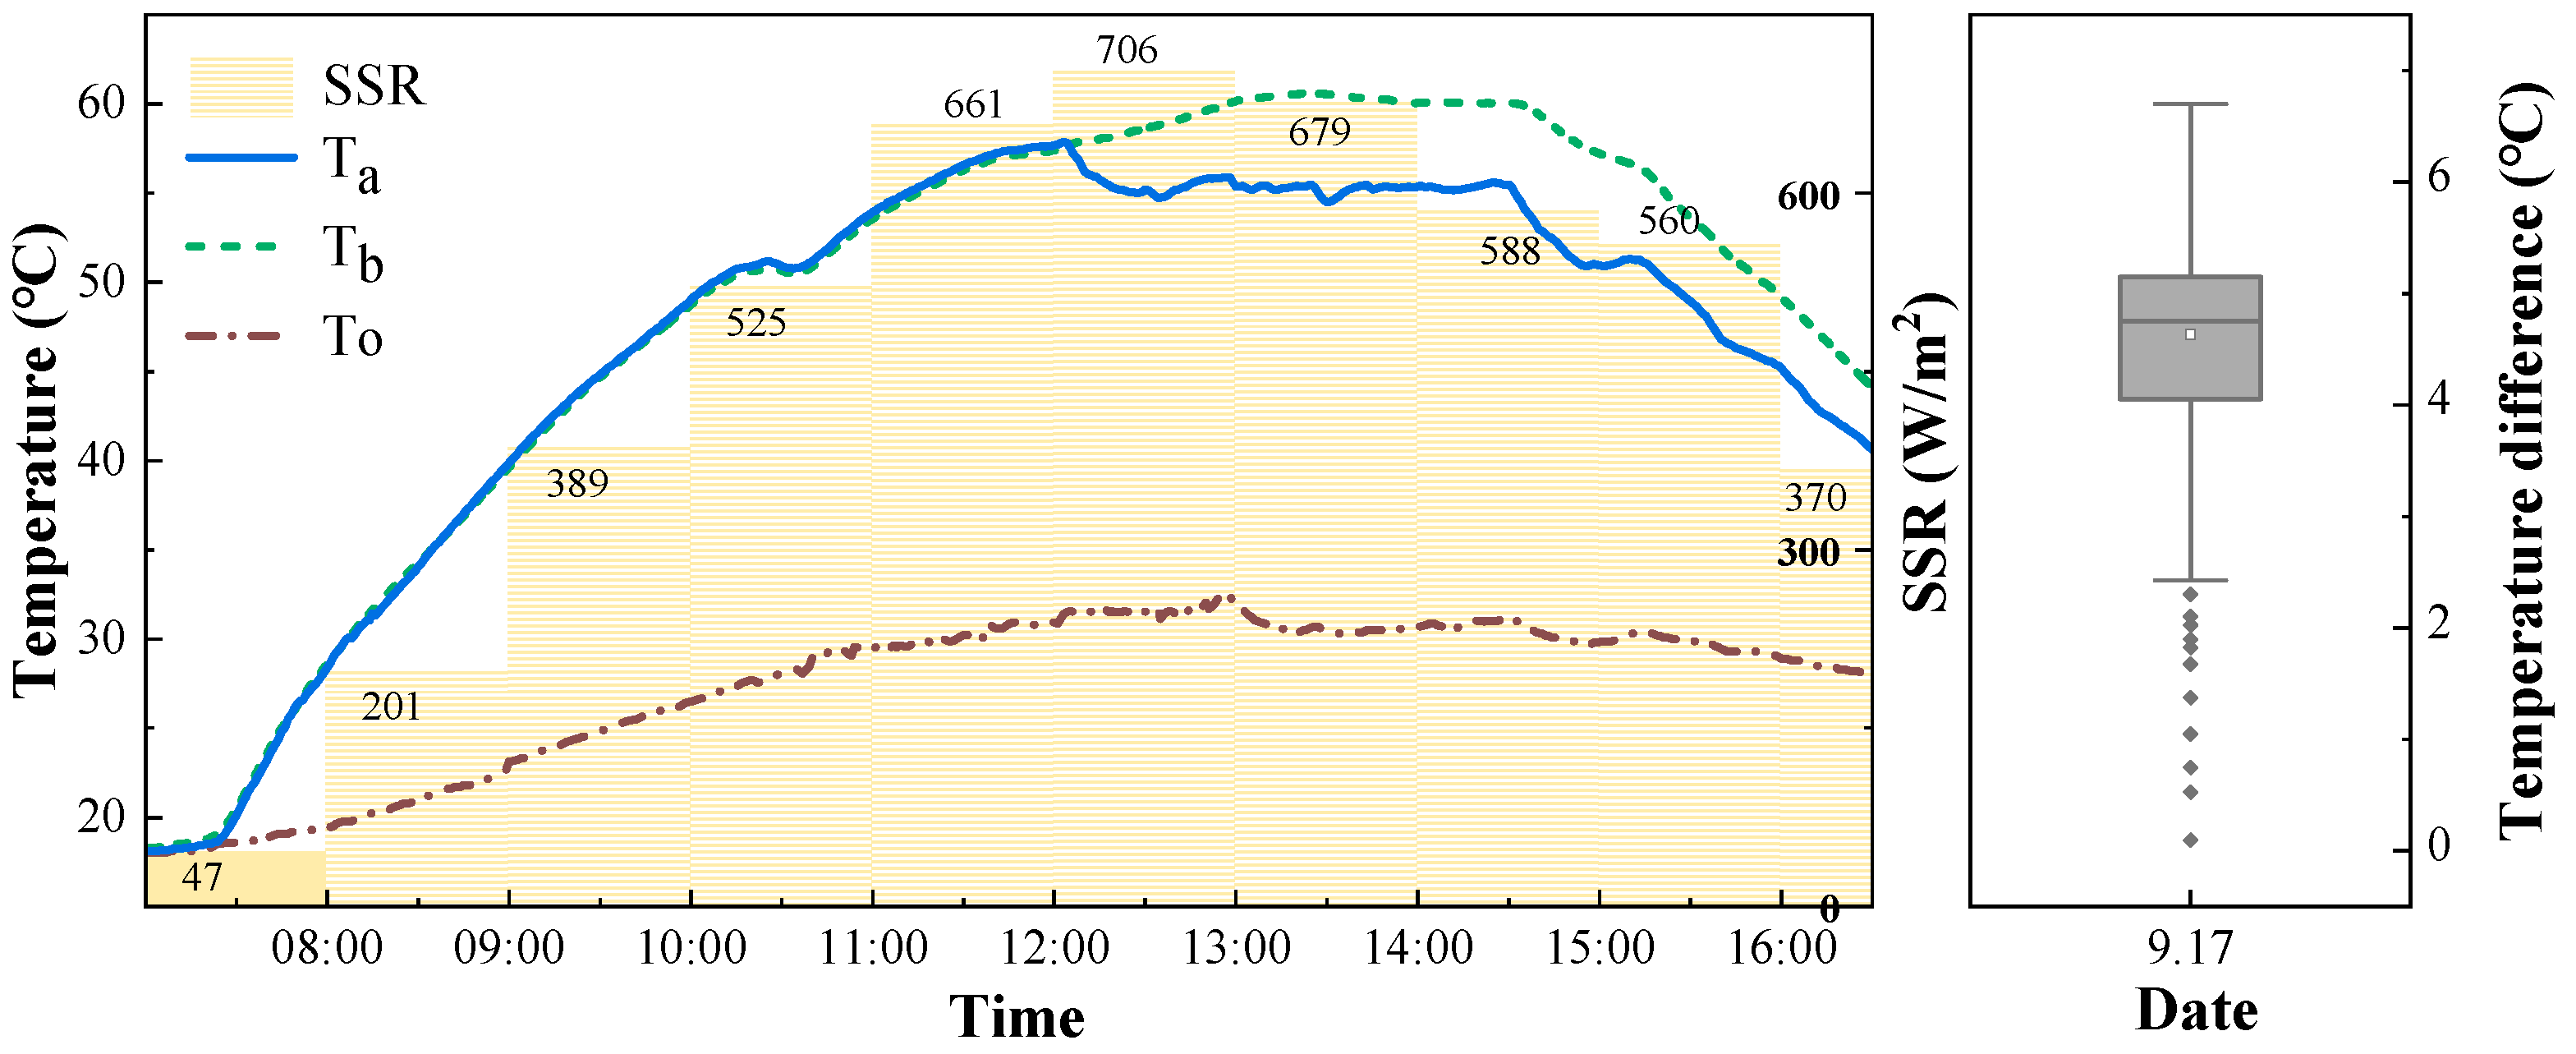
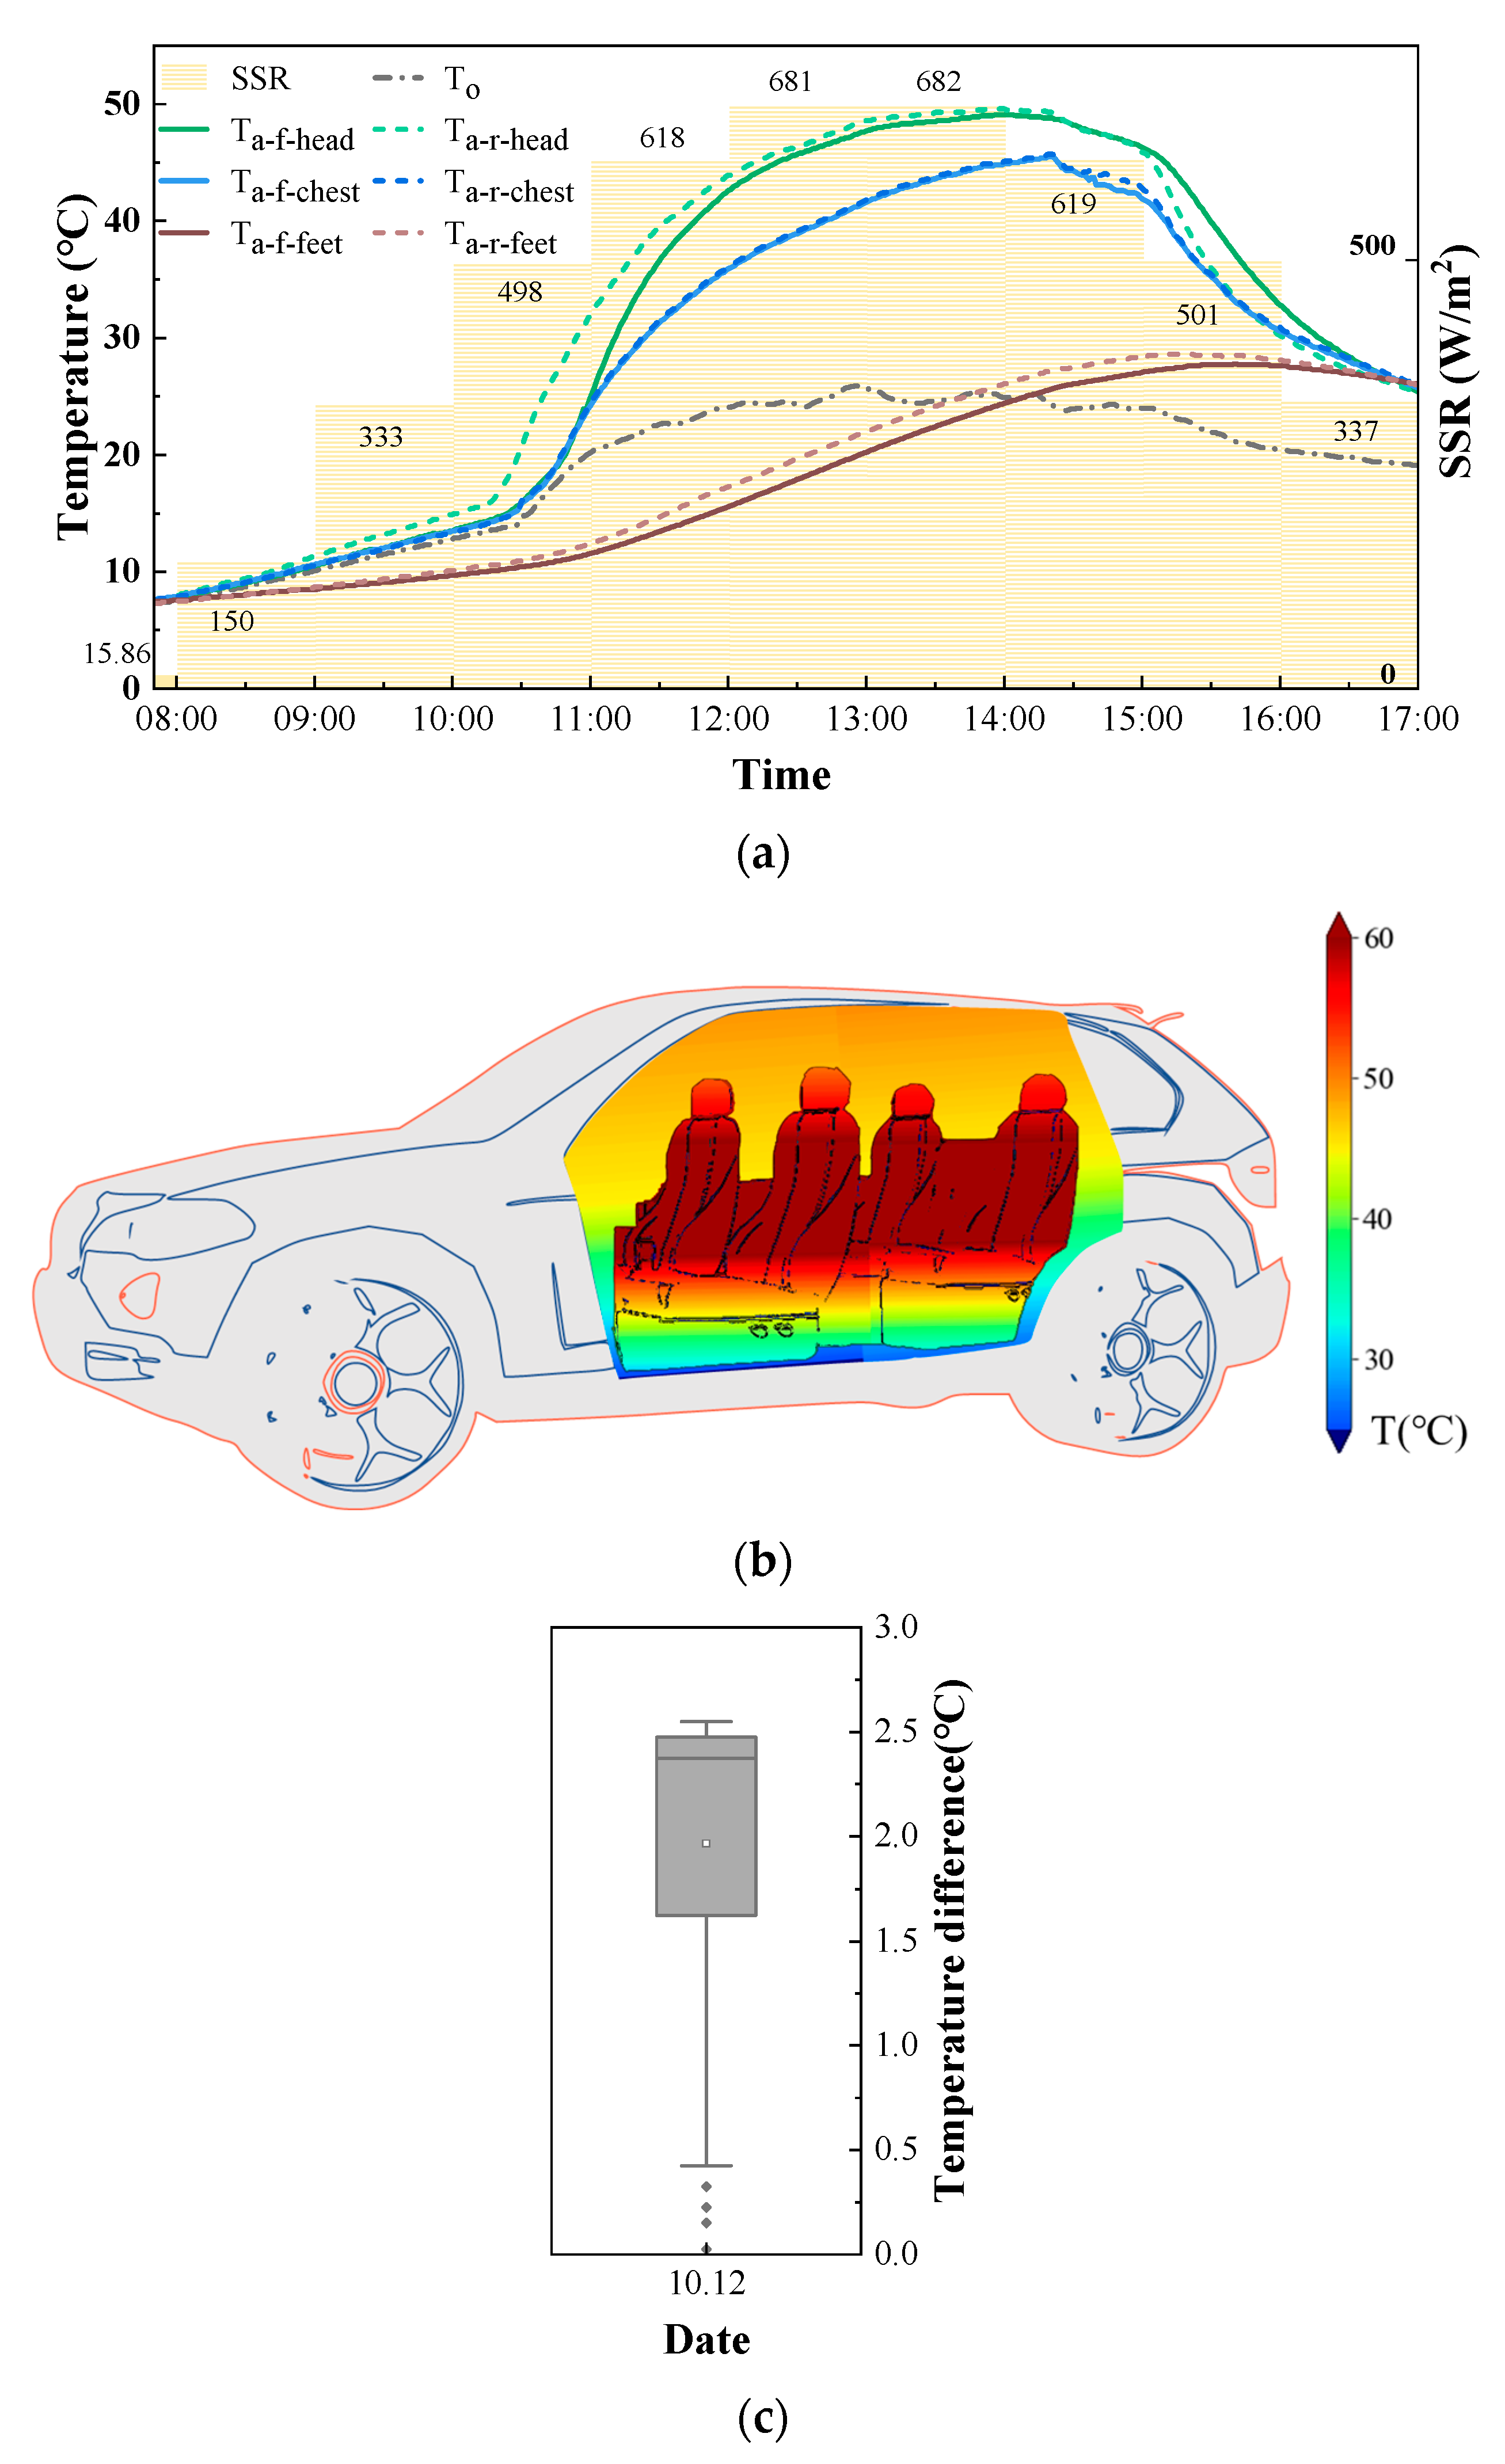
3.1. Typical Day Analysis
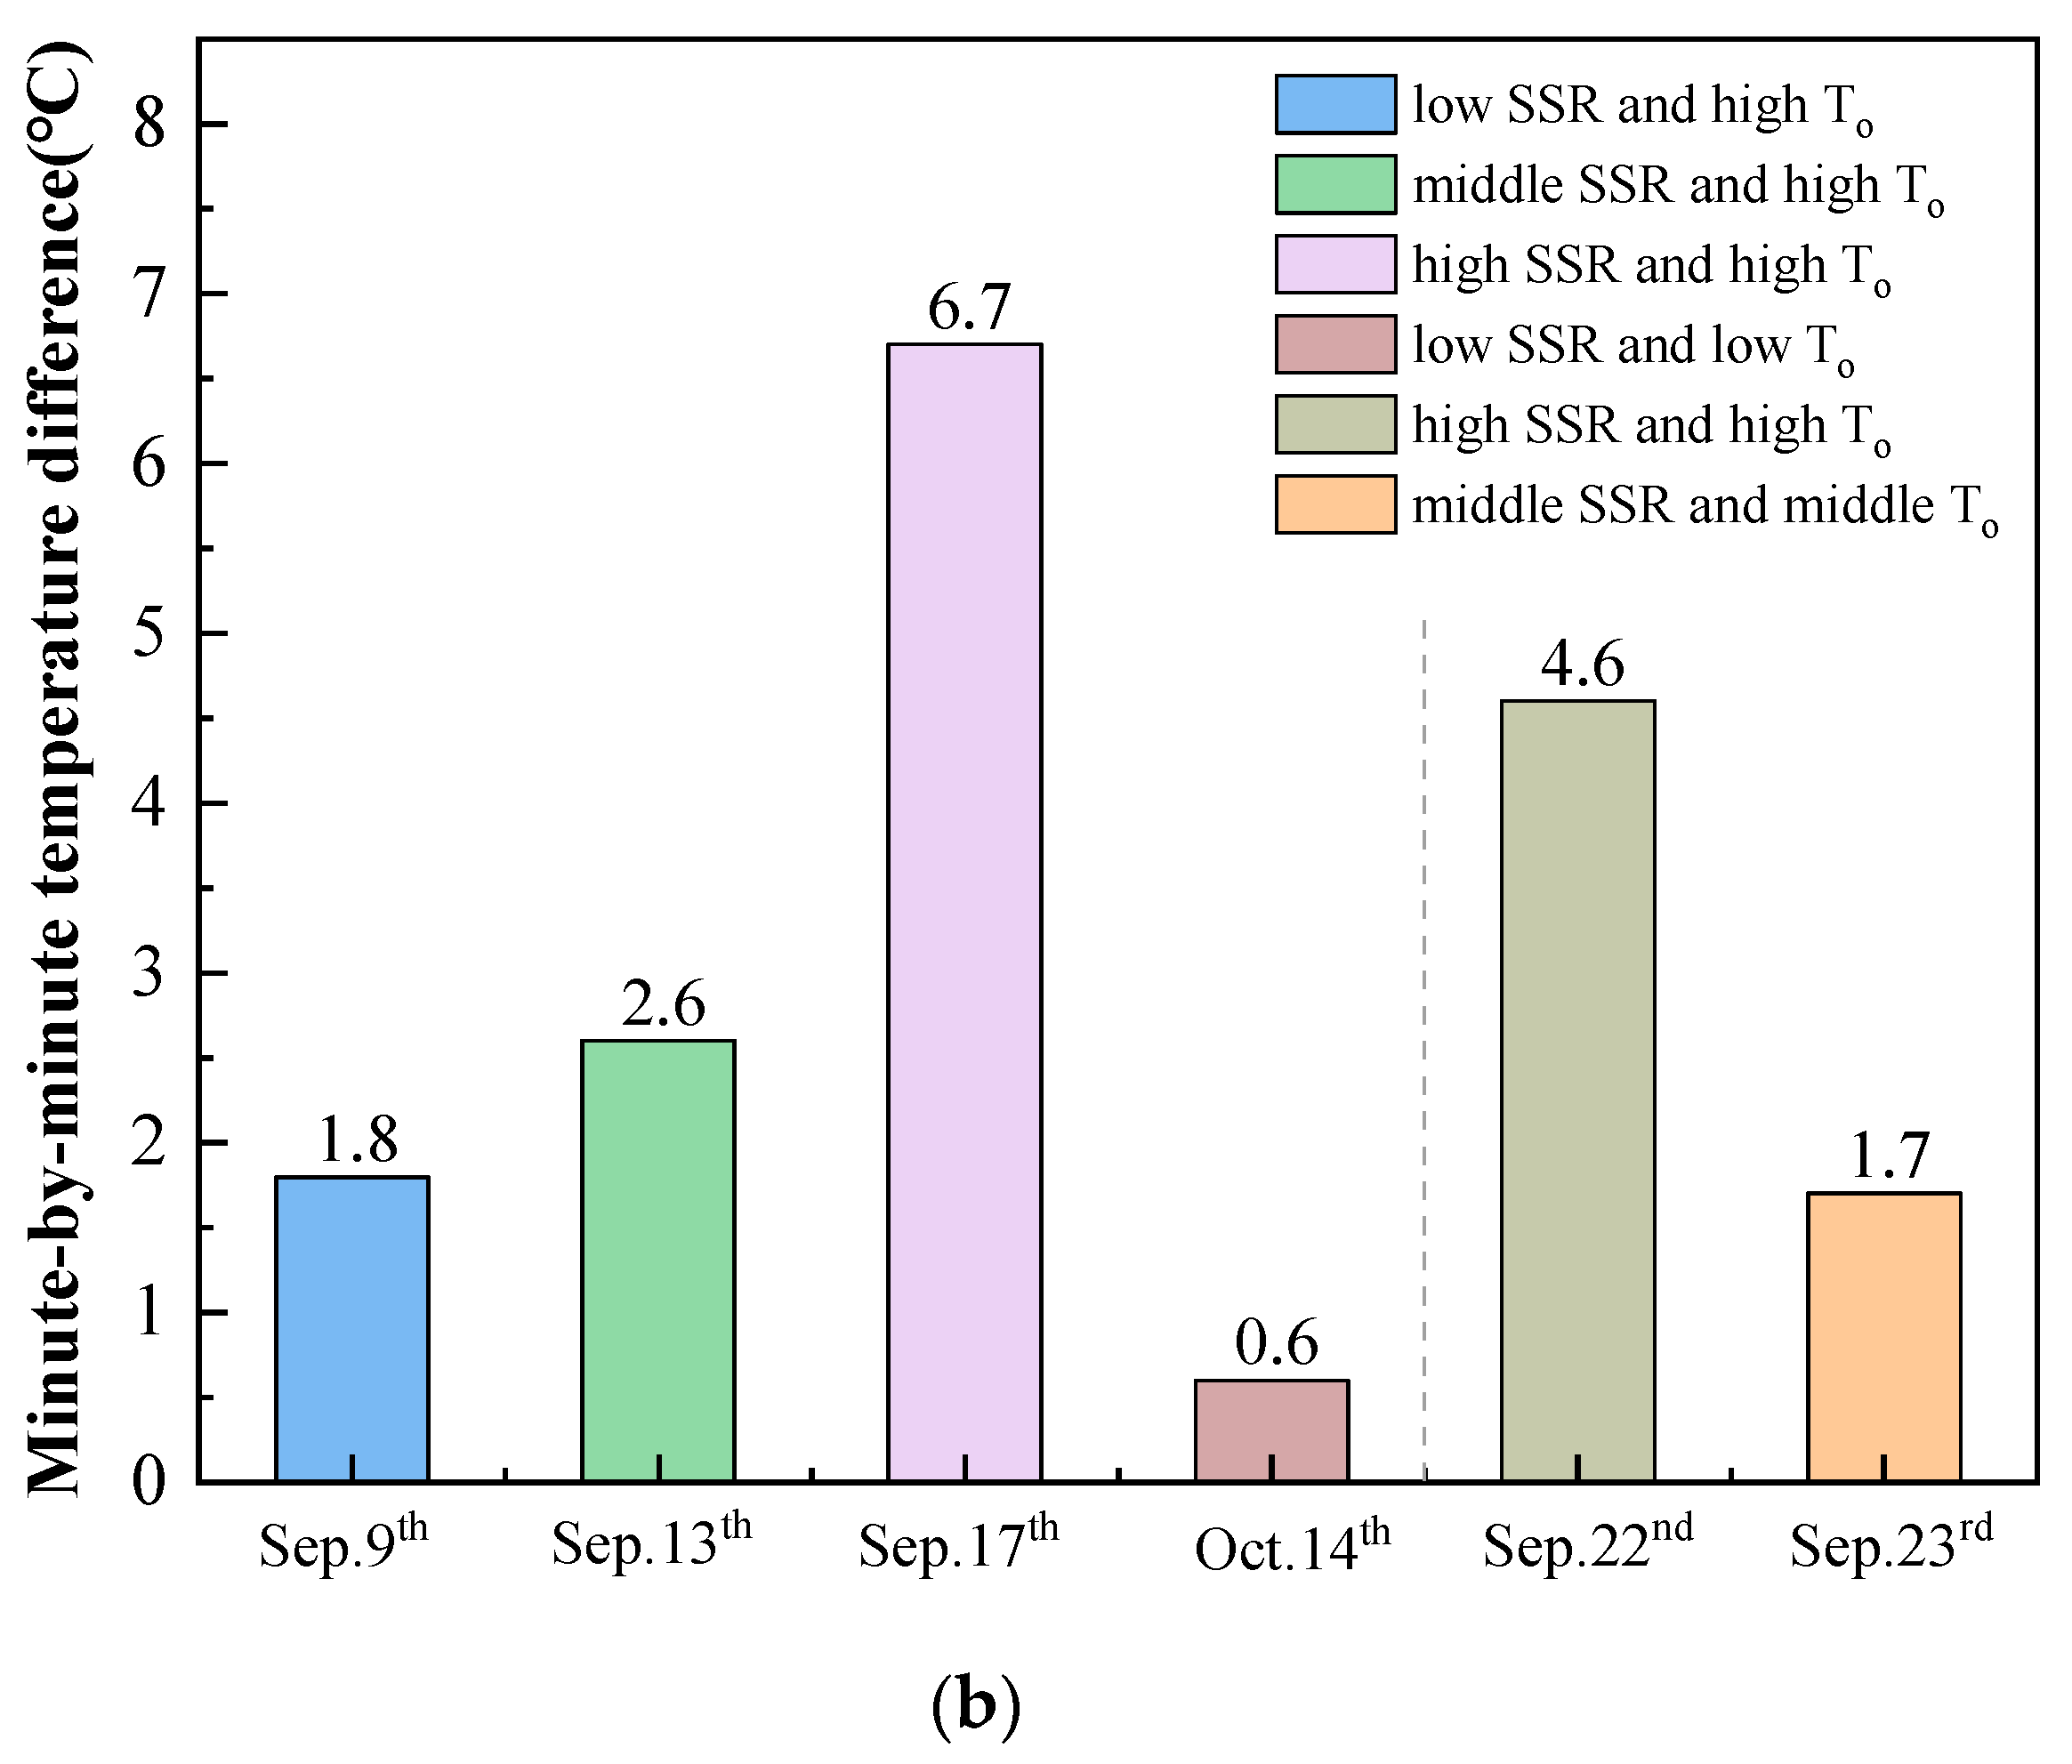
3.2. Effect of Ambient Temperature and Solar Surface Radiation
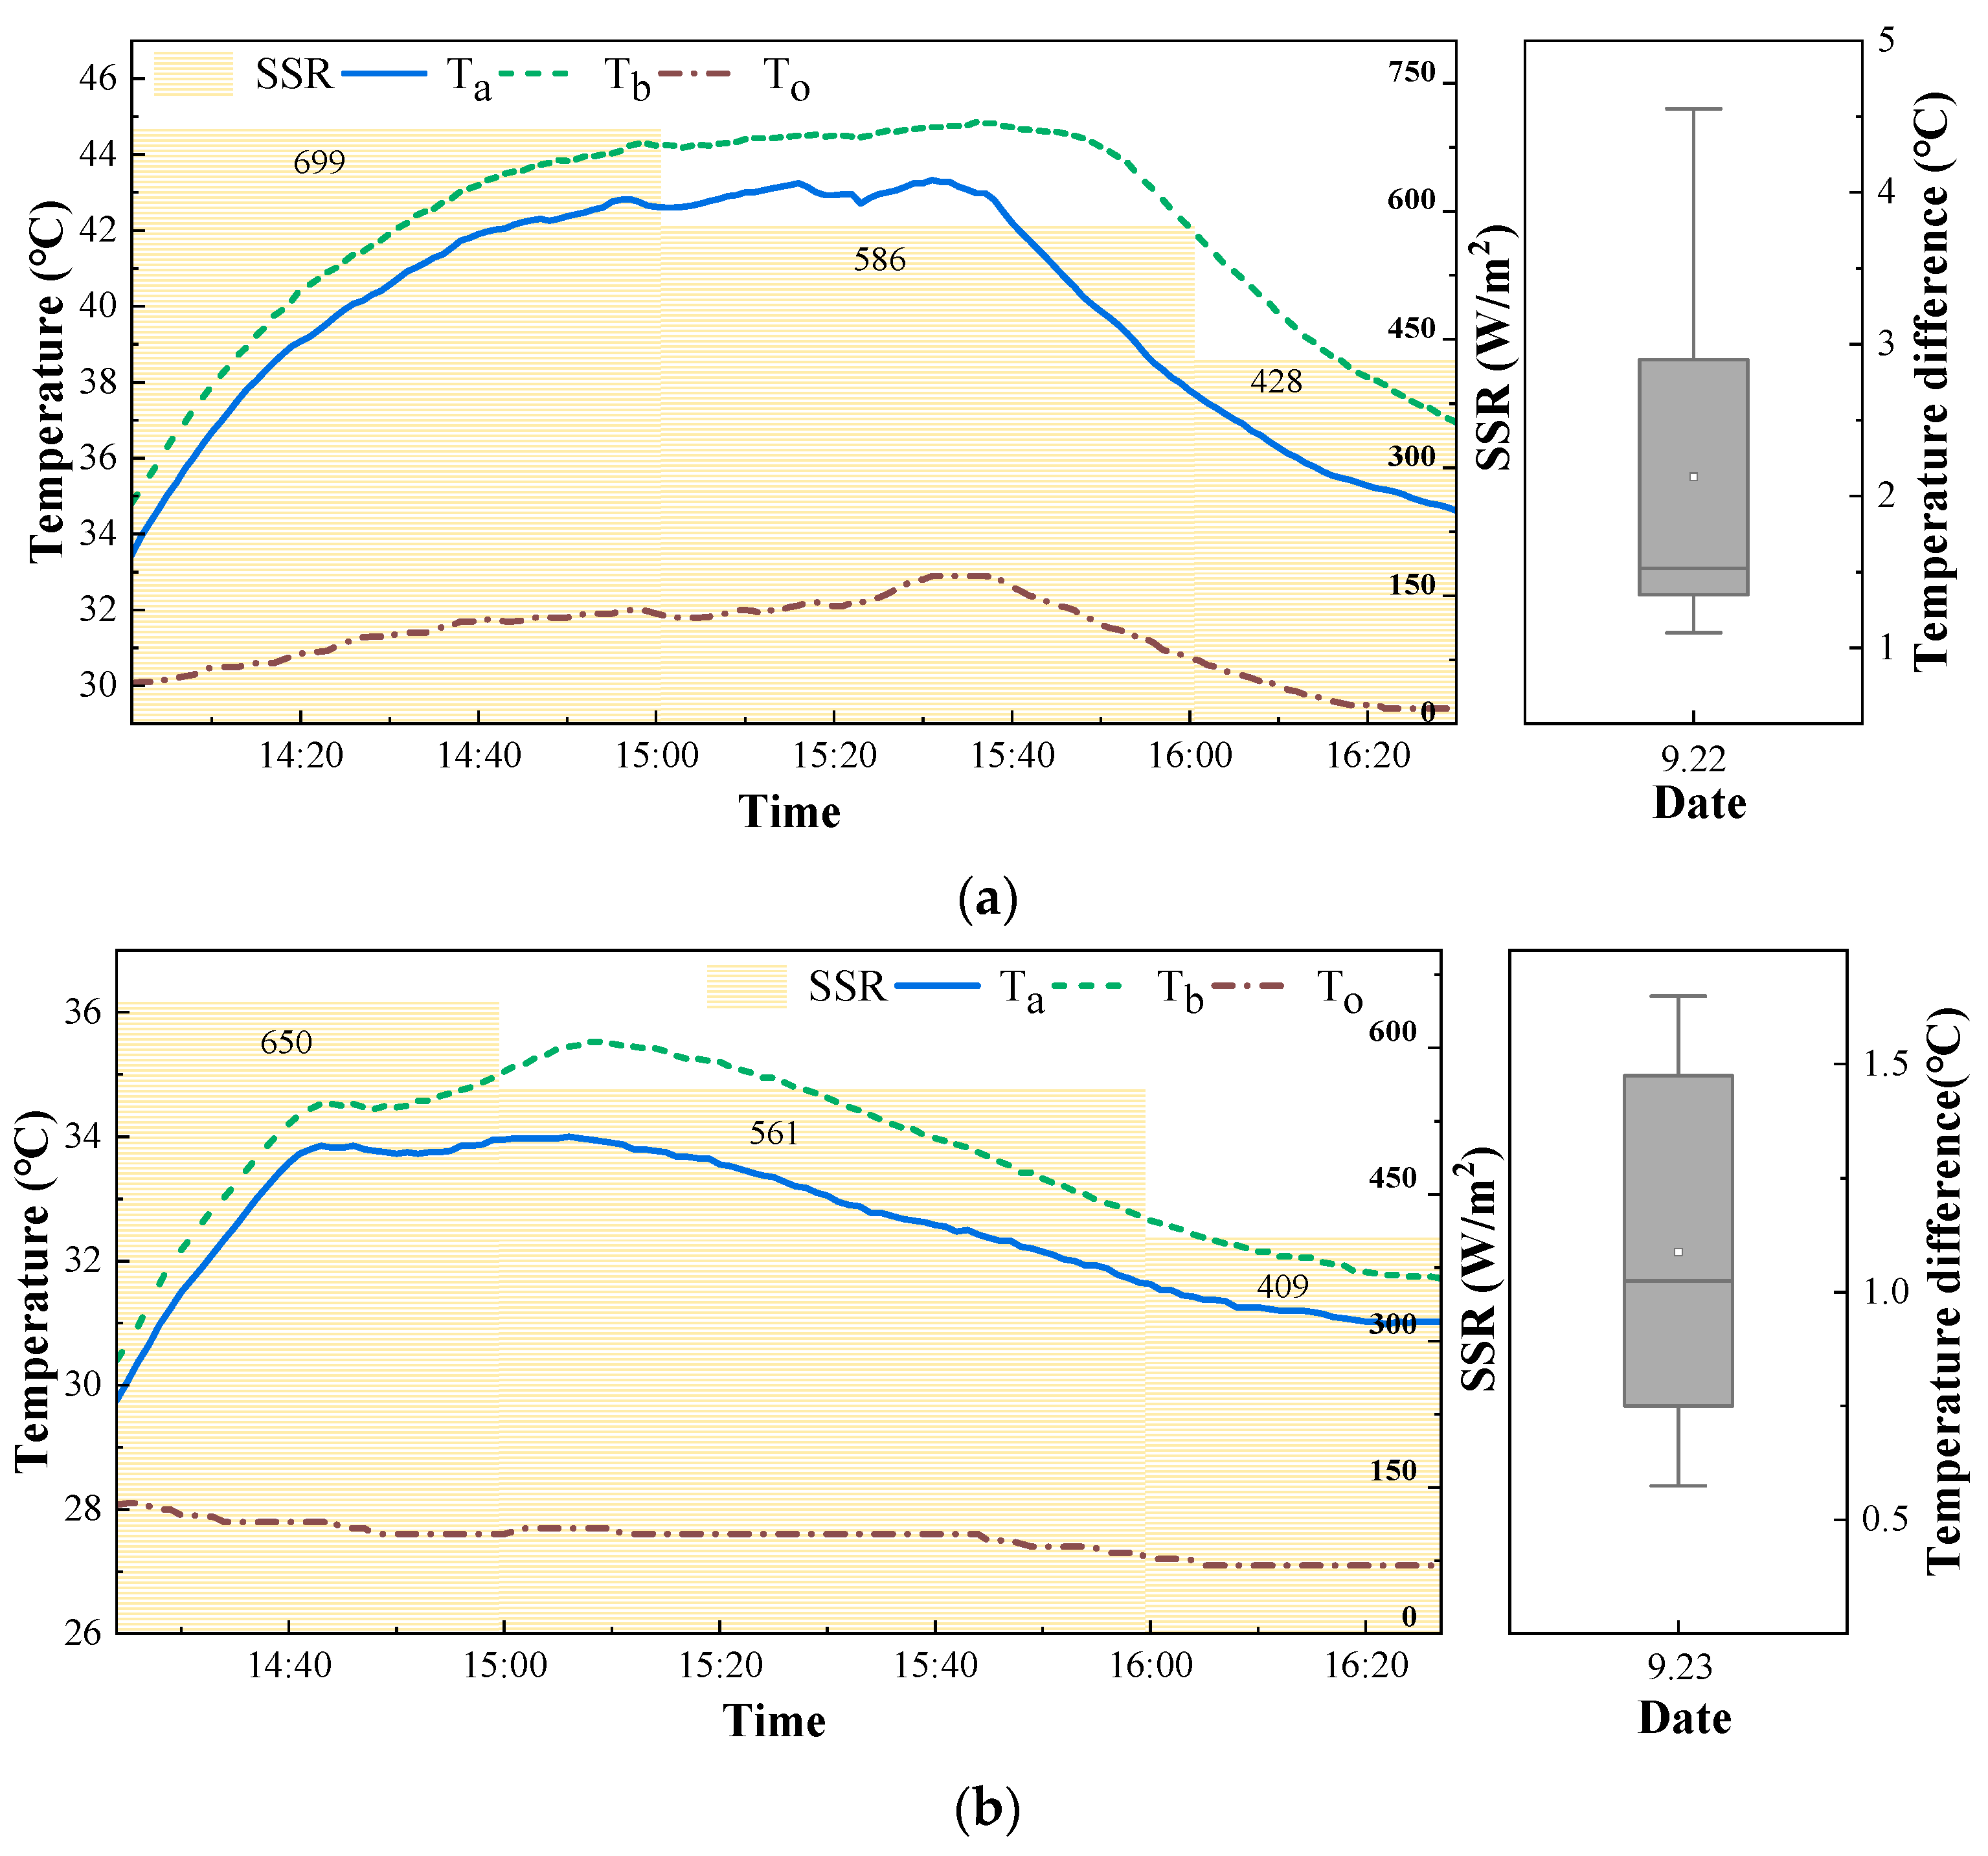
3.3. Effect of Window Opening Conditions
3.4. Temperature Differences at Different Locations
4. Discussion
4.1. Effect of Open-Window Gaps on the Cabin Air Temperature in Different Environmental Conditions
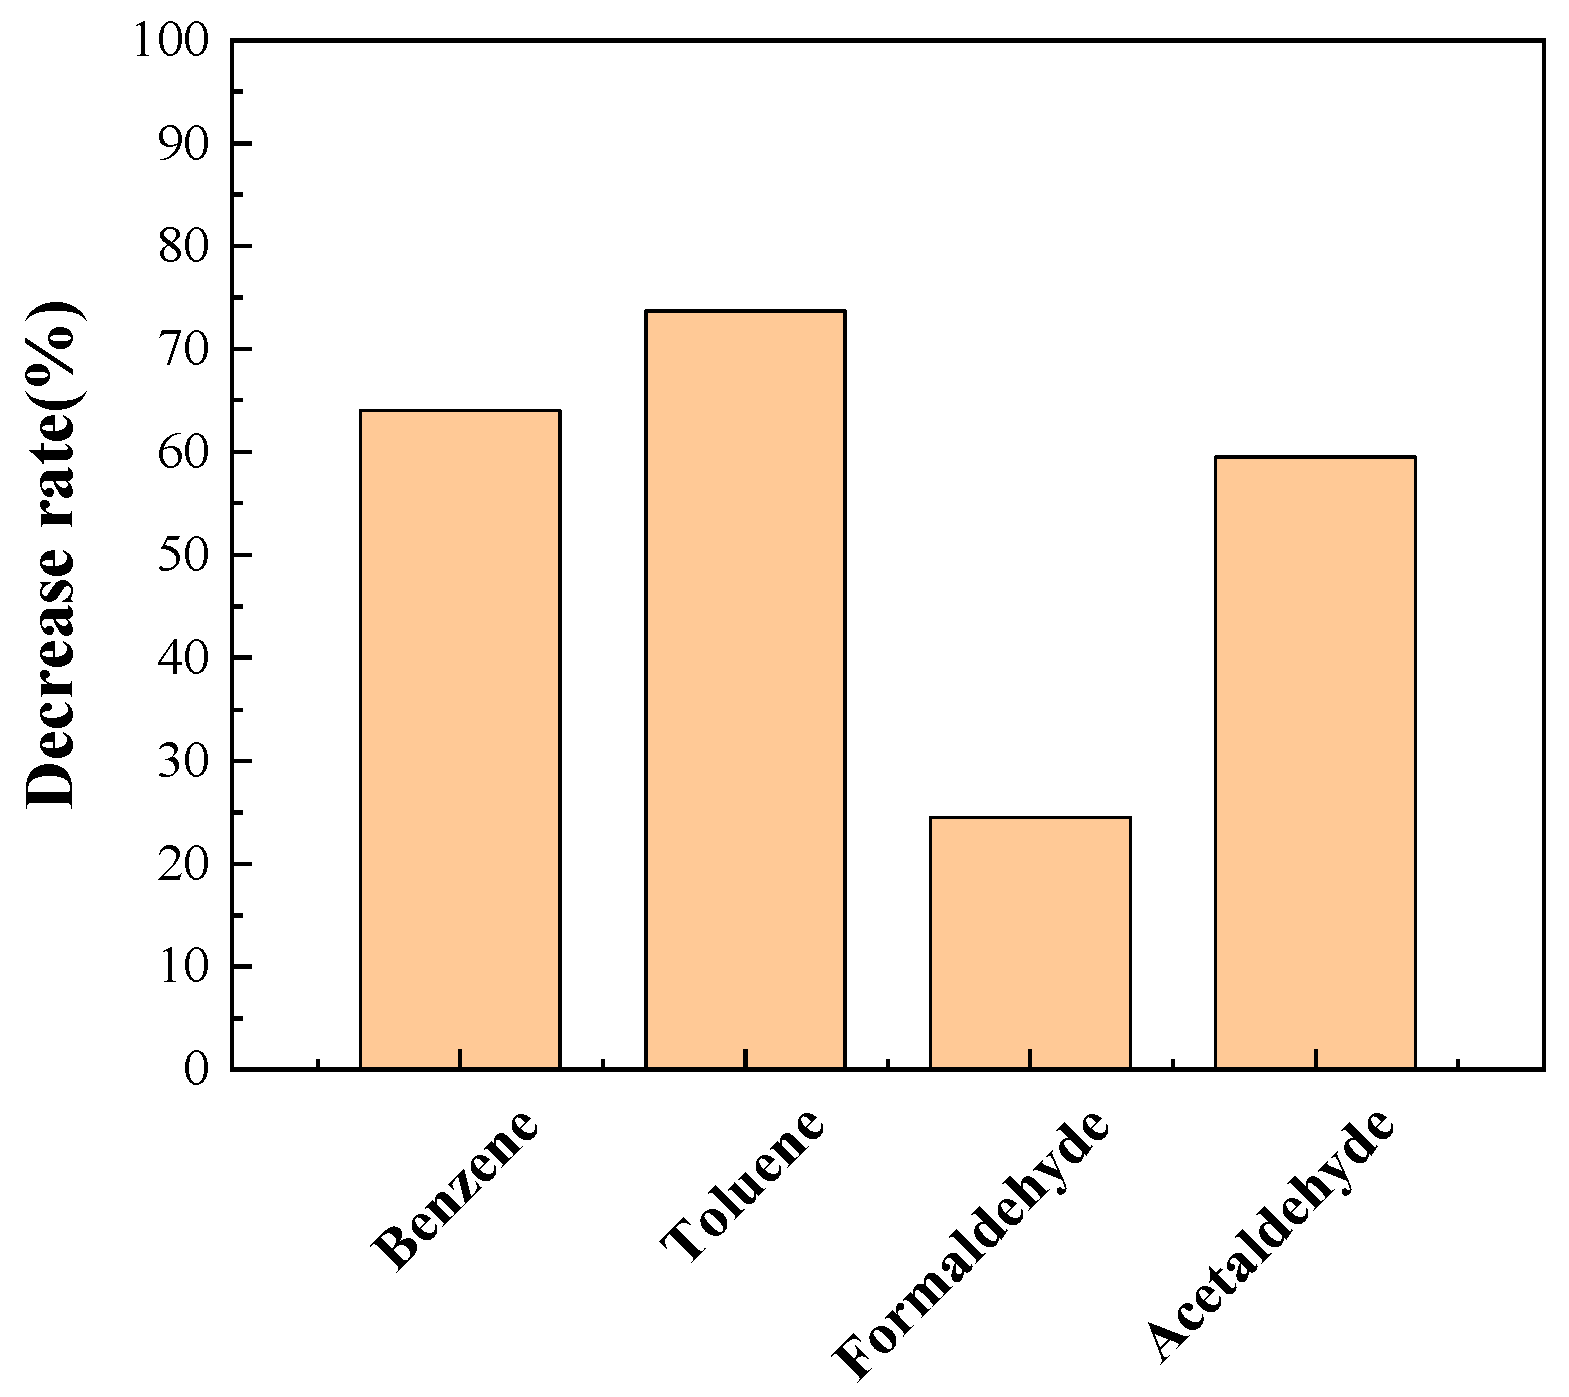
4.2. Effect of Open-Window Gaps on VOCs in the Cabin
5. Conclusions
- For high temperature and high SSR, the natural ventilation method of opening the window gaps can effectively reduce the temperature in the cabin, with a maximum temperature drop of 6.7 °C. Therefore, it is recommended to open the window gaps.
- For high temperatures without high SSR, it is acceptable to both open or close the windows. However, it is unnecessary to open the window when both ambient temperature and SSR are low. In this case, the window gap can only bring a temperature drop of 0.6 °C, which is insignificant.
- With the increased area of open windows, the cooling effect improves. It is beneficial to increase the number and area of open windows to ensure safety.
- In addition, the VOC concentration of the vehicle with open-window gaps is lower than that of the vehicle with closed windows owing to the temperature drop and ventilation.
Author Contributions
Funding
Institutional Review Board Statement
Informed Consent Statement
Data Availability Statement
Acknowledgments
Conflicts of Interest
Nomenclature
| To | outdoor ambient temperature (°C) |
| Ta | air temperature of vehicle A (°C) |
| Tb | air temperature of vehicle B (°C) |
| Tf | temperature at front row of vehicle (°C) |
| Tr | temperature at rear row of vehicle (°C) |
| Thead | temperature at the head height (°C) |
| Tchest | temperature at the chest height (°C) |
| Tfeet | temperature at the feet height (°C) |
| Tc | average temperature of air in cabin (°C) |
| SSR | surface solar radiation (W/m2) |
| wind direction (°) | |
| average wind direction (°) | |
| amount of measured data | |
| C0 | initial concentration of VOC (μg/m3) |
| C1 | final concentration of VOC (μg/m3) |
| R | VOC concentration reduction rate (%) |
| Subscript a | vehicle A |
| Subscript b | vehicle B |
References
- Zhang, L. Determination of Volatile Organic Compounds and Carbonyl Compounds in Cabin of Vehicle Under Natural Exposure. Master’s Thesis, Jilin University, Jilin, China, 2015. [Google Scholar]
- Grundstein, A.; Meentemeyer, V.; Dowd, J. Maximum Vehicle Cabin Temperatures Under Different Meteorological Conditions. Int. J. Biometeorol. 2009, 53, 255–261. [Google Scholar] [CrossRef] [PubMed]
- Guard, A.; Gallagher, S.S. Heat Related Deaths to Young Children in Parked Cars: An Analysis of 171 Fatalities in the United States, 1995–2002. Inj. Prev. 2005, 11, 33–37. [Google Scholar] [CrossRef] [PubMed]
- Adato, B.; Dubnov-Raz, G.; Gips, H.; Heled, Y.; Epstein, Y. Fatal Heat Stroke in Children Found in Parked Cars: Autopsy Findings. Eur. J. Pediatr. 2016, 175, 1249–1252. [Google Scholar] [CrossRef]
- Ferrara, P.; Vena, F.; Caporale, O.; del Volgo, V.; Liberatore, P.; Ianniello, F.; Chiaretti, A.; Riccardi, R. Children Left Unattended in Parked Vehicles: A Focus on Recent Italian Cases and a Review of Literature. Ital. J. Pediatr. 2013, 39, 71. [Google Scholar] [CrossRef]
- Brouwer, W.H.; Waterink, W.; van Wolffelaar, P.C.; Rothengatter, T. Divided Attention in Experienced Young and Older Drivers: Lane Tracking and Visual Analysis in a Dynamic Driving Simulator. Hum. Factors. 1991, 33, 573–582. [Google Scholar] [CrossRef]
- Hou, K.; Zhang, L.; Xu, X.; Yang, F.; Chen, B.; Hu, W. Ambient Temperatures Associated with Increased Risk of Motor Vehicle Crashes in New York and Chicago. Sci. Total Environ. 2022, 830, 154731. [Google Scholar] [CrossRef]
- Dadour, I.R.; Almanjahie, I.; Fowkes, N.D.; Keady, G.; Vijayan, K. Temperature Variations in a Parked Vehicle. Forensic Sci. Int. 2011, 207, 205–211. [Google Scholar] [CrossRef] [PubMed]
- Marty, W.; Sigrist, T.; Wyler, D. Temperature Variations in Automobiles in Various Weather Conditions. An Experimental Contribution to the Determination of Time of Death. Am. J. Forensic Med. Pathol. 2001, 22, 215–219. [Google Scholar] [CrossRef]
- Chaiyapinunt, S.; Khamporn, N. Effect of Solar Radiation on Human Thermal Comfort in a Tropical Climate. Indoor Built Environ. 2021, 30, 391–410. [Google Scholar] [CrossRef]
- Setiyo, M.; Waluyo, B.; Widodo, N.; Rochman, M.L.; Munahar, S.; Fatmaryanti, S.D. Cooling Effect and Heat Index (HI) Assessment on Car Cabin Cooler Powered by Solar Panel in Parked Car. Case Stud. Therm. Eng. 2021, 28, 101386. [Google Scholar] [CrossRef]
- Chan, M.Y.; Mak, C.W. Thermal Comfort Levels in a Room with Solar Radiation. Indoor Built Environ. 2008, 17, 516–524. [Google Scholar] [CrossRef]
- Ali, A.; Shakoor, R.; Raheem, A.; Muqeet, H.A.u.; Awais, Q.; Khan, A.A.; Jamil, M. Latest Energy Storage Trends in Multi-energy Standalone Electric Vehicle Charging Stations: A Comprehensive Study. Energies 2022, 15, 4727. [Google Scholar] [CrossRef]
- Yi, Z.; Xu, D.; Xu, J.; Qian, H.; Zhao, D.; Yang, R. Energy saving analysis of a transparent radiative cooling film for buildings with roof glazing. Energy Built Environ. 2021, 2, 214–222. [Google Scholar] [CrossRef]
- Hodder, S.G.; Parsons, K. The Effects of Solar Radiation on Thermal Comfort. Int. J. Biometeorol. 2007, 51, 233–250. [Google Scholar] [CrossRef] [PubMed]
- Yang, L.; Li, X.; Tu, J. Thermal Comfort Analysis of a High-Speed Train Cabin Considering the Solar Radiation Effects. Indoor Built Environ. 2020, 29, 1101–1117. [Google Scholar] [CrossRef]
- Bhavsar, S.C.; Solanki, P.D.C.; Bhatt, P.S.M.; Dataniya, J.P.; Student, M.E. Analysis of Temperature Variations in an Automobile Cabin Parked Under Sunlight. Int. J. Sci. Res. Dev. 2016, 4. Available online: http://www.ijsrd.com (accessed on 5 July 2022).
- Levinson, R.; Pan, H.; Ban-Weiss, G.; Rosado, P.; Paolini, R.; Akbari, H. Potential Benefits of Solar Reflective Car Shells: Cooler Cabins, Fuel Savings and Emission Reductions. Appl. Energy. 2011, 88, 4343–4357. [Google Scholar] [CrossRef]
- Al-Kayiem, H.H.; Bin, M.F.; Sidik, M.; Yuganthira, R.A.L. Munusammy, Study on the Thermal Accumulation and Distribution Inside a Parked Car Cabin. Am. J. Appl. Sci. 2010, 7, 784–789. Available online: https://www.researchgate.net/publication/46179184 (accessed on 5 July 2022). [CrossRef]
- Wei, N.; Zheng, M. Influence of Environmental Factors and Vehicle Factors on VOC Volatilization Characteristics in Automobiles. Chem. Eng. Trans. 2018, 71, 331–336. [Google Scholar] [CrossRef]
- Yoshida, T.; Matsunaga, I.; Tomioka, K.; Kumagai, S. Interior Air Pollution in Automotive Cabins by Volatile Organic Compounds Diffusing from Interior Materials: I. Survey of 101 Types of Japanese Domestically Produced Cars for Private Use. Indoor Built Environ. 2006, 15, 425–444. [Google Scholar] [CrossRef]
- Xu, B.; Chen, X.; Xiong, J. Air Quality Inside Motor Vehicles’ Cabins: A Review. Indoor Built Environ. 2018, 27, 452–465. [Google Scholar] [CrossRef]
- Fedoruk, M.J.; Kerger, B.D. Measurement of Volatile Organic Compounds Inside Automobiles. J. Expo. Anal. Environ. Epidemiol. 2003, 13, 31–41. [Google Scholar] [CrossRef] [PubMed]
- Yoshida, T.; Matsunaga, I. A Case Study on Identification of Airborne Organic Compounds and Time Courses of Their Concentrations in the Cabin of a New Car for Private Use. Environ. Int. 2006, 32, 58–79. [Google Scholar] [CrossRef] [PubMed]
- Crépat, G.; Fritsch, R. Urban Air Pollution by Automobiles. Indoor Built Environ. 1997, 6, 309–310. [Google Scholar] [CrossRef]
- Crépat, G.; Fritsch, R. Automobile Pollution and Health: Latest Developments in Technologies, Fuels and Regulations. Indoor Built Environ. 1999, 8, 332–333. [Google Scholar] [CrossRef]
- Lemian, D.; Bode, F. Battery-Supercapacitor Energy Storage Systems for Electrical Vehicles: A Review. Energies 2022, 15, 5683. [Google Scholar] [CrossRef]
- Milev, G.; Hastings, A.; Al-Habaibeh, A. The Environmental and Financial Implications of Expanding the Use of Electric Cars—A Case Study of Scotland. Energy Built Environ. 2021, 2, 204–213. [Google Scholar] [CrossRef]
- Lahlou, A.; Ossart, F.; Boudard, E.; Roy, F.; Bakhouya, M. Optimal Management of Thermal Comfort and Driving Range in Electric Vehicles. Energies 2020, 13, 4471. [Google Scholar] [CrossRef]
- Huang, X.; Li, K.; Xie, Y.; Liu, B.; Liu, J.; Liu, Z.; Mou, L. A Novel Multistage Constant Compressor Speed Control Strategy of Electric Vehicle Air Conditioning System Based on Genetic Algorithm. Energy. 2022, 241, 122903. [Google Scholar] [CrossRef]
- Farrington, R.; Rugh, J. Impact of Vehicle Air-Conditioning on Fuel Economy, Tail-Pipe Emissions, and Electric Vehicle Range. 2000. Available online: https://www.osti.gov/servlets/purl/764573 (accessed on 5 July 2022).
- Türler, D.; Hopkins, D.; Goudey, H. Reducing Vehicle Auxiliary Loads Using Advanced Thermal Insulation and Window Technologies; SAE technical paper; SAE International: Warrendale, PA, USA, 2003. [Google Scholar] [CrossRef]
- Soulios, V.; Loonen, R.C.G.M.; Metavitsiadis, V.; Hensen, J.L.M. Computational Performance Analysis of Overheating Mitigation Measures in Parked Vehicles. Appl. Energy 2018, 231, 635–644. [Google Scholar] [CrossRef]
- Zhang, H.; Dai, L.; Xu, G.; Li, Y.; Chen, W.; Tao, W. Studies of Air-Flow and Temperature Fields Inside a Passenger Compartment for Improving Thermal Comfort and Saving Energy. Part II: Simulation Results and Discussion. Appl. Therm. Eng. 2009, 29, 2028–2036. [Google Scholar] [CrossRef]
- Chang, Z.; Yi, K.; Liu, W. A New Ventilation Mode of Air Conditioning in Subway Vehicles and Its Air Distribution Performance. Energy Built Environ. 2021, 2, 94–104. [Google Scholar] [CrossRef]
- Kolhe, M.; Adhikari, S.K.; Muneer, T. Parked Electric Car’s Cabin Heat Management Using Photovoltaic Powered Ventilation System. Appl. Energy 2019, 233–234, 403–411. [Google Scholar] [CrossRef]
- Kolhe, M.; Muneer, T.; Adhikari, S.K. Parked Electric Vehicle’s Cabin Temperature Management Using Photovoltaic Powered Ventilation. Energy Procedia 2017, 142, 343–349. [Google Scholar] [CrossRef]
- Sudhir, C.V.; Al Dhali, J.M. Effect of Solar Ventilation on Air Conditioning System Performance of the Car Parked Under Sun Light. ARPN J. Eng. Appl. Sci. 2015, 10, 10618–10626. Available online: https://www.arpnjournals.com (accessed on 5 July 2022).
- Jaiswal, G.K.; Gandhi, M.; Phalgaonkar, S.; Upadhyay, H.; Agrawal, A.; Rajamohan, V.; Ganesan, K. Design of a Smart Automotive Ventilation System for a Parked Car. Int. J. Theor. Appl. Res. Mech. Eng. 2012, 1, 83–88. [Google Scholar]
- McLaren, C.; Null, J.; Quinn, J. Heat Stress from Enclosed Vehicles: Moderate Ambient Temperatures Cause Significant Temperature Rise in Enclosed Vehicles. Pediatrics 2005, 116, e109–e112. [Google Scholar] [CrossRef]
- King, K.; Negus, K.; Vance, J.C. Heat Stress in Motor Vehicles: A Problem in Infancy. Pediatrics 1981, 68, 579–582. [Google Scholar] [CrossRef]
- Zhang, W. Study on the Key Technology of Thermal Environment and Occupant’s Thermal Comfort Analysis in Vehicle. Ph.D. Thesis, South China University of Technology, Guangdong, China, 2013. [Google Scholar]
- Yao, Z.; Li, Z. Comparison of Three Methods for Real-Time Calculation of Wind Direction Standard Deviation. J. Appl. Meteorol. Sci. 1990, 03, 324–330. (In Chinese) [Google Scholar]
- Fang, Z.; Liu, H.; Li, B.; Tan, M.; Olaide, O.M. Experimental Investigation on Thermal Comfort Model Between Local Thermal Sensation and Overall Thermal Sensation. Energy Build. 2018, 158, 1286–1295. [Google Scholar] [CrossRef]
- Meaden, G.T.; Kochev, S.; Kolendowicz, L.; Kosa-Kiss, A.; Marcinoniene, I.; Sioutas, M.; Tooming, H.; Tyrrell, J. Comparing the Theoretical Versions of the Beaufort Scale, the T-Scale and the Fujita Scale. Atmos. Res. 2007, 83, 446–449. [Google Scholar] [CrossRef]
- Wang, H.; Tong, L.; Xiong, J. Prediction of in-Vehicle VOC Concentrations Based on Small-Scale Chamber Test. Beijing Ligong Da Xue. Xuebao Trans. Beijing Inst. Technol. 2022, 42, 145–151. [Google Scholar] [CrossRef]


| Name | Instrument Type | Measurement Content | Measurement Range | Accuracy | Resolution |
|---|---|---|---|---|---|
| Anemometer | Gill Wind Sonic | wind speed | Speed: 0–60 m/s; Direction: 0–359° | ±2% ±3° | 0.01 m/s; 1° |
| Temperature data recorder | TR-71wb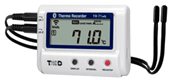 | Air temperature | −40–110 °C | ±0.3 °C | 0.1 °C |
| Thermocouple | WRNK-191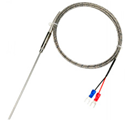 | Interior surface temperature | −100–200 °C | ±0.4% | 0.1 °C |
| Thermal imager | FLIR E85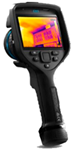 | Shell surface temperature | −20–120 °C; 0–650 °C; 300–1200 °C | ±2 °C | 384 × 288 |
| Date | Vehicle Number | Number of Open Windows | Total Open-Window Area (m2) |
|---|---|---|---|
| 9 September | A | Four | 0.070 |
| B | / | / | |
| 13 September | A | Four | 0.070 |
| B | / | / | |
| 17 September | A | Four | 0.056 |
| B | / | / | |
| 22 September | A | Four | 0.070 |
| B | Two | 0.035 | |
| 23 September | A | Four | 0.070 |
| B | Four | 0.056 | |
| 12 October | A | Four | 0.056 |
| B | Two | 0.028 | |
| 14 October | A | Four | 0.056 |
| B | / | / |
| Date | 17 September |
|---|---|
| Average outdoor air temperature (°C) | 27.3 |
| Maximum outdoor air temperature (°C) | 32.4 |
| Average wind speed (m/s) | 0.78 |
| Average wind direction (°) | 252 |
| Data | 9 September | 13 September | 14 October |
|---|---|---|---|
| Average outdoor air temperature (°C) | 29.8 | 29.2 | 19.3 |
| Maximum outdoor air temperature (°C) | 30.6 | 29.9 | 20.4 |
| Average wind speed (m/s) | 0.33 | 0.46 | 0.88 |
| Average wind direction | 218° | 140° | 147° |
| Data | 22 September | 23 September |
|---|---|---|
| Average outdoor air temperature (°C) | 31.3 | 27.5 |
| Maximum outdoor air temperature (°C) | 32.9 | 28.1 |
| Average wind speed (m/s) | 1.02 | 0.89 |
| Average wind direction | 242° | 252° |
| Data | 12 October |
|---|---|
| Average outdoor air temperature (°C) | 19.1 |
| Maximum outdoor air temperature (°C) | 25.9 |
| Average wind speed (m/s) | 0.60 |
| Average wind direction | 207° |
Publisher’s Note: MDPI stays neutral with regard to jurisdictional claims in published maps and institutional affiliations. |
© 2022 by the authors. Licensee MDPI, Basel, Switzerland. This article is an open access article distributed under the terms and conditions of the Creative Commons Attribution (CC BY) license (https://creativecommons.org/licenses/by/4.0/).
Share and Cite
Ding, X.; Zhang, W.; Yang, Z.; Wang, J.; Liu, L.; Gao, D.; Guo, D.; Xiong, J. Effect of Open-Window Gaps on the Thermal Environment inside Vehicles Exposed to Solar Radiation. Energies 2022, 15, 6411. https://doi.org/10.3390/en15176411
Ding X, Zhang W, Yang Z, Wang J, Liu L, Gao D, Guo D, Xiong J. Effect of Open-Window Gaps on the Thermal Environment inside Vehicles Exposed to Solar Radiation. Energies. 2022; 15(17):6411. https://doi.org/10.3390/en15176411
Chicago/Turabian StyleDing, Xiaoxiao, Weirong Zhang, Zhen Yang, Jiajun Wang, Lingtao Liu, Dalong Gao, Dongdong Guo, and Jianyin Xiong. 2022. "Effect of Open-Window Gaps on the Thermal Environment inside Vehicles Exposed to Solar Radiation" Energies 15, no. 17: 6411. https://doi.org/10.3390/en15176411
APA StyleDing, X., Zhang, W., Yang, Z., Wang, J., Liu, L., Gao, D., Guo, D., & Xiong, J. (2022). Effect of Open-Window Gaps on the Thermal Environment inside Vehicles Exposed to Solar Radiation. Energies, 15(17), 6411. https://doi.org/10.3390/en15176411