Abstract
High power electromagnetics (HPEMs) pose a potential threatening risk to the wireless communication system, especially according to the main coupling path of the RF front-end channel. SPICE modeling of the responses coupled on the RF channel is crucial for the EM risk assessment, which helps us learn more about how the pulse conducts on the RF channel. A simplified linear RF channel with pyramid horn antenna is taken as an example by the selection of the key electronic modules of the actual wireless system. This paper proposes a system-level SPICE circuit model for the simplified RF channel according to the hybrid methods of the antenna electromagnetic simulation and SPICE modeling of the RF circuit. The equivalent circuits of the horn antenna illuminated by HPEMs are established with the Vector Fitting method based on Thevenin and Norton theorems. The short current response as the excitation files for the SPICE models are obtained by the commercial electromagnetic simulation of the horn antenna illuminated by Multiple HPEM environments. Equivalent circuits of a micro-strip bandpass filter are also derived with type circuit structure based on the measured admittance data. Then we analyze the HPEM risk faced by the RF channel by considering multiple HPEM environments. The norm theory is utilized to analyze the waveform characteristics from electric fields of HPEMs to the responses of the RF channel. The ratios of the responses versus electric field for each norm are computed and the EM risk degree is ranked based on those results. The results demonstrate that high power microwave is the highest threatening risk for the linear RF channel compared to the other two HPEMs such as ultra-wide band, high altitude electromagnetic pulse. Finally, the flowchart of EM risk assessment is presented based on a previous analysis, which will benefit the EMC design in engineering.
1. Introduction
In recent years, the susceptibility and vulnerability of electronic systems threatened by high power electromagnetics (HPEM) such as high-altitude electromagnetic pulse (HEMP), ultra-wide bandwidth (UWB) and high-power microwave (HPM) etc., have been paid more attention from researchers [1,2]. As antennas of wireless communication systems are usually exposed to free space, the electromagnetic (EM) coupling response of the RF front-end may possibly cause the permanent destruction or performance degradation of RF circuits inside the wireless equipment [3]. Studying how the electromagnetic pulse (EMP) conducts on the RF channel is the key to evaluate the potential risk of multiple HPEM threats faced by the wireless communication system, and it requires the system-level SPICE modelling technology of the RF channel consisting of wireless antenna and RF components etc., considering the HPEM illumination scenarios.
The wireless communication system with the L band works on the frequency range of 1 GHz~2 GHz, is widely applied in radar navigation, mobile communication and satellite communication fields facing on a variety of HPEM environments. In practice, the circuit details of the targeted system usually cannot be provided to researchers from the manufacturer due to commercial secrets, which may cause difficulties in circuit modeling and response analysis. Hence, trying to establish the system-level SPICE model of the response coupled on the RF channel according to the measured data of the targeted system, and then using norm theory to analyze these responses excited from multiple HPEM waves to evaluate the potential EM risk suffered by the RF channel, is the main issue in this paper.
System-level SPICE circuit modeling of EMP response coupling on the RF channel is the way to study the pulse energy propagation along the RF channel, which mainly consists of the SPICE modeling of antenna HPEM response and RF components. Much effort has been devoted to the equivalent circuits of RF components such as antennas or filters [4,5,6,7,8,9,10,11]. Antenna response after EMP illumination is mainly calculated by the typical electromagnetic methods such as MoM, FDTD [4,5], or simulated with commercial software such as CST or HFSS etc. The traditional equivalent circuit model of the dipole antenna was adopted to compute the antenna response after HEMP illumination in [6]. However, this antenna model is narrowband and not suitable for the wide frequency range due to the super wideband feature of EMPs. In [10], an equivalent circuit model for the broadband antenna was established with rational function approximation by the vector fitting (VF) method [12,13,14,15], which is deemed as an efficient method and is particular suitable for SPICE circuit modeling. Gao X. presents a SPICE model of a paraboloid antenna for receiving based on the Thevenin theorem [11]. It is an efficient way to utilize the Thevenin or Norton theorem to obtain the equivalent circuits of the antenna response illuminated by HPEMs with the VF method, which will be applied to the SPICE model of the RF channel in this paper. However, no existing literatures have been found which focus on the system-level SPICE model of the RF front-end circuits with pyramid horn antenna illuminated by HPEMs. Hence, the system-level SPICE model method with VF method is proposed for the RF channel with a pyramid horn antenna.
It is hard to compare the HPEM response after RF components when considering multiple HPEMs due to its complex waveform characteristics, which is the major difficulty of EM risk analysis. In our previous work [16], the electromagnetic sensitivity research of vulnerable components in wireless communication system was studied, the research results demonstrate that norm theory is suitable for the analysis of the HPEM conducted responses based on the physical effect mechanism. Norm theory is an efficient mathematical tool used to represent the complex transient wave for the complex waveform comparison, such as 2-p norm and -norm representing the energy and peak of waveforms [17], respectively. Hence, norm theory is used to analyze the responses on the RF channel for evaluating the EM risks and assisting in the final conclusion of the risk rank classification for the RF channel excited by multiple HPEMs. Finally, an entire flowchart of EM risk assessment based on the previous results is proposed in the end.
The combination method of the circuit model of the HPEM response for the RF channel and the response analysis with norm theory illustrated in this paper is much effective to assess the EM risk of the wireless system. Of the most remarkable advantages, one is converting the HPEM conducting process into the circuit model, and the other is solving the problems of waveform complexity of the HPEM responses with norm theory by considering the physical damage mechanism. This paper is organized as follows. Section 2 provides the descriptions of the simplified RF channel, HPEMs and norm theory, respectively. The SPICE modeling method of EMP response coupled on the linear RF channel is proposed in Section 3. The EM risks faced by the RF channel are analyzed with the norm theory and risk rank classification in Section 4. Section 5 concludes the paper.
2. Descriptions of DUT and HPEMs
2.1. HPEM Coupling of RF Front-End Circuits
In practice, the wireless communication equipment is generally located inside the shielded cabins, and the antenna is illuminated by an approximated ideal plane wave in free space. As illustrated in Figure 1, the RF channel of the wireless equipment is the main coupling channel for HPEM pulse propagation. The pulse energy coupled from the antenna is propagated step by step from RF components to the sensitive modules and results in damage or destruction to the certain module, e.g., low noise amplifier [18].
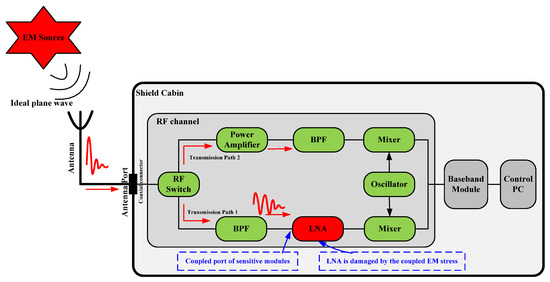
Figure 1.
EMP coupling on wireless RF front-end circuits.
Hence, regarding to the wireless system with the pyramid horn antenna, how to analyze the conducted response along the RF channel is the main issue for the HPEM risk analysis considered in this paper. Actually, when evaluating the electromagnetic risk of an electric system, it is often hard to obtain the detailed circuit structure parameters of the equipment due to commercial privacy. It is a practical solution to analysis the EM response by EM response modeling based on the measured data.
For an actual wireless system with an L band, a pyramid horn antenna (Figure 2a) and a RF micro-strip band pass filter (BPF) (Figure 2b) are selected to construct a simplified linear RF receiving channel neglecting the nonlinear modules such as protectors. The EM coupling response along this simplified channel will be modeled and analyzed based on the measured data according to commercial EM simulation and SPICE modeling methods.
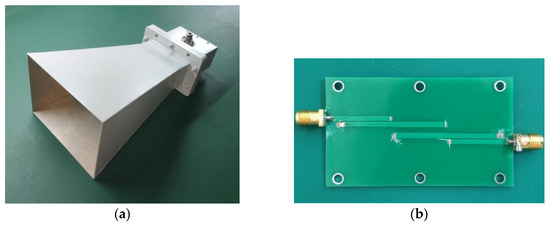
Figure 2.
Wireless RF front-end circuits: (a) Pyramid horn antenna; (b) micro-strip band pass filter.
As illustrated in Figure 2a, the antenna basic parameters are set as: the length of the horn is 270 mm, the length of the coaxial waveguide is 134 mm, the front opening side area of the antenna is 205 mm ×150 mm and the impedance of the antenna port is 50 ohm.
2.2. HPEM Waves
The main types of HPEM environment waves are described in this subsection, which contains HEMP, UWB and HPM. The HEMP environment has three stages, as early (E1), middle (E2) and late (E3). For small-scale metal structures like antenna or cables, the HEMP E1 wave is easier to induce coupling EM pulse energy impacting on the circuits of the victim system. Hence, it is considered in this paper. It takes a double exponential waveform as the standard wave, with rising time of 2.5 nanoseconds, a pulse width of 23 ns and peak value of 50 kV/m (Figure 3a). Most of 99% spectrum energy concentrates under 300 MHz, illustrated in Figure 3b. The HEMP formula is expressed by [19]
where, kV/m, , , .
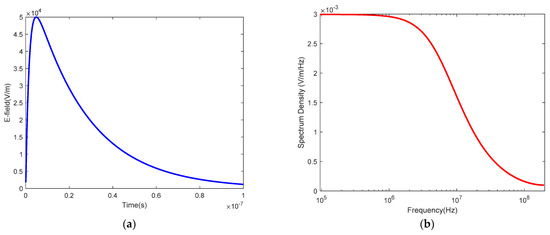
Figure 3.
HEMP waves: (a) time domain; (b) frequency domain.
UWB is a fast-rising edge or a single-period pulse with an ultra-wide frequency spectrum range, the main waveform form of which is unipolar or bipolar. UWB has no standard time domain waveform parameters, while the researchers generally adopt differential Gaussian pulse to represent bipolar UWB. Its expression is
where, is peak value, is the time of reach to the field peak, is pulse width, and peak factor is set as . Considering the center frequency of the RF channel used in this paper, the main parameters of UWB are sets as: , ns, and ns. The time and frequency domain wave of the UWB is illustrated in Figure 4.
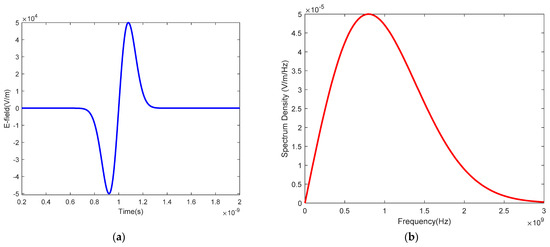
Figure 4.
UWB waves: (a) time domain; (b) frequency domain.
Similar with UWB, there is no strict definition for HPM waves. Traditionally, the EMP with peak power larger than 100 MW and carrier frequency among 1 GHz~300 GHz is assumed as HPM. The simplified time domain form of HPM is expressed by
where the center carrier frequency is 1.5 GHz, pulse width , and ns is its rising and falling time. Figure 5 shows the time and frequency domain waves.
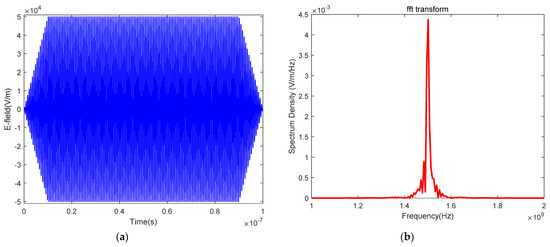
Figure 5.
HPM waves: (a) time domain; (b) frequency domain.
2.3. Norm Theory
Norm theory generally adopts mathematical vector or matrices to represent the coupling response by expressing its physical features and properties, which are defined as:
As shown in Table 1, 2-norm and -norm are used to study the EM response in the RF channel, which represent the energy, peak value and maximum rising rate of the coupling response, respectively.

Table 1.
P-norms applied in this paper.
3. System-Level SPICE Modeling of EMP Coupling on Wireless RF Circuits
3.1. SPICE Model for the Coupling Response on the RF Channel with a Pyramid Horn Antenna
To establish the SPICE model of coupling response on the simplified linear channel with a pyramid horn antenna (Figure 6a) constructed in Section 2, the equivalent circuits of which can be built based on the Thevenin and Norton theorem (Figure 6b) [11,15]. From the point view of the antenna port into the antenna system, the Thevenin SPICE model of horn antenna response can be established according to the antenna impedance as the source inner resistance and the open circuit (OC) voltage as the excitation source, and the Norton SPICE model requires antenna admittance and short circuit (SC) current. These input parameters used for the SPICE models can be derived from the ways of computation, simulation or tests. In this paper, the equivalent circuits of antenna input impedance and admittance used for the SPICE models will be modeled by the VF method based on the simulated data of impedance, admittance or S parameters according to the commercial EM software.
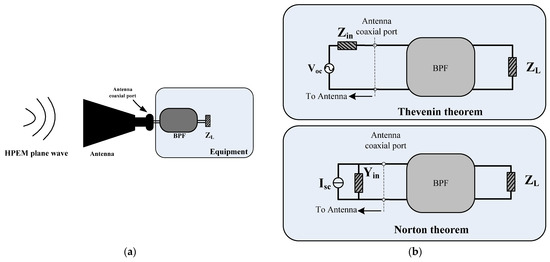
Figure 6.
Equivalent circuit model of antenna response: (a) Antenna illuminated by HPEM; (b) Equivalent circuits for antenna response.
From the antenna coaxial port into the equipment, the circuits of the simplified RF channel are the BPF and loads. Due to the micro-strip structure of BPF, it is hard to directly convert to the spice model. Hence, we will build its SPICE model with the VF method based on the measured admittance data.
3.2. SPICE Model of Wireless Antenna
Both of the Thevenin and Norton SPICE models of the pyramid horn antenna are established in this subsection. The OC voltage and SC current used for the Thevenin and Norton SPICE models respectively, are derived from the EM models of the antenna illuminated by HPEM excitation plane waves. Figure 7 provides the antenna EM model and the antenna port admittance data.
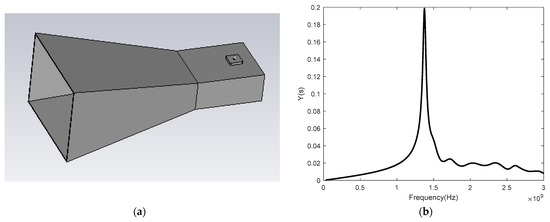
Figure 7.
EM models of pyramid horn antenna: (a) EM model; (b) Admittance.
Based on the previous two SPICE models, we will use the VF method to obtain the rational function approximations of the frequency response of the antenna input impedance and input admittance, which will be used for the equivalent circuit modeling. The rational approximation of the transfer function of impedance or admittance can be written as
where is the n-th residue, and is the n-th pole, and are the optional parameters, and is the complex frequency. These values can be computed by the VF method, the details of which can be found in [12,13,14].
The rational approximations of the input impedance or admittance are both computed by the VF method. The choice of which is model used always depends on whether the excitation source of the SPICE model selects OC voltage or SC current. In addition, the frequency response of two-port network or single-port network is usually interchangeable between the S, Z and Y-matrix.
The rational approximation of the transfer function can be represented in the form of pairs of complex and conjugate residues {,} and poles {,} like
Based on the rational approximations, the forms of the basic sub-circuits in the SPICE model and the element values are determined in the following subsection respectively.
3.2.1. Circuit Element Parameter Determination of Impedance Data
For impedance data, its rational approximation can be expressed by multiple basic sub-circuits in series, each type of which can be used to represent a sub-item of with real poles or with a pair of complex conjugate poles. The schematic of entire circuits consists of multiple basic sub-circuits in series, as illustrated in Figure 8a. The two types of basic sub-circuits are as shown in Figure 8b. The sub-circuit Type I is used to represent the sub-item with real poles, the values of the lumped elements are
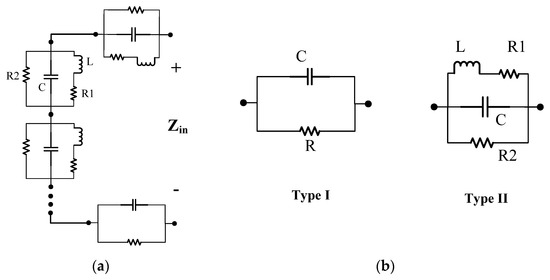
Figure 8.
Forms of circuit model for impedance: (a) entire circuit model; (b) basic sub-circuit model.
In addition, the optional parameters and in Equation (5) can be expressed by the inductor with value and the resistor in series. Type II is used to represent the pair of complex conjugate poles, and the values of the lumped elements in Type II are
3.2.2. Circuit Element Parameter Determination of Admittance Data
For admittance data, the entire circuit structure consists of multiple basic sub-circuits in parallel, which are shown in Figure 9a. Figure 9b provides the two forms of basic sub-circuits used in the entire model.
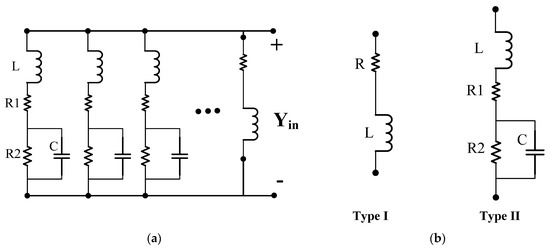
Figure 9.
Forms of circuit model for admittance: (a) entire circuit model; (b) basic sub-circuit model.
The sub-circuit Type I in Figure 9b is used to represent the sub-item with real poles, the values of the lumped elements are
Moreover, the optional parameters and in Equation (5) can be expressed by the capacitor with value and the resistor in parallel. Type II is used to represent the pair of complex conjugate poles, and the values of the lumped elements in Type II are
3.2.3. Response Result of Antenna SPICE Model
The frequency range of the equivalent circuit to be fitted is limited by the frequency range of the simplified RF channel and the potential HPEM it suffers from. Because the excessively wide frequency band will cause the VF fitting order to be too high, leading to higher fitting complexity. Hence, the frequency range of the antenna is limited within 3 GHz. The rational approximation of the input impedance and admittance of the antenna port has been derived by the VF method based on the EM simulated data of impedance and admittance. The basic parameters of the VF method are set as: the order of rational function is 10, and VF iteration is 20. As illustrated in Figure 10, the fitted results have enough accuracy to be used for equivalent circuit modeling.
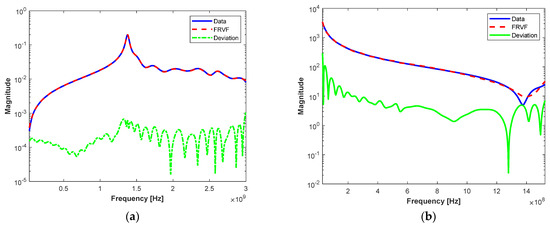
Figure 10.
Fitting result of impedance and admittance of antenna with VF method: (a) admittance; (b) impedance.
According to the rational functions of antenna input impedance and admittance, the equivalent circuits of Zin and Yin in the SPICE models are computed according to Equations (7)–(10). In addition, the excitation sources in the SPICE circuit are set as OC voltage and SC current for the Thevenin model and Norton model, respectively. Then, finally, the entire equivalent Thevenin and Norton SPICE models have been built for antenna coupling response with load 50 ohms connected to the antenna port after HEMP illumination.
The response results of the two SPICE models with HEMP excitation waves are computed in this subsection and validated with the comparison of the EM simulations. For the Thevenin SPICE model, the SC current and load current results of EM simulation are selected to validate the SPICE simulation results, the curves of which are illustrated in Figure 11. From the consistency of the wave oscillation period and peaks of the curves, it is obviously shown that the accuracy of the Thevenin SPICE model for antenna response is close to that of the EM simulations, so it can be considered that this SPICE modeling of antenna response after HPEM illumination does not reduce the accuracy requirement compared to the original response. The slight difference between the curves should be caused by the cut off of the impedance frequency range and the fitting error of the rational approximation, which can be considered as negligible from the perspective of equivalence.
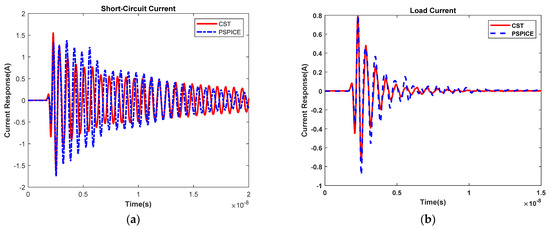
Figure 11.
Validation of Thevenin SPICE model: (a) SC current; (b) Load current.
Furthermore, the comparison of the Norton SPICE model and EM simulation are also provided, where the curves of the OC voltages and load currents of the SPICE and EM simulation are illustrated in Figure 12. The consistency of these curves in Figure 12 also proves the validations of the Norton SPICE model.
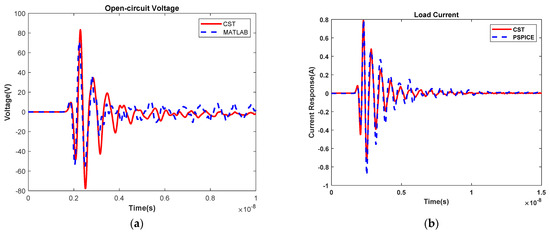
Figure 12.
Validation of Norton SPICE model: (a) OC voltage; (b) Load current.
Considering that the parameter of SC current is easier to measure in the HPEM illumination tests, the Norton SPICE model is adopted for the simplified linear RF channel in the following section.
3.3. SPICE Model of Micro-Strip Bandpass Filter
The SPICE model of equivalent circuits for the BPF is obtained with the VF method based on the measured dual port network Y-parameters. A circuit structure is assumed for the BPF to be modeled, which will divide the SPICE model into three sub-circuit as shown in Figure 13. From the measured Y-parameter data, we can compute the , and according to the expression
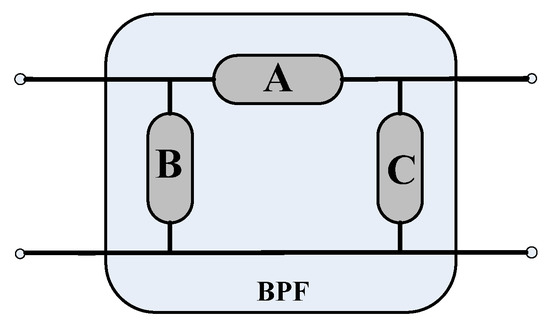
Figure 13.
Schematic of type circuit structure for the BPF.
Then the equivalent circuits for A, B and C are derived by the VF method, respectively, and the final SPICE model for the micro-strip BPF is established. Figure 14 provides the comparison of measured admittance data and the SPICE results, which demonstrates that the accuracy of the BPF SPICE model is enough for the modeling requirement.
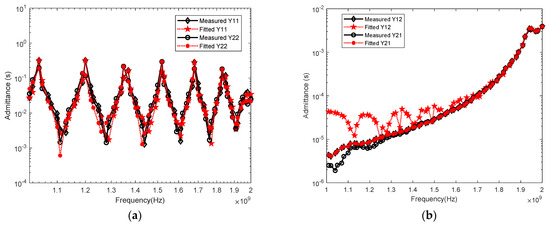
Figure 14.
Comparison of Measured Admittance and Fitted results: (a) Y11 and Y22; (b) Y12 and Y21.
4. Response Analysis of EMP Coupling on RF Front-End Circuits-Based Norms
4.1. Simulation Results of the Linear RF Channel with Multiple HPEMs
The SC current waves of HEMP, UWB and HPM are obtained from the commercial EM simulation, which is taken as the excitation files for the SPICE model of the linear RF channel with pyramid horn antennas. Figure 15, Figure 16 and Figure 17 illustrate the current response of the antenna port and the response after BPF. When the antenna is connected to the SC load, the peak value of the SC current for HEMP is 1.5 A with a time duration 50 ns under 50 kV/m illumination, the peak for UWB is 60 A with a duration 20 ns, and the peak for HPM is 160 A with a duration 100 ns. It is obviously demonstrated that HPM has larger potential EM to threaten risk for the RF circuits due to the frequency range consistency of HPM and the pyramid horn antenna.
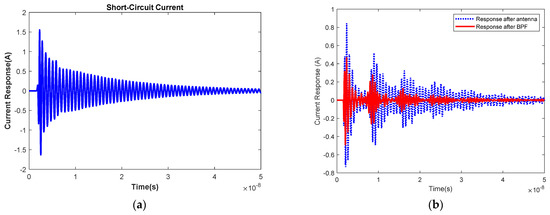
Figure 15.
Coupling response excited by HEMP: (a) SC current; (b) Responses.
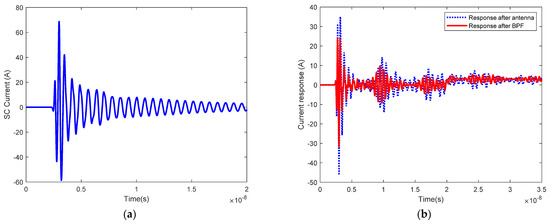
Figure 16.
Coupling response excited by UWB: (a) Isc current; (b) Responses.
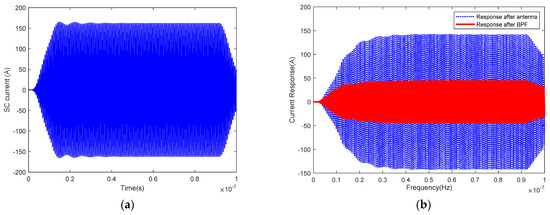
Figure 17.
Coupling response excited by HPM: (a) SC current; (b) Responses.
When the BPF is connected to the antenna port instead of the SC load, the current response of the antenna port has changed a lot due to the different impedance characteristics of the load connected to the antenna. It is known that the peak of the current response after the antenna for HEMP is reduced to 0.83 A, the peak for UWB is 46.23 A, and the peak for HPM is reduced to 142.96 A.
For the linear RF channel, the module connected to the BPF is ideal 50 ohm load, the current wave on this load is the EMP response after the BPF. While in actual scenarios, the module connected to the BPF may be a low noise amplifier being more sensitive under these HPEM risks, the response after BPF is the main coupling parameter for analyzing HEMP vulnerability. From Figure 15, Figure 16 and Figure 17, it is known that after passing through BPF, there is a very large attenuation and reduction of the EMP energy for all HPEM environments. For HEMP, the peak value of the current response after BPF is 0.49 A, the peak for UWB is 31.58 A, and the peak for HPM is 44.64 A. However, the peak of the response is not sufficient to describe the EM threat for the potential damaged electronic modules, which is because the EM sensitive parameters causing the sensitive module damaged maybe related to other physical quantities such as energy, rising rate etc. Therefore, in the next subsection, we will use norm theory to conduct a quantitative analysis of various waveform characteristics for the current response, which maybe beneficial for a more comprehensive and accurate analysis.
4.2. Response Analysis with Norm Theory
In this subsection, in order to analyze the risk degree of the HPEM risk faced by the RF channel with a pyramid horn antenna, we utilize three typical time domain norms to represent the waveform characteristics from the electric field to the conducted response of the RF channel. Table 2 illustrates the norm results of the HPEM and the responses.
Table 2.
Norm results of the HPEM and the responses.
Because this paper mainly focuses on the three typical HPEM environments, we define the risk ranks of HPEM faced by the RF channel as I, II and III. Rank I is the highest risk, and rank III is the lowest. Considering the convenience of the comparison for these HPEMs used in this paper, the amplitude (50 kV/m) of the electric field is set to represent the HPEM pulse strength. However, radiation power or energy may be used as the representation of the pulse intensity in practice. Hence, we compute the ratio of the antenna response versus the electric field and the ratio of the response after BPF versus the electric field for each norm to normalize the selectivity of the pyramid horn antenna and the linear RF channel to the HPEMs. In practice, some sensitive modules such as LNA are always connected at the back end of the RF channel. Therefore, if the RF channel has better frequency selectivity to a certain HPEM, the RF channel faces greater damage EM risk in this HPEM.
Table 3 provides the risk rank results of the HPEMs for the linear RF channel according to the results of Table 2. For the antenna response, HPM is the highest EM risk for the pyramid horn antenna, the reason of which is that the center frequency of HPM is located in the pass band frequency range of the antenna. HEMP is the lightest EM risk because this main energy frequency range of below 300 MHz is much lower than the antenna frequency range. In addition, the HPM is also the highest EM risk for the linear RF channel, the main reason is that the frequency range of the antenna and BPF are consistent with the HPM. Of course, the HPM environment has a very wide frequency band and most flexibility compared to other HPEMs. Hence, the carrier frequency needs to be set within the frequency range of the targeted electronic system to produce the most significant effect.
Table 3.
Risk rank results of the HPEMs for the linear RF channel.
Besides, from the point view of EM sensitivity of electronic modules connected to the RF channel, we can use expert knowledge to assign different weights to these norms based on the EM sensitivity of the electronic module, thus obtaining EM risk analysis result that are more consistent with the target system.
Finally, we propose a methodology of EM risk assessment based on the previous analysis. The basic flowchart is illustrated in Figure 18. After the wave responses of the interested electronic modules are derived by SPICE modeling, we can configure the weights of the waveform characteristics with norm theory for EM assessment, where the configuration information can be from expert knowledge or previous test data about the physical effect mechanism.
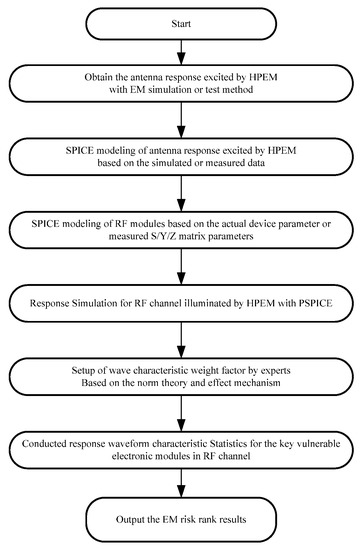
Figure 18.
Flowcharts of EM risk assessment.
5. Conclusions
In order to study the potential HPEM risks faced by the RF front-end circuits with pyramid horn antennas accurately, this paper takes a simplified linear RF channel with an antenna as a targeted electronic subsystem based on the main electronic modules in the actual wireless communication system. According to the measured data of the targeted modules such as horn antenna and the micro-strip BPF, a system-level SPICE model of the response coupled on the linear RF channel was established with the VF method based on the Norton theorem. The SC currents of the antenna illuminated by HPEMs such as HEMP, UWB and HPM adopted as the excitation files of the SPICE model were simulated by the pyramid horn antenna EM models. The SPICE models provided the response of the antenna port and the response after BPF under different HPEM environments. Three typical norms were utilized to analyze the waveform characteristics from electric field to current responses. Finally, the ranks of EM risks faced by the linear RF channel are assessed based on the norm results, which way is computing the ratios of the antenna response versus electric field and the response after BPF versus electric field. With the comparison of these risk ranks, HPM is deemed as the potential highest EM risk for this RF channel while HEMP is the weakest. This combination method of HPEM response modeling and norm analysis applied in this paper is proven to be very effective for the EM risk assessment faced by the wireless system when considering multiple HPEMs.
In the future work, we will further establish the SPICE models of the responses coupled on the nonlinear RF channel when considering the nonlinear electric modules such as EMI protector, RF switch etc. Besides, the nonlinear transient effects such as saturation or breakdown may occur in the circuit element like capacitors when the pulse impacts the RF circuit. It may increase the difference between the simulation and experimental results. We will quantify and correct the difference through uncertainty analysis and nonlinear modeling in the future.
Author Contributions
Conceptualization, C.D. and C.M.; Data curation, C.D.; Formal analysis, Z.C., W.W. and Y.Q.; Funding acquisition, Z.C., W.W. and W.C.; Investigation, J.T.; Methodology, Z.C. and C.M.; Project administration, J.T.; Resources, W.C.; Supervision, C.M.; Validation, W.W. and Y.Q.; Writing—original draft, C.D.; Writing—review & editing, J.T., W.C. and Y.Q. All authors have read and agreed to the published version of the manuscript.
Funding
This research received no external funding.
Conflicts of Interest
The authors declare no conflict of interest.
References
- Giri, D.V.; Hoad, R.; Sabath, F. High-Power Electromagnetic Effects on Electronic System; Artech House: London, UK, 2020; pp. 1–50. [Google Scholar]
- Giri, D.; Tesche, F. Classification of Intentional Electromagnetic Environments (IEME). IEEE Trans. Electromagn. Compat. 2004, 46, 322–328. [Google Scholar] [CrossRef]
- Coburn, W.O.; Nguyen, E.; Reyzer, R.J.; Mar, M.H. High-Altitude Electromagnetic Pulse Survivability Assessment of the Har-Ris RF-3200 Transceiver; Harry Diamond Labs: Adelphi, MD, USA, 1992. [Google Scholar]
- IEC 61000-2-1; Electromagnetic Compatibility (EMC): Part 2. Environment-Section 10: Description of HEMP Environment-Conducted Disturbance. IEC: Geneva, Switzerland, 1998.
- Du, C.; Liu, Z.; Mao, C.; Cui, Z.; Sun, D.; Qin, F. Statistical analysis comparison of HEMP transient response of monopole antenna from facility and burst views. J. Electromagn. Waves Appl. 2021, 35, 1663–1677. [Google Scholar] [CrossRef]
- Mahdi, B.; Mohammad, G.H.A. Investigation on transient response of linear dipole antennas in the presence of HEMP based on equivalent circuit. Prog. Electromagn. Res. Lett. 2017, 66, 39–43. [Google Scholar]
- Hamid, M.; Hamid, R. Equivalent circuit of dipole antenna of arbitrary length. IEEE Trans. Antennas Propag. 1997, 45, 1695–1696. [Google Scholar] [CrossRef]
- Rambabu, K.; Ramesh, M.; Kalghatgi, A. Broadband equivalent circuit of a dipole antenna. IEE Proc. Microw. Antennas Propag. 1999, 146, 391–393. [Google Scholar] [CrossRef]
- Moradikordalivand, A.; Rahman, T.A.; Ebrahimi, S.; Hakimi, S. An equivalent circuit model for broadband modified rec-tangular micro-strip-fed monopole antenna. Wirel. Pers. Commun. 2014, 77, 1363–1375. [Google Scholar] [CrossRef]
- Kim, Y.; Ling, H. Realisable rational function approximations for the equivalent circuit modelling of broadband antennas. IET Microw. Antennas Propag. 2007, 1, 1046–1054. [Google Scholar] [CrossRef]
- Gao, X.; Du, Z. Modelling of a paraboloid antenna for receiving and its equivalent circuit. IET Microw. Antennas Propag. 2014, 8, 931–936. [Google Scholar] [CrossRef]
- Gustavsen, B.; Semlyen, A. Rational approximation of frequency domain responses by vector fitting. IEEE Trans. Power Deliv. 1999, 14, 1052–1061. [Google Scholar] [CrossRef] [Green Version]
- Deschrijver, D.; Haegeman, B.; Dhaene, T. Orthonormal vector fitting: A robust macro-modeling tool for rational approxi-mation of frequency domain responses. IEEE Trans. Adv. Packag. 2007, 30, 216–225. [Google Scholar] [CrossRef]
- Deschrijver, D.; Mrozowski, M.; Dhaene, T.; Zutter, D.D. Macro-modeling of multiport systems using a fast implementation of the vector fitting method. IEEE Microw. Wirel. Compon. Lett. 2008, 18, 383–385. [Google Scholar] [CrossRef] [Green Version]
- Ghosh, S.; Chakrabarty, A. Estimation of Equivalent Circuit of Loaded Trans-receive Antenna System and its Time Domain Studies. J. Electromagn. Waves Appl. 2006, 20, 89–103. [Google Scholar] [CrossRef]
- Du, C.; Xia, D.; Huang, Q.; Mao, C.; Cui, Z.; Fang, W.; Nie, X. Research on Electromagnetic Susceptibility of Electronic Modules in Component-Level HEMP PCI Test. Energies 2022, 15, 1409. [Google Scholar] [CrossRef]
- Baum, C.E. Norms and Eigenvector Norms. Math. Notes 1979, 63, 1–42. [Google Scholar]
- Du, C.; Mao, C.; Sun, D.; Zhang, X. Effect Characterization and Modeling of RF Low Noise Amplifier for VHF communication System after HEMP PCI Test. In Proceedings of the 2020 IEEE MTT-S International Conference on Numerical Electromagnetic and Multiphysics Modeling and Optimization (NEMO), Hangzhou, China, 7–9 December 2020; IEEE: Piscataway, NJ, USA, 2020; pp. 1–4. [Google Scholar] [CrossRef]
- IEC 61000-2-9; Electromagnetic Compatibility (EMC): Part 2. Environment-Section 9: Description of HEMP Environment-Radiated Disturbance. IEC: Geneva, Switzerland, 1996.
Publisher’s Note: MDPI stays neutral with regard to jurisdictional claims in published maps and institutional affiliations. |
© 2022 by the authors. Licensee MDPI, Basel, Switzerland. This article is an open access article distributed under the terms and conditions of the Creative Commons Attribution (CC BY) license (https://creativecommons.org/licenses/by/4.0/).