1. Introduction
The increase in energy market prices and the increased impact of human development on global warming have forced governments around the world to increase the requirements for energy-related products. For energy recovery systems, it means developing more efficient and environmentally friendly products. A large portion of energy consumption is building ventilation. A portion of this energy demand is from air conditioning, such as heating in winter and cooling in summer. Recently, there have been discussions about the implementation of moisture recovery in energy-related product ratings due to latent heat representing a large portion of the total thermal load of an air-conditioned building [
1].
To recover both the sensible and latent heat from the exhaust air in buildings, two main air-to-air exchanger types are used. A rotary exchanger, although it has the highest total effectiveness, cannot provide a 100% clean supply air. The reason for this is its design, which causes leakage between the supply and exhaust air. These hygienic requirements have received increased attention during the ongoing COVID-19 pandemic. To minimize the risk, a membrane-based plate exchanger can be used where there is no risk of mixing between the airstreams. Unlike sensible plate exchangers, the plates of an enthalpy exchanger are made from semipermeable polymer membranes instead of metal or plastic. This type of exchanger recovers sensible and latent heat simultaneously. In Europe, where the latent load is lower than in southwest Asia, an enthalpy exchanger can be utilized to recover moisture from the exhaust air and moisturize the dry supply air in the winter months. On top of this, when operating under conditions with below-freezing temperatures, the icing of an exchanger is less likely due to the rapid dehumidification of the extract air, which hardly reaches the dew point.
For energy recovery purposes, it is most important to investigate the moisture transport properties of membranes. As mentioned by Dugaria et al. [
2], the heat conductivity of the plate material does not play a significant role in sensible heat recovery. Under considered conditions, the ratio of the conductive to convective resistance in the plate boundary layer is less than 1/100. There is also a minor influence of the plate thickness on sensible effectiveness if it is kept relatively thin (up to 120 µm). Therefore, more investigations are devoted to the moisture transport in the membranes.
For a long time, the most common material for enthalpy exchanger fabrication has been paper. Zhang et al. [
3] reported the value of the water vapor diffusivity in paper to be 6.08 × 10
−12 m
2/s, which is much lower than that in polymeric membranes. Lee et al. [
4] enhanced the diffusivity of paper by impregnating it with lithium chloride (LiCl). The reported values of the moisture diffusivity ranged from 1.8 × 10
−11 m
2/s to 6.0 × 10
−11 m
2/s and in another study, it was found to be 3.8 × 10
−11 m
2/s [
5].
Much attention has been paid to cellulose acetate (CA) as a cheap and available material, with evaluated diffusivity values of 1.05 × 10
−11 m
2/s [
3]. In another report, Zhang et al. mentioned that the diffusivity of machine-made CA was 3.77 × 10
−6 kg/m∙s and that of handmade CA was 4.76 × 10
−6 kg/m∙s [
6].
Other cellulose derivatives have been investigated by Zhang, where the diffusivity of modified cellulose was 2.50 × 10
−10 kg/m∙s [
3] and that of mixed cellulose was 3.60 × 10
−10 m
2/s [
7]. The reported diffusivity of cellulose by Min was 7.83 × 10
−7 kg/m∙s [
8].
Other homogenous polymer films have been investigated by Niu and Zhang with the diffusivity in a copolymer membrane found to be 2.16 × 10
−8 kg/m∙s. For polyethersulfone (PES), it was 7.10 × 10
−7 kg/m∙s and for polyvinylidene fluoride (PVDF) it was 1.92 × 10
−6 kg/m·s [
8].
Recently, more attention has been focused on composite membranes, mainly due to the independent preparation and optimization of the selective layer and porous substrate. The diffusivity of a composite membrane reported by Huizing was 3.3 × 10
−11 m
2/s for a hydrophilic polymer film and 1.13 × 10
−10 m
2/s for a microporous substrate [
9]. The two-layered structure of a polyvinylidene fluoride and polyvinyl alcohol (PVDF/PVAL) membrane was investigated by Zhang and the diffusivity was found to be 3.2 × 10
−11 m
2/s [
10].
Standard moisture diffusivity measurements are performed using gravimetric methods that record the weight loss of the sample exposed to a range of air humidities. The effective diffusivity is obtained by direct permeation tests under steady-state conditions. Both methods, although widely used, often neglect the convective resistance in the boundary layer, which leads to inaccurate results. The shortcomings of the aforementioned methods encouraged authors Zhang [
7,
11] and Min et al. [
8] to develop a new approach to evaluating moisture diffusivity in the membranes by considering the effect of the boundary layer on both sides of the membrane.
3. Materials and Properties
Three membrane samples were prepared to undergo water vapor diffusivity testing. The membrane samples were produced from cheap, easy-to-obtain materials, with no harsh chemicals used in their fabrication.
The asymmetric cellulose acetate membrane was prepared using the one-step fabrication process from the wet phase inversion method described by Zhang et al. [
13].
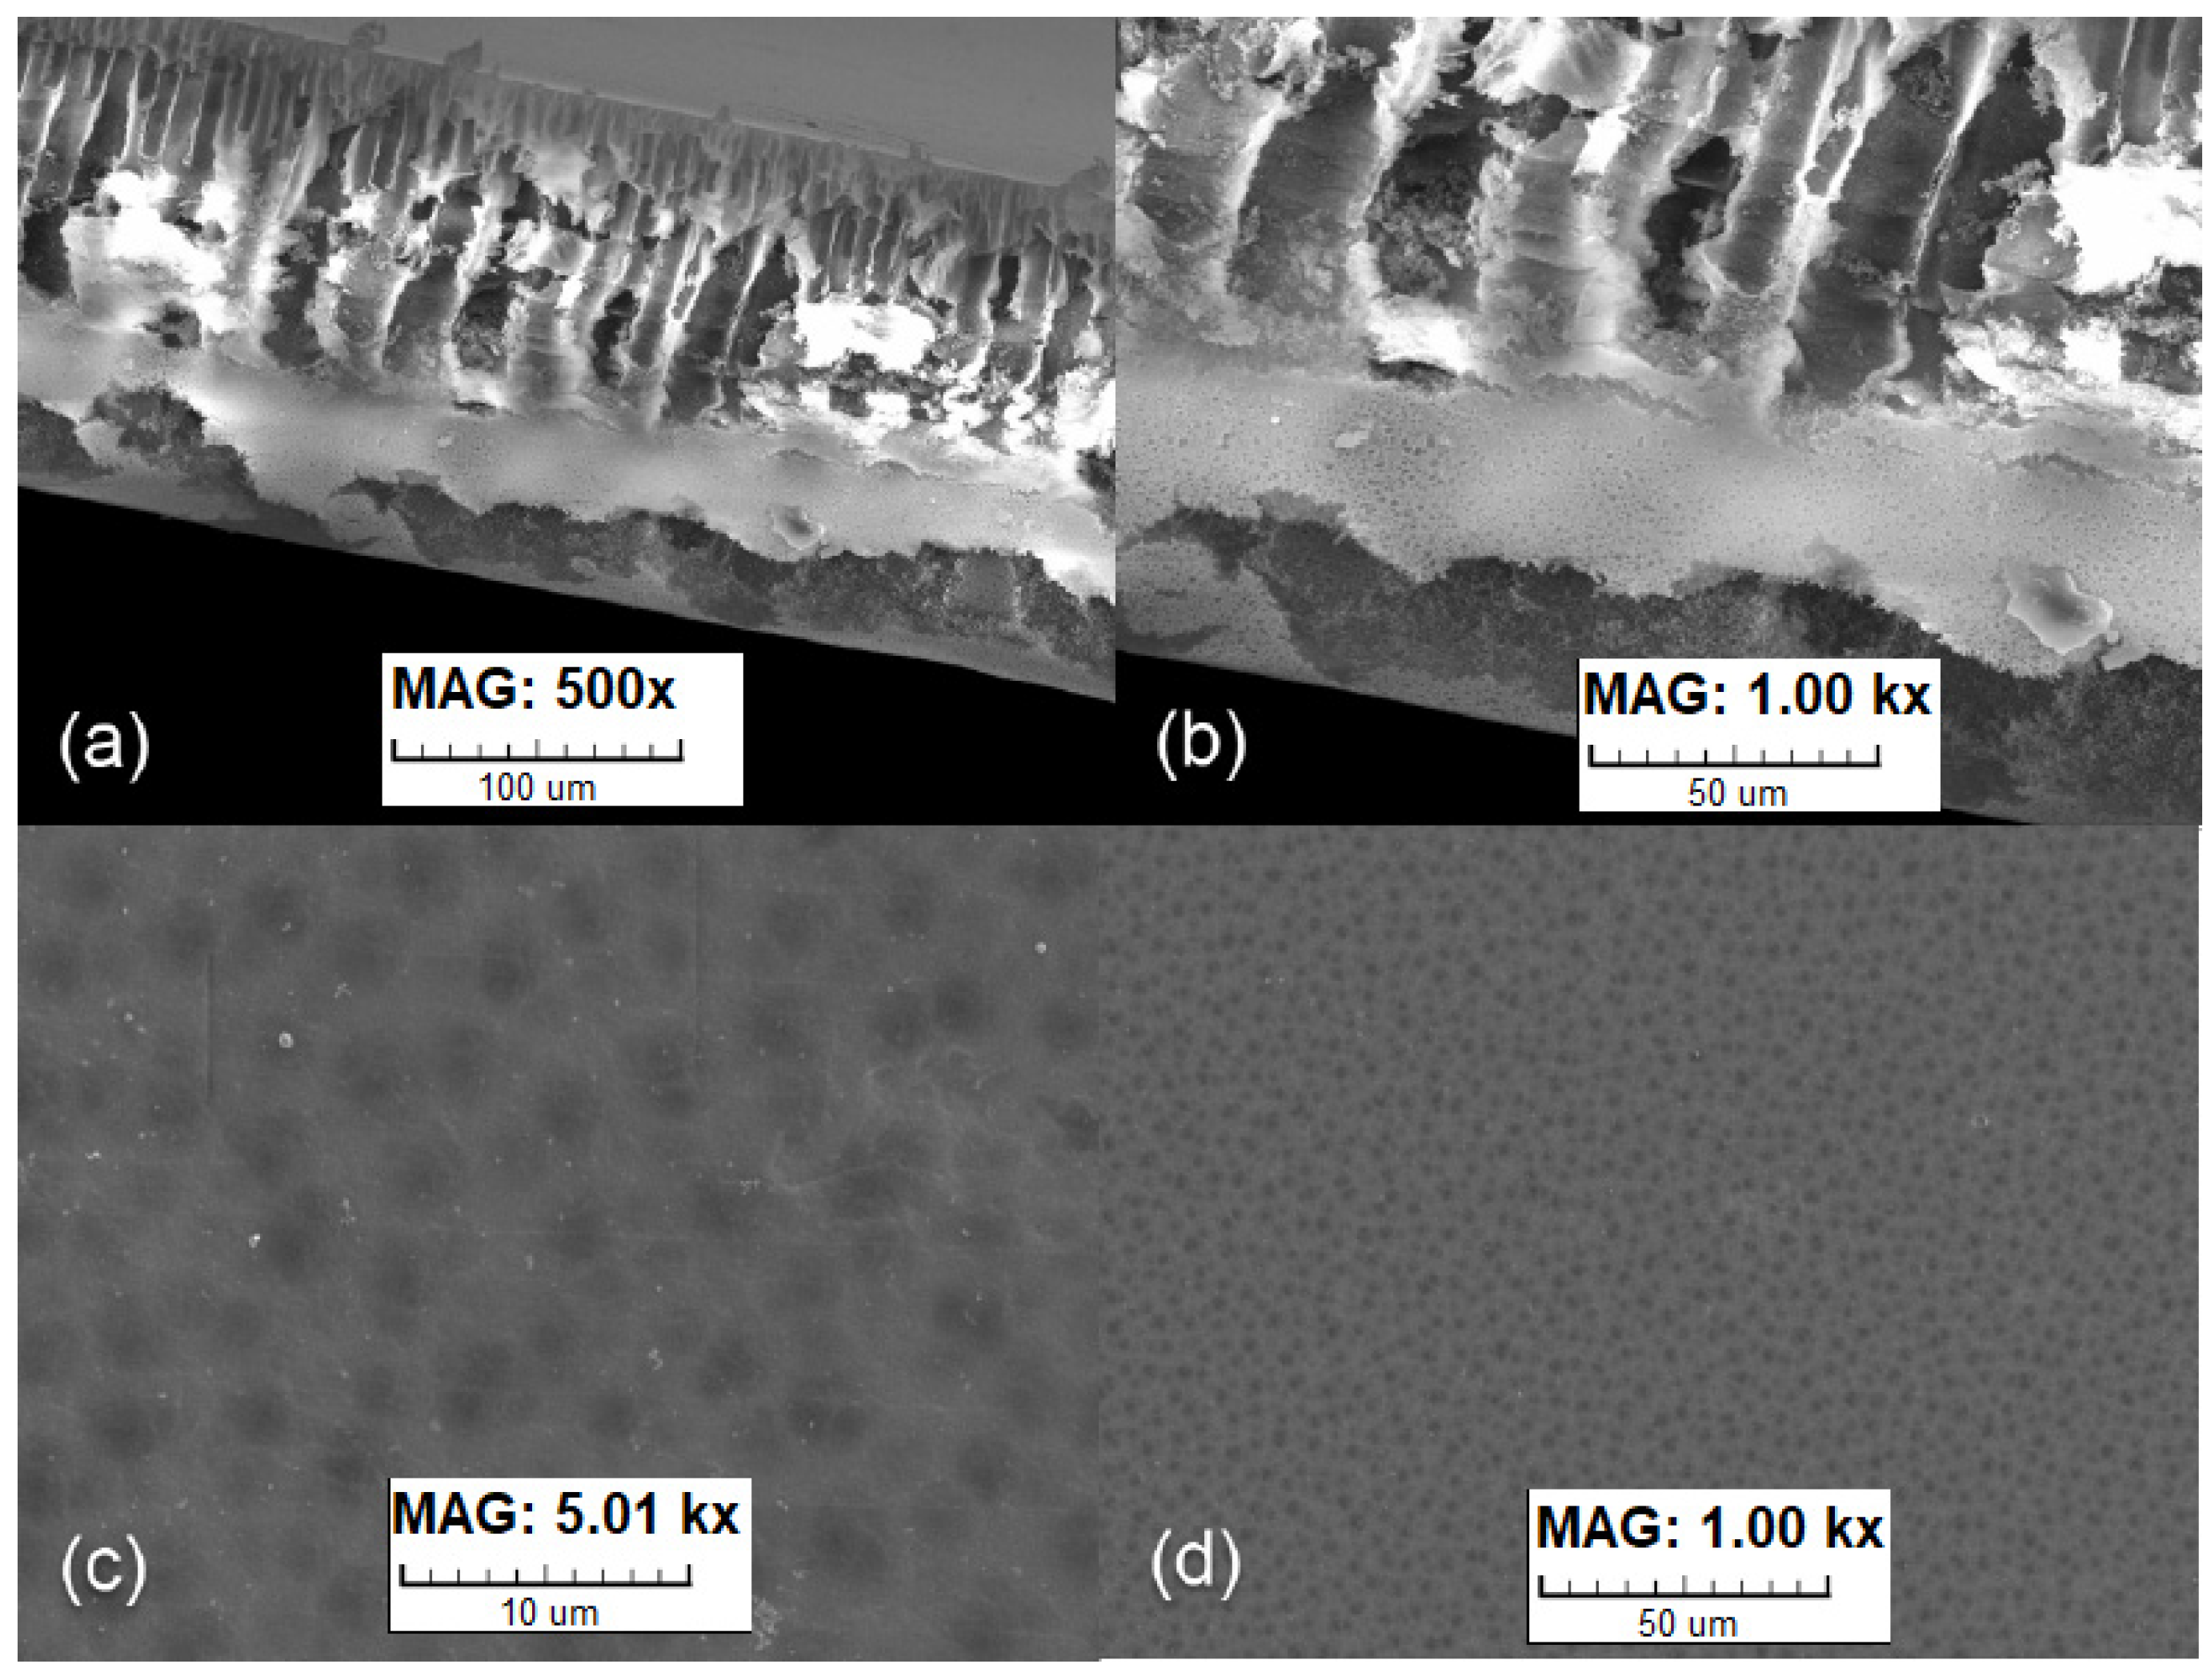
In
Figure 2, the changing structure in the membrane cross-section transferred from the macroporous finger-like structure to the dense, porous structure can be seen. The membrane structure can be adjusted in the fabrication process using different ratios of additive (deionized water) to casting solution [
13]. The created membrane was a self-supporting asymmetric membrane with expected good selectivity to unwanted gasses. The thickness of the fabricated membrane was 20 µm.
The other two membrane samples were fabricated by coating a hydrophilic polymer onto a hydrophobic substrate to create a two-layer composite membrane.
The polyethylene/polyurethane (PE/PUR) membrane was prepared by coating a waterborne polyether polyurethane dispersion onto a silica-filled nanoporous polyethylene substrate. The substrate was a dimensionally stable, highly porous synthetic material with good absorption of coatings and adhesives. The use of a polyurethane coating containing a soft polyethylene oxide (PEO) block on microporous and nanofibrous substrates was described by Huizing [
14,
15]. The advantage of coated composite membranes is the possibility of the independent selection of materials for the selective and support layers, which causes a higher moisture flux. To create the very thin layer, a 15% polymer/water solution was prepared and coated onto the substrate using a casting knife. The coated membrane was dried at room temperature. Afterward, the membrane was cured at 100 °C for 4 h. The thickness of the fabricated membrane after coating was 150 µm. The morphology of the fabricated membrane was observed using scanning electron microscopy (SEM). In
Figure 3, a cross-section of the membrane with a microporous structure, as well as continuous dense coating without deflections, can be seen.
Figure 4 shows the polyester/polyurethane (PET/PUR) membrane produced by coating the same dispersion onto a thin polyester fibrous nonwoven fabric. In this case, a 5% water solution was prepared and coated onto the membrane using a rubber wiper. The membrane was dried at room temperature and cured at 100 °C for 4 h. The thickness of the coated membrane was 20 µm.
The sorption properties of the membranes summarized in
Table 2 were obtained using gravimetric measurements at 20 °C by a water vapor sorption analyzer DVS Adventure. Other material properties, such as density and heat conductivity, were obtained from the material datasheets provided by the manufacturer.
4. Data Reduction
The moisture transfer in the membrane is governed by a well-known solution–diffusion mechanism [
16]. The correlations in this section were adopted from Min [
8] and Zhang [
17].
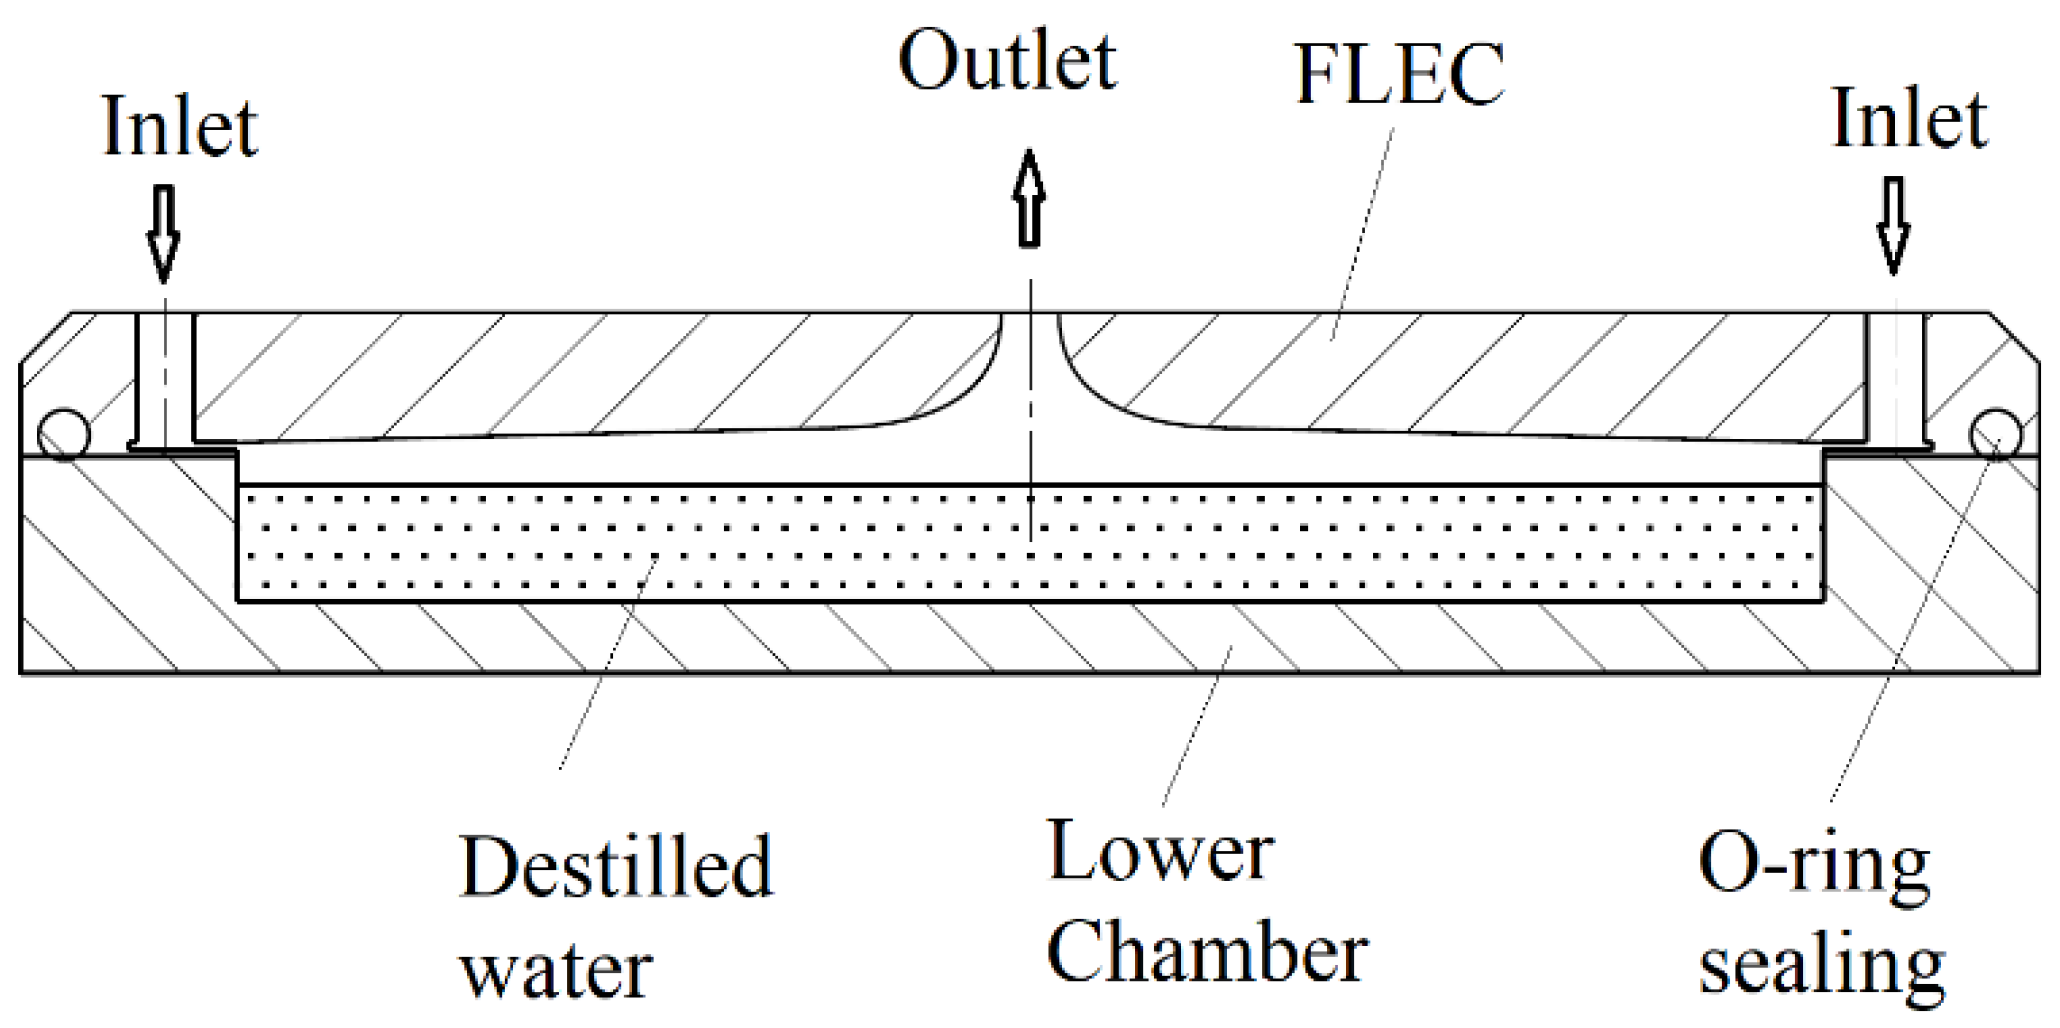
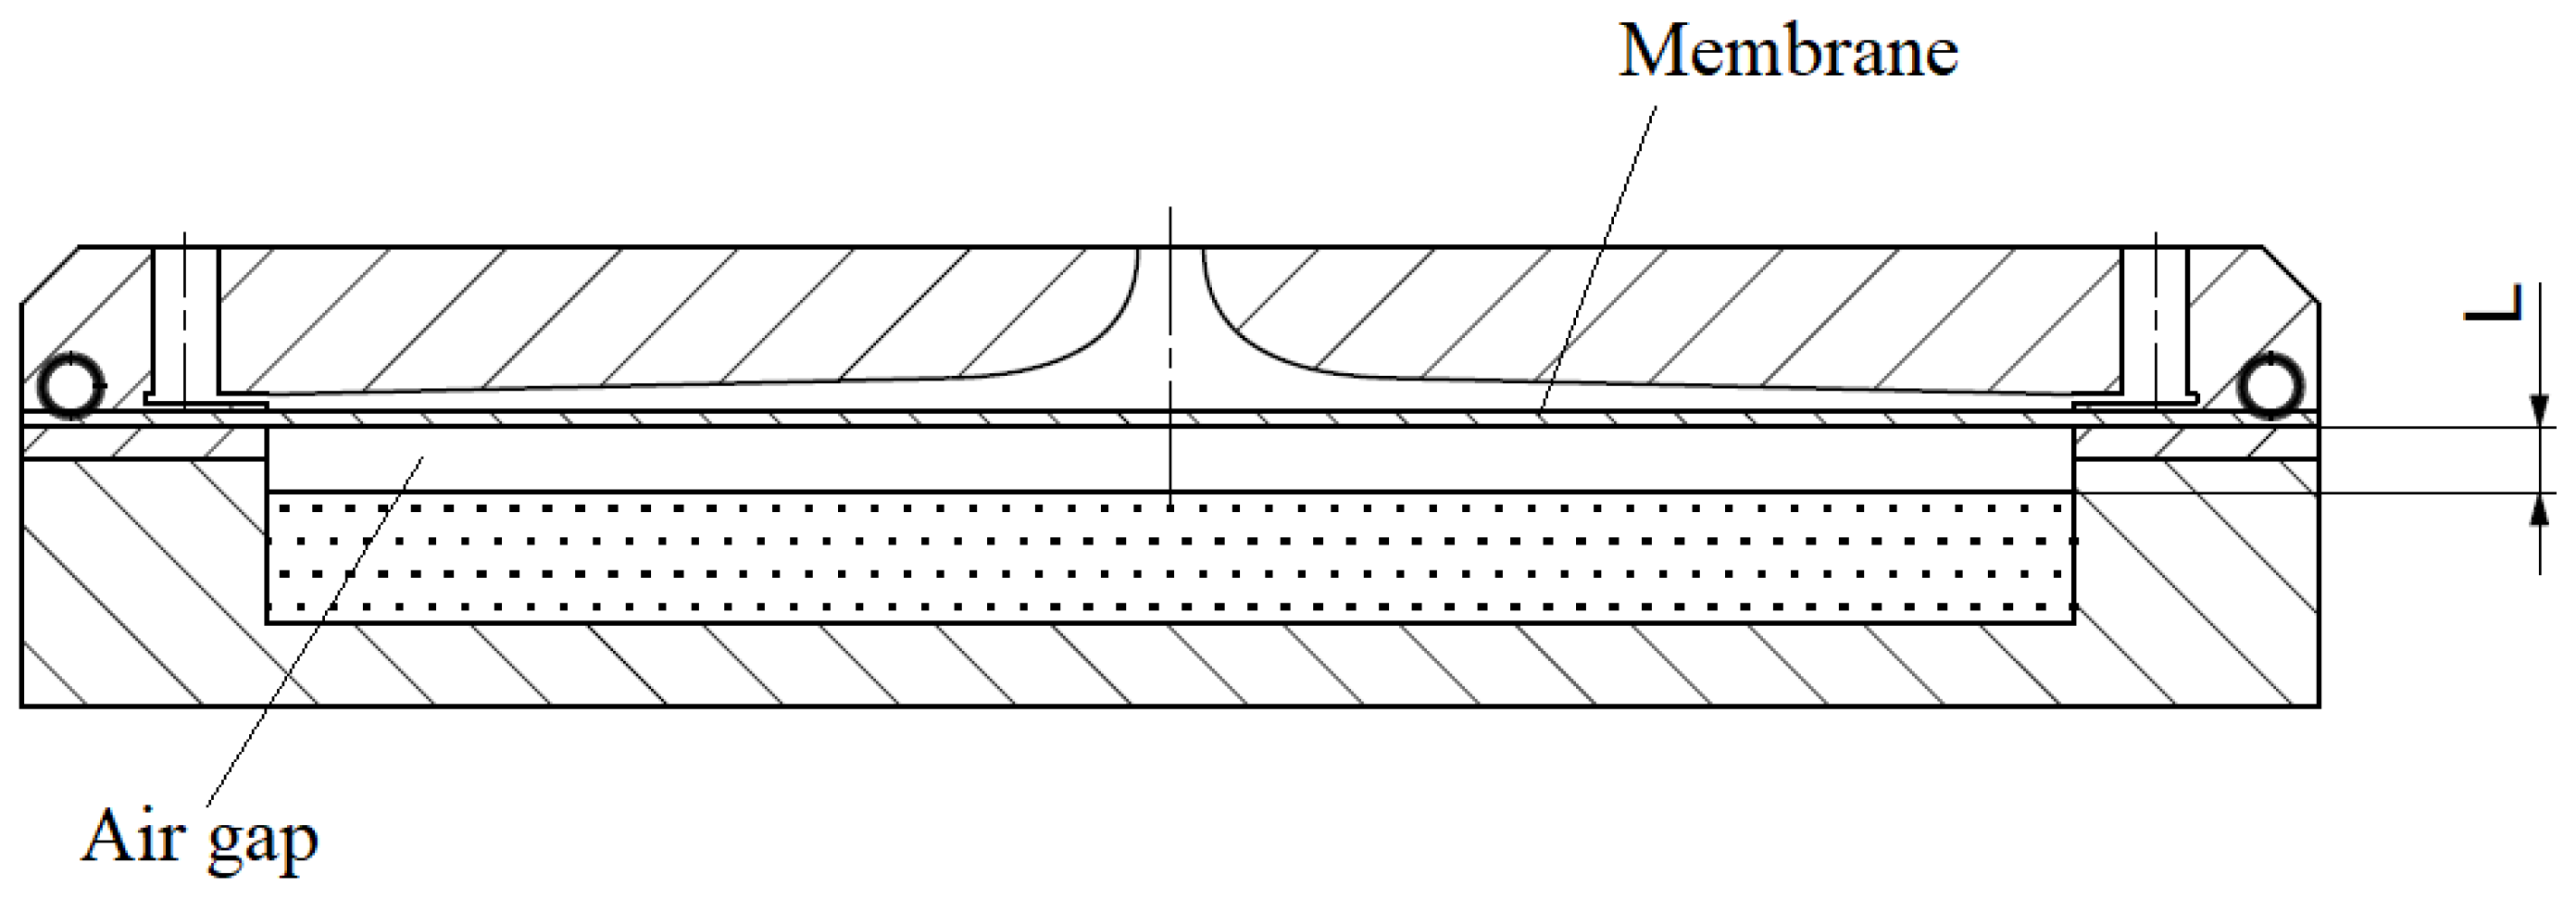
Vaporized water from the saturated air layer above the water surface diffuses through the air gap below the membrane and is absorbed by the membrane’s bottom surface. The water vapor permeation rate
J (kg/m∙s) is expressed as
where
is the equivalent vapor diffusivity in the air gap (m
2/s) and
L is the gap height (m). The moisture absorbed into the membrane is diffused through the membrane thickness on the side of the flowing air. The permeation rate of the water vapor across the membrane is expressed as
where
is the membrane thickness (m),
is the water vapor diffusivity in the membrane (kg/m
2∙s),
is the water uptake of the membrane (kg/kg), and
is the humidity ratio in the air (kg/kg).
The diffused moisture collected on the membrane surface facing the flowing air is taken by convection, creating a humidity gradient between the inlet and outlet air. The permeation rate between the membrane surface and the flowing air is expressed as
where
k is convective mass transfer coefficient (m/s), and
is the average humidity ratio between the inlet and outlet air (kg/kg).
The above-described resistances can be summarized as the total mass transfer resistance:
The relationship between the permeation rate and total mass transfer resistance
(m
2∙s/kg) is
The total mass transfer resistance can be calculated from the measured humidity ratio difference between the inlet and outlet air and the logarithmic humidity ratio difference between the water surface and air stream.
The logarithmic humidity ratio difference between the saturated air above the water and the airstream is given by
Finally, the water vapor diffusivity in the membrane (kg/m
2∙s) can be obtained from the following equation:
where the humidity ratio at the membrane air side
can be expressed by Equations (3) and (6) after the convective mass transfer is obtained. The humidity ratio at the membrane’s water side
can be expressed by Equations (1) and (6).
If the membrane density is known, the diffusivity can be expressed in units (m
2/s) by the following equation [
17]:
where
is the dimensionless coefficient of the diffusive resistance for the membrane material presented by Zhang et al. [
3].
The correlation between the equilibrium water uptake of the membrane and the relative humidity is given by:
where
(kg/kg) represents the maximum moisture content of the water vapor in the membrane at a given temperature at
RH = 99%. The shape of the sorption curve is given by constant
C.
6. Mathematical Model of the Exchanger
According to several studies, operating conditions and material properties have a significant influence on latent effectiveness. An analysis to determine the most influential parameters of heat and vapor transport was presented by Dugaria et al. [
2]. The influence of the diffusivity, sorption coefficient, maximum water uptake, material heat conductivity, and membrane thickness were investigated. The increase in the moisture diffusivity in the membrane caused a significant increase in the latent heat flux. The sorption coefficient only had a minor effect on the mass transfer. The increase in the maximum water uptake increased the moisture transfer through the membrane. The fundamental solution for minimizing the moisture transfer resistance in the membrane is to reduce the membrane thickness. On the other hand, the membrane thickness and heat conductivity of materials show almost no influence on the sensible effectiveness.
Zhang et al. investigated the effect of the operating conditions on the latent and sensible effectiveness of a parallel-plates enthalpy exchanger [
3]. Three membrane plates were investigated, showing similar values of sensible effectiveness. According to the results, it can be stated that operating conditions and material properties had little impact on sensible heat recovery. On the other hand, the moisture transfer was significantly influenced by the material properties, the most influential of which are the material thickness and sorption potential. The more hydrophilic a material, the higher the latent effectiveness that can be expected. Lee et al. [
5] investigated the influence of airflow, humidity, temperature, and fin properties on heat and latent effectiveness. The values of the fin efficiencies for heat transfer were between 0.11 and 0.13. The fin efficiencies for the moisture transfer yielded much smaller values of between 0.006 and 0.014, whereas a higher efficiency was observed under heating conditions. The fin contribution to the mass transfer represented only 2%. The conduction resistance of the partition plate represented only 1% of the resistance due to the dominant convective resistance in the boundary layer. For the moisture transfer, however, the resistance in the membrane was dominant, with 72% and 76% under cooling conditions and 44% and 52% under heating conditions.
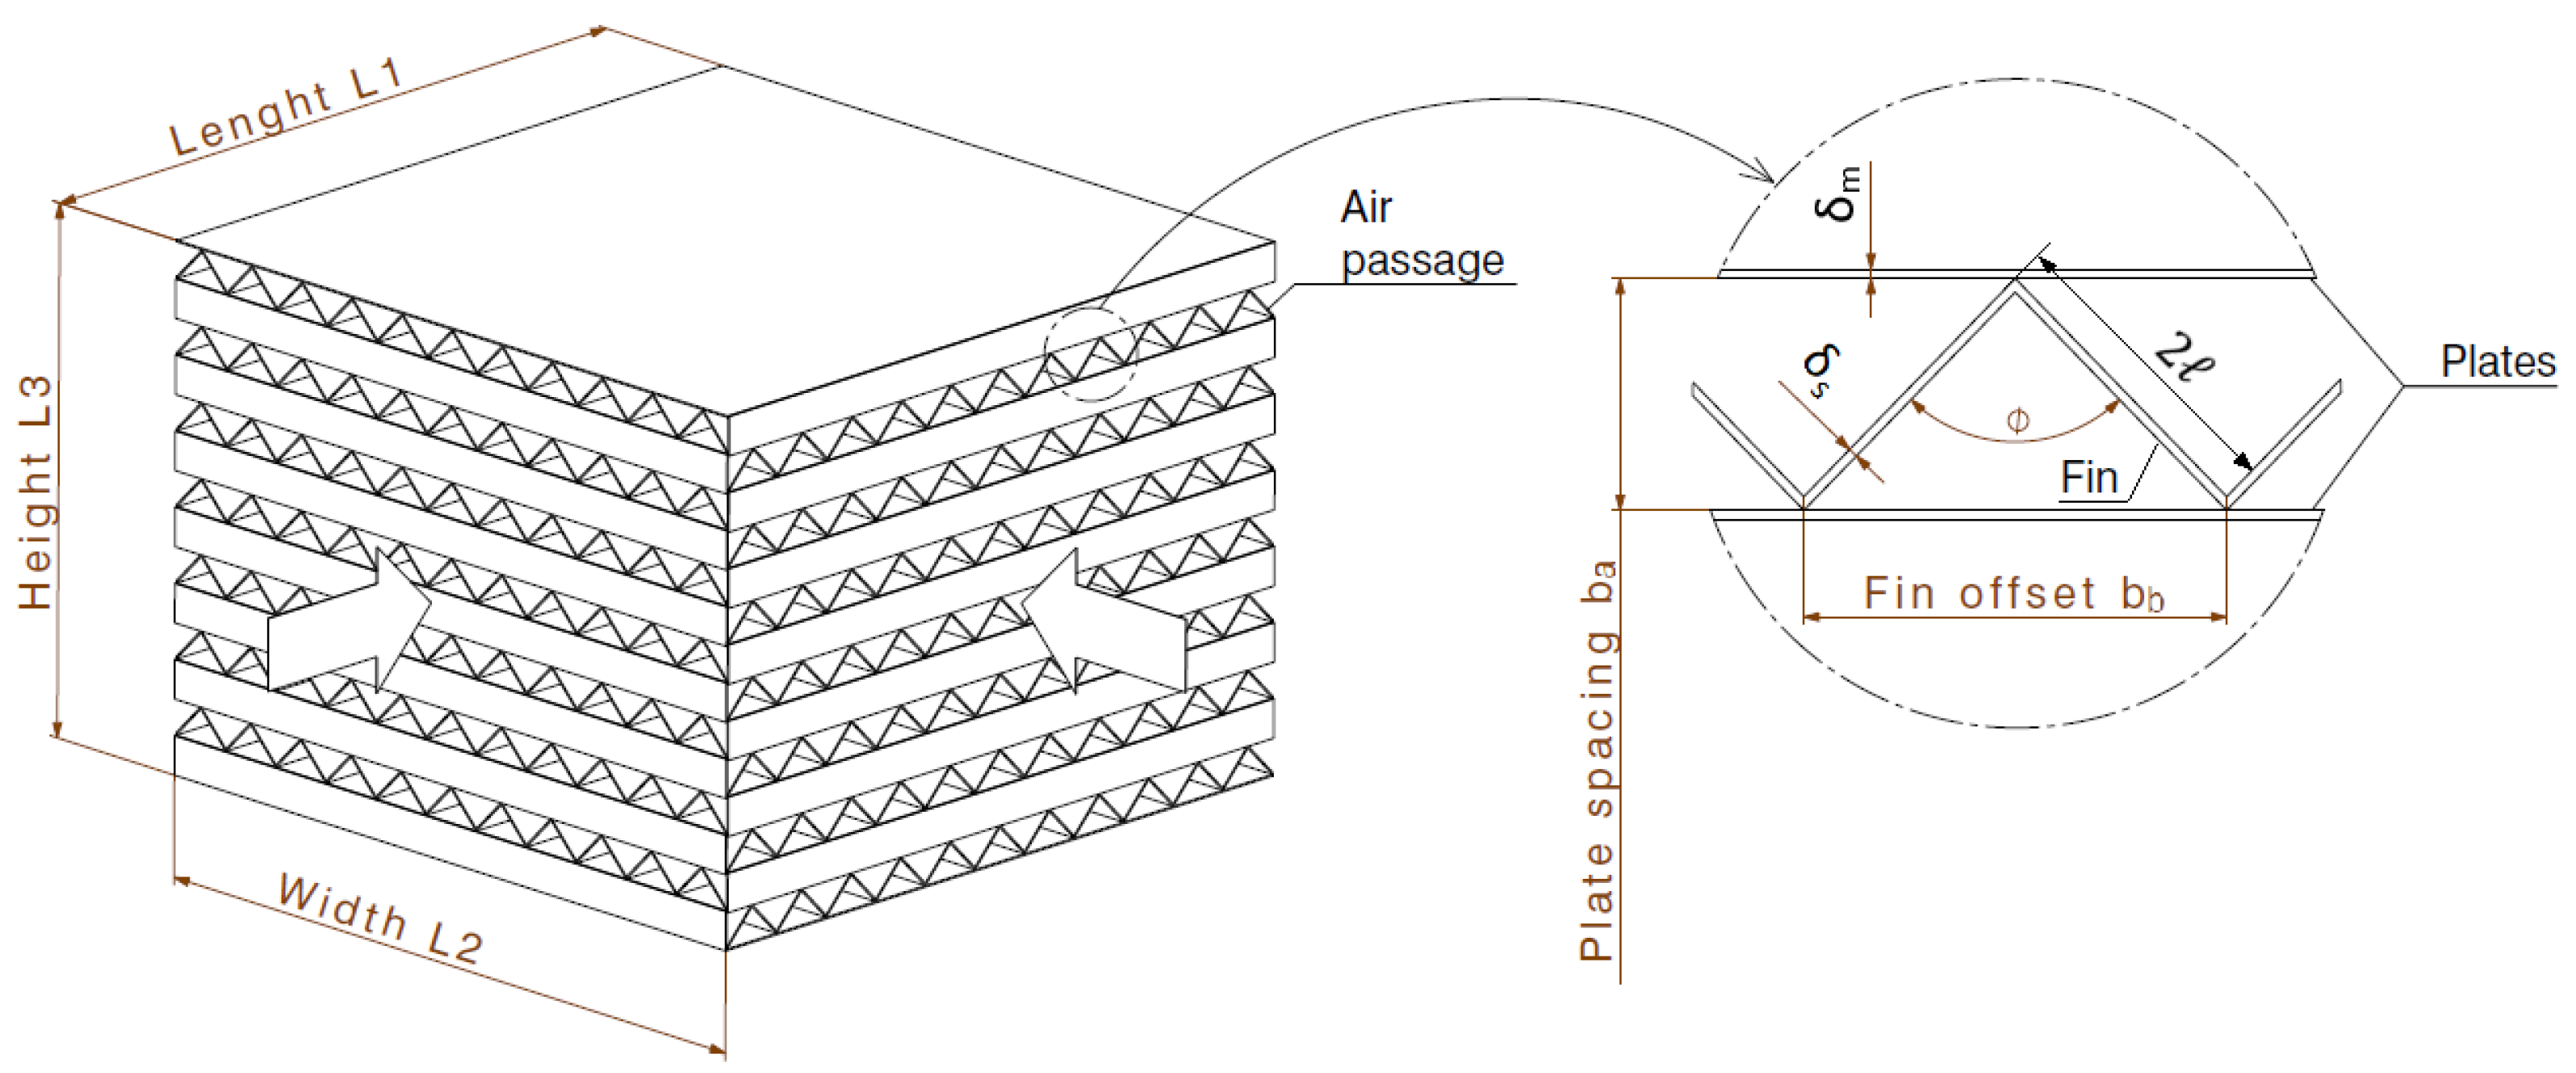
A mathematical model has been developed in this study to predict the heat and moisture transfer effectiveness and pressure drop of an air-to-air single pass membrane-based enthalpy exchanger with a cross-flow arrangement. The exchanger core was built into the separator/spacer configuration, as presented in
Figure 11. The spacer was shaped in the form of a plain triangular fin surface. The spacer material was aluminum with a thickness of 0.135 mm, which provided mechanical stability to the exchanger core. The plate material properties were the same as the investigated membranes. The membrane properties were obtained from previous experiments and were used in the following calculations. Information about the core and surfaces is summarized in
Table 4.
6.1. Model Assumption
The mathematical model of the heat and mass transfer in the membrane-based enthalpy exchanger was based on the following assumptions:
The heat and mass transfer processes are in a steady state.
The heat conduction and water vapor diffusion along the flowing air direction are neglected.
Moisture diffusion through the membrane is one-dimensional in direction (z).
The physical properties of the membrane are constant.
The water uptake of the membrane is in an equilibrium adsorption state
6.2. Heat Transfer Module
The mathematical derivation of the heat transfer was adopted from the effectiveness-NTU method. The correlations for the heat transfer module were adopted from the available literature [
21]. The model was a rating problem with known geometry, flow arrangement, flow rates, and incoming fluid temperatures. The purpose of the model was to predict the thermal effectiveness and pressure drop of each air stream.
The density of the air is expressed as
where the value of the gas constant of air
R is 284.07 (J/kg∙K);
p is pressure in Pa; and
T is the temperature in Kelvin (K).
The mass flow rate
(kg/s) is defined as
where
is the volume flow of the air (m
3/s) and
is the air density (kg/m
3).
To obtain the properties of the air in the exchanger core, the sensible effectiveness of the exchanger must first be assumed. For the cross-flow arrangement, the usual sensible effectiveness
ε = 0.75 can be expected [
22].
The temperature of the leaving air with the assumed sensible effectiveness can be calculated as
The average temperature of the cold and hot air can be calculated as
The thermophysical properties of the hot and cold air are summarized in
Table 5 and can be found in the thermophysical tables for air in [
21].
The Nusselt number for the triangular duct for the Prandtl number = 0.7 is calculated according to Equation (23).
The mass velocity
G (kg/m
2∙s) is expressed as
where
Ao is the free flow area in (m
2).
The definition of the Reynolds number is
The values of the Reynolds numbers for this calculation range from 66 to 230, representing the laminar flow in the channels of the exchanger core.
For the different fin types, the characteristic length L is different. For a plain, wavy, and offset fin, the characteristic length is defined by the hydraulic diameter Dh.
The definition of
j is [
24]
The Nusselt number can be obtained from the polynomial equation for a triangular (isosceles) duct for a fully developed laminar flow obtained from the literature [
23].
The relationship between the Reynolds number and friction factor for the isosceles triangular duct is
where
is the apex angle of the triangular duct (°).
The heat transfer rate at the interface between the solid and gas is described as the convective heat transfer coefficient
h (W/m
−2∙K
−1) and can be obtained from the calculated
j factor:
where
is the specific heat (kJ/kg∙K)
The coefficient m for the idealized plain triangular fin can be expressed as
where
is the heat conductivity of the fin material (W/m∙K) and
is the fin thickness (m).
The fin effectiveness for the heat transfer can be expressed as [
5]
where
is the fin length (m).
The overall surface efficiency is
where
is the fin area and
A is the total heat transfer area (m).
The separation plate conduction area
Am is expressed as
where
is the number of passages for the air.
The membrane heat resistance and overall conductance (K/W) can be expressed as
To determine the
NTU, first,
needs to be calculated:
The sensible
NTU is
where
Us is the total heat transfer coefficient (W/m
2∙K).
The following equation is proposed for the sensible effectiveness of the cross-flow exchanger [
24]:
6.3. Mass Transfer Module
Similar to the heat transfer module, the unmixed steady-state mass transfer form of ε-NTU equations is applied to the mass transfer module. The correlations for the mass transfer module were adopted mainly from the work of Zhang et al. [
17] and Zhou et al. [
24].
The latent effectiveness of the cross-flow arrangement can be written as
In the case of the mass transfer, the specific heat ratio is replaced by the mass flow ratio
R*.
The number of transfer units (
NTU) for the mass transfer is written as
where
is the total mass transfer coefficient (kg/m
2∙K) and
is the surface of the membrane (m).
The total moisture transfer resistance is described as individual resistances in series:
where
k is the convective mass transfer coefficient (kg/m∙s),
is the membrane permeability (kg/m∙s), and
is the surface efficiency for the moisture transfer obtained by correlation:
where
Af is the fin area.
The fin efficiency is expressed as
The coefficient
m for the idealized plain triangular fin can be expressed as
where
is the fin permeability (kg/m∙s)
The moisture permeability of the fin is approaching zero due to the aluminum as the fin material. The fin efficiency for the moisture transfer is negligibly small even if the fin material is made from hydrophilic material [
5].
The convective moisture transfer coefficient
hm (kg/m∙s) can be obtained using the Chilton–Colburn analogy with the convective heat transfer coefficient and Lewis number [
5,
25].
The Lewis number is the ratio between the Schmidt and Prandtl numbers and its calculated value is around 1.15.
The Schmidt number is defined as
where
is the dynamic viscosity of the air (kg/m∙s) and
is the water vapor diffusivity in the air (m
2/s). According to the literature, the value of the vapor diffusivity in the air at 25 °C is 2.6 × 10
−5 m
2/s.
The water uptake of the membrane at a given relative humidity is represented as:
The relative humidity and weight ratio of the moisture in the air are related with the following formula:
where
po is the atmospheric pressure (Pa) and
ps is the saturation vapor pressure (Pa).
The saturation vapor pressure at a given temperature can be expressed by the following correlation:
The values of constants are
C1 = −5800,
C2 = 1.3915,
C3 = 0.0486,
C4 = 0.4176 × 10
−4,
C5 = −0.1445 × 10
−7, and
C6 = 6.5460 [
8].
The membrane permeability (kg/m∙s) is expressed as:
From the calculated latent effectiveness, the relative humidity in the outlet of the hot air can be expressed as [
22]:
The total effectiveness from the mass flow and enthalpy of the wet air is [
22]:
where the enthalpy of the wet air is:
The pressure drop is calculated using the following formula:
where
gc is the proportionality constant in Newton´s second law of motion,
gc = 1, and
rh is the hydraulic radius and can be expressed as
Dh/4. The dimensionless contraction and expansion pressure loss coefficients for the flow at the heat exchanger entrance and exit
Kc and
Ke can be obtained from the frontal/free-flow area ratio
Ϭ, fin geometry, and Reynolds number [
21].
7. Results
In this part of the study, the sensible and latent effectiveness of exchanger cores with different membranes were calculated. All the results were presented with the uniform temperatures and relative humidities in
Table 4, simulating cooling under summer conditions. The diffusive properties of the three membranes were obtained experimentally in the previous section. The other thermophysical properties were summarized in
Table 5.
7.1. Core with Different Membrane Materials and 20 µm Plate Thickness
In order to compare the influence of the membrane properties on the latent and sensible effectiveness, the uniform plate thickness was set at 20 µm. The volume flow was in the range of 500 to 3500 m3/h and the pressure drop was in the range of 50 to 300 Pa. The plate spacing was fixed at 2 mm.
In
Figure 12, the sensible effectiveness of the membranes and aluminum plate with a uniform thickness is compared. According to the results, there was a negligible effect of the heat conductivity of the plate material on the sensible effectiveness. The reason for this was the dominant convective resistance in the boundary layer compared to the heat conductivity of the material [
3]. On the other hand, there was a significant effect of the membrane properties on the latent effectiveness, with the highest latent effectiveness found for the PE/PUR and CA membrane cores. The high latent effectiveness of the PE/PUR core was caused by the high water vapor diffusivity of the membrane. The CA core performance was more influenced by its higher sorption potential.
Effectiveness of the investigated membranes with thickness of 20 µm under given volume flow and pressure drop are summarized in
Table 6. The sensible effectiveness of the PE/PUR core at a nominal volume flow of 2000 m
3/h and a 200 Pa pressure drop is 80.4% and 58.1% for the latent effectiveness.
7.2. Core with Different Membrane Materials and 100 µm Plate Thickness
Despite the latent effectiveness of the core with a 20 µm-thick plate being relatively high, the mechanical stability of such a core may not be sufficient to withstand the pressure difference between the airflows under standard operating conditions. A high-enough pressure difference can compress one of the air streams and in extreme cases, a blockage of one of the airstreams can occur. For this reason, considering the mechanical properties of the membrane, a thickness of 100 µm is preferable. In this section, the plate thickness was set to 100 µm with the operating conditions the same as in the previous section.
As seen in
Figure 13, a strong correlation existed between the membrane thickness and latent effectiveness. Changing the membrane thickness from 20 µm to 100 µm caused a decrease in the latent effectiveness by 18 to 67%, whereas the sensible effectiveness remained almost unchanged and the expected decrease ranged from 0.35 to 1.5%.
Effectiveness of the investigated membranes with thickness of 100 µm under given volume flow and pressure drop are summarized in
Table 7. The sensible effectiveness of the PE/PUR core at a nominal airflow of 2000 m
3/h and a 200 Pa pressure drop was 80% and only 29.7% for the latent effectiveness.
The increase in the membrane thickness significantly reduced the latent effectiveness. The sensible effectiveness remained almost unchanged. The total effectiveness decreased proportionally. As stated by Min et al. [
25], an increased membrane thickness will cause increased thermal and moisture resistances. In order to reach the desired latent effectiveness at the current thickness, the membrane with the higher sorption potential and water vapor diffusivity should be used.
7.3. Influence of Different Plate Spacings
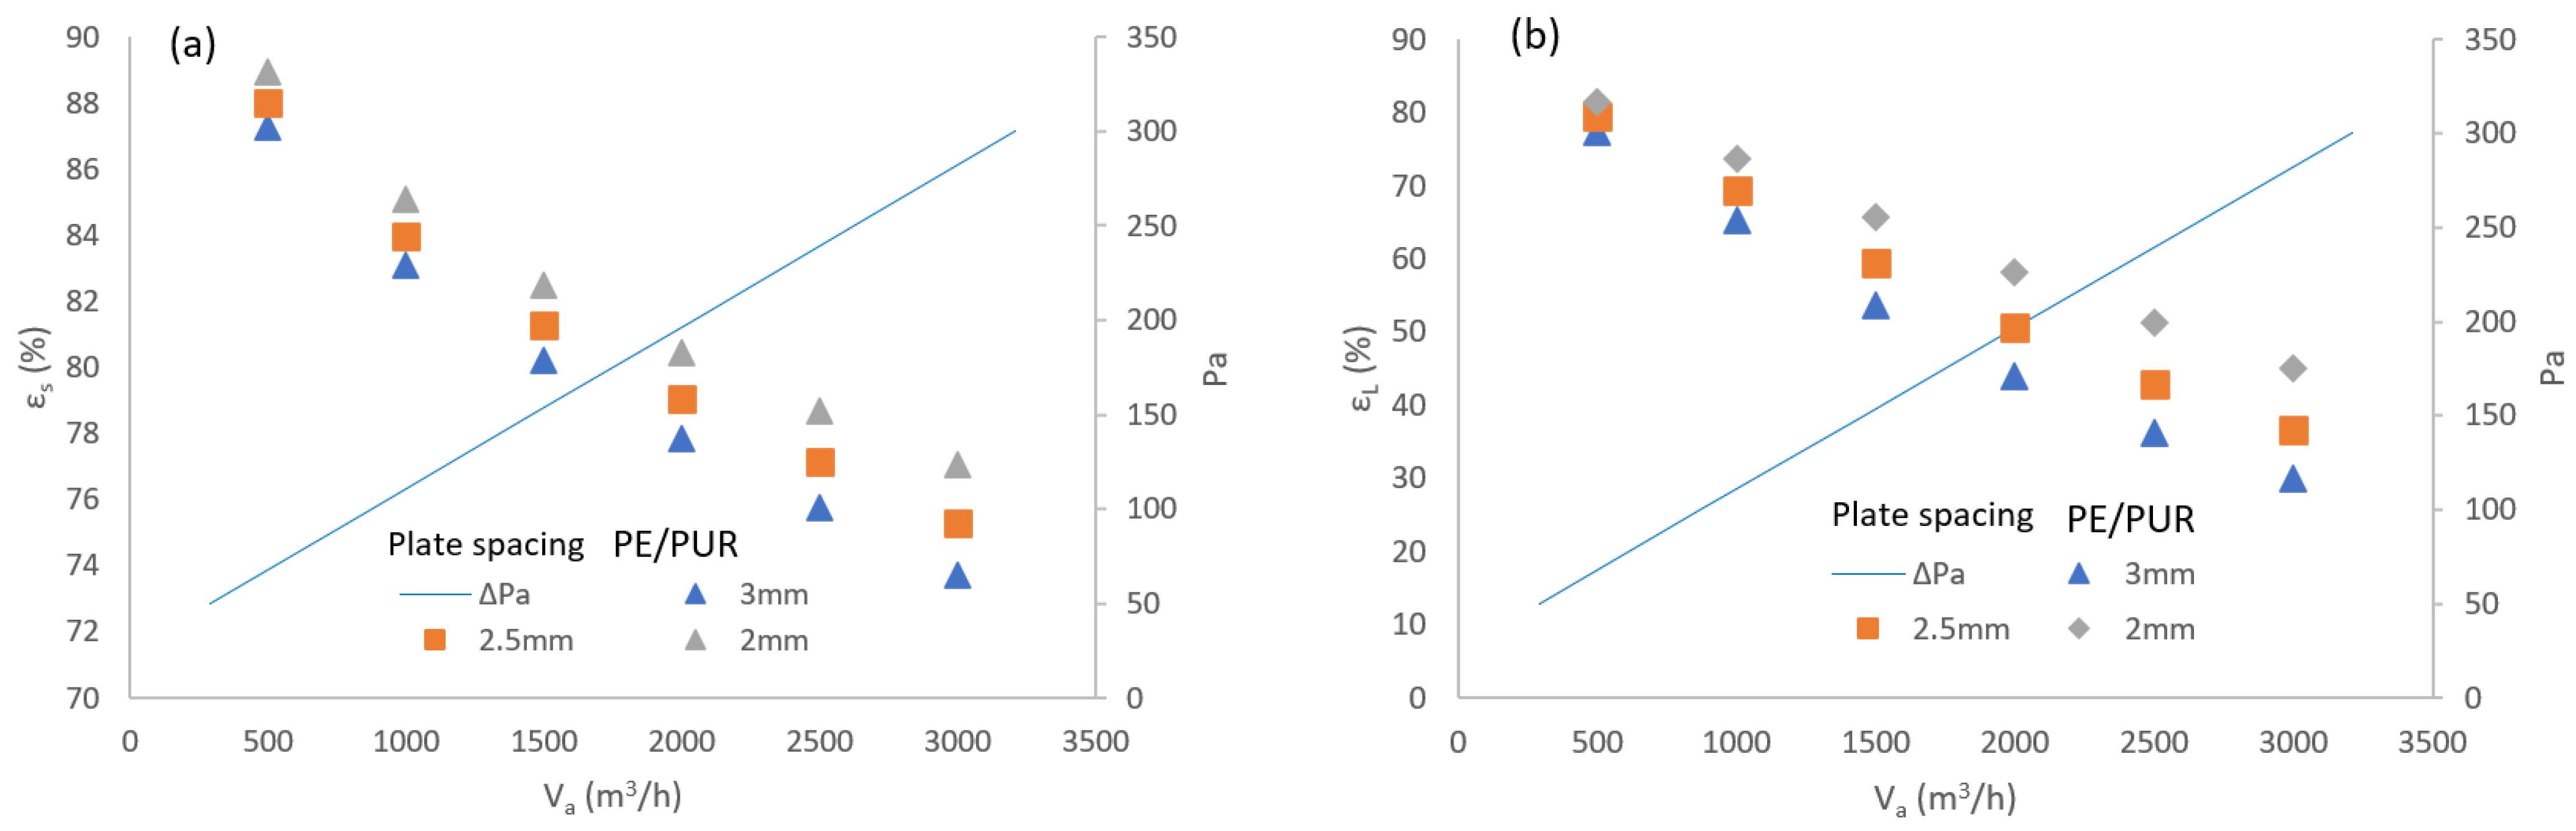
In this section, three different plate spacings were modeled to predict the core performance. The spacings of the 20 µm plates were 2 mm, 2.5 mm, and 3 mm. The pressure drop was unchanged by varying the fin offset and therefore the fin density for each plate spacing.
According to
Figure 14, the increase in the plate spacing caused a drop in both the sensible and latent effectiveness, with the drop in the latent effectiveness being more significant. The drop in the effectiveness was caused mainly by the decrease in the transfer area of the core. The sharper drop in the latent effectiveness can be explained by the membrane’s material having a greater contribution to the moisture transfer of the total moisture transfer than the heat conductivity of the total heat transfer in the core. Changing the plate spacing from 2 mm to 2.5 mm caused a decrease in the sensible effectiveness of 1.04% and up to 2.28% for various volume flows. The drop in the latent effectiveness of 2.6 and up to 18.83% was expected. Changing the plate spacing from 2 mm to 3 mm caused a decrease in the sensible effectiveness of 1.9% and up to 4.33%. and a drop in the latent effectiveness of 5.12% and up to 33.3%. For the PE/PUR core at a nominal airflow of 2000 m
3/h and a pressure drop of 200 Pa, changing the plate spacing from 2 mm to 2.5 mm caused a drop in the sensible effectiveness of 1.72% and the latent effectiveness of 13.03%. Changing the plate spacing from 2 mm to 3 mm caused a drop in the sensible effectiveness of 3.23% and 24.33% for the latent effectiveness.
8. Conclusions and Discussion
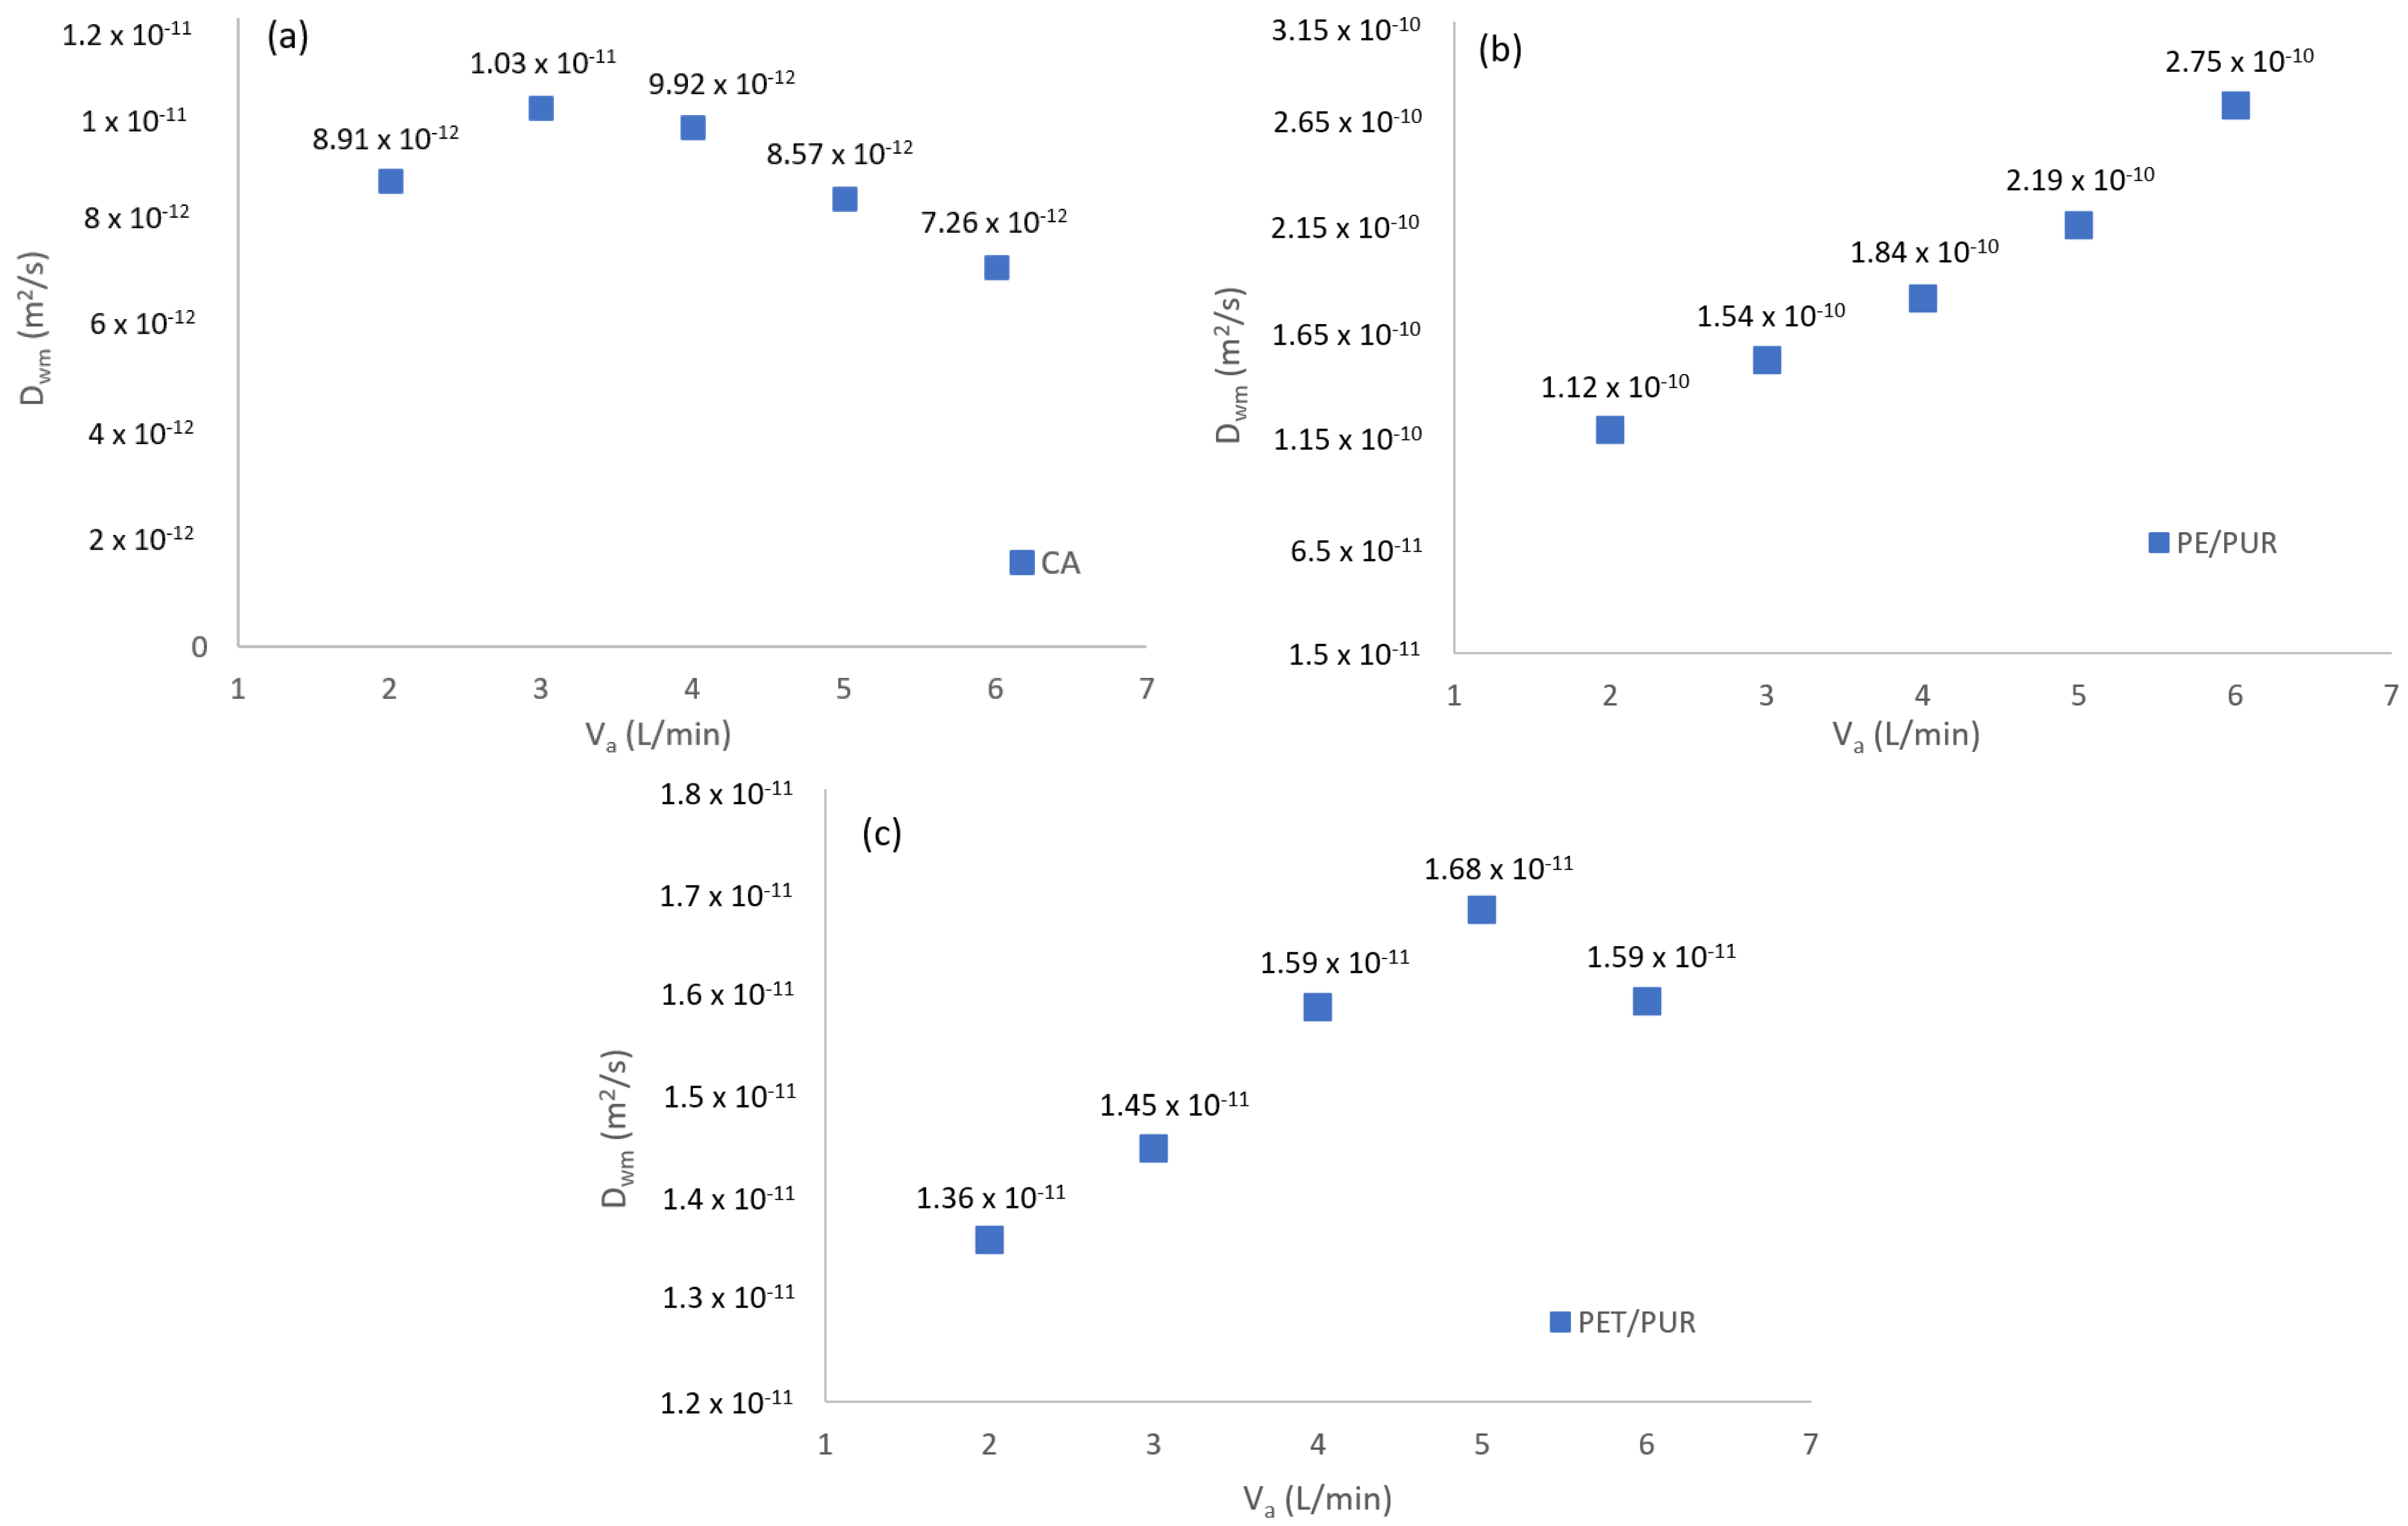
In the first section, the values of the water vapor diffusivity of three polymer membranes with different structures and materials were experimentally obtained. The values of the water vapor diffusivity of the composite PE/PUR, PET/PUR, and CA membranes were compared, with the values presented by other authors showing agreement with the results in this study. The experiments showed that the PE/PUR and CA membranes had higher diffusivity than the PET/PUR membrane, which was mainly due to their preferable microstructure. However, the vapor diffusivity in the membrane was not the only factor influencing the water transport capability of the membrane. The second most influential parameter was the maximum water uptake of the membrane, followed by the constant representing the sorption curve. For practical applications, a high water sorption potential caused an increase in the membrane’s weight and negatively influenced the mechanical properties. The high moisture content in the membrane promoted microbial growth. With the thicker PE/PUR membrane, the vapor transfer through the membrane material represented a major portion of the mass transfer resistance. With the thinner membrane, the convective resistance became more significant, although the very thin membrane lacked the strength necessary for proper operations and manufacturing processes.
The obtained and sampled data were used in the mathematical model of an enthalpy exchanger core to predict the latent and sensible effectiveness under various operating conditions and plate spacings. The results showed a minor influence of the heat conductivity and plate thickness on the sensible effectiveness if the plate was reasonably thin (100 µm). The reason for this was the much higher contribution of the resistance in the boundary layer of the plate to the total heat transfer resistance. However, for the mass transfer, there was a significant influence of the membrane thickness and properties on the latent effectiveness. The thinner membrane created less resistance for moisture transfer. The higher the vapor diffusivity and maximum water uptake, the higher the flux of the moisture through the membrane; therefore, higher latent effectiveness of the membrane core can be expected. The increase in the plate spacing negatively influenced the sensible and latent effectiveness. With bigger spacing, less plates are required to build exchanger core, causing reduction of heat and the moisture transfer area. The fundamental approach to increasing the sensible and latent effectiveness is by increasing the transfer area, decreasing the membrane thickness, and decreasing the volume flow through the exchanger.


