Abstract
The effects of hydrogen-enriched biogas on combustion and emissions of a dual-fuel spark-ignition engine with different hydrogen concentration ratios were studied numerically. A 1-cylinder spark ignition was used to perform a numerical simulation. To reveal the influence of the compression ratios on combustion and emissions of a gaseous engine, the crankshaft of the engine was modified to generate different compression ratios of 8.5, 9.0, 9.4, 10.0, and 10.4. The biogas contained 60 and 40% methane (CH4) and carbon dioxide (CO2), respectively, while the hydrogen fractions used to enrich biogas were 10, 20, and 30% of the mixture by volume. The ignition timing is fixed at 350 CA°. The results indicate that the in-cylinder pressure, combustion temperature, and combustion burning speed increase gradually with increasing hydrogen concentration due to the combustion characteristics of hydrogen in blends. As increasing the compression ratio, NOx emissions increase proportionally, while CO2 emissions decrease gradually. Almost no combustion process occurs as operating the compression ratio below 8.5 when using pure biogas. However, adding 20% of hydrogen fraction could improve the combustion process significantly even at a low compression ratio.
1. Introduction
Due to concerns about environmental management and energy shortages, the vehicle industry has recently focused on the use of alternative fuels in an internal combustion engines. Many researchers have completed work on reducing emissions, improving engine performance, and fuel consumption in both numerical and experimental studies. Biogas, mainly composed of methane, can be used as an alternative fuel on a conventional spark ignition (SI) engine due to its advantages in lean-burn capability. In addition, biogas can be considered renewable energy since there is no major system modification needed on the SI engine. Using biogas could prevent the knocking phenomena since its octane number is high [1,2]. The disadvantages of using biogas as fuel are (a) the lower heating value of methane (CH4) might lead to incomplete combustion and (b) carbon dioxide (CO2) causes a diluent fuel mixture [3,4,5].
Using pure hydrogen as a fuel for the ICE could avoid many problems, i.e., low power density, high NOx emissions, and knock or backfire phenomena. This is because the absence of carbon atoms in hydrogen’s composition induces lean combustion (i.e., zero emissions of CO2, CO, and HC) [6,7,8,9,10]. However, knock combustion is one of the disadvantages of the use of hydrogen as a fuel for ICE. For instance, a numerical modeling analysis by Robert et al. [11] revealed the link between the pressure wave and flame front, resulting in a considerable rise in local pressure and temperature. This finding shows that super-knock is characterized by a shift from deflagration to an explosion. The knock combustion is linked to micro variables such as flame speed and the unburned mass fraction. Another numerical study proposed by Yu et al. [12] revealed the effects of flame speed on knock by using 1D cylindrical geometry flame propagation and end-gas autoignition in a closed cylindrical chamber. They concluded that knock intensity increased with flame speed when the unburned mass fraction was large, while the opposite trend occurred when the unburned mass fraction was small.
Combined biogas and hydrogen as fuel blends are another possible solution to improve combustion performance, emission, and fuel consumption of IC engines. The effects of H2 addition into the blend have been widely investigated with various combustion types since blends exhibit some advantages, such as combustion enhancement and reduction of pollutant emissions of CO and HC [13,14,15,16,17]. Additionally, hydrogen in blends improves the burning velocity even with a small amount. For instance, Benaisa et al. [16] presented a numerical simulation using two chemical algorithms of 0-D Senkin and 1D Premix. They used the biogas composition of 60% CH4 and 40% CO2 blended with H2 concentration which varied in the range of 0 to 50% in the fuel. The results exhibited that biogas-enriched hydrogen improves flame speed and ignition delay. In addition, that the flame speed is substantially increased with the increasing hydrogen addition, and the increment of hydrogen concentration in blends can be linearly correlated with the flame speed. This is because the rate of hydroxyl H2 oxidation reaction is increased when the hydrogen percentage in biogas fuel is increased, resulting in increased fuel consumption and improved overall reactivity of the biogas/hydrogen–air combination. Therefore, the rise in laminar flame speed, heat release rate, and adiabatic flame temperature with increasing beginning temperature is due to the huge synthesis of radicals, which speeds up the combustion process. Wei et al. [17] reported the total emissions (i.e., CO, NOx, NO2, and NO2/NOx ratio) of laminar premixed biogas–hydrogen impinging flames by experiment and numerical calculation. They concluded that the emission index of CO exhibits a low value at the small and large concentrations of hydrogen, while the NO value is affected by the separated distance. In fuel-rich conditions, the decrease in NO leads to a reduction in NOx concentration. Law [18] reported the flame front speed in a mixture of 85 and 15% of hydrogen and methane, respectively. The results showed a substantial reduction in laminar burning velocities with hydrocarbon substitution. In addition, this supported the potential of propane as a suppressant of both diffusional–thermal and hydrodynamic cellular instabilities in the hydrogen–air flames. Ilbas et al. [19] claimed that the burning velocities are increased, and the flammability limit is enlarged with increasing hydrogen addition in hydrogen–methane blends. They also suggested that a mixture of 30% of hydrogen and 70% of methane could be a competitive alternative fuel for existing combustion plants. Di Iorio et al. [20] compared standard gasoline fuel, methane, and different methane/hydrogen blends in transparent single-cylinder DI (direct injection) and SI (spark ignition) engines in terms of engine performance and exhaust emissions. The flame propagation speed is increased with increasing hydrogen concentration in blends. The peak value of in-cylinder pressure is increased and moved toward TDC (top dead center) since the hydrogen fraction is increased; therefore, the combustion duration is decreased. Due to the increase in in-cylinder temperature, NOx emissions are increased appropriately.
In recent years, very few studies reported on the effects of various compression ratios (CRs) on the performance and emission properties of the SI engine with gaseous fuels [21,22,23,24,25]. For instance, Oh et al. [22] reported a study on the combustion and emission characteristics of a high CR, single cylinder, and SI engine fueled by a hydrogen-enriched gas mixture. The CRs were varied in the range of 10:1 to 17:1 by modifying the shape of the combustion chamber. The air–fuel ratio was operated from 3.5 (i.e., the lightest load) to 1.0 (i.e., the highest load). The spark timing was performed to optimize the timing at different load conditions. The highest indicated thermal efficiency was at CR = 17, 51% of load condition, and the air–fuel ratio (AFR) within the range of 2.0 ≤ AFR ≤ 3.0. At these conditions, the NOx emission attained a peak value. Duan et al. [23] investigated experimentally the effects of changing CRs on heavy-duty SI engine performance and emissions using methane gas and hydrogen in blends. Two compression ratios were operated, i.e., 13.6 and 14.0. The engine was transformed from a high CR heavy-duty diesel engine to an SI engine. The fuel consumption is decreased as increasing hydrogen fraction in the blends. Additionally, the fuel consumption is reduced as increasing CR. The NOx emissions increased rapidly, while the HC emissions decreased with increasing hydrogen fractions. The CO emissions were not much affected by changing CR and hydrogen fractions in blends. In contrast, the CO2 was reduced significantly with increasing CR and hydrogen fractions. Sharma et al. [24] performed a numerical study on the effects of hydrogen energy share and CR on the combustion and emission characteristics of a dual fuel engine. There was a clear trade-off between the greatest hydrogen energy share and CR, according to the researchers. Furthermore, when the energy fraction of hydrogen increased at all compression ratios, emissions appeared to decrease. Zareei et al. [25] used the AVL Fire™ Software to reveal the effects of adding hydrogen into CNG fuel on the diesel engine. They demonstrated that increasing the amount of hydrogen in the HCNG combination increased NOx emissions while decreasing HC and soot emissions.
It can be realized from the above discussion that there were many studies separately on the combustion performance of engines fueled with hydrogen–biogas blends, pure hydrogen, pure biogas, or methane gas. However, there are few comparative analyses on the combustion and emissions of the engine fueled by different biogas–hydrogen blends while changing the CR, especially for the engine with low CR. Using numerical methods, this paper aims to provide a comparison of the combustion performance and emission features of the SI hydrogen–biogas engine at different compression ratios in the range of 8.5 ≤ CR ≤ 10.4, while the hydrogen fractions varied in the range of 0% ≤ H2 ≤ 30%. In particular, the advantages of combustion caused by the addition of hydrogen to biogas, as well as their contribution to engine performance and pollutant reduction due to the variation of compression ratios, were evaluated and numerically presented. The effects of changing the compression ratio were also investigated and discussed in the following sections.
2. Modeling Theory
2.1. Numerical Analysis
A commercial computational fluid dynamics code of ANSYS FLUENT was used to perform complex combustion and emissions of the dual-fuel engine using hydrogen–biogas as fuel. The simulation based on thermodynamic theories was employed to investigate the combustion performance and emission characteristics of the gas engine. The fundamental governing equations (continuity, momentum, energy, and species equations) were employed for solving the unsteady turbulent flow. The pressure-based segregated algorithm was used to work with the turbulence model. The RNG k-ε turbulence model was used to take account of the turbulent effects. This model has been used widely and is considered one of the suitable turbulence models for the study of combustion engine simulation [26,27]. The fundamental conservation of fluid equations was as follows:
The conservation of mass [28]:
where u, v, and w were velocity components in the directions of x, y, and z, respectively, was the fluid density.
The conservation of energy [28]:
where e was the specific energy (i.e., energy per unit mass).
The conservation of momentum [28]:
where μ was the dynamic viscosity of the fluid, p was the pressure, Su, Sv, and Sw were the generalized source terms in the equation, respectively.
The species mass conservation [28]:
where Cs was the concentration of species in the mixture; Ds was the diffusion coefficient of the component in the mixture; Ss was the mass per unit volume.
The chemical reaction mechanism used for the hydrogen–biogas combustion was based on the Arrhenius law, leading to a rate coefficient expressed as follows:
where A is the values of the pre-exponential coefficient, T is temperature, Ea is the activation energy, and is the temperature-dependent coefficient.
The four-step mechanism of Jones and Lindstedt [29] was used in this study as follows:
The NOx formation was estimated using an extended Zeldovich mechanism since the combustion temperature of hydrogen-enriched biogas is normally greater than 1500 K [30,31,32,33,34]. The NO was generated from three chemical reactions as follows:
The rate of formation of NO is,
where Ki is the rate of the constant of each reaction (i.e., i); The Kf is the association rate constant, and Kr was the dissociation rate constant. With T is the combustion temperature, the Kf,i and Kr,i are forward and reverse reactions and are given as follows:
2.2. Engine Model
Numerical modeling was performed on a single-cylinder spark-ignition Daewoo engine (model 168FB). The main engine specifications were listed in Table 1. The crankshaft of the engine was modified to provide five models corresponding to compression ratios CR of 8.5, 9.0, 9.4, 10.0, and 10.4. The engine was operated at a constant speed of 3000 rpm and 100% of the throttle opening angle. The ignition timing was fixed at 10 degrees before TDC, i.e., 350 Crank Angle (CA°). The calculation of crankshaft modifications and corresponding CRs is given in Table 2. The partially premixed model was employed for the combustion process. The geometry of the combustion chamber and its calculated space were shown in Figure 1. The grid convergence had been tested using Grid Convergence Index to keep the maximum uncertainty of less than 10% due to the discretization in CFD simulation, as suggested by Roache [35]. The test indicated that 295,251 cells were adequate. The mesh was a hybrid type with a total of 72,852 nodes.

Table 1.
Main specifications of the test engine.
Table 2.
Compression ratio estimations.
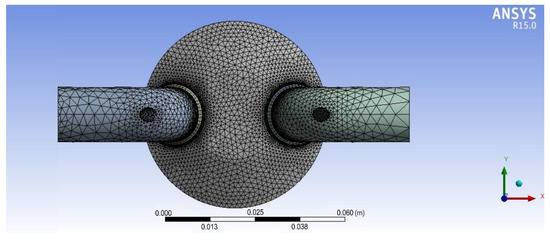
Figure 1.
The geometry of the combustion chamber and meshing.
2.3. Fuels
The biogas fuel used in this study consists of 60 and 40% of methane and CO2, respectively. The engine was fueled with different biogas–hydrogen blends of B100H0, B90H10, B80H20, and B70H30, indicating the content of biogas in different volume ratios (e.g., B90H10 contains 90% biogas and 10% hydrogen in volume). The dual fuel was injected separately by two-port injectors. The physical and chemical properties of biogas and hydrogen are indicated in Table 3. The simulations were conducted initially using pure biogas as the main fuel at 100% load to create the reference line data while varying CR. Then, further calculations were performed with different hydrogen additions in biogas (i.e., 5–30%) at various compression ratios. Finally, those results were compared with the reference line data to illustrate the influence of changing CR on the combustion and emission characteristics of the given mixture of fuels.
Table 3.
Fuel properties [36].
2.4. Model Validation
Before performing the simulations, the numerical model was validated to ensure the accuracy of the simulation results. To calibrate the combustion model using hydrogen-enriched biogas, the in-cylinder pressures were compared with the experimental and numerical results [6,36,37]. The NOx emission model was compared with the proposed results [27,38,39]. The simulation and experiment curves were nearly identical. The validation results exhibited the in-cylinder pressure and NOx emissions change in the same trend as varying the hydrogen fractions, shown in Figure 2 and Figure 3, respectively. The other results were assured by this validated model. In other words, the CFD model is considered valid for the modeling combustion engine process with hydrogen–biogas blends.
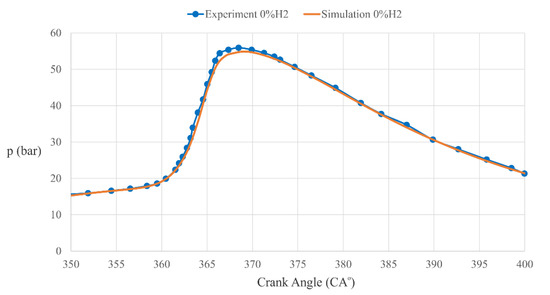
Figure 2.
Validation in-cylinder pressure versus crank angle at 0% hydrogen fractions [37].
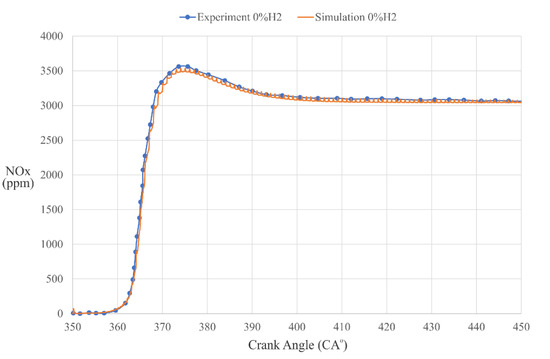
Figure 3.
Validation NOx emission versus crank angle at 0% hydrogen fractions [27].
3. Results and Discussion
3.1. In-Cylinder Pressures
Figure 4 exhibits the variations of in-cylinder pressure with the crank angles of a dual-fuel engine fueled with biogas enriched by hydrogen fractions of B100H0, B90H10, B80H20, and B70H30 at different compression ratios of CR8.5, 9.0, 9.4, 10.0, and 10.4. The dashed vertical lines in Figure 4a–d are indicated for the engine top dead center (i.e., at 360 CA°). As shown in Figure 4, the peak value of in-cylinder pressure increases and moves toward the engine top dead center (TDC) with an increased compression ratio. At a fixed compression ratio, the peak value of in-cylinder pressure increases when increasing the fraction of hydrogen in the mixture. By using pure biogas (B100H0), combustion could not be able to process since the compression ratio is about 8.5 or less than that (Figure 4a). As shown in Figure 4a, the pressure reaches a peak at TDC after the ignition timing and then decreases immediately as B100H0 is not burnt. However, as the fraction of hydrogen increases, the peak value of in-cylinder pressure increases rapidly (Figure 4b–d). It means that the biogas engine with a low compression ratio might work properly when adding some hydrogen into biogas. Since increasing the compression ratio, the combustion flame speed is increased appropriately due to the high heating value and burning speed of hydrogen. As shown in Figure 4d, the in-cylinder pressure raises slightly before the ignition timing for cases of high compression ratios. This is because, at a high compression ratio and appropriate in-cylinder gas temperature, the hydrogen in blends is easy to burn inside the combustion chamber since the spark ignition energy of hydrogen is very low compared to that of biogas. In general, the larger in-cylinder pressure results in a better heat-work conversion process and fuel consumption reduction by adding hydrogen into biogas. This is because hydrogen has a high laminar flame speed (Table 3). However, the in-cylinder pressure starts to decrease slightly as increasing the hydrogen fraction beyond a value of 20%. This is because biogas and hydrogen were separately injected into the intake port and premixed during the intake stroke. When the hydrogen consumption inside the combustion chamber was increased beyond H20, the hydrogen with low density occupied a large amount of in-cylinder volume. Therefore, the volumetric efficiency of the test engine decreased with the increase in hydrogen fractions.
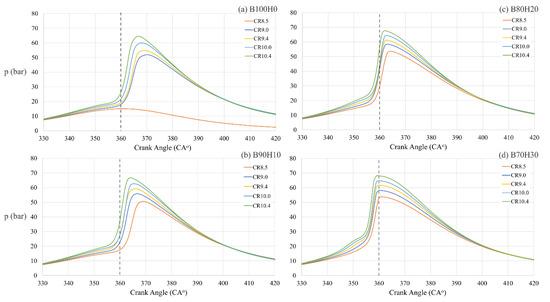
Figure 4.
In-cylinder pressure at different compression ratios and hydrogen fractions of (a) 0%, (b) 10%, (c) 20%, and (d) 30%.
Figure 5 displays the air–fuel ratio (AFR) at different compression ratios as changing the hydrogen fraction in blends. As shown in Figure 3a–d, the AFR increases with an increased compression ratio. For instance, at B100H0, the AFR in the case of CR8.5, 9.0, 10.0, and 10.4 is about 1.1, 1.15, 1.2, 1.25, and 1.3, respectively. These values of AFR (at specific values of CR) almost remain since hydrogen fraction varied from 0 to 30% in blends. This observation indicates that the engine can only work in the condition of a lean mixture (AFR > 1) for various compression ratios. The higher the compression ratio, the greater the AFR acquired.
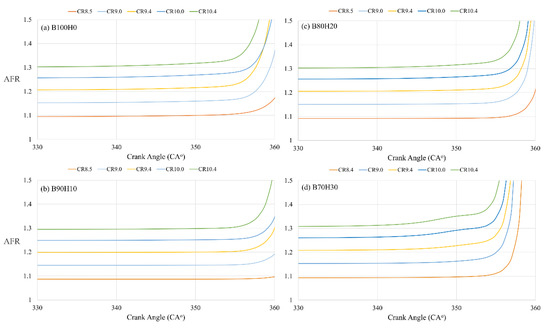
Figure 5.
Air–fuel ratio at different compression ratios and hydrogen fractions of (a) 0%, (b) 10%, (c) 20%, and (d) 30%.
Figure 6, Figure 7 and Figure 8 show the typical concentration of CH4, H2, and O2 in the combustion chamber, respectively, at the original CR of the engine (i.e., CR = 9.4) and different hydrogen fractions in the blend. As shown in Figure 6 and Figure 8, the CH4 and O2 consumption are reduced with increasing hydrogen fraction in blends in the early phase of the combustion process. The slopes of CH4 and O2 concentration curves in the case of pure biogas (i.e., B100H0) are gradually lower than those in the cases of adding H2 into the mixture during the combustion process. For instance, the slope of CH4 and O2 consumption curves drops almost vertically after the spark timing. This is due to the existence of H2 in the blends and it results in an increase in burning speed in the combustion chamber. In other words, using H2 could improve the combustion process due to the stage of the lean mixture. Figure 7 exhibits the trend of adding H2 fractions into biogas during the intake and compression strokes of the combustion process. For instance, the H2 fractions increase rapidly at the beginning of the intake stroke and decrease suddenly at the end of the compression stroke.
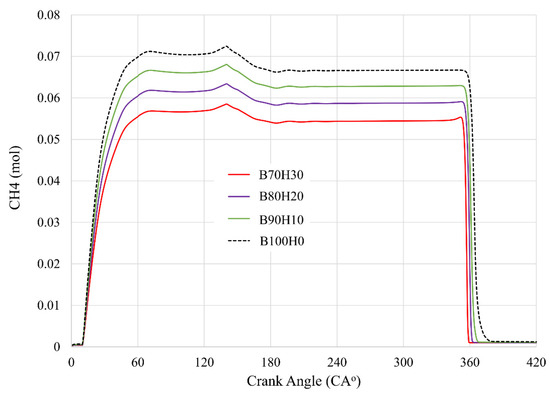
Figure 6.
Concentration of CH4 at CR9.4 and hydrogen fractions of 0%, 10%, 20%, and 30%.
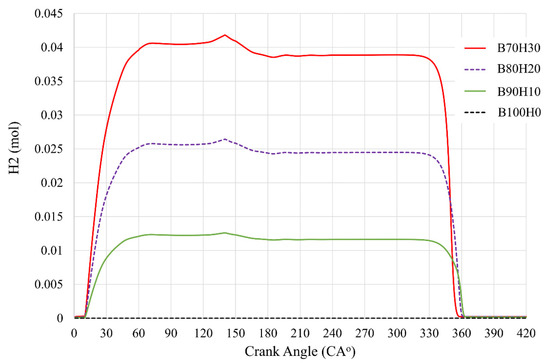
Figure 7.
Concentration of H2 at CR9.4 and hydrogen fractions of 0%, 10%, 20%, and 30%.
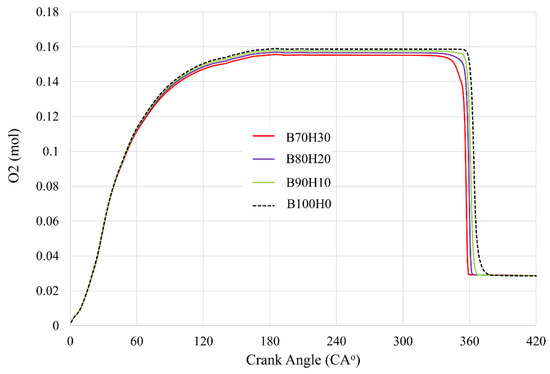
Figure 8.
Concentration of O2 at CR9.4 and hydrogen fractions of 0%, 10%, 20%, and 30%.
3.2. Combustion Temperatures
Figure 9 shows the mean combustion temperature of in-cylinder gas with crank angles as varying compression ratios and hydrogen fraction in blends. The dashed vertical lines in Figure 9a–d are indicated for the engine top dead center (i.e., at 360 CA°).
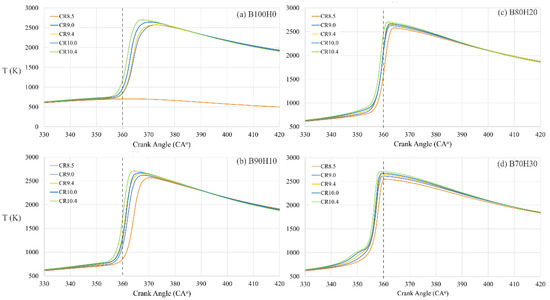
Figure 9.
In-cylinder temperature at different compression ratios and hydrogen fractions of (a) 0%, (b) 10%, (c) 20%, and (d) 30%.
As shown in Figure 9a, at CR8.5, the in-cylinder temperature decreased after the ignition timing indicating that at a low compression ratio, the biogas engine would not be able to work properly. In contrast, with an increased compression ratio, the in-cylinder temperature increases appropriately and moves toward the TDC. For instance, the peak value of combustion temperature and corresponded crank angle at a compression ratio of 10.4 are about 2700 K and 365 CA°, respectively. While at CR10.0, they are 2600 K and 368 CA°, respectively. Since the hydrogen fraction increases in blends, the combustion temperature increases, especially in the case of CR8.5 (Figure 9b–d). The peak value of combustion temperature moves closer to the TDC when the fraction of hydrogen is less than 30% (Figure 9a–c) and crosses the TDC as the hydrogen concentration is greater than 30%.
For instance, at CR10.4, the crank angle at the peak value of the combustion temperature of B100H0, B90H10, and B80H20 are about 368 CA°, 364 CA°, and 362 CA°, respectively, while it is about 359 CA° for B70H30. The higher the compression ratio, the greater the peak value of in-cylinder pressures and temperatures. These peak values of pressure and temperature occurred earlier with increasing hydrogen fraction. At 100% engine load condition, the higher combustion temperature results in a higher conversion of CO to CO2.
3.3. CO2 Emissions
The biogas used in this study can be considered as CH4-based gas in which CO2 is mixed with CH4. Therefore, before ignition time, CO2 is still available in the chamber as shown in Figure 10a–d. For instance, in Figure 10a, the CO2 in the case of pure biogas (B100H0) exhibits a value of about 4%. This value decreases slightly because the discharge coefficient decreases with an increased compression ratio. The discharge coefficient is known as the parameter used to quantify the breathing capacity of the engine intake system [26]. However, the emission of CO2 is decreased while adding hydrogen into biogas. For instance, at a fixed crank angle, CO2 emissions in the case of without adding hydrogen are significantly higher than those in the cases of adding 10%, 20%, and 30% of hydrogen. At CR10.4, the maximum value of CO2 concentration in the cases of B100H0, B90H10, B80H20, and B70H30 is about 10.5%, 9.6%, 9.4%, and 9.0%, respectively. The dashed vertical lines in Figure 10a–d are indicated for the engine top dead center (i.e., at 360 CA°).
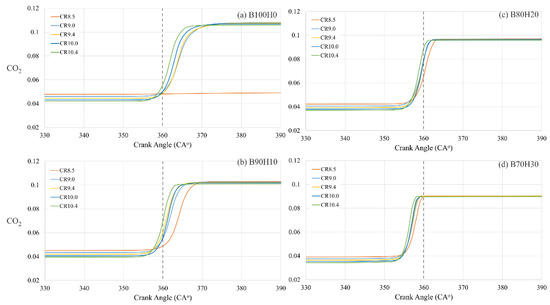
Figure 10.
CO2 emission concentrations at different compression ratios and hydrogen fractions of (a) 0%, (b) 10%, (c) 20%, and (d) 30%.
In addition, the CO2 concentration in the case of high H2 fraction could reach a maximum value sooner than those in the cases of lower additional H2 as shown in Figure 10c,d. At any specific condition of the mixture, in the expansion stroke, the CO2 concentration is exhibited almost a similar value.
In other words, the CO2 emission reduced gradually with increasing hydrogen fraction in blends and compression ratio. This can be explained as the additive hydrogen in the blends reducing the ratio of C/H. In addition, the hydrogen has a high value of a lower heating value (as shown in Table 3) resulting in the improvement of the combustion process with increasing H2 fractions.
3.4. NOx Emissions
It is well known that NOx emissions depend on the oxidation of nitrogen in the combustion process and the high temperature of combustion. The relationship between the NOx emission rate and the temperature is described in detail by the Zeldovich mechanism [29]. NOx emission is increased as the mixture is lean, and the hydrogen fraction is high. In other words, the formation of NOx emissions is mainly attributed to high combustion temperature, rich oxygen concentration, and the residence time of nitrogen.
Figure 11 shows the NOx concentration with the variation of the crank angles at different compression ratios of 8.5, 9.0, 9.4, 10.0, and 10.4. The operating engine speed was 3000 rpm and fueled with biogas enriched by 0, 10, 20, and 30% of hydrogen, as shown in Figure 11a–d, respectively. The dashed vertical lines in Figure 11a–d are indicated for the engine top dead center (i.e., at 360 CA°). As shown in Figure 11a, at CR8.5, there is no combustion inside the combustion chamber, therefore, no NOx concentration existed.
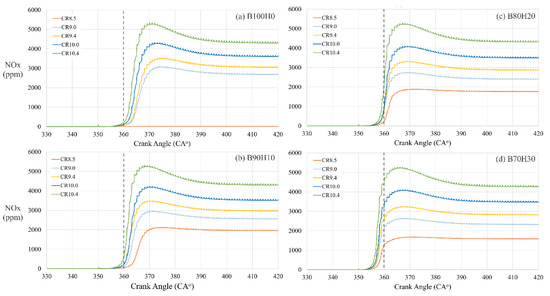
Figure 11.
NOx emissions at different compression ratios and hydrogen fractions of (a) 0%, (b) 10%, (c) 20%, and (d) 30%.
In contrast, after ignition timing, the NOx concentration decreases by reducing the compression ratios. For instance, at the operation condition of adding a 10% hydrogen concentration into biogas, the peak value of NOx concentration of CR10.4, 10.0, 9.4, 9.0, and 8.5 is about 5300, 4200, 3500, 2950, and 2100 ppm, respectively, Figure 11b. As shown in Figure 11c,d, NOx emission is slightly decreased with increasing hydrogen fraction in blends to beyond 20%. For instance, at CR9.4 (Figure 11c,d), the peak value of NOx emission is about 3500, 3300, and 3100 ppm when the hydrogen concentration in mixtures of 10, 20, and 30%, respectively. This is because when the hydrogen fraction in the combustion chamber is higher than 20%, the oxygen in the mixture is reduced consequently (as shown in Figure 8). The in-cylinder temperature is slightly decreased (as shown in Figure 9c,d); therefore, the NOx emission is slightly reduced appropriately.
At given operation conditions, the NOx concentration increases rapidly during the first phase of the combustion process and reaches a peak before decreasing and remaining stable in the expansion stroke. This phenomenon can be explained as there is a relationship between the in-cylinder pressure and NOx emissions. By increasing the hydrogen fraction in blends, the combustion speed is increased consequently. Therefore, this results in an increasing rapidly in the concentration of NOx.
The NOx concentration contours at different CRs, 370 CA°, and various biogas–hydrogen blends of B100H0, B90H10, B80H20, and B70H30 are closely presented in Figure 12, Figure 13, Figure 14 and Figure 15, respectively. As shown in Figure 10, i.e., pure biogas fueled or no hydrogen added to the blend, the peak value of NOx concentration is located around the center of the combustion chamber. The NOx concentration is about a null value in the case of CR8.5 (Figure 12a) and increases rapidly with an increased compression ratio (Figure 12b–d). However, by adding hydrogen into biogas, as shown in Figure 13, Figure 14 and Figure 15, the NOx is slightly increased as increasing %H2 in blends.
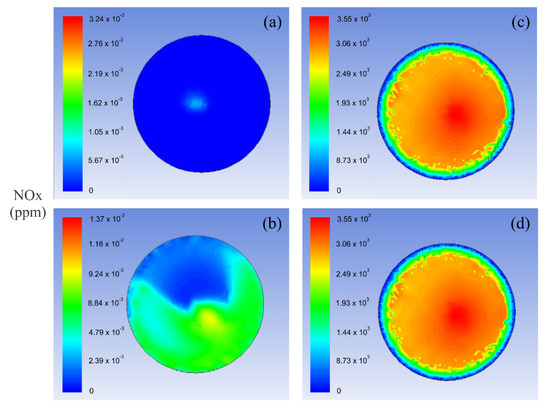
Figure 12.
NOx distributions at B100H0, 370 CA°, and different CR of (a) 8.5, (b) 9.4, (c) 10.0, and (d) 10.4.
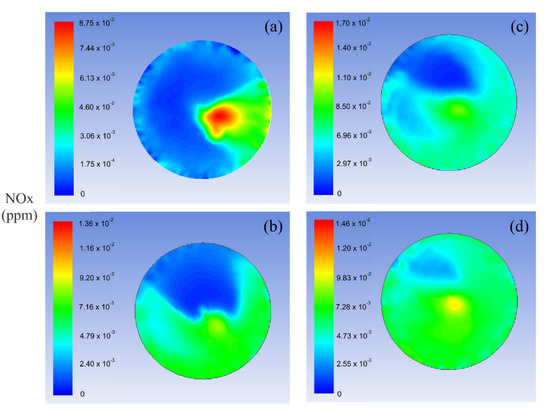
Figure 13.
NOx distributions at B90H10, 370 CA°, and different CR of (a) 8.5, (b) 9.4, (c) 10.0, and (d) 10.4.
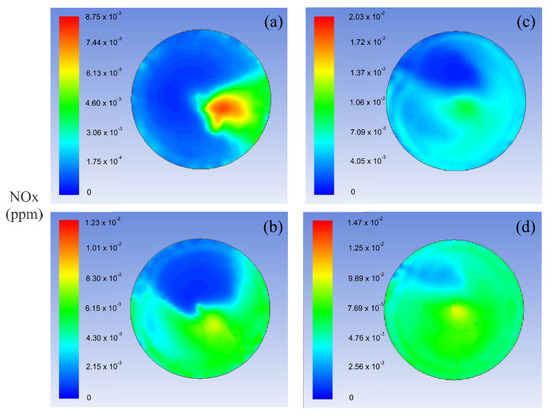
Figure 14.
NOx distributions at B80H20, 370 CA°, and different CR of (a) 8.5, (b) 9.4, (c) 10.0, and (d) 10.4.
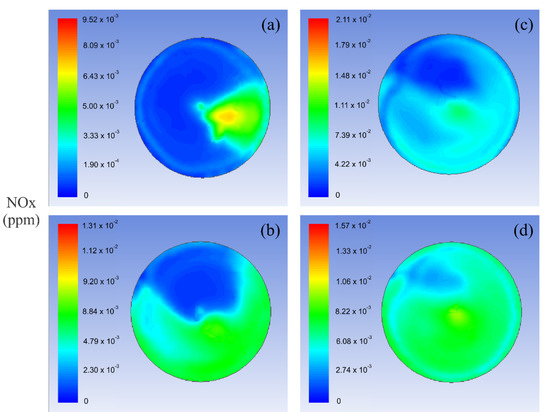
Figure 15.
NOx distributions at B70H30, 370 CA°, and different CR of (a) 8.5, (b) 9.4, (c) 10.0, and (d) 10.4.
Consequently, adding hydrogen into biogas with less than 30% of the volume fraction either promotes engine performance or produces NOx emission reduction at various compression ratios. The higher the in-cylinder temperature, the greater the NOx concentration. At a large compression ratio (e.g., CR10.0 or CR10.4), the hydrogen fraction in mixtures induces a large amount of NOx emissions appropriately.
4. Conclusions
A numerical model of a one-cylinder combustion engine was used to investigate the effects of hydrogen-enriched biogas on engine performance and emission characteristics. The results indicate that biogas enriched by hydrogen leads the in-cylinder pressure and in-cylinder temperature to increase rapidly; therefore, the combustion flame velocity is increased consequently. At given hydrogen fractions in the mixture, the higher the compression ratio, the greater the in-cylinder pressure and in-cylinder temperature. Operating the engine at a compression ratio below 8.5, the biogas engine may not be able to function correctly. However, adding a small amount of hydrogen less than 20% in volume into biogas could improve engine performance since the burning velocity improved significantly. The carbon dioxide concentration is reduced drastically with increasing hydrogen fraction. At a given hydrogen fraction in the blend, the increase in the compression ratio leads to an increase in NOx in the exhaust gas appropriately. The peak value of NOx moves toward the TDC by increasing the hydrogen fraction in the blend. Beyond 20% of the hydrogen fraction in blends, the NOx slightly decreases as increasing hydrogen concentration in the mixture.
Author Contributions
Conceptualization, M.D.L.; methodology, M.D.L. and Q.T.N.; software, Q.T.N.; validation, M.D.L.; formal analysis, Q.T.N.; investigation, Q.T.N.; resources, Q.T.N.; data curation, M.D.L.; writing—original draft preparation, M.D.L.; writing—review and editing, M.D.L.; visualization, M.D.L. and Q.T.N.; supervision, M.D.L.; project administration, Q.T.N.; funding acquisition, Q.T.N. All authors have read and agreed to the published version of the manuscript.
Funding
This work was supported by The University of Danang-University of Science and Technology under project number T2020-02-31.
Institutional Review Board Statement
Not applicable.
Informed Consent Statement
Not applicable.
Data Availability Statement
Not applicable.
Acknowledgments
A special thanks go to The University of Danang-University of Science and Technology for their support.
Conflicts of Interest
The authors declare no conflict of interest. The funders had no role in the design of the study; in the collection, analyses, or interpretation of data; in the writing of the manuscript, or in the decision to publish the results.
Nomenclature
| AFR | Air–fuel ratio |
| CA | Crank angle, degree |
| CH4 | Methane |
| CNG | Compressed natural gas |
| CRs | Compression ratios |
| CR | Compression ratio |
| CO2 | Carbon dioxide |
| DI | Direct injection |
| LHV | Lower heating value, MJ/kg |
| HC | Hydrocarbon |
| HCNG | Hydrogen compressed natural gas |
| H2 | Hydrogen |
| ICE | Internal combustion engine |
| NOx | Nitrogen oxides, ppm |
| O2 | Oxigen |
| PFI | Port fuel injection |
| p | Pressure, bar |
| SI | Spark ignition |
| T | Temperature, K |
| TDC | Top dead center |
| n | Engine speed, rpm |
| ρ | Fluid density, kg/m3 |
| t | Time, s |
References
- Szwaja, S. Dilution of fresh charge for reducing combustion knock in the internal combustion engine fueled with hydrogen rich gases. Int. J. Hydrog. Energy 2019, 44, 19017–19025. [Google Scholar] [CrossRef]
- Montoya, J.P.G.; Arrieta, A.A.A. Effect of the turbulence intensity on knocking tendency in a SI engine with high compression ratio using biogas and blends with natural gas, propane and hydrogen. Int. J. Hydrog. Energy 2019, 44, 18532–18544. [Google Scholar] [CrossRef]
- Chandra, R.; Vijay, V.; Subbarao, P.; Khura, T. Performance evaluation of a constant speed IC engine on CNG, methane enriched biogas and biogas. Appl. Energy 2011, 88, 3969–3977. [Google Scholar] [CrossRef]
- Park, J.; Choi, J. A numerical investigation of lean operation characteristics of spark ignition gas engine fueled with biogas and added hydrogen under various boost pressures. Appl. Therm. Eng. 2017, 117, 225–234. [Google Scholar] [CrossRef]
- Porpatham, E.; Ramesh, A.; Nagalingam, B. Investigation on the effect of concentration of methane in biogas when used as a fuel for a spark ignition engine. Fuel 2008, 87, 1651–1659. [Google Scholar] [CrossRef]
- Jung, S.Y.; Park, J. Numerical prediction of effects of CO2 or H2 content on combustion characteristics and generation efficiency of biogas-fueled engine generator. Int. J. Hydrog. Energy 2017, 42, 16991–16999. [Google Scholar] [CrossRef]
- Park, C.; Park, W.; Kim, Y.; Choi, Y.; Lim, B. Effect of valve timing and excess air ratio on torque in hydrogen-fueled internal combustion engine for UAV. Energies 2019, 12, 771. [Google Scholar] [CrossRef]
- Verhelst, S.; Wallner, T. Hydrogen-fueled internal combustion engines. Prog. Energy Combust. Sci. 2009, 35, 490–527. [Google Scholar] [CrossRef]
- Gibreel, M.; Zhang, X.; Elmouazen, H. Numerical study on enhanced heat transfer and flow characteristics of supercritical hydrogen rocket engine’s chamber wall using cylindrical ribs structure. Int. J. Hydrog. Energy 2022, 47, 17423–17441. [Google Scholar] [CrossRef]
- Ye, Y.; Gao, W.; Li, Y.; Zhang, P.; Cao, X. Numerical study of the effect of injection timing on the knock combustion in a direct-injection hydrogen engine. Int. J. Hydrog. Energy 2020, 45, 27904–27919. [Google Scholar] [CrossRef]
- Robert, A.; Richard, S.; Colin, O.; Poinsot, T. LES study of deflagration to detonation mechanisms in a downsized spark ignition engine. Combust. Flame 2015, 162, 2788–2807. [Google Scholar] [CrossRef]
- Yu, H.; Qi, C.; Chen, Z. Effects of flame propagation speed and chamber size on end-gas autoignition. Proc. Combust. Inst. 2017, 36, 3533–3541. [Google Scholar] [CrossRef]
- Rakopoulos, C.; Michos, C.; Giakoumis, E. Studying the effects of hydrogen addition on the second-law balance of a biogas-fuelled spark ignition engine by use of a quasi-dimensional multi-zone combustion model. Proc. Inst. Mech. Eng. Part D J. Eng. 2008, 222, 2249–2268. [Google Scholar] [CrossRef]
- Rakopoulos, C.; Michos, C. Generation of combustion irreversibilities in a spark ignition engine under biogas–hydrogen mixtures fueling. Int. J. Hydrog. Energy 2009, 34, 4422–4437. [Google Scholar] [CrossRef]
- Wei, Z.; Zhen, H.; Fu, J.; Leung, C.; Cheung, C.; Huang, Z. Experimental and numerical study on the laminar burning velocity of hydrogen enriched biogas mixture. Int. J. Hydrog. Energy 2019, 44, 22240–22249. [Google Scholar] [CrossRef]
- Benaissa, S.; Adouane, B.; Ali, S.; Mohammad, A. Effect of hydrogen addition on the combustion characteristics of premixed biogas/hydrogen-air mixtures. Int. J. Hydrog. Energy 2021, 46, 18661–18677. [Google Scholar] [CrossRef]
- Wei, Z.; Zhen, H.; Leung, C.W.; Cheung, C.S.; Huang, Z. Experimental and numerical study on the emission characteristics of laminar premixed biogas-hydrogen impinging flame. Fuel 2017, 195, 1–11. [Google Scholar] [CrossRef]
- Law, C.K.; Kwon, O. Effects of hydrocarbon substitution on atmospheric hydrogen–air flame propagation. Int. J. Hydrog. Energy 2004, 29, 867–879. [Google Scholar] [CrossRef]
- Ilbas, M.; Crayford, A.; Yılmaz, I.; Bowen, P.; Syred, N. Laminar-burning velocities of hydrogen–air and hydrogen–methane–air mixtures: An experimental study. Int. J. Hydrog. Energy 2006, 31, 1768–1779. [Google Scholar] [CrossRef]
- Di Iorio, S.; Sementa, P.; Vaglieco, B.M. Analysis of combustion of methane and hydrogen–methane blends in small DI SI (direct injection spark ignition) engine using advanced diagnostics. Energy 2016, 108, 99–107. [Google Scholar] [CrossRef]
- Fu, J.; Shu, J.; Zhou, F.; Zhong, L.; Liu, J.; Deng, B. Quantitative analysis on the effects of compression ratio and operating parameters on the thermodynamic performance of spark ignition liquefied methane gas engine at lean burn mode. Fuel 2020, 263, 116692. [Google Scholar] [CrossRef]
- Oh, S.; Kim, C.; Lee, Y.; Yoon, S.; Lee, J.; Kim, J. Experimental investigation of the hydrogen-rich offgas spark ignition engine under the various compression ratios. Energy Convers. Manag. 2019, 201, 112136. [Google Scholar] [CrossRef]
- Duan, X.; Li, Y.; Liu, J.; Guo, G.; Fu, J.; Zhang, Q.; Zhang, S.; Liu, W. Experimental study the effects of various compression ratios and spark timing on performance and emission of a lean-burn heavy-duty spark ignition engine fueled with methane gas and hydrogen blends. Energy 2019, 169, 558–571. [Google Scholar] [CrossRef]
- Sharma, P.; Dhar, A. Compression ratio influence on combustion and emissions characteristic of hydrogen diesel dual fuel CI engine: Numerical Study. Fuel 2018, 222, 852–858. [Google Scholar] [CrossRef]
- Zareei, J.; Haseeb, M.; Ghadamkheir, K.; Farkhondeh, S.; Yazdani, A.; Ershov, K. The effect of hydrogen addition to compressed natural gas on performance and emissions of a DI diesel engine by a numerical study. Int. J. Hydrog. Energy 2020, 45, 34241–34253. [Google Scholar] [CrossRef]
- Yu, H.; Liang, X.; Wang, Y.; Zhang, H. Numerical investigation on combustion and emission of a diesel engine using two-stage injection strategy. Energy Procedia 2017, 105, 1344–1349. [Google Scholar] [CrossRef]
- Van Ga, B.; Van Nam, T.; Tu, B.T.M.; Trung, N.Q. Numerical simulation studies on performance, soot and NOx emissions of dual-fuel engine fuelled with hydrogen enriched biogas mixtures. IET Renew. Power Gener. 2018, 12, 1111–1118. [Google Scholar] [CrossRef]
- Zhen, X.; Li, X.; Wang, Y.; Liu, D.; Tian, Z. Comparative study on combustion and emission characteristics of methanol/hydrogen, ethanol/hydrogen and methane/hydrogen blends in high compression ratio SI engine. Fuel 2020, 267, 117193. [Google Scholar] [CrossRef]
- Jones, W.; Lindstedt, R. Global reaction schemes for hydrocarbon combustion. Combust. Flame 1988, 73, 233–249. [Google Scholar] [CrossRef]
- Heywood, J.B. Internal Combustion Engine Fundamentals; McGraw-Hill Education: New York, NY, USA, 1988. [Google Scholar]
- Ennetta, R.; Alaya, M.; Said, R. Numerical study of laminar flame velocity of hydrogen-enriched methane flames using several detailed reaction mechanisms. Arab. J. Sci. Eng. 2017, 42, 1707–1713. [Google Scholar] [CrossRef]
- Medina, A.; Curto-Risso, P.L.; Hernández, A.C.; Guzmán-Vargas, L.; Angulo-Brown, F.; Sen, A.K. Quasi-Dimensional Simulation of Spark Ignition Engines. Thermodynamic Optimization to Cyclic Variability; Springer: London, UK, 2014. [Google Scholar]
- Ferguson, C.R.; Kirkpatrick, A.T. Internal Combustion Engines: Applied Thermosciences; John Wiley & Sons: Hoboken, NJ, USA, 2015. [Google Scholar]
- Talibi, M.; Hellier, P.; Morgan, R.; Lenartowicz, C.; Ladommatos, N. Hydrogen-diesel fuel co-combustion strategies in light duty and heavy duty CI engines. Int. J. Hydrog. Energy 2018, 43, 9046–9058. [Google Scholar] [CrossRef]
- Roache, P.J. Quantification of uncertainty in computational fluid dynamics. Annu. Rev. Fluid Mech. 1997, 29, 123–160. [Google Scholar] [CrossRef]
- Porpatham, E.; Ramesh, A.; Nagalingam, B. Effect of hydrogen addition on the performance of a biogas fuelled spark ignition engine. Int. J. Hydrog. Energy 2007, 32, 2057–2065. [Google Scholar] [CrossRef]
- Gómez-Montoya, J.-P.; Cacua-Madero, K.-P.; Iral-Galeano, L.; Amell-Arrieta, A.-A. Effect of biogas enriched with hydrogen on the operation and performance ofadiesel-biogas dual engine. CT&F-Cienc. Tecnol. Futuro 2013, 5, 61–71. [Google Scholar]
- Kumar, M.; Tsujimura, T.; Suzuki, Y. NOx model development and validation with diesel and hydrogen/diesel dual-fuel system on diesel engine. Energy 2018, 145, 496–506. [Google Scholar] [CrossRef]
- Iafrate, N.; Matrat, M.; Zaccardi, J.M. Numerical investigations on hydrogen-enhanced combustion in ultra-lean gasoline spark-ignition engines. Int. J. Engine Res. 2021, 22, 375–389. [Google Scholar] [CrossRef]
Publisher’s Note: MDPI stays neutral with regard to jurisdictional claims in published maps and institutional affiliations. |
© 2022 by the authors. Licensee MDPI, Basel, Switzerland. This article is an open access article distributed under the terms and conditions of the Creative Commons Attribution (CC BY) license (https://creativecommons.org/licenses/by/4.0/).