Article

Life Cycle Assessment of Dispersed Phase Change Material Heat Accumulators for Cooperation with Buildings in the District Heating System

Faculty of Infrastructure and Environment, Czestochowa University of Technology, 73 J.H. Dąbrowskiego St., 42-200 Czestochowa, Poland
*
Author to whom correspondence should be addressed.
Energies 2022, 15(16), 5771; https://doi.org/10.3390/en15165771
Submission received: 27 June 2022 / Revised: 21 July 2022 / Accepted: 5 August 2022 / Published: 9 August 2022
(This article belongs to the Special Issue Phase Change Materials: The Ideal Solution for Thermal Management)

Abstract

:
The wide use of energy-efficient district heating systems allows for decreased atmospheric pollution resulting from lower emissions. One of the ways to increase the efficiency of existing district heating systems, and a key element of new systems using renewable energy sources, is modern heat storage technology—the utilization of dispersed PCM heat accumulators. However, the use of different solutions and the inconsistency of selection methods make it difficult to compare the obtained results. Therefore, in this paper, using TRNSYS software, a standardization of the selection of dispersed PCM heat accumulators for cooperation with buildings in the DHS was proposed along with a Life Cycle Assessment. Life Cycle Assessment could be a good, versatile indicator for new developments in district heating systems. A new contribution to the research topic was the Life Cycle Assessment itself as well as the range of heat output of the substations up to 2000 kW and the development of nomograms and unitary values for the selection of individual parameters based on the relative amount of heat uncollected by buildings. The technical potential of heat storage value, %ΔQi,st, was from 49.4% to 59.6% of the theoretical potential of heat storage. The increases in the active volume of the PCM heat accumulator, dVPCM, and the mass of the required amount of PCM, dmst, were, respectively, 0.8 × 10⁻²–4.0 m3/kW and 1.3–6.7 × 10⁻² kg/kW. Due to dispersed heat storage, an increase in system efficiency of 41% was achieved. LCA analysis showed that a positive impact on the environment was achieved, expressed as negative values of the Eco-indicator from −0.504 × 10⁻² to −6.44 × 10⁻² kPt/kW.

1. State of Art

1.1. Introduction

Currently, the development of district heating systems (DHS) is subject to the challenges of adjusting their functionality to the idea of cities of the future [1]. These ideas are called ‘smart city’, ‘energy intelligent’, ‘smart grid’ or, to use the nomenclature from the Directive (EU) 2018/2002 of the European Parliament and of the Council, simply an energy-efficient district heating or cooling system [2,3].
In addition, the development of DHS is particularly interesting due to the rational management of primary energy resources as well, reducing air pollution from the so-called ‘low emission’ sources [4] and the possibility of using waste heat and renewable energy sources [5]. Thus, the way DHS are perceived and designed is changing.
New possibilities are associated with new problems, such as disturbances of thermal-flow states caused by the intake of heat from unstable sources and the dynamically changing needs of end users [6]. An important problem for the efficiency of DHS is a significant source-end-users divergence in heat demand [7,8,9,10]. This causes an increased return water temperature [11,12]. Therefore, there is a necessity for research and an urgent need to modernize the existing DHS in order to further develop and improve energy efficiency [13,14]. The solution that can solve these problems is modern heat storage technology—the utilization of dispersed PCM heat accumulators [15,16]. Currently, typical engineering solutions used to improve DHS efficiency within heating networks are lowering the temperature of the network water, using the technology of pre-insulated pipelines, and the replacement of group heating substations with individual ones equipped with regulation and automation. However, these typical solutions are already insufficient because they are limited only to reducing heat losses during transmission. Today’s trends in reducing heat losses and improving DHS efficiency are aimed at implementing new technologies [17]. The typical DHS improvements above do not include heat storage and cold generation [18]. However, studies [19] suggest that heat storage is an interesting solution for improving DHS energy efficiency. In addition, new DHS configurations [20] are being defined where heat storage is indispensable.

1.2. Methods of Selection of PCM Heat Accumulators

Most of the current methods of selecting heat accumulators for operation in DHS refer only to water and central heat storage [21,22]. The use of different solutions and the lack of consistency in selection methods make it difficult to compare the results. There is also no standardization of the reference conditions and the comparative scale. The unquestionable advantage of PCM heat accumulators, in some respects, compared to water heat accumulators, is the lack of problems related to their dimensions and limitation of the supply water mass flows due to the maintenance of the thermocline, as well as any problems related to contact with the outside air [23,24]. Dispersed heat storage using the latent heat of PCMs is a very interesting solution in terms of increasing the efficiency of DHS, not excluding the use of central heat storage [25,26,27].
Currently, in the literature, there is only a method for selecting PCMs based on the scoring of selection criteria, presented with the author’s participation in [28] on the use of PCM in a heat accumulator connected to a DHS, and the methodology used in [29] in almost the same way for two residential buildings with heat accumulators. This methodology consisted of meeting the requirements for the analyzed material with regard to a set of criteria relating to technical, physical, chemical, and economic aspects.
The only information on the selection of the PCM heat accumulator for a DHS in a dispersed system concerns the application of such a solution to a selected case of a heating substation, also based on the work with the author’s participation [28].

1.3. LCA of Heat Storage

The growing interest in heat storage using PCM entails the need for Life Cycle Assessment analysis (LCA). So far, a few works in this field [30] concern the use of a PCM inside the collector’s vacuum tubes. The reduction in harmful effects on the environment by introducing a PCM was in the range of 63 to 101 Pt. Moreover, the authors suggest that the environmental aspects of PCMs have been neglected and are rarely included in the research or are based on a small number of impact categories. Most of the work focuses only on the comparison of organic and inorganic PCMs with water [31] or storage systems with or without PCMs in terms of energy efficiency and the energy payback time (EPBT) [32].
In the article [33] on EPBT of Building Integrated Solar Thermal (BIST) using PCM in the form of myristic acid, only the global warming potential and the amount of energy saved were assessed in the LCA studies. The analysis was carried out for a 25-year service life and a scenario with and without recycling. The non-recycling scenario showed a slight advantage of the system without PCM, expressed as a global warming potential of 0.06 kg CO2/kWh and EPBT from 0.67 MJ/kWh. These values for the PCM scenario were 0.08 kg CO2/kWh and 0.74 MJ/kWh, respectively. In both scenarios, a similar and satisfactory EPBT was achieved in around 1.3 years. Taking into account the annual thermal energy production and annual electricity consumption for pumping and auxiliary heating, the EPBT indicates the advantage of the system with PCMs. In the recycling scenario, the environmental profile improved significantly in favor of the PCM system.
The results concerning the use of PCMs in the structure of buildings [34] indicate that the obtained energy savings are not sufficient to cover the environmental costs of PCM production and disposal in the normal lifetime of the building. Using the Eco-indicator 99 (EI99) method, PCM RT-27 paraffin and SP-25 salt hydrate were compared. In order to have a positive environmental impact of around 10%, the building should have a service life of approx. 100 years. In addition, SP-25 salt hydrate is more environmentally friendly at the production stage because its extraction is not based on fossil fuels.
Additionally, using the EI99 method in [35], the possibility of reducing the negative environmental impact of the production process of various types of heat storage for a solar power plant was analyzed. The storage of sensible heat in solids (high-temperature concrete), liquid (molten salts), and latent heat storage in a PCM (eutectic salt) were analyzed. It was indicated that the greatest environmental load was found by the heat-storing material itself; in the case of molten salt and PCM, this accounted for 90% of the negative effect on the environment, and in the case of concrete, this share was 23%. Therefore, it is important that the obtained positive effects from the operation period of heat storage at least exceed the negative impact on the environment of the production period.
In the work [36], the following PCMs were compared as a model for construction applications in terms of the impact category—global warming potential, environmental index, and primary energy demand: paraffin, salt hydrates, silica, zeolites, organometallic structures, and water. The assessment was carried out for 20-year service life. The assessment shows that in the case of solutions with a small useful temperature difference of 6–10 K (e.g., cooling), PCMs may be beneficial to the environment compared to water storage, with a difference in global warming potential of 0.54 kg CO2/kWh. The same benefit for water is only obtained for a temperature difference exceeding 15 K (e.g., high-temperature heating).
The main problem with the current LCA of heat storage analyses is that they are based on a small number of environmental impact categories. The above-mentioned studies did not take into account the effects of PCM use on human health and the quality of the ecosystem in the LCA analysis. Therefore, there is a need for an LCA that takes into account all the environmental impacts of using PCM for heat storage.
Therefore, it is proposed to standardize the selection methods of PCM heat accumulators for cooperation with DHS. In that case, the obtained results will be comparable to the reference conditions and with each other in different technologies as well. This could be achieved through the use of selection nomograms, indicating an improvement in the efficiency of the heating network, and Life Cycle Assessment as a versatile indicator for new developments in DHS.

2. Methodology

The analysis of the possibility of using a PCM heat accumulator in a DHS in a dispersed system was carried out using the TRNSYS software. The assumptions in TRNSYS were the same as those presented in the methodology in Section 2.1, Section 2.2, Section 2.3, Section 2.4 and Section 2.5. The analysis assumed a comparison of two operating states: v1—without heat storage and v2—with heat storage in a dispersed system, in which, heating substations were equipped with PCM heat accumulators. The calculation method adopted in this way allowed for the creation of the selection nomograms and the PCM heat accumulator selection method. The next step was to identify opportunities to improve the DHS efficiency. Finally, an LCA analysis was performed. The logical diagram of the conducted analysis with the numbering of the applied equations, used in the TRNSYS software and boundaries of LCA, are shown in Figure 1. A climate base can be one of the parameters that have a great impact on the results. A particularly important element in the climate base is the temperature of the external air, te, as a factor in deciding the heat demand of the building. Supplying water temperatures, t1i,proj, and return water temperatures, t2i,proj, are the results from taking into account the maintenance of the desired internal temperature, tint,proj, according to Equations (1)–(3). The scope of the analysis concerned the standard heat output of heating substations up to 2 MW. The simulation time for the analysis was adopted for the duration of the heating season. The criterion for determining the duration of the heating season was set as outside air temperatures lower than the limit heating temperature, te ≤ +te,proj. Incompatible heat collection by the building has been characterized by the return water temperature, t2i, in the case when t2i,proj < t2i. The impact of heat uncollected by the building on the temperature of the supply water was expressed as a load factor φ. The amount of heat transmitted by the heating medium was expressed as a characteristic exponent m, reaching standard values for heating substations of 0.25. For the effective functioning of DHS, it is desirable to ensure the most effective heat reception by buildings.
t 1 i , p r o j = t i n t , p r o j + 1 2 ( t 1 i , p r o j ( t e , p r o j ° C ) t 2 i , p r o j ( t e , p r o j ° C ) ) · φ + ( t 1 i , p r o j ( t e , p r o j ° C ) + t 2 i , p r o j ( t e , p r o j ° C ) 2 t i n t , p r o j ) · φ 1 1 + m ,  
t 2 i , p r o j = t 1 i , p r o j ( t 1 i , p r o j ( t e , p r o j ° C ) t 2 i , p r o j ( t e , p r o j ° C ) ) · φ , ° C
φ = t i n t , p r o j t e t i n t , p r o j t e , p r o j ,  
The LCA analysis was carried out in the range from the acquisition of mineral resources to the exploitation of the finished product, assuming:
  • the electricity consumed in the production phase of individual materials included in the heat storage was entirely produced in the country of the producer of these products;
  • the heat exchanger was made of primary metallurgical copper;
  • metallurgical copper was produced from ores; poor copper sulfides enriched by flotation give the so-called concentrates which are roasted and smelted; the obtained intermediate is directed to the converter processes and electrolytic refining; the last stage of copper production is smelting, casting, and shaping;
  • the PCM heat accumulator thermal insulation was made of mineral wool which was produced from raw materials of mineral origin (basalt, gabbro, dolomite, and bauxite) in the shaft furnace melting, fiberizing, and polymerization processes;
  • the tank housing was made of stainless steel;
  • the average route of railway transport of metallurgical copper and steel to the plant, where the tank elements are formed, was 300 km; rail transport consumed approx. 1.58 × 10⁻³ MJ/kg/km of electricity;
  • the finished semi-finished products were transported by road to a warehouse manufacturer from a distance of 30 to 1500 km; the energy consumption in fuel by the car was about 3.14 × 10⁻⁴ MJ/kg/km.

2.1. Methodology of Determination of Input Data of the Heating Substation

A universal set of input data for the selection of a dispersed PCM heat accumulator for cooperation with a DHS and the expected results were presented in Figure 2. The expected results include the instantaneous values of the supply water temperature t1i and return water temperature t2i. In addition, the results include a heat load uncollected by the building. This heat load is the result of the difference in return temperatures, ΔT2i, return water under real conditions, t2i, and return water under reference conditions—in accordance with the regulation table (i.e., in design conditions), t2i,proj. Such a data set makes it possible to determine the total efficiency, ηtot, as well as the divergence of the real and design efficiency, Δηtot. Design efficiency is understood as the best achievable for the analyzed solution.

2.2. Methodology of Determination of Theoretical Potential of Heat Storage

The theoretical potential of heat storage, ΔQi, has been calculated according to Equation (4) as the difference between the heat load supplied to the installation, Q ˙ i , p r o j , (Equation (5)) and the heat load used by the building, Q ˙ i , (Equation (6)). If the theoretical potential of heat storage is not used, it is treated as a loss. The range of the theoretical potential of heat storage was analyzed up to the value of ΔQi, with a maximum of 50%. The obtained results were dependent on the value of mass flow on the side of low operating parameters of the heating network, m ˙ i , the specific heat of the heating medium, cp, the design temperature difference between the temperature of the supply water and the temperature of the return water in the installation, ΔTproj, or actual supply and return temperature difference, ΔT. The possible stored heat was the result of the temperature difference, ΔT2i, between the higher return water temperature, t2i, and the design return water temperature, t2i,proj, according to Equation (7):
Q i = 3.6 × 10 3   ·   ( Q ˙ i , p r o j Q ˙ i ) ,   GJ h
Q ˙ i , p r o j = m ˙ i   ·   c p   ·   Δ T p r o j ,   kW ,   where   Δ T p r o j = t 1 i , p r o j t 2 i , p r o j ,   K
Q ˙ i = m ˙ i   ·   c p   ·   Δ T ,   kW ,   where   Δ T = t 1 i , p r o j t 2 i ,   K
Δ T 2 i = t 2 i t 2 i , p r o j ,   K

2.3. Methodology of PCM Selection

The selection of PCMs intended for operation in dispersed heat accumulators cooperating with DHS has been divided into several data sets. The main dataset was divided into four aspects: thermal, physical, chemical, and economic. Each aspect was divided into subsets of criteria, with points assigned to each of the criteria (C1, C2, etc., Cn). Points for the criteria were assigned according to the principle that the best match in terms of operating parameters was characterized by 3 points, the match meeting the minimum requirements was characterized by 2 points and the possible fit in terms of performance, but purely theoretically, was characterized by 1 point. Moreover, weights were assigned for each of the criteria, characterizing the importance of the criteria in the set of aspects and giving the most important criterion the highest weight (W1, W2, etc., Wn). The most important criteria that were taken into account in the individual sets were the phase change temperature and the phase change heat among the thermal aspects. In terms of physical aspects, the criteria concerning the phase change balance, material density, and volume change were preferred. In the chemical aspects, the criteria of chemical compatibility with the material from which the heat accumulator was made, the lack of toxicity, and corrosivity played a decisive role. The most economically justified criteria were the cost of the PCM and its utilization, as well as the highest possible repeatability of heat accumulation cycles and availability.
Four types of materials were subjected to PCM selection: paraffin P, non-paraffin nP, salt hydrates Sh, and metals M. The suitability and fit of the PCM were determined by the highest final result, Notetot, determined according to Equation (8) and the methodology presented in Table 1 [28].
N o t e t o t = C 1 P   ·   W 1 + C 1 n P   ·   W 1 + C 1 S h   ·   W 1 + C 1 M   ·   W 1 + etc . + C n   ·   W n ,

2.4. Methodology of Determination of Technical Potential of Heat Storage and Methodology of Selection of the PCM Heat Accumulator

The technical potential of heat storage was determined on the basis of the PCM phase change temperature, tPCM. The range of heat storage temperature also took into account the heat capacity of the solid before the phase change, cp,s, and the heat capacity of the fluid after the phase change, cp,l. The temperature ranges were, respectively, ΔTs for a solid and ΔTl for a liquid, 5 K each, which was confirmed by the literature [37,38]. On this basis, the amount of heat that can be stored for the operating parameters of the DHS was determined using the selected PCM for the temperature range ΔTPCM = 10 K, in accordance with Equation (9).
Δ Q i , s t = ( Δ Q i 3.6 × 10 3   ·   m ˙ i   ·   c p   ·   Δ T n o n , s t ) ,   GJ a
where:
ΔTnon,st = t1i,projt2j, K
where:
t2j ∉ 〈ΔTPCM
The volume of the heat store, Vst, has been defined as the active volume, which is understood as a space to store PCMs without taking into account the structural elements of the PCM heat accumulator itself, which, depending on the configuration, may affect the total volume of the store (e.g., configuration of heat exchangers). The volume of the heat store is dependent on the mass of PCM, mst, and its average density, ρav, according to Equation (10).
V s t = m s t ρ a v ,   m 3
The amount of PCM for storage of heat uncollected by the building was expressed as mass, mst, according to Equation (11). Due to the specificity of the DHS operation, the mass of PCM was related to the amount of uncollected heat in the daily cycle, ΔQi,24h,av. Moreover, the mass of the PCM was influenced by the previously described values of heat capacity before, cp,s·ΔTs, and after the phase change, cp,l · ΔTl, and the heat of the phase change itself, ΔH.
m s t = [ Δ Q i   ·   τ ] 24 h , a v c p , s · Δ T s + Δ H + c p , l · Δ T l ,   kg

2.5. Methodology of Determination of the Effects of Use Dispersed PCM Heat Accumulators in DHS

One of the most important effects achieved by the use of PCM heat accumulators was the control and regulation of the return water temperature. The excess heat of the DHS return above the design conditions is treated as a loss. The return water temperature adjustment had a direct impact on the improvement of DHS efficiency. The improvement in DHS efficiency was demonstrated by comparing the variant with heat storage, v2, to the variant without heat storage, v1. In the variant without heat storage, v1, the entirety of the uncollected heat by the building, and thus, the theoretical heat storage potential, was treated as a loss, ΔQi = ΔQi,v, GJ/a. In the variant with heat storage, there was also a heat loss which resulted from the limitations of the PCM heat accumulators, ΔQi,v2, GJ/a. The annual reduction in uncollected heat, ΔQi,red, was calculated according to Equation (12) as the difference of uncollected heat between variants v1 and v2.
Δ Q i , r e d   =   Δ Q i , v 1 Δ Q i , v 2 ,   GJ h
The heat losses in the variants v1 and v2 were calculated on the basis of Equations (13) and (14). The lower the difference between the temperatures in the individual variants, t2i and t2i,st, and the design temperature, t2i,proj, the better the adjustment effect.
Δ Q i , v 1   =   1 h a 3.6 × 10 3   ·   m ˙ i   ·   c p   ·   Δ T 2 i ,   GJ a
where: Δ T 2 i = t 2 i t 2 i , p r o j ,   K
Δ Q i , v 2   =   1 h a 3.6 × 10 3   ·   m ˙ i   ·   c p   ·   Δ T 2 i , s t ,   GJ a
where: Δ T 2 i , s t = t 2 i , s t t 2 i , p r o j ,   K
The following partial efficiencies were used to determine the DHS efficiency improvement: generation efficiency, ηg (Equation (15)), exploitation efficiency, ηex (Equation (16)), distribution efficiency, ηd (Equation (17)), accumulation efficiency, ηst (Equation (18)), and total efficiency, ηtot, which was determined on the basis of Equation (19). Partial efficiency calculations were made using the following quantities: Q1i,proj—installation heat load, Q1n,proj—heat from DHS, Q1i,proj − (L1·q1·τ·3.6 × 10⁻⁶) − ΔQiheat collected by the building, Q1i,proj − (L1·q1·τ·3.6 × 10⁻⁶)—receiver heat load, ΔQi − (L2·q2·τ·3.6 × 10⁻⁶)—return heat losses, ΔQi –uncollected heat, ΔQi,red—annual reduction in uncollected heat, and ΔQi,st—stored heat.
η g = Q 1 i , p r o j Q 1 n , p r o j ,
η e x = Q 1 i , p r o j ( L 1   ·   q 1   ·   τ   ·   3.6 × 10 6 ) Δ Q i Q 1 i , p r o j ( L 1   ·   q 1   ·   τ   ·   3.6 × 10 6 ) ,
η d = ( Q 1 i , p r o j ( L 1   ·   q 1   ·   τ   ·   3.6 × 10 6 ) Q 1 i , p r o j )   ·   ( Q 2 i , p r o j + Δ Q i ( L 2   ·   q 2   ·   τ   ·   3.6 × 10 6 ) Q 2 i , p r o j + Δ Q i ) ,
η s t = Δ Q i , r e d Δ Q i , s t ,
η t o t = η g   ·   η e x   ·   η d   ·   η s t ,
Two values were determined to verify the improvement of DHS efficiency: the theoretical possibility of improving DHS efficiency, Δηtot, and the actual improvement of DHS efficiency by the use of dispersed PCM heat accumulators, Δηtot,st. In the first case (Equation (20)), the reference efficiency, ηtot, was related to the best theoretical efficiency, ηtot,proj; in the second case (Equation (21)), the reference efficiency, ηtot, was related to the efficiency using PCM heat accumulators, ηtot,st.
Δ η t o t = η t o t , p r o j η t o t ,
Δ η t o t , s t = η t o t , s t η t o t ,

2.6. LCA Methodology

The LCA methodology was used to determine the environmental effects of the dispersed PCM heat accumulators. The life cycle included the extraction of natural resources, their processing, production, operation, recycling, and waste disposal processes. The analysis was performed in accordance with ISO 14040 and ISO 14044 [39,40] and therefore consisted of four phases: goal and scope definition, Life Cycle Inventory (LCI), Life Cycle Impact Assessment (LCIA), and Life Cycle Interpretation.
Based on the literature review, it was found that the type of PCM has a significant impact on the environment. It is also important that the benefits obtained during the operation process balance the environmental load resulting from production and disposal. Therefore, the four scenarios S1–S4 were compared with each other, analyzing the best-fit PCMs, with and without taking into account the effect of the dispersed PCM heat accumulators for cooperation with buildings in the district heating system, Δηtot,st. Scenario S1 was defined as a PCM heat accumulator with paraffin, where the PCM was a refined petroleum product. Scenario S2 was PCM heat accumulator with salt hydrate and sodium trisulfate, where PCM was a product of the sodium sulfate-sulfur cooking process. Scenarios S3 and S4 were extended with positive effects resulting from the use of dispersed PCM heat accumulators in the DHS. In each scenario, the values of the Eco-indicator were indicated for the relative characteristics of the amount of heat uncollected by the building in the range of 10% to 50%. The functional unit of the analysis was defined as the technical potential of heat storage, ΔQi,st, of the district heating system during the heating season. Based on the literature review, the service life of the heat storage was established at 20 years [35]. The analysis concerned aspects related to the PCM heat accumulator as well as processes related to the production, transmission, and storage of heat. The analysis excluded elements of the heating system which were the same for both variants (i.e., construction of a heating network and its equipment). The system boundaries included heat accumulator materials, fuel production, processing and transportation, energy production and distribution, and system operation. The utilization phase of the components was omitted which is a common practice in LCA analysis. The impact of the disposal phase is negligible compared to the production and use phase. Moreover, due to a long time of system use, it is difficult to predict the recovery technology that may be used in the future. This approach is also supported by the fact that PCM heat accumulators have a much longer service life than 20 years [41] and reliable data on their disassembly are not yet well known. LCA analysis was performed per functional unit and environmental load, expressed by the value of the Eco-indicator (Pt) in the entire life cycle of the technology.
In the phase of collection analysis (LCI), an inventory was made of all system inputs and outputs, i.e., resources taken from the environment and emissions, energy, useful materials, and products released into the environment. Simapro software was used to carry out the LCA analysis, and the Eco-indicator 99 method was used to assess the impact. During the calculations, the program also used the Ecoinvent and ELCD databases concerning global and regional data in the field of material flows, fuel supplies, energy carriers, and transport [42]. The environmental load index referred to 1 kg of material. In the case of production processes, the emissions were taken into account together with the emissions resulting from the use of energy. In the case of the extraction and processing of energy raw materials, the average level of process efficiency was taken into account. Electricity used in the production phase of the analyzed systems was entirely produced in Poland. The system boundaries adopted for the analysis, in relation to transport processes, take into account its type and the impact of emissions related to the production and consumption of fuel in transport. The Ecoinvent database was also used to collect source data, i.e., in the field of equipment production, production, and transport of electricity and fuels [43]. No cutoff rules were applied to the background data as their scope only corresponds to the range established by the Ecoinvent datasets.
The PCM heat accumulator was a product composed of semi-finished products made of various materials. Internal transport and assembly on site did not significantly increase the environmental load. The values of the environmental impact category indicators constituting the energy and ecological characteristics of the PCM heat accumulator were calculated on the basis of material and energy balances. The environmental load indicators for the extraction of raw materials and the manufacture of semi-finished products were taken from the Ecoinvent and ELCD databases.
Moreover, it was assumed that the heat exchanger was made of primary metallurgical copper which was produced from ores. The thermal insulation of the tank was made of mineral wool and the tank housing was made of steel. Semi-finished products were transported by road from a distance of 30 to 1500 km, and the energy consumption in fuel by the car was approx. 3.14 × 10⁻⁴ MJ/kg/km.
In the LCIA phase, the potential impacts on the environment and human health caused by the given inputs and outputs to the system were evaluated. The methodology used in the assessment of the impact of the life cycle was the Eco-indicator 99 [43]. This methodology considers three categories of harm to human health, ecosystem quality, and natural resources. Several impact categories have been assigned to each of the damage categories. The environmental profile concerned eleven impact categories modeling the environmental impact at the level of the endpoints of the Eco-indicator (Pt). The damage categories and the corresponding impact categories [44,45] are presented in Table 2. The values in all impact categories were scaled to 100% at the characterization stage. Then, the results were normalized, where the values of the individual impact categories were divided by a common reference value and weighted, i.e., the normalized values of the impact categories were assigned weights. All impact category indicators that refer to the same endpoint are defined in such a way that the indicator’s output unit is the same. This allows adding the indicator results by group. LCA analyses were carried out per functional unit and environmental load, expressed by the value of the eco-indicator points (Pt) in the entire life cycle of the technology, enabling a comparative analysis of the adopted variants and their impact on various elements of the ecosystem and identifying the factors that burden the environment the most. As the impact magnitudes are related to the greatest impact within a given category, the standardization of the damage categories was carried out. It consisted of the ratio of the amount of damage to the statistical amount of damage caused by one inhabitant of Europe during the year. Positive values indicate a negative impact on the environment, while negative values indicate a positive impact on the environment, the so-called impacts (emissions) avoided.

3. Standardization of the Selection of Dispersed PCM Heat Accumulators for Cooperation with Buildings in the DHS

Knowing the value of the uncollected heat of any heating substation up to a heat output of 2000 kW, it is possible to easily select a dispersed PCM heat accumulator. The use of selection nomograms for intermediate values is possible through the interpolation of unitary increments.

3.1. Determination of Input Data of the Heating Substation

The design heat output of the analyzed heating substation is determined depending on the climatic zone, on the basis of the heat load of the building connected to the DHS. Other design values, which are determined on the basis of the heat output, are design supply water temperature, t1i,proj(–te,proj), design return water temperature, t2i,proj(–te,proj), and mass flow of the medium, m ˙ i .
Based on the above design values related to the assumed outside air temperature, it is advisable to use the substations’ regulatory table in accordance with the formula in Table 3. The table controls the theoretical heat demand of the building. On this basis, the values of the supply water temperatures, t1i,proj, and return water, t2i,proj, that should be achieved in the installation are obtained.
The duration of the heating season, τ, should be determined as the temperature range for the analysis of the frequency of the outside air temperature. On the basis of the design criteria, the minimum temperature of this range is the design outside air temperature –te,proj, for a given climatic zone. The maximum temperature of this range is the heating limit temperature, +te,proj, which can be assumed at the level of +12 °C for insulated buildings.
The obtained results can be presented graphically as the distribution of supply and return water temperatures under design conditions for the heating season (Figure 3). These results are treated as reference conditions for the analyzed heating substation. It is assumed that, while maintaining the return water temperatures ΔT2i = 0 in accordance with the reference conditions, there is no heat flux that is not collected by the building Δ Q ˙ i = 0 .

3.2. Determination of Theoretical Potential of Heat Storage

The theoretical potential of heat storage was defined depending on the heat output of the heating substation, Qi,proj(−te,proj), up to 2 MW, and the amount of heat not used by the building, ΔQi, within 10–50%. The results are presented in the form of a nomogram for the selection of theoretical, average hourly potential of heat storage, ΔQi,av, and the form of a nomogram for the selection of the maximum hourly potential of heat storage, ΔQi,max, and maximum potential for heat transfer to the heating network, ΔQi,min. These nomograms are presented in Figure 4 and Figure 5, respectively.
The increases in the average hourly potential of heat storage in the substation heat output range up to 2 MW were given in GJ/h per 1 kW substation heat output and amounted to: dΔQi,10% = 26 × 10−5 for the relative value of heat uncollected by the building of 10%, and, analogously, dΔQi,20% = 51 × 10−5, dΔQi,30% = 77 × 10−5, dΔQi,40% = 102 × 10−5, dΔQi,50% = 128 × 10−5.
The increases in the maximum values of the hourly potential of heat storage in the substation heat output range up to 2 MW were dΔQi,max = 298 × 10−5, and the increases in the maximum potential for heat transfer to the heating network were dΔQi,min = −223 × 10−5.
The heat storage potential varies throughout the heating season. Based on the average values, values of the monthly potential of heat storage were determined. For the relative values of heat uncollected by buildings, the monthly potential of heat storage reaches the highest values at the peak of the heating season, and the lowest values are at the beginning and end of the heating season. In the considered heat output range of heating substations up to 2 MW, the increases in monthly potentials of heat storage are presented in Table 4. The largest increases in the monthly potential of heat storage, dΔQi,av, ((GJ/m-c)/1 kW of source heat output) in November were dΔQi,av,10%–50% = 0.16–0.8, dΔQi,av,10%–50% = 0.25–1.24 in December, and dΔQi,av,10%–50% = 0.25–1.23 in January. In the remaining months, the increases in the monthly potential of heat storage, dΔQi,av, ranged from 0.06 to 0.75 (GJ/m-c)/1 kW of the source’s heat output.

3.3. PCM Selection

The appropriate PCM was selected based on the operating conditions of the installation, where the temperature distribution of the return water was the decisive factor. Figure 6 shows the temperature distribution of the return water under the reference conditions, t2i,proj, and the temperature distribution of the return water for the relative characteristics of the amount of heat uncollected by the building in the range from 10% t2i,10% to 50% t2i,50%. The temperature range between the curve at the bottom, which represents the reference conditions, and the curve at the top, which is the operating characteristic of the substation with 50% of the heat uncollected by the building, is the heat storage potential. Using the value of the average return water temperature, it can be concluded that an increase in the relative amount of heat uncollected by the building by 10% corresponds to an increase in the average return water temperature by approx. 1.4 °C. The most common return temperature for which a PCM should be selected is found to be the mean temperature. The difference from the reference conditions of the average values of return water temperatures without storage was, respectively, ΔT2iQi10%,av = 1.4 K, ΔT2iQi20%,av = 2.9 K, ΔT2iQi30%,av = 4.3 K, ΔT2iQi40%,av = 5.7 K, and ΔT2iQi50%,av = 7.2 K.
Due to the limited temperature range of PCM use, it is crucial to determine the frequency of the return water temperature. Therefore, the hourly frequency of return water temperatures of the district heating network has been determined (Figure 7). Heat storage using the heat capacity of the solid, cp,s, and of the liquid after the phase change, cp,l, should be considered in the accepted temperature ranges ΔTs and ΔTl, each equal to 5 K. Therefore, the selection of PCM, in this case, should refer to the range of return water temperature, ΔTPCM = 10 K. The middle of this range would be the phase transition temperature of the selected PCM tPCM.
By analyzing the frequency of return water temperatures in the system, it can be concluded that under reference conditions, the most common return temperatures range from 37 °C to 47 °C. Then, the frequency of return water temperatures was analyzed for relative characteristics in the range of the amount of heat uncollected by the building from 10% t2i,10% to 50% t2i,50%. For the amount of heat uncollected by the building, from 10% to 50%, respectively, the most common return water temperatures are in the range of 41 to 51 °C and constitute 65.0% of the duration of the heating season for ΔQi,10%; 40–50 °C constitute 64.4% of the duration of heating season for ΔQi,20%; 44–54 °C constitute 62.2% of the duration of heating season for ΔQi,30%; 46–56 °C constitute 60.1% of the duration of heating season for ΔQi,40%; and 47–57 °C constitute 59.8% of the duration of heating season for ΔQi,50%. It can be concluded that there is a relationship between the relative value of the heat uncollected by the building and the duration of the heating season in which the PCM heat accumulator can be used. Along with the increase in the amount of heat uncollected by the building, the period of use of the PCM heat accumulator is slightly reduced. On average, the period of use of the PCM heat accumulator can be shortened by 1.04% for each 10% increase in the amount of heat uncollected by the building.
The optimal phase change temperature of PCM was, respectively, 46 °C for 10%, 45 °C for 20%, 49 °C for 30%, 51 °C for 40%, and 52 °C for 50% of the amount of heat uncollected by the building. Therefore, it can be concluded that for relative values of heat uncollected by the building in the range of 10–50%, the PCM phase change temperature should be in the range of 45–52 °C.
The PCM was selected for the above-defined operating conditions of the PCM heat accumulator. The scoring results of PCM types are presented in Figure 8. Salt hydrates achieved the highest value of 158 points. Similarly, values equal to 148 points were obtained by paraffin. For non-paraffin and metals, lower points of 100–non-paraffin and 90–metals were obtained, which makes them inadequate to use in the DHS operating temperature range. This was mainly due to the phase change temperature, no supercooling, phase change equilibrium, storage compatibility, and lack of toxicity. Therefore, it can be concluded that for the relative characteristics, the best fit was the salt hydrate group, with the best fit of the individual PCM for sodium trisulphate Na2S2O3·5H2O. For this salt hydrate, the evaluation value Notetot was equal to 170 points. This does not mean that other PCMs are not indicated for use in this type of solution. A comparable result was achieved for the paraffin group, which was characterized by the number of carbon atoms from 22 to 25. For these kinds of paraffin, the evaluation value Notetot was equal to 162 points. It should be remembered that paraffin can be useful but the most important criterion for selecting PCM is the price. At the same time, it should be stated that the individual selection of PCM was characterized by higher point values due to the average used for the PCM group.

3.4. Determination of Technical Potential of Heat Storage and Selection of PCM Heat Accumulator

For selected PCMs from the previous stage, the return water temperature range should be from 44 °C to 54 °C for both Na2S2O3·5H2O hydrated sodium trisulfate and 25 carbon paraffin. The temperature range of the PCM selection, in accordance with the methodology, included the temperature difference ΔTPCM = 10 K, the center of which was the phase change temperature of the selected PCM tPCM = 49 °C. On the basis of Equation (9), for this temperature range, the amount of heat that could be stored using the selected PCM was determined. This amount of heat is understood as the technical potential of heat storage.
In terms of the relative amount of heat uncollected by the building from 10% to 50%, the relative technical potential of heat storage using the selected PCM is understood as a percentage share of the total potential of heat storage. It was, respectively, %ΔQi10%,st = 49.4%, %ΔQi20%,st = 55.6%, %ΔQi30%,st = 59.0%, %ΔQi40%,st = 59.6%, and %ΔQi50%,st = 57.0%.
On the basis of the technical potential of heat storage and Equation (10), the active volume of PCM heat accumulator, Vpcm, was determined; on the basis of Equation (11), the mass of PCM, mst, was determined. Both values were determined for the heat output of heating substations up to 2 MW, as shown in Figure 9. These values were related to the duration of the heating season, %τa, where it was possible to use the technical potential of heat storage, %ΔQi.
The increase in active volume per 1 kW of the design heat output of the district heating substation was: dVPCMQi10% = 0.8 × 10⁻² m3/kW, dVPCMQi20% = 1.6 × 10⁻² m3/kW, dVPCMQi30% = 2.4 × 10⁻² m3/kW, dVPCMQi40% = 3.2 × 10⁻² m3/kW, and dVPCMQi50% = 4.0 × 10⁻² m3/kW. The mass increase in PCM per 1 kW of the design heat output of the district heating substation was: dmstQi10% = 1.3 × 10⁻² kg/kW, dmstQi20% = 2.7 × 10⁻² kg/kW, dmstQi30% = 4.0 × 10⁻² kg/kW, dmstQi40% = 5.4 × 10⁻² kg/kW, and dmstQi50% = 6.7 × 10⁻² kg/kW.

3.5. Effects of Use Dispersed PCM Heat Accumulators in DHS

One of the effects of using the PCM heat accumulator is the reduction in the return heat loss, ΔQi,red. The determination of this effect was possible by comparing the standard variant of the district heating substation (v1) with the variant of the district heating substation equipped with a PCM heat accumulator (v2). It is stated that because of the application of the PCM heat accumulator, the reduction increment in the range of relative values of heat uncollected by the building for each 1 kW of substation heat output was, respectively, dΔQi10%,red = 12 × 10−5 (GJ/h)/1 kW, dΔQi20%,red = 28 × 10−5 (GJ/h)/1 kW, dΔQi30%,red = 44 × 10−5 (GJ/h)/1 kW, dΔQi40%,red = 59 × 10−5 (GJ/h)/1 kW, and dΔQi50%,red = 71 × 10−5 (GJ/h)/1 kW.
The reduction in excess heat on the return of the installation allowed similar return water temperatures, t2i,st, to the design temperatures, t2i,proj, to be obtained. The effect of return water temperature adjustment can be presented by using the average values of the return water temperature. After using the PCM heat accumulator, the average temperatures of the return water were, respectively, t2i,stQi10%,av = 42.8 °C, t2i,stQi20%,av = 43.4 °C, t2i,stQi30%,av = 43.9 °C, t2i,stQi40%,av = 44.4 °C, and t2i,stQi50%,av = 45.2 °C. The effect of the return water adjustment, which resulted from the reduction in the temperature difference between the design values, was, respectively, ΔT2i,stQi10%,av = 0.7 K, ΔT2i,stQi20%,av = 1.3 K, ΔT2i,stQi30%,av = 1.8 K, ΔT2i,stQi40%,av = 2.3 K, and ΔT2i,stQi50%,av = 3.1 K.
The efficiency improvement in the substation heat output range up to 2000 kW was: Δηtot,st,20% = 0.040–0.041 for the relative value of heat uncollected by the building of 20%, and, analogously, Δηtot,st,30% = 0.096–0.100, Δηtot,st,40% = 0.149–0.156, and Δηtot,st,50% = 0.190–0.200. For the relative value of heat uncollected by the building below 10%, a decrease in efficiency is possible due to the difference between the accumulation efficiency without storage, ηst = 1, and the accumulation efficiency with storage, ηst < 1. With a relatively small amount of heat to accumulate 10% of the total heat transfer, that difference is not compensated by the increase in exploitation efficiency, ηex.
The reduction in heat loss, regulation of return water temperature, and improvement of efficiency for the operating characteristics of district heating substations in terms of the relative values of heat uncollected by the building 10–50% are shown in Figure 10.

3.6. LCA of Dispersed PCM Heat Accumulators

Four scenarios, S1–S4, were subjected to the LCA analysis, differing in terms of heat storage material and taking into account the effect resulting from the use of dispersed PCM heat accumulators for cooperation with buildings in the DHS. In scenarios S1 and S2, the use of the most favorable PCMs from the groups of paraffin and salt hydrates was analyzed to demonstrate their environmental impact. The paraffin with 25 carbon atoms, C25, was a product of the crude oil refining process. Salt hydrate—sodium trisulphate, Na2S2O3·5H2O, was a product of the process of combining and heating an alkaline solution of sulfates (IV) with sulfur. In the S3 and S4 scenarios, it was demonstrated whether the obtained effect of dispersed PCM heat accumulators in the DHS is sufficient to eliminate the negative impact on the environment of the S1 and S2 variants.
Figure 11 shows the environmental impacts of the application of dispersed PCM heat accumulators for cooperation with buildings in the DHS. Impacts were defined depending on the heat output of the heating substation, Qi,proj(−te,proj), up to 2 MW, and the amount of heat not used by the building, ΔQi, within 10–50%. The environmental impacts are presented as endpoints of the Eco-indicator and are expressed in kiloecopoints (kPt). Positive values of the Eco-indicator mean an adverse impact on the environment, while negative values indicate a beneficial effect of the so-called avoided influences.
Comparing the impact on the environment resulting from the use of PCM in variants S1 and S2, it can be concluded that the maximum values of the Eco-indicator equal to 157.36 kPt were achieved for paraffin for the heat output of the heating substation 2 MW and the amount of heat not used by the building of 50%. The maximum values of the Eco-indicator for sodium trisulphate were also achieved for the same data and amounted to 54.52 kPt.
The increment of Eco-point value for paraffin in the range of relative values of heat uncollected by the building for each 1 kW of substation heat output was, respectively, dEco-pointpQi10% = 1.857 × 10⁻² kPt/kW, dEco-pointpQi20% = 3.147 × 10⁻² kPt/kW, dEco-pointpQi30% = 4.721 × 10⁻² kPt/kW, dEco-pointpQi40% = 6.294 × 10⁻² kPt/kW, and dEco-pointpQi50% = 7.868 × 10⁻² kPt/kW.
The increment of Eco-point value for salt hydrate in the range of relative values of heat uncollected by the building for each 1 kW of substation heat output was, respectively, dEco-pointshQi10% = 0.627 × 10⁻² kPt/kW, dEco-pointshQi20% = 1.083 × 10⁻² kPt/kW, dEco-pointshQi30% = 1.624 × 10⁻² kPt/kW, dEco-pointshQi40% = 2.165 × 10⁻² kPt/kW, and dEco-pointshQi50% = 2.706 × 10⁻² kPt/kW.
In scenarios S3 and S4, the environmental impact assessment resulting from the use of PCM takes into account the benefits of energy storage via dispersed PCM heat accumulators in the DHS for paraffin and salt hydrate, respectively. Negative values of the Eco-indicator suggest that the negative impact of PCM on the environment was reduced and significant environmental benefits resulting from the avoided impacts were achieved. The minimum values of the eco-indicator for paraffin were −50.21 kPt, however, more favorable values were achieved for salt hydrate which amounted to −128.8 kPt. These values were reached for the heat output of the heating substation 2 MW and the amount of heat not used by the building of 50%.
The decrease in the Eco-point value for paraffin with dispersed PCM heat accumulators in the range of relative values of heat uncollected by the building for each 1 kW of substation heat output was, respectively, dEco-pointp,stQi10% = −0.504 × 10⁻² kPt/kW, dEco-pointp,stQi20% = −1.007 × 10⁻² kPt/kW, dEco-pointp,stQi30% = −1.51 × 10⁻² kPt/kW, dEco-pointp,stQi40% = −2.014 × 10⁻² kPt/kW, and dEco-pointp,stQi50% = −2.385 × 10⁻² kPt/kW.
The decrease in the Eco-point value for salt hydrate with dispersed PCM heat accumulators in the range of relative values of heat uncollected by the building for each 1 kW of substation heat output was, respectively, dEco-pointsh,stQi10% = −1.55 × 10⁻² kPt/kW, dEco-pointsh,stQi20% = −2.576 × 10⁻² kPt/kW, dEco-pointsh,stQi30% = −3.864 × 10⁻² kPt/kW, dEco-pointsh,stQi40% = −5.152 × 10⁻² kPt/kW, and dEco-pointsh,stQi50% = −6.44 × 10⁻² kPt/kW.

4. Conclusions

The material presented in this work allowed for the formulation of the following conclusions:
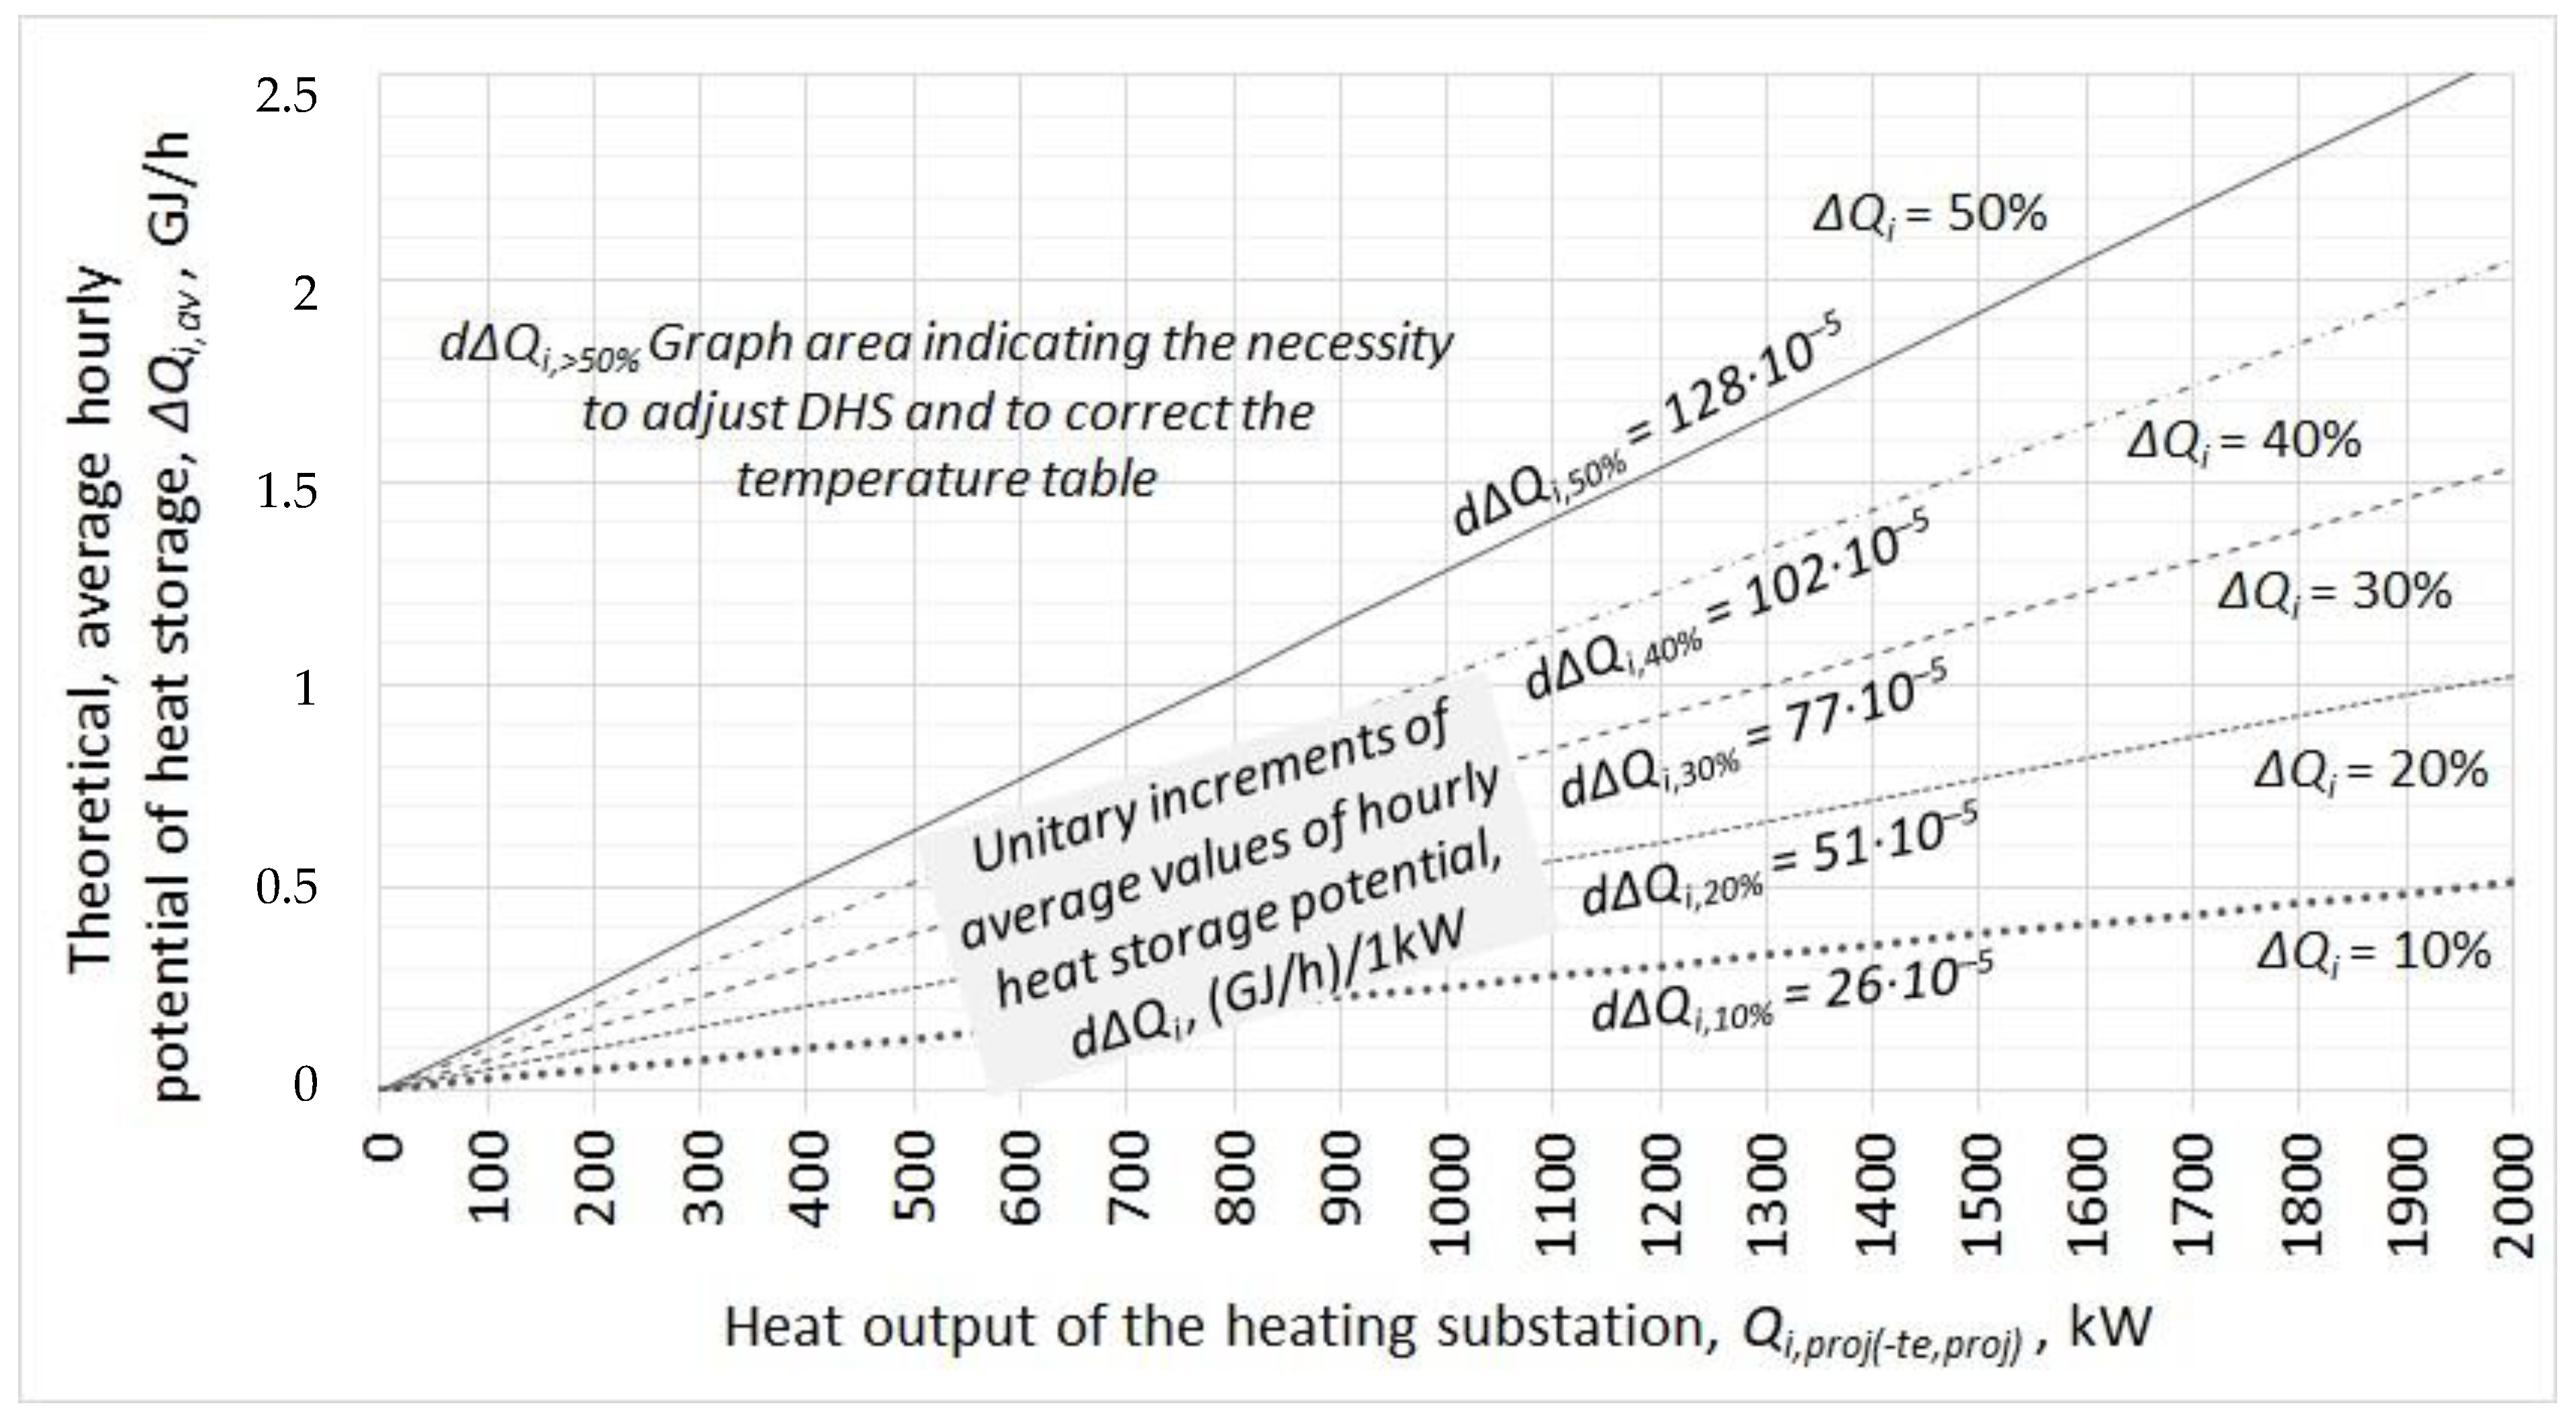
  • The most important period of the heating season from the point of view of heat storage is its peak, beginning, and end. The increases in the average, hourly potential of heat storage were in the range of dΔQi,10% = 26 × 10−5 to dΔQi,50% = 128 × 10−5 (GJ/h)/1 kW for the amount of heat not used by the building, ΔQi, within 10–50%.
    The increases in the monthly potential of heat storage, dΔQi,av, ranged from 0.06 to 1.24 (GJ/m-c)/1 kW of the source’s heat output.
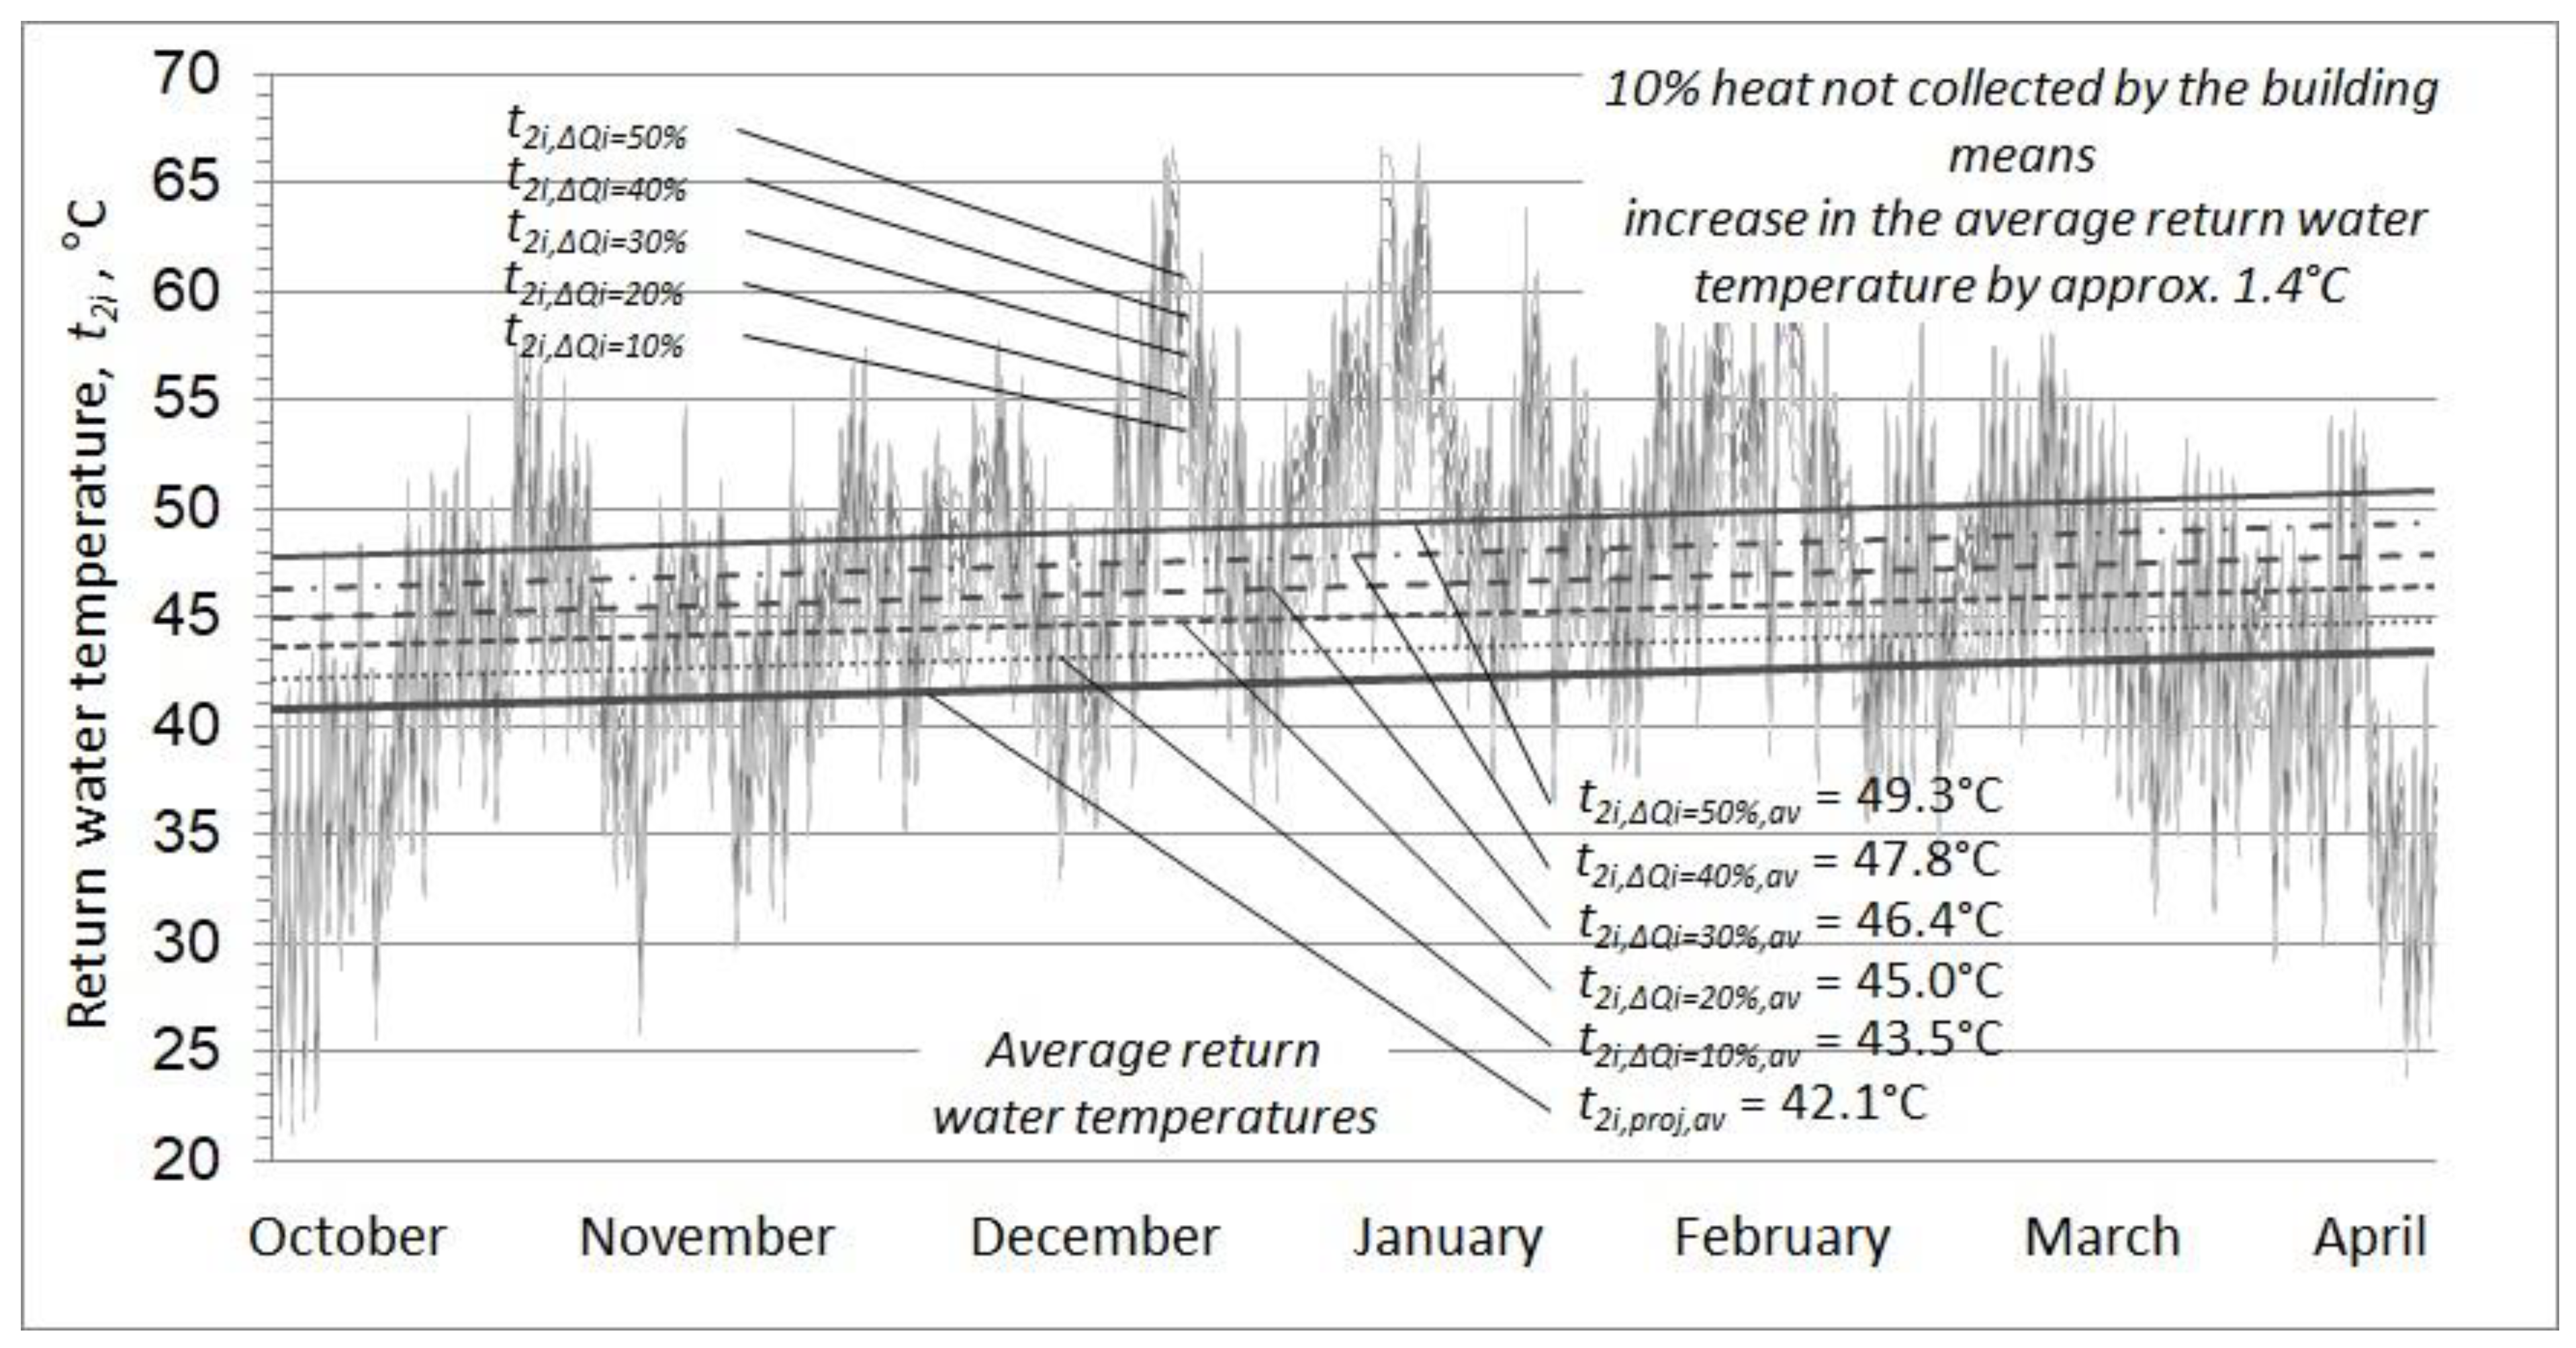
  • In the proposed standardization method, the range of the most common return water temperature values of 44 °C to 54 °C was consistent with the operating data. The temperature range accounted for 60% of the duration of the heating season. The values for relative characteristics, for the standard season, are considered safe values, which means that in the case of the actual operation they will be only more favorable (it should be above 60%).
  • For the analyzed return water temperature ranges from 44 °C to 54 °C, the best fit was PCM—salt hydrate—hydrated sodium trisulfate, Na2S2O3·5H2O, which obtained 170 points and paraffin, with the number of carbon atoms from 22 to 25, which obtained 162 points. The paraffin with a carbon number of 25 has the most preferred phase change temperature of 49.4 °C. Therefore, it can be concluded that the selection of PCM can be performed for standard season conditions.
  • For the proposed standardization method, the technical potential of heat storage value, %ΔQi,st, was from 49.4% to 59.6% of the theoretical potential of heat storage. The increases in the active volume of PCM heat accumulator, dVPCM, and the mass of the required amount of PCM, dmst, were, respectively, 0.8 × 10⁻²–4.0 m3/kW and 1.3–6.7 × 10⁻² kg/kW.
  • The use of the PCM heat accumulator allows for regulating the heat loss on the return, reducing the temperature of the water returning from the heating substation, and regulating this temperature almost to the design values. The difference of the average values of return water temperatures, ΔT2i,st,av, from the design value after the application of the PCM heat accumulator was only 2.5 K for the proposed selection method. Before the application of the PCM heat accumulator, this difference was ΔT2i,av = 7.15 K.
  • Maintaining the heating network return water temperature at a constant level and storing the excess heat contributes to the improvement of the efficiency of the entire DHS. The proposed solution allowed the efficiency of the DHS to increase by 16 percentage points. Thanks to the dispersed heat storage, compared to the variant without heat storage, an increase in system efficiency by 41% was achieved.
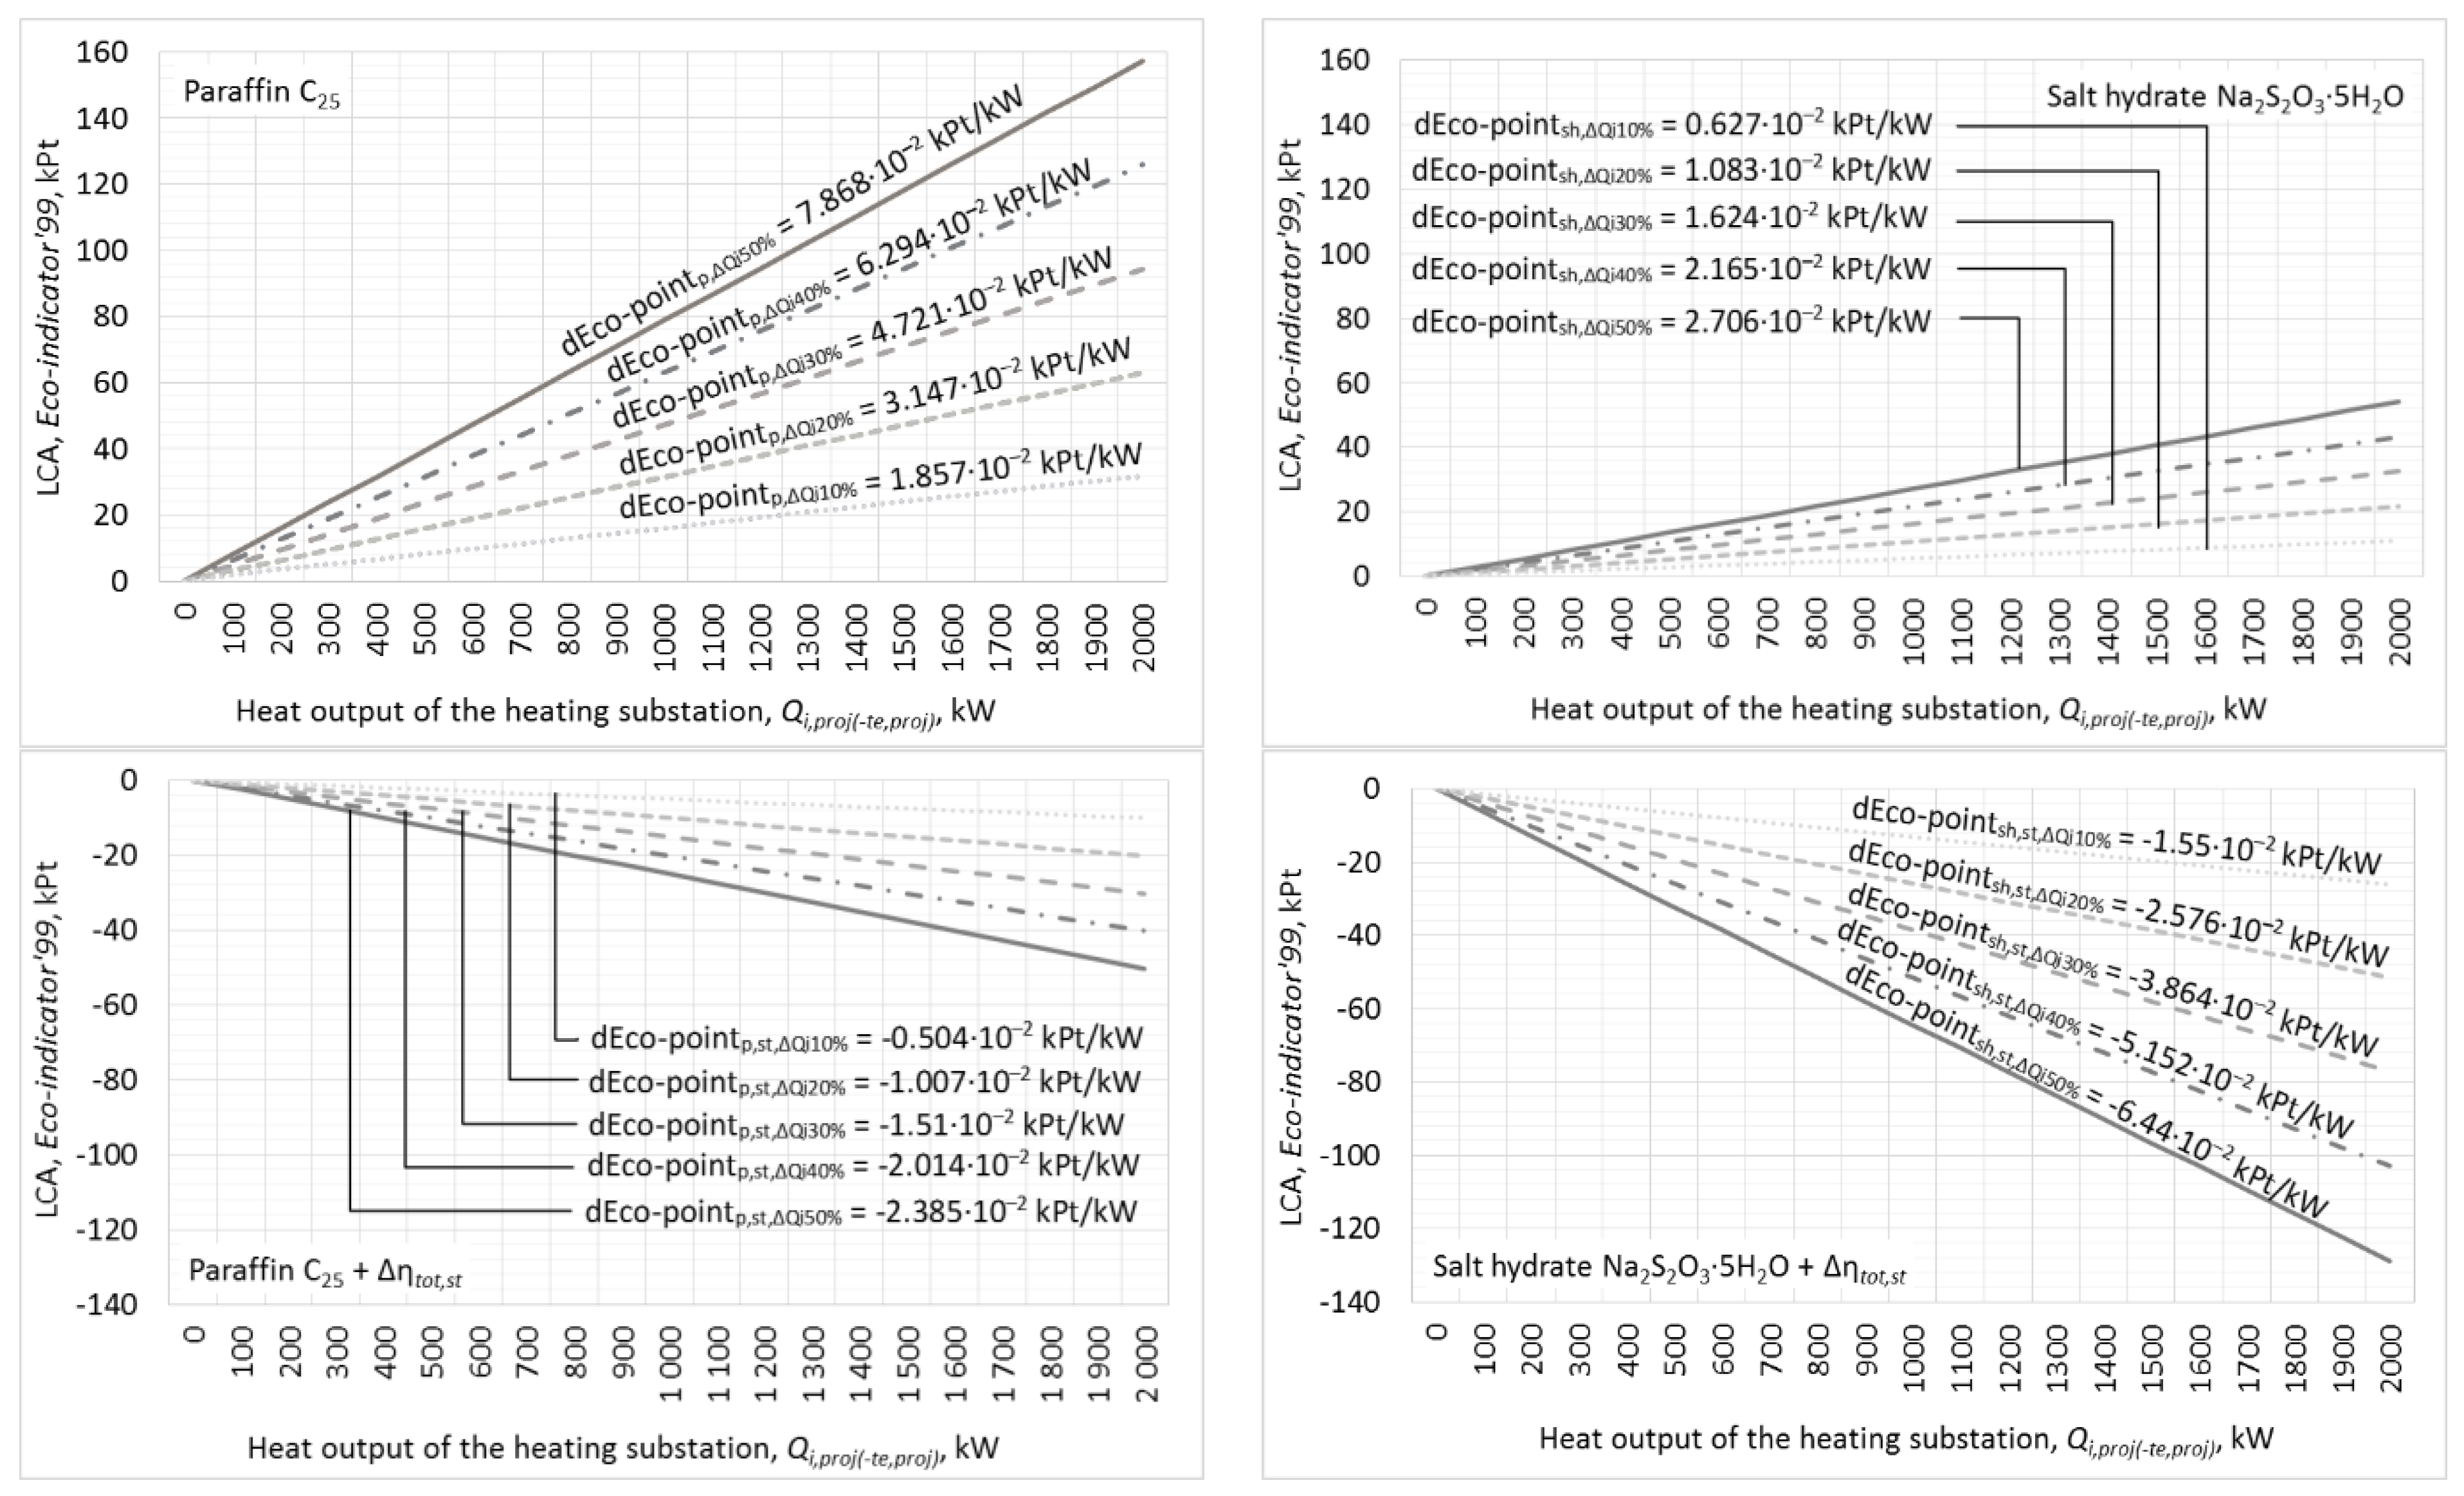
  • There is a general belief that systems with renewable or unconventional energy sources are minimally invasive to the environment. The analyses presented in this article have shown that such solutions have an impact on the environment. The conducted LCA analysis of heat storage technology with the use of PCM showed a significant impact of all stages of the life cycle of the analyzed technology on the environment. Without taking into account the improvement in DHS efficiency resulting from the operation of PCM heat accumulators, the LCA analysis indicated negative environmental effects for both PCM in the form of paraffin and salt hydrate. The Eco-indicator values resulting from the use of paraffin are less favorable for the environment than the values for salt hydrate by 65%. This is mainly due to the production process and everything related to it, i.e., the extraction of natural resources and their processing.
  • Although PCMs have a negative impact on the environment during the production process, this impact can be reduced. After taking into account the beneficial effects of dispersed PCM heat accumulators for cooperation with buildings in the DHS, negative Eco-indicator values are achieved, which means a positive environmental impact. These values ranged from −0.504 × 10⁻² kPt/kW to −2.385 × 10⁻² kPt/kW for paraffin and from −1.55 × 10⁻² kPt/kW to −6.44 × 10⁻² kPt/kW for salt hydrate with the amount of heat not used by the building, ΔQi, within 10–50%. The reduction in the environmental impact corresponded to the increase in the technical potential of heat storage during the operation of the system. The conducted research confirmed that PCMs are beneficial throughout the life cycle for heat storage in DHS.
Summarizing the results of the analysis and the final conclusions, it can be stated that the application of this method of the selection of dispersed PCM heat accumulators for cooperation with buildings in the DHS improves the efficiency of the system. The LCA analysis showed that the positive effect of using such a solution, in addition to reducing the environmental load associated with the introduction of new technology to DHS, causes further environmental benefits. Due to dispersed heat storage, an increase in system efficiency of 41% was achieved. LCA analysis showed that a positive impact on the environment was achieved, expressed as negative values of the Eco-indicator from −0.504 × 10⁻² to −6.44 × 10⁻² kPt/kW. Comparing these results to the data from the literature review, it was found that using a PCM inside the collector’s vacuum tube led to a reduction in harmful effects on the environment from 63 to 101 Pt, which is on a much smaller scale than the effects obtained for heating substations. In addition, for other, comparable data such as the EPBT of 0.74 MJ/kWh, the results for dispersed PCM heat accumulators were in the range of 1.55–2.06 MJ/kWh and were more favorable. Therefore, the payback period for energy expenditure was 3–4 years. In Poland, the diversification of fuels used for heat production is progressing slowly. Thus, heat storage by means of PCM is an opportunity to accelerate the use of renewable energy sources. Moreover, the development of a new and singular method of selection of a dispersed PCM heat accumulator is a good and easy tool for introducing such solutions in DHS. It is the first unified and universal method of selection of PCM heat accumulators, providing guidelines for comparing the obtained results and for implementing such solutions in real objects. The material presented in this paper significantly broadens the knowledge of the use of PCM heat accumulators in DHS, in terms of the life cycle, as well as the systematization of the selection method. It is also a supplement to the missing knowledge in this field, which may significantly contribute to the popularization of this type of solution. At the same time, it is a response to the district heating market’s demand for new, unconventional methods of improving DHS efficiency which fit into the definition of an energy-efficient district heating or cooling system.

Author Contributions

Conceptualization, M.T.; Formal analysis, A.J.; Investigation, A.J.; Methodology, M.T. and A.J.; Software, M.T.; Supervision, M.T.; Validation, M.T.; Visualization, M.T.; Writing—original draft, M.T.; Writing—review & editing, M.T. All authors have read and agreed to the published version of the manuscript.

Funding

This research received no external funding.

Institutional Review Board Statement

Not applicable.

Informed Consent Statement

Not applicable.

Data Availability Statement

Not applicable.

Acknowledgments

The scientific research was funded by the statute subvention of the Czestochowa University of Technology, Faculty of Infrastructure and Environment.

Conflicts of Interest

The authors declare no conflict of interest.

Nomenclature

cpspecific heat (J/(kg K))
DHSdistrict heating system
dincrease, (–)
ELCDEuropean Platform on Life Cycle Assessment
Hamount of heat of phase change (J/kg)
Llength (m)
LCAlife cycle assessment
LCIdata collection for analysis
LCIAassessment of the environmental impact of the technology
mweight, (kg)
m ˙ mass flow (kg/s)
PCMphase change material
Ptvalue of Eco-indicator points
Qheat (J/a)
Q ˙ thermal power (W)
qunitary thermal power (W/m)
S1, S2scenarios of waste management
Ttemperature (K)
ttemperature (°C)
Vvolume (m3)
Greek symbols
Δdifference
Φthermal load of building (W)
ηefficiency, %
ρdensity (kg/m3)
τtime (s)
φrelative heat demand (–)
ϵbelongs to the set
< ; >closed set on both sides
Subscripts
avaverage
ddistribution
eexternal
exexploitation
ggeneration
iinstallation
intinternal
lliquid
mexponent of the characteristic
nnetwork
nonwithout
pparaffin
projdesign values that should be achieved
redreduction
ssolid
shsalt hydrate
ststorage
tottotal
v1, v2variant 1, variant 2
1supply
2return
24 htwenty-four hours
(−20 °C)minimal design external air temperature

References

  1. Brum, M.; Erickson, P.; Jenkins, B.; Kornbluth, K. A comparative study of district and individual energy systems providing electrical-based heating, cooling, and domestic hot water to a low-energy use residential community. Energy Build. 2015, 92, 306–312. [Google Scholar] [CrossRef]
  2. Turski, M.; Sekret, R. Conceptual adsorption system of cooling and heating supplied by solar energy. Chem. Process. Eng. 2016, 37, 293–304. [Google Scholar] [CrossRef] [Green Version]
  3. Energy Efficiency Act of 20 May 2016 as Implementation of Directive (EU) 2018/2002 of the European Parliament and of the Council of 11 December 2018 Amending Directive 2012/27/EU on Energy Efficiency; Official Journal of the European Union: Brussels, Belgum, 2018.
  4. Wojdyga, K.; Chorzelski, M.; Rozycka-Wronska, E. Emission of pollutants in flue gases from Polish district heating sources. J. Clean. Prod. 2014, 75, 157–165. [Google Scholar] [CrossRef]
  5. Köfinger, M.; Basciotti, D.; Schmidt, R.R.; Meissner, E.; Doczekal, C.; Giovannini, A. Low temperature district heating in Austria: Energetic, ecologic and economic comparison of four case studies. Energy 2016, 110, 95–104. [Google Scholar] [CrossRef]
  6. Turski, M. Eco-development aspect in modernization of industrial system. E3S Web Conf. 2018, 44, 181. [Google Scholar] [CrossRef] [Green Version]
  7. Turski, M.; Sekret, R. The Need to Reorganize District Heating Systems in the Light of Changes Taking Place in the Building Sector. Rynek Energy 2015, 119, 27–34. Available online: https://www.cire.pl/pliki/2/04sekretturskirec15.pdf (accessed on 20 June 2022).
  8. Turski, M.; Sekret, R. New Solutions for Hybrid Energy Supply Systems of Buildings. Rynek Energy 2016, 122, 66–74. Available online: https://www.cire.pl/pliki/2/10turskisekretrec15.pdf (accessed on 20 June 2022).
  9. Lund, H.; Werner, S.; Wiltshire, R.; Svendsen, S.; Thorsen, J.; Hvelplund, F.; Mathiesen, B. 4th Generation District Heating (4GDH) Integrating smart thermal grids into future sustainable energy systems. Energy 2014, 68, 1–11. [Google Scholar] [CrossRef]
  10. Lundström, L.; Wallin, F. Heat demand profiles of energy conservation measures in buildings and their impact on a district heating system. Appl. Energy 2016, 161, 290–299. [Google Scholar] [CrossRef] [Green Version]
  11. Turski, M.; Sekret, R. Distribution and forecast of air temperature in determining of heat output of the district heating substation with heat storage. E3S Web Conf. 2019, 116, 94. [Google Scholar] [CrossRef] [Green Version]
  12. Nogaj, K. Possibilities of Dispersed Heat Storage in a Heating System through the Use of Solar House Technology; Scientific Works; University of Economics: Wrocław, Poland, 2016; Volume 461, pp. 157–169. [Google Scholar]
  13. Cholewa, T.; Siuta-Olcha, A.; Balaras, C.A. Actual energy savings from the use of thermostatic radiator valves in residential buildings—Long term field evaluation. Energy Build. 2017, 151, 487–493. [Google Scholar] [CrossRef]
  14. Cholewa, T.; Balen, I.; Siuta-Olcha, A. On the influence of local and zonal hydraulic balancing of heating system on energy savings in existing buildings—Long term experimental research. Energy Build. 2018, 179, 156–164. [Google Scholar] [CrossRef]
  15. Nogaj, K.; Turski, M.; Sekret, R. The Use of Substations with PCM Heat Accumulators in District Heating System. MATEC Web Conf. 2018, 174, 1002. Available online: https://www.e3s-conferences.org/articles/e3sconf/abs/2018/19/e3sconf_eko-dok2018_00181/e3sconf_eko-dok2018_00181.html (accessed on 20 June 2022). [CrossRef] [Green Version]
  16. Nogaj, K.; Turski, M.; Sekret, R. The Influence of Using Heat Storage with PCM on Inlet and Outlet Temperatures in Substation in DHS. E3S Web Conf. 2017, 22, 124. Available online: https://www.e3s-conferences.org/articles/e3sconf/pdf/2017/10/e3sconf_asee2017_00124.pdf (accessed on 20 June 2022). [CrossRef] [Green Version]
  17. Ferla, G.; Caputo, P. Biomass district heating system in Italy: A comprehensive model-based method for the assessment of energy, economic and environmental performance. Energy 2022, 244, 123105. [Google Scholar] [CrossRef]
  18. Faninger, G. Active Solar Heating: Water. Sustainable Solar Housing: Exemplary Buildings and Technologies; EARTHSCAN: London, UK; Sterling, VA, USA, 2004. [Google Scholar]
  19. Bruno, F.; Belusko, M.; Liu, M.; Tay, N.H.S. Using solid-liquid phase change materials (PCMs) in thermal energy storage systems. In Advances in Thermal Energy Storage Systems; Woodhead Publishing: Sawston, UK, 2015; pp. 201–246. [Google Scholar] [CrossRef]
  20. Turski, M.; Sekret, R. Buildings and a district heating network as thermal energy storages in the district heating system. Energy Build. 2018, 179, 49–56. [Google Scholar] [CrossRef]
  21. Sayegh, M.; Danielewicz, J.; Nannou, T.; Miniewicz, M.; Jadwiszczak, P.; Piekarska, K.; Jouhara, H. Trends of European research and development in district heating technologies. Renew. Sustain. Energy Rev. 2017, 68, 1183–1192. [Google Scholar] [CrossRef] [Green Version]
  22. Jiang, X.S.; Jing, Z.X.; Li, Y.Z.; Wu, Q.H.; Tang, W.H. Modelling and operation optimization of an integrated energy based direct district water-heating system. Energy 2013, 64, 375–388. [Google Scholar] [CrossRef]
  23. Castell, A.; Sole, C. Design of latent heat storage systems using phase change materials (PCMs). In Advances in Thermal Energy Storage Systems; Woodhead Publishing: Sawston, UK, 2014; pp. 285–305. [Google Scholar]
  24. Basakayi, J.K.; Storm, V.V. Potential use of phase change materials with reference to thermal energy systems in South Africa. Int. J. Adv. Eng. Technol. 2014, 7, 692–700. [Google Scholar]
  25. Kenisarin, M.; Mahkamov, K. Salt hydrates as latent heat storage materials: Thermophysical properties and costs. Sol. Energy Mater. Sol. Cells 2016, 145, 255–286. [Google Scholar] [CrossRef]
  26. Trogrlic, M. Analysis and Design of Systems for Thermal-Energy Storage at Moderate Temperatures Based on Phase Change Materials (PCM); Norwegian University of Science and Technology: Trondheim, Norway, 2014. [Google Scholar]
  27. Guoa, X.; Shu, H.; Gao, J.; Xu, F.; Cheng, C.; Sun, Z.; Xu, D. Volume design of the heat storage tank of solar assisted water source heat pump space heating system. Procedia Eng. 2017, 205, 2691–2697. [Google Scholar] [CrossRef]
  28. Turski, M.; Nogaj, K.; Sekret, R. The use of a PCM heat accumulator to improve the efficiency of the district heating substation. Energy 2019, 187, 115885. [Google Scholar] [CrossRef]
  29. Zsembinszki, G.; Fernández, A.G.; Cabeza, L.F. Selection of the appropriate phase change material for two innovative compact energy storage systems in residential buildings. Appl. Sci. 2020, 10, 2116. [Google Scholar] [CrossRef] [Green Version]
  30. Jachura, A.; Sekret, R. Life Cycle Assessment of the Use of Phase Change Material in an Evacuated Solar Tube Collector. Energies 2021, 14, 4146. [Google Scholar] [CrossRef]
  31. Fong, A.D.; Miller, C.W. Efficiency of paraffin wax as a thermal energy storage system. In Proceedings of the International Solar Energy Society, Annual Meeting, Orlando, FL, USA, 6–10 June 1977; Section 16. pp. 6–10. [Google Scholar]
  32. Johansson, E.; Norrman, F. Life Cycle Analysis on Phase Change Materials for Thermal Energy Storage. Master’s Thesis, KTH School of Industrial Engineering and Management, Stockholm, Sweden, 2019; p. 329. [Google Scholar]
  33. Lamnatou, C.; Motte, F.; Notton, G.; Chemisana, D.; Cristofari, C. Cumulative energy demand and global waming potential of a building-integrated solar thermal system with/without phase change material. J. Environ. Manag. 2018, 212, 301–310. [Google Scholar] [CrossRef] [Green Version]
  34. Gracia, A.; Rincóna, L.; Castell, A.; Jiménez, M.; Boer, D.; Medranoa, M.; Cabeza, L.F. Life Cycle Assesment of the inclusion of phase change materials (PCM) in experimental buildings. Energy Build. 2010, 2, 1517–1523. [Google Scholar] [CrossRef]
  35. OrĂł, E.; Gil, A.; Gracia, A.; Boer, D.; Cabeza, L.F. Comparative life cycle assesment of thermal energy storage for solar power plants. Renew. Energy 2012, 44, 166–173. [Google Scholar] [CrossRef]
  36. Nienborg, B.; Gschwander, S.; Munz, G.; Fröhlich, D.; Helling, T.; Horn, R.; Weinläder, H.; Klinker, F.; Schossig, P. Life cycle assesment of thermal energy storage materials and components. Energy Procedia 2018, 155, 111–120. [Google Scholar] [CrossRef]
  37. Abhat, A. Low temperature latent heat thermal energy storage: Heat storage materials. Sol. Energy 1983, 30, 313–332. [Google Scholar] [CrossRef]
  38. Abhat, A. Short term thermal energy storage. Rev. Phys. Appl. 1980, 15, 477–501. [Google Scholar] [CrossRef]
  39. PN-EN ISO 14040:2009; Environmental Management. Life Cycle Assessment. Principles and Structure. Polish Committee for Standardization Publishing: Warsaw, Polish, 2009.
  40. PN-EN ISO 14044:2009; Environmental Management. Life Cycle Assessment. Requirements and Guidelines. Polish Committee for Standardization Publishing: Warsaw, Poland, 2009.
  41. Du, K.; Calautit, J.; Wang, Z.; Wu, Y.; Liu, H. A review of the applications of phase change materials in cooling, heating and power generation in different temperature ranges. Appl. Energy 2018, 220, 242–273. [Google Scholar] [CrossRef]
  42. Frischknecht, R.; Jungbluth, N. Overview and Methodology; Ecoinvent Center: Dübendorf, Switzerland, 2007; Available online: https://inis.iaea.org/collection/NCLCollectionStore/_Public/41/028/41028087.pdf?r=1 (accessed on 20 June 2022).
  43. Ecoinvent. For the Availability of Environmental Data Worldwide. Available online: https://ecoinvent.org/ (accessed on 20 June 2022).
  44. Dreyer, L.C.; Niemann, A.L.; Hauschild, M.Z. Comparison of Three Different LCIA Methods: EDIP97, CML2001 and Eco-indicator 99: Does it matter which one you choose? Int. J. Life Cycle Assess. 2003, 8, 191–200. [Google Scholar]
  45. PRé Sustainability. SimaPro Database Manual—Methods Library; PRé Sustainability: Amersfoort, The Netherlands, 2016; Available online: https://simapro.com/wp-content/uploads/2020/10/DatabaseManualMethods.pdf (accessed on 20 June 2022).
Figure 1. Logical diagram of the conducted analysis with boundaries of LCA.
Energies 15 05771 g001
Figure 2. Scheme of input data for the selection of a dispersed PCM heat accumulator for cooperation with a DHS and the expected results.
Energies 15 05771 g002
Figure 3. Distribution of supply and return water temperatures under design conditions for the heating season.
Energies 15 05771 g003
Figure 4. Nomogram for the selection of theoretical, average hourly potential of heat storage.
Energies 15 05771 g004
Figure 5. Nomogram for the selection of maximum hourly potential of heat storage and maximum potential for heat transfer to the heating network.
Energies 15 05771 g005
Figure 6. Distribution and average values of return water temperatures in the installation under reference conditions and for relative characteristics.
Energies 15 05771 g006
Figure 7. Hourly frequency of occurrence of return water temperatures.
Energies 15 05771 g007
Figure 8. Scoring results of the PCM types.
Energies 15 05771 g008
Figure 9. Selection of the active volume of PCM heat accumulator and PCM mass.
Energies 15 05771 g009
Figure 10. Reduction in heat loss, regulation of return water temperature, and improvement of efficiency after the application of dispersed PCM heat accumulators.
Energies 15 05771 g010
Figure 11. Environmental impacts of the application of dispersed PCM heat accumulators for cooperation with buildings in the DHS.
Energies 15 05771 g011
Table 1. Methodology of PCM selection.
AspectsNrCriterionType of PCMWeight of CriterionPoints
Type 1Type 2Type 3Type 4Type 1Type 2Type 3Type 4
CPnPShMWPnPShM
Aspect 1–41.C1C1PC1nPC1ShC1MW1C1PW1C1nPW1C1ShW1C1MW1
2.C2C2PC2nPC2ShC2MW2C2PW2C2nPW2C2ShW2C2MW2
etc.etc.etc.etc.etc.etc.etc.etc.etc.etc.etc.
nCnCnPCnnPCnShCnMWnCnP∙WnCnnPWnCnShWnCnMWn
Thermal aspect
Physical aspect
Chemical aspect
Economic aspect
Name of criterionThe best match in terms of operating parameters: 3 points
The match meets the minimum requirements: 2 points
The fit was possible in terms of performance, but purely theoretically
1 point
Importance of the criteria in the set of aspects: highest weightPoints were obtained on the basis of criteria:
Thermal: temperature, latent heat, thermal conductivity, supercooling, and thermal stability.
Physical: balance, density, volume difference, pressure, and destabilization.
Chemical: compatibility with housing, toxicity, corrosion, and flammability
inertness.
Economic: PCM price, number of cycles of heat storage, availability, maintenance, and cost of entire installation.
Notetot:ΣPΣnPΣShΣM
Table 2. Damage categories and impact categories.
Damage CategoriesImpact Categories
Human HealthCarcinogenic effects on humans (Carcinogens)
Respiratory effects caused by organic substances (Respiratory organics)
Respiratory effects caused by inorganic substances (Respiratory inorganic)
Damage caused by climate change (Climate change)
Effects caused by ionizing radiation (Radiation)
Effects caused by ozone layer depletion (Ozone layer)
Ecosystem QualityDamage caused by ecotoxic effects (Ecotoxicity)
Damage caused by the combined effect of acidification and eutrophication (Acidification/Eutrophication)
Damage caused by land occupation and land conversion (Land use)
ResourcesDamages caused by the extraction of minerals (Minerals)
Damages caused by the extraction of fossil fuels (Fossil fuels)
Table 3. Table of supply and return temperatures distribution of the central heating installation in design conditions.
Outside Air Temperature
te
Heat Load Factor
φ
Supply Water Temperature
t1i,proj
Return Water Temperature
t2i,proj
Temperature Difference
ΔTproj
°C°C°CK
te ∈ 〈–te,proj; +te,projEquation (3)Equation (1)Equation (2)t1i,projt2i,proj
Table 4. Increases in monthly potentials of heat storage.
dΔQi,av 10%dΔQi,av 20%dΔQi,av 30%dΔQi,av 40%dΔQi,av 50%
(GJ/m)/1 kW Heat Output
October0.1350.2700.4050.5400.674
November0.1600.3200.4800.6400.800
December0.2470.4940.7410.9881.235
January0.2450.4910.7360.9821.227
February0.1190.2370.3560.4740.593
March0.1500.2990.4490.5990.749
April0.0550.1090.1640.2190.274
Publisher’s Note: MDPI stays neutral with regard to jurisdictional claims in published maps and institutional affiliations.

