1. Introduction
Climate change is a major concern for mankind. Global warming is transforming the environment, increasing the frequency and intensity of extreme weather events [
1,
2,
3,
4,
5,
6,
7]. Numerous methods of preventing these threats are also known. The strategy “A Clean Planet for all—A European strategic long-term vision for a prosperous, modern, competitive and climate neutral economy” presents solutions that can be applied to make the economy carbon neutral by the middle of this century [
8]. These options will radically transform the Polish energy system, which must be transformed into clean energy.
The energy crisis that arose in 2022 forces a faster energy transition towards renewable energy sources. This crisis is related to the very difficult geopolitical situation and the increased demand for energy as a result of the recovery of the global economy after the lockdown caused by the COVID-19 pandemic. A particularly difficult situation arose in Europe. Solar farms are a very reasonable alternative to conventional energy sources (coal, gas and nuclear power plants) and the question arises—is it possible to build a big solar farm or several big farms that could supply a small or medium-sized country? What criteria must be met for photovoltaics to replace all other power plants and become the only source of electricity? Is it feasible? What would the surface area of a solar farm have to be to supply countries such as Poland and Germany? A large solar farm (or several large farms) is an especially attractive idea for Poland. Currently, the energy market in Poland is based on coal-fired power plants. Poland urgently needs to decide on a new direction of self-transition of the energy market. The construction of several large solar farms is particularly advantageous in Silesia—one of the provinces in Poland. Silesia is the most heavily industrialized region in Poland. This province has been undergoing a complete transformation for 30 years—in the past, many hard coal mines operated here. Today, most of the mines are closed. There are machine industry, automotive, battery factories and many big companies in the field of automation and IT in Silesia. The province has the highest population density in Poland (the Silesia province has ~370 people per km
2, Poland has ~123 people per km
2) and 4.5 million inhabitants. In the central part of Silesia, there is the Katowice Metropolitan Area with ~2.5 million inhabitants (Katowice City has ~300 thousand inhabitants). Silesia is the largest urban area in Poland. After the closed mines, there are extensive underground wastelands and many coal waste heaps. There are also metallurgical waste heaps. These heaps can all be used to build solar farms, and the closed coal mines can be used to build underground hydrogen tanks. This would be a very good solution because, first of all, unused post-industrial areas would be developed. Secondly, in a short distance from these wastelands, large factories, industry and the urban agglomeration are located—there is no need to transmit electricity over a long distance. Moreover, solar farms generate the highest power in the middle of the day, which is exactly when the industry uses the highest power consumption. This reduces the use of energy stores, and thus extends their service life. Of course, large solar farms should be properly distributed (located) throughout Poland, but their construction in Silesia is the most profitable.
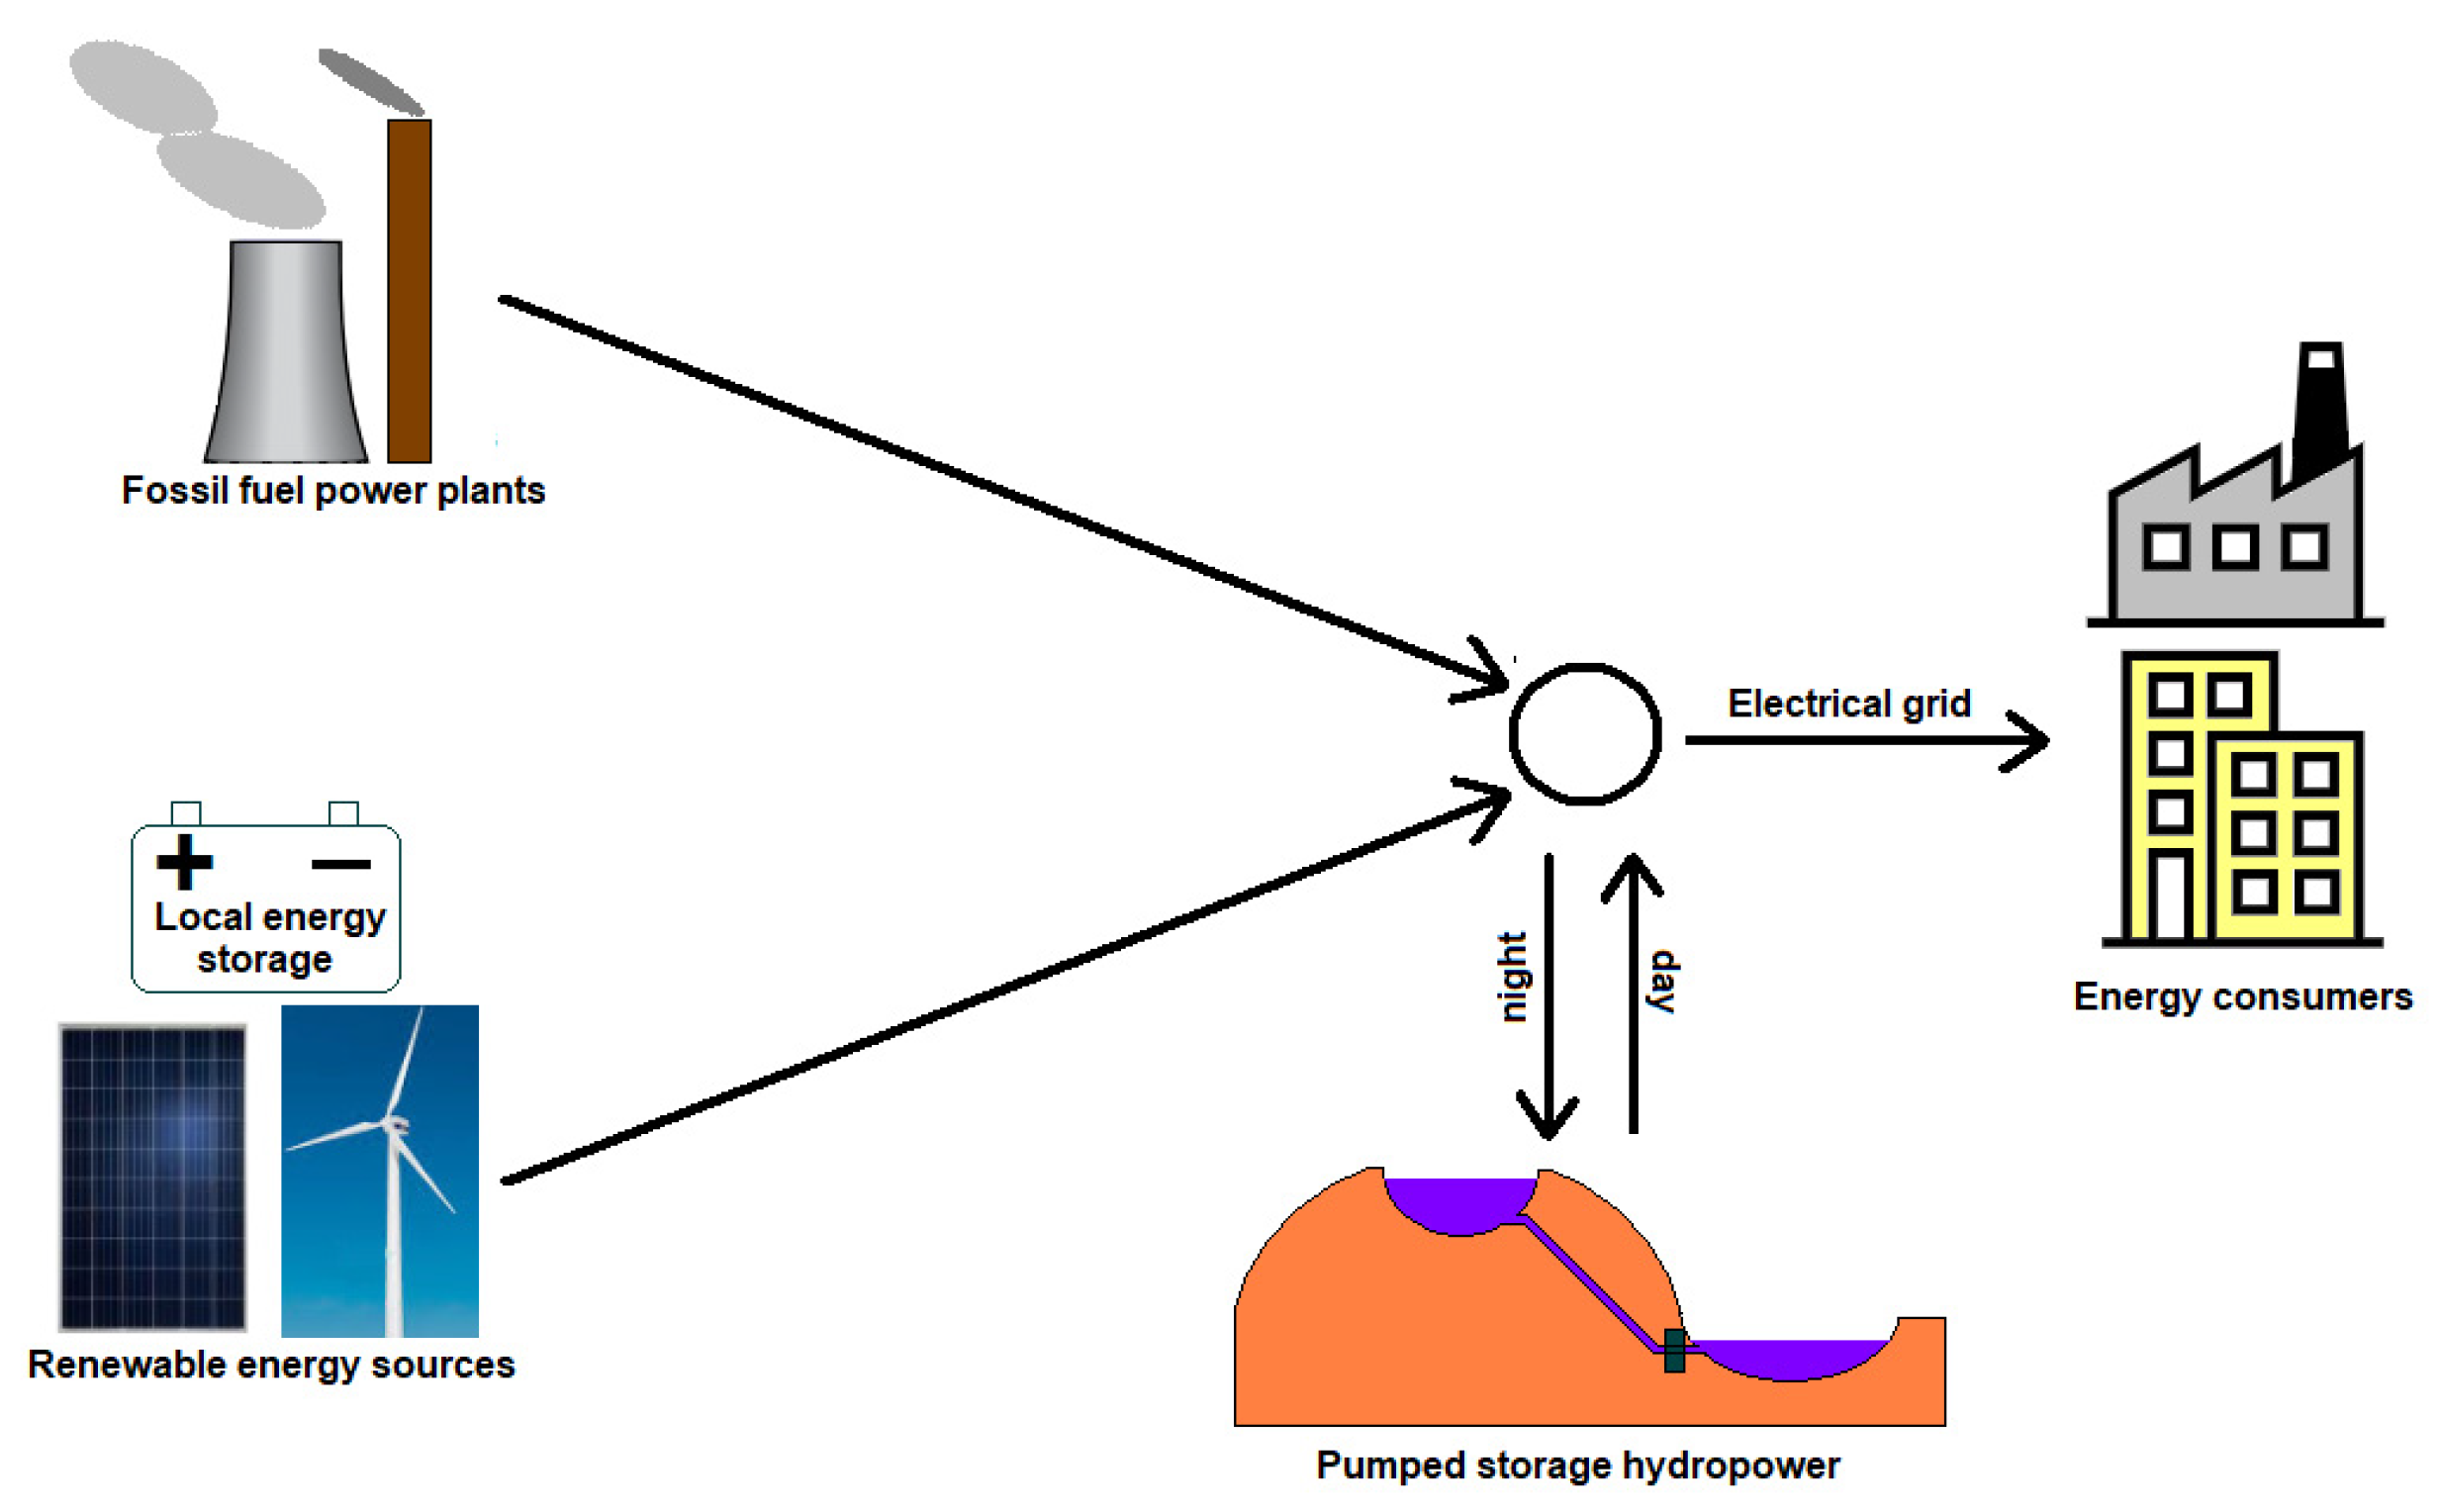
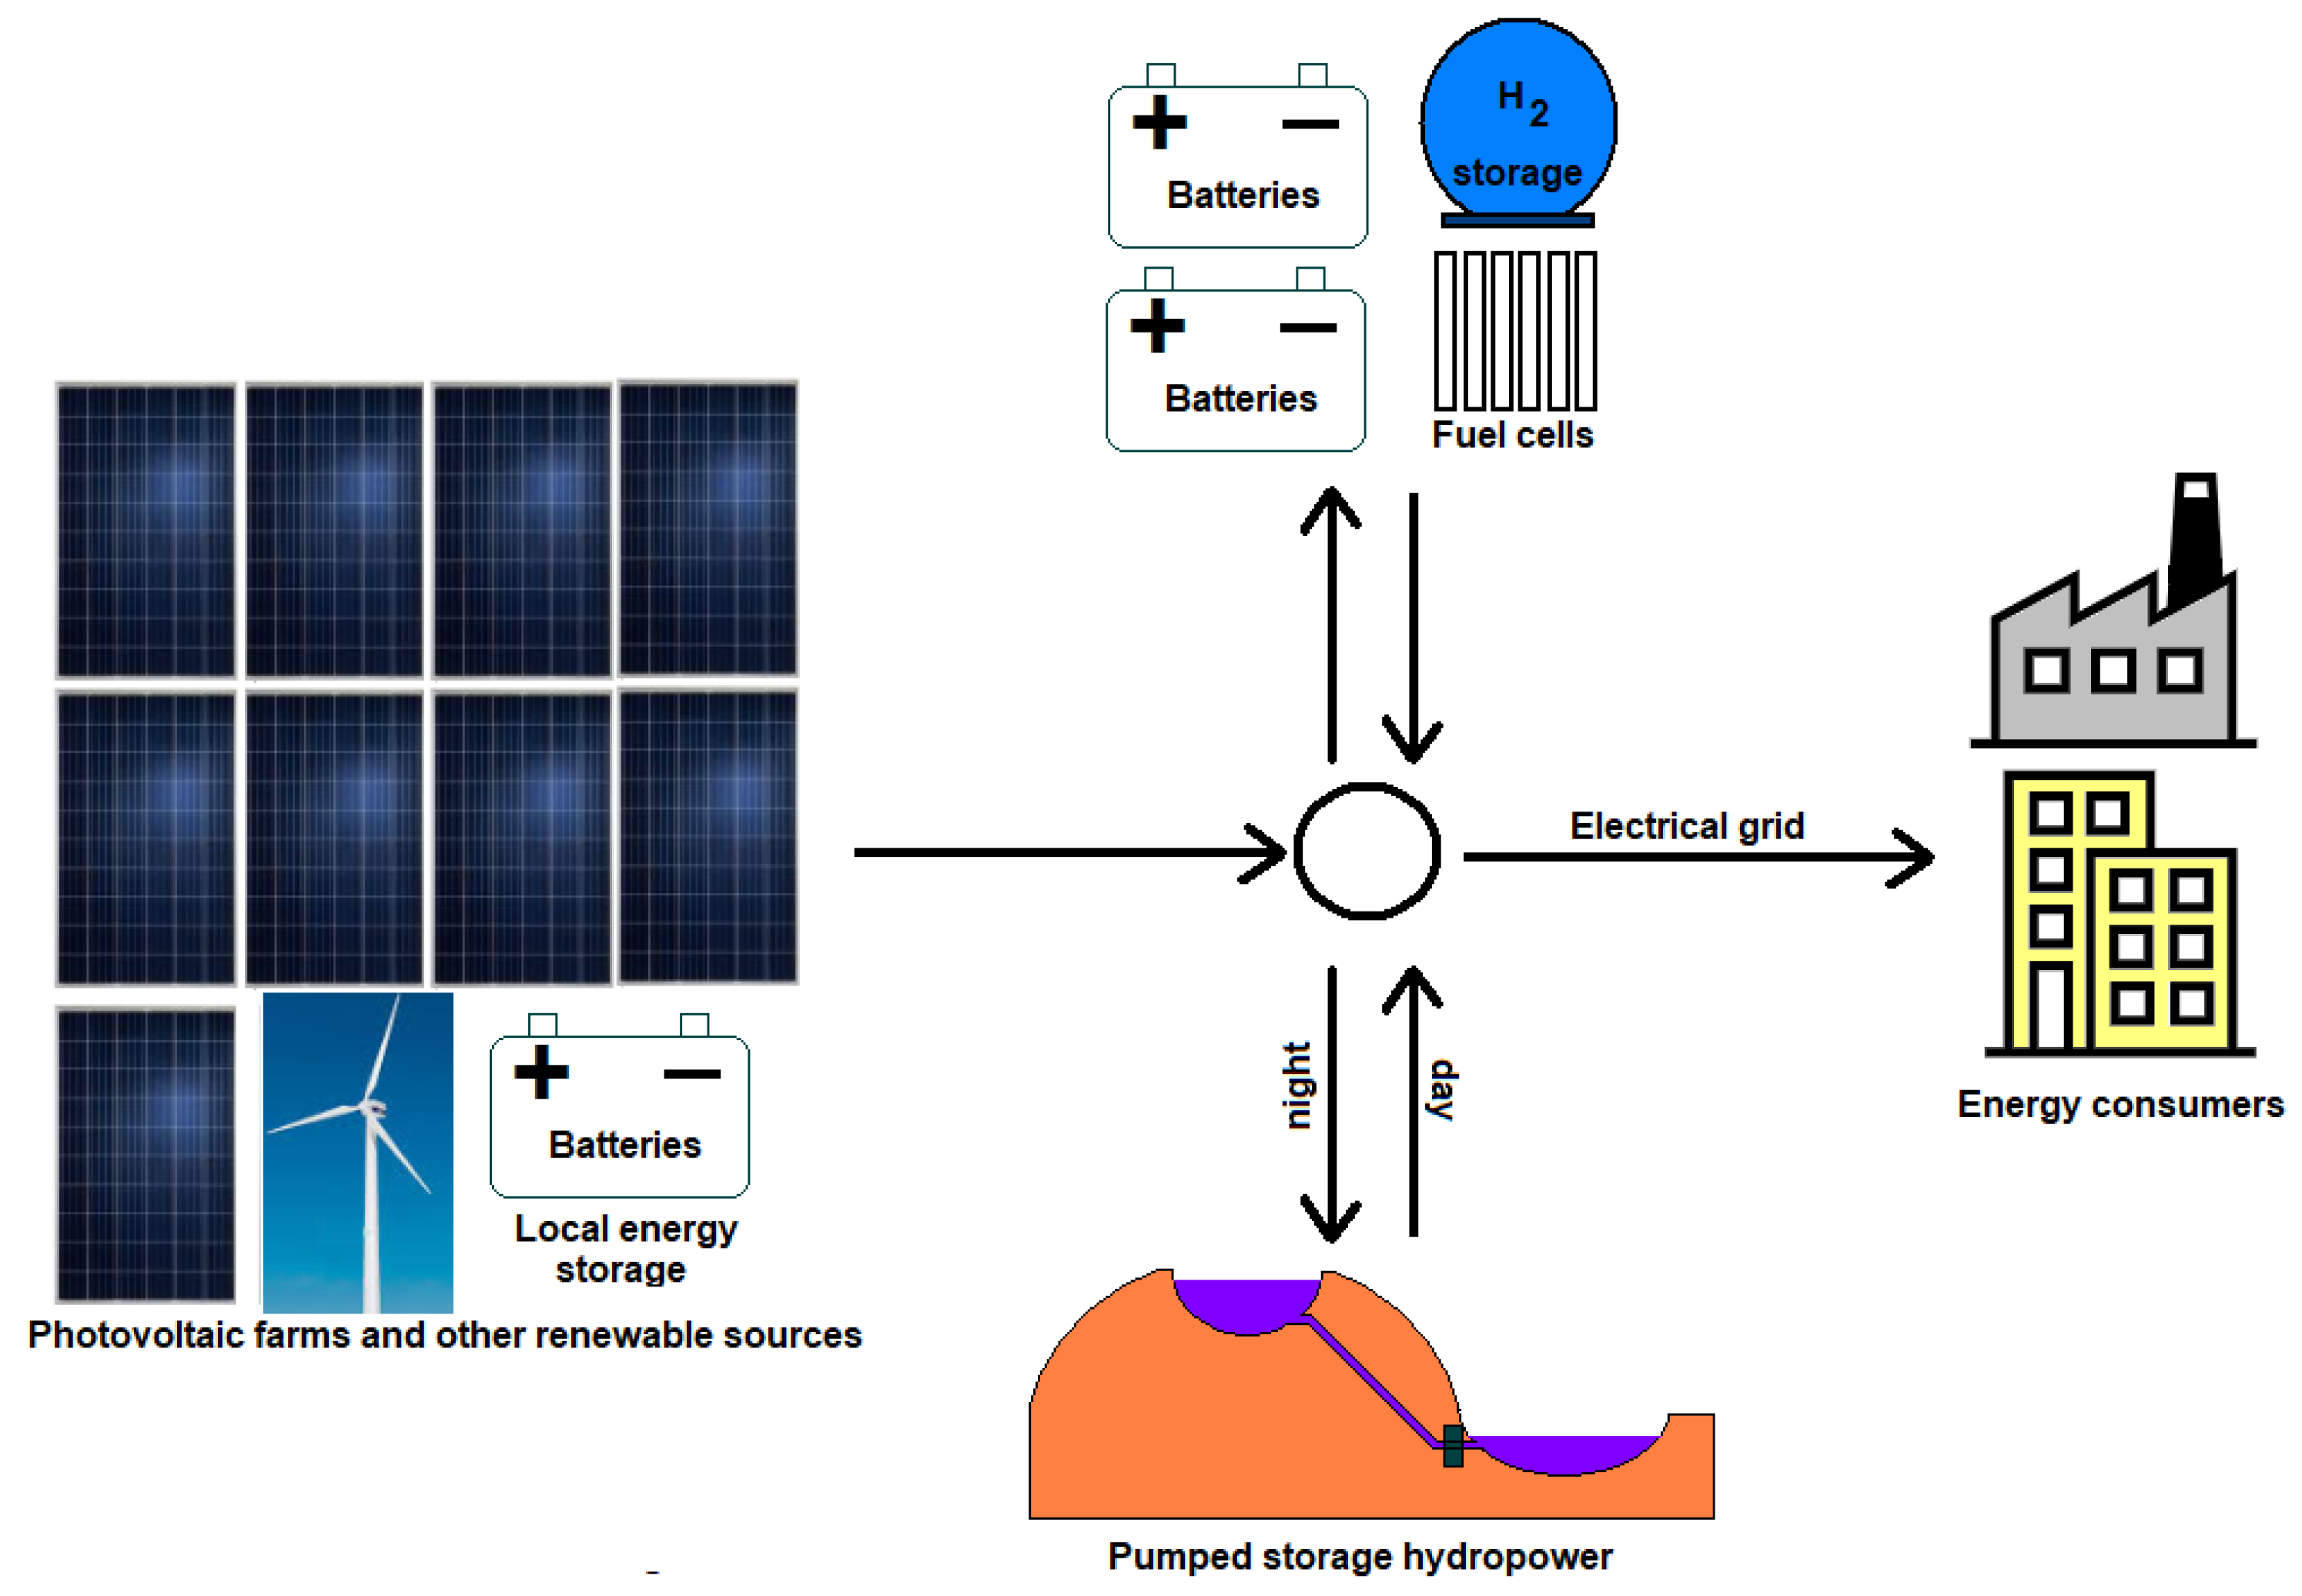
Figure 1 shows the actual structure of the electrical energy market in Poland. Two types of energy storage dominate in Poland—individual household batteries with a capacity of usually up to 100 kWh, and pumped storage hydropower plants that enable balancing the daily energy consumption. There are only three storage hydropower plants in Poland. Exemplary PGE-Żar PSH has installed a power capacity of 540 MW, typical annual generated energy of 0.64 TWh and typical annual energy consumption of 0.85 TWh [
9]. The number of household energy storage facilities has been growing recently in Poland. However, their relatively high price is a problem for a typical household in Poland.
The transformation of the energy market towards photovoltaic (PV) requires consideration of several important problems. First of all, it should be noted that the installed power capacity of a photovoltaic farm (PV farm) cannot be treated in the same way as the installed capacity of a fossil fuel or a nuclear power plant. There is a big difference here. For fossil fuel and nuclear power plants, we can generate power up to the value of the installed power capacity whenever it is needed. Of course, obtaining full power takes a certain amount of time due to starting up the additional power plant block, which is currently shut down (it can be turned on/off seasonally). The situation is completely different for PV sources. The full installed power capacity of PV sources is rarely available. It depends on the season (length of the day and the angle of the sun’s rays), cloudiness on a given day and temperature. It is not possible to program the generated PV power more than a week forward in time (sometimes a few weeks—it depends on the world region). This is due to the long-term unpredictability of the weather forecast. Therefore, the energy market based mainly on solar farms will require huge energy storage. It should be noted that conventional energy has also been using energy storage for decades (e.g., pumped storage hydropower). However, since a conventional power plant operates at a constant and known power, the energy storage does not have to be as large as for renewable energy sources.
In the presented article, the novelties are the determination of the necessary installed power capacity of the proposed PV farm, its PV surface area and the comparison of that area to the area of post-industrial degraded area in Poland. So far, such studies have not been carried out in Poland. Similar calculations of the solar farms surface area for Germany, Czech Republic and Slovak Republic are shown.
The article is organized as follows:
- -
Climate and energy policy in Poland;
- -
The electrical energy system based almost exclusively on photovoltaics: problems and requirements;
- -
Factors influencing the annual electricity production of a solar farm: specific photovoltaic power output;
- -
Calculations of the surface area of PV panels in the hypothetical solar farm;
- -
Summary and conclusions.
2. Poland’s Climate and Energy Policy and the International Context
In 2019, the European Commission published a communication on the European Green Deal, i.e., a strategy whose ambitious goal is to achieve climate neutrality by the EU by 2050. Poland has supported this goal and made great strides in reducing the environmental impact of the energy sector over the last several years, in particular, by modernizing generation capacity and diversifying the energy generation structure [
10,
11,
12,
13,
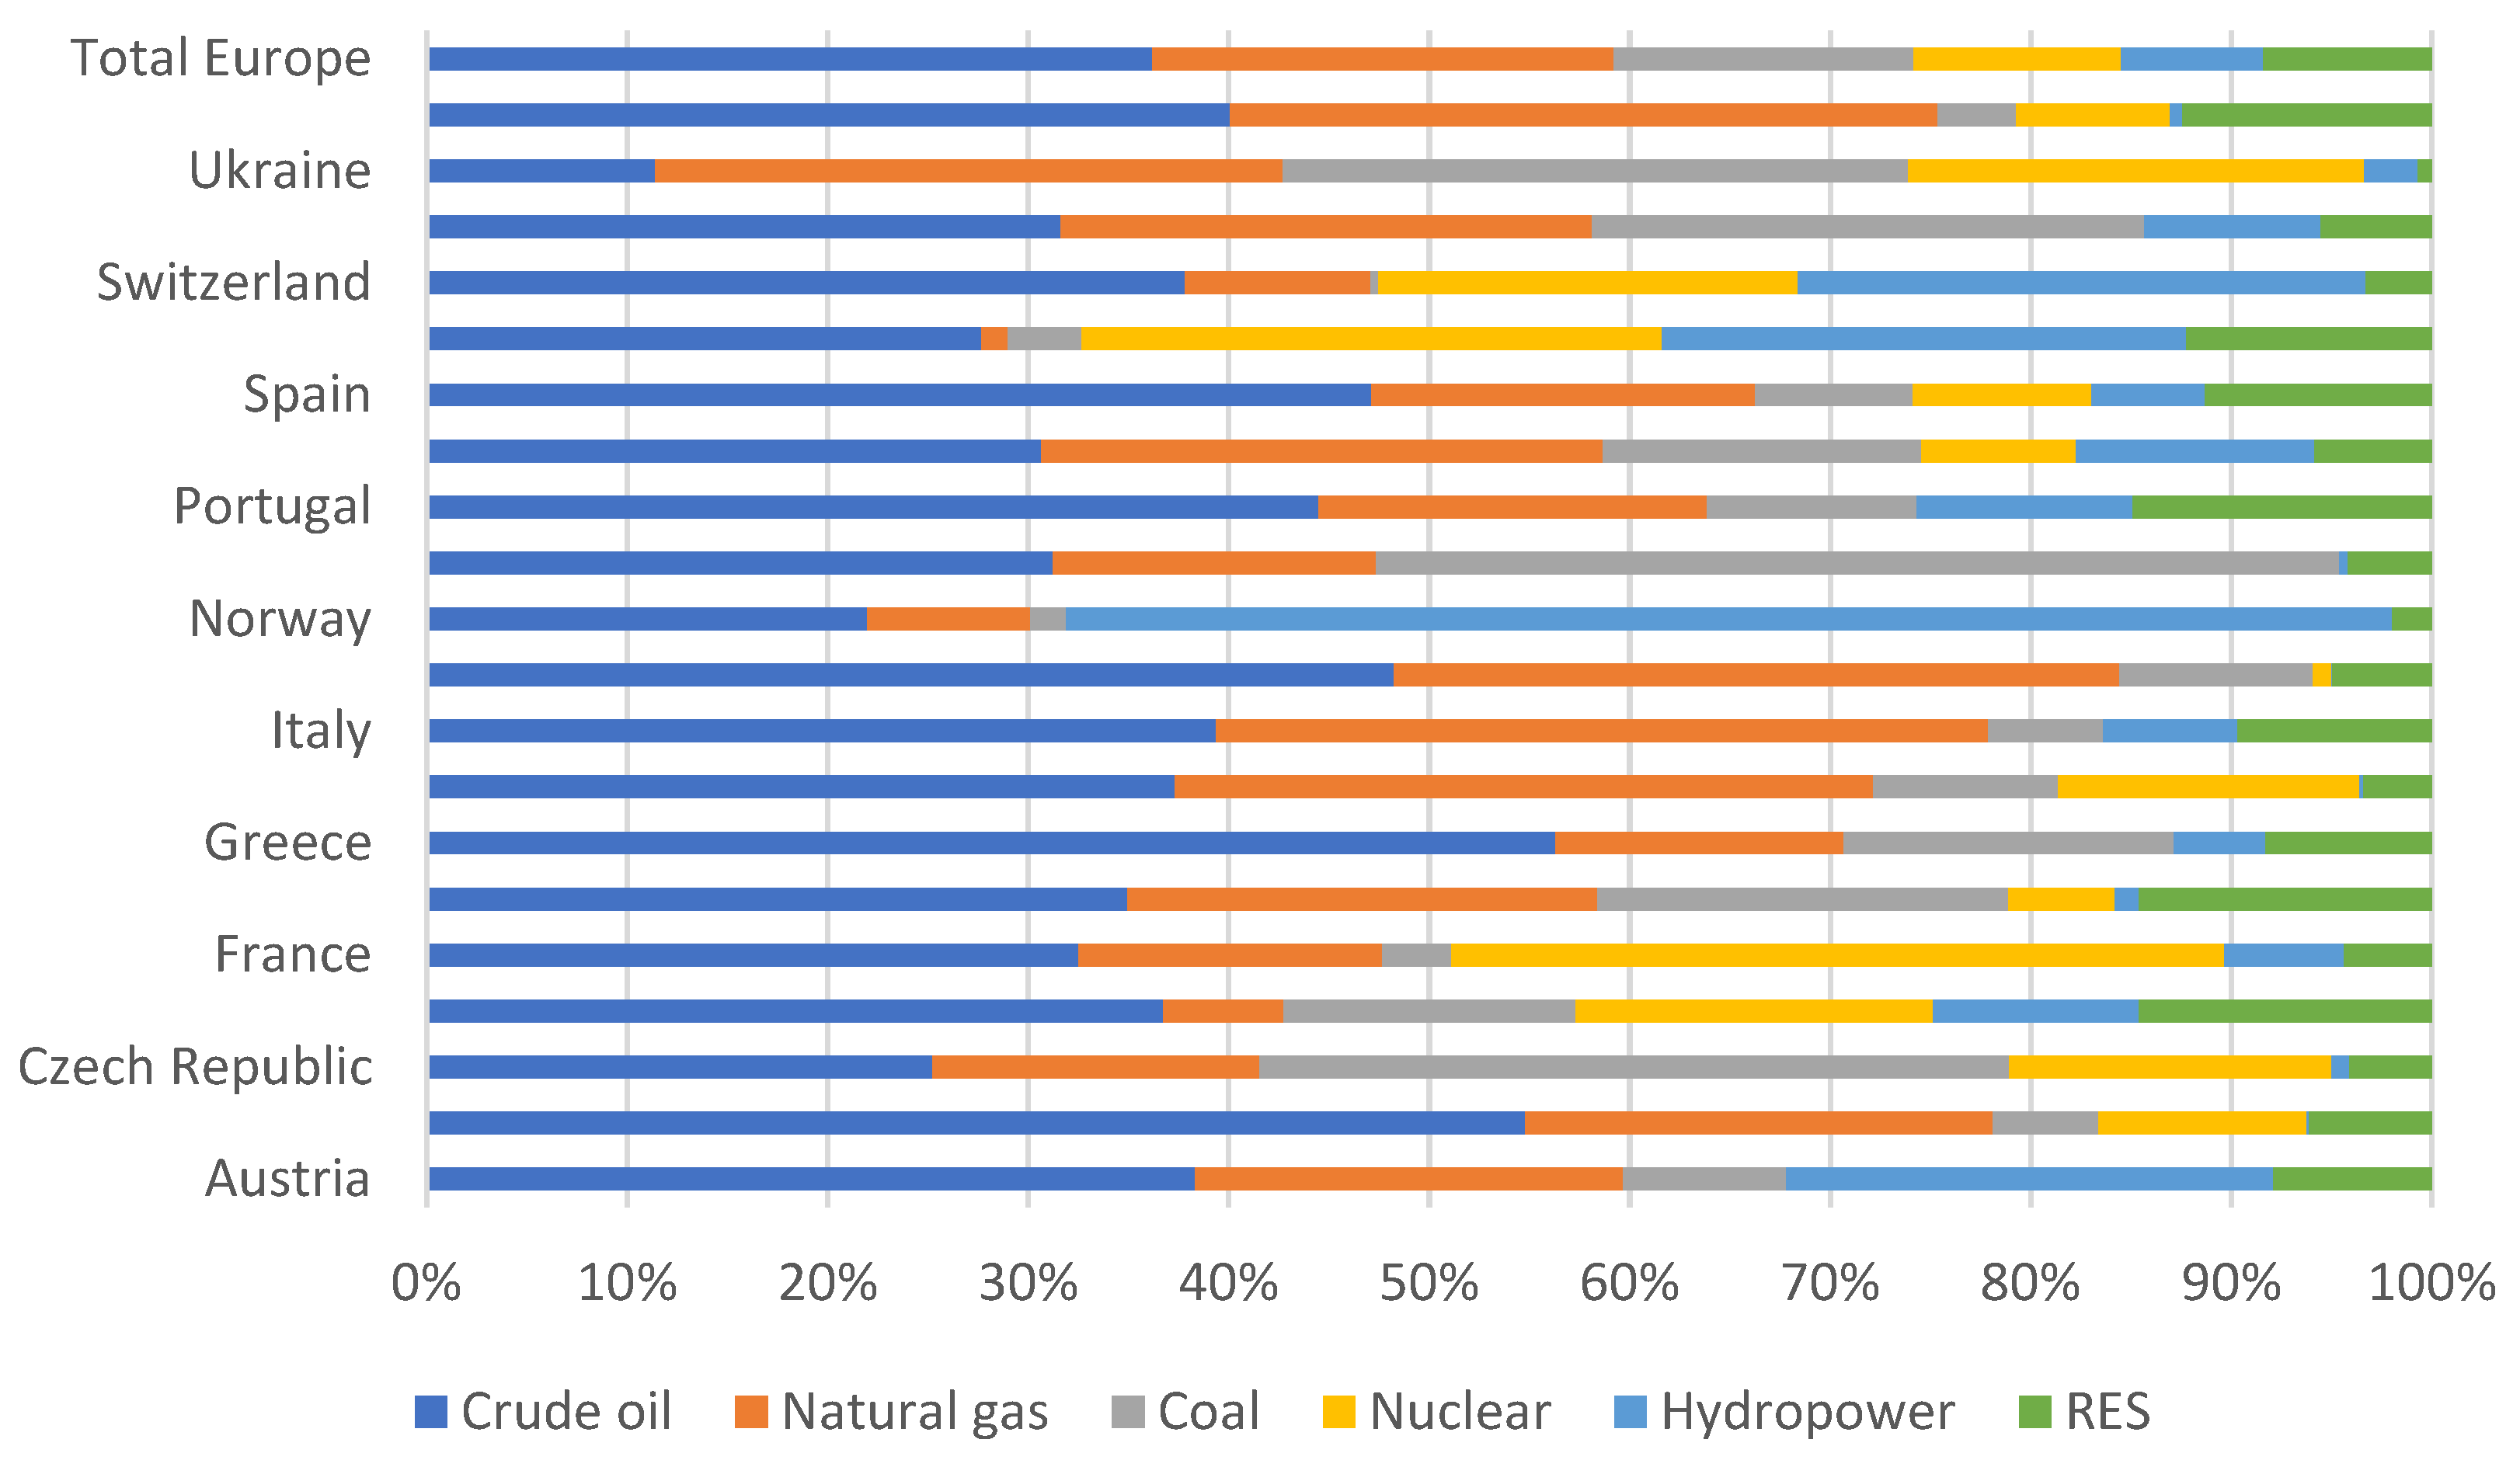
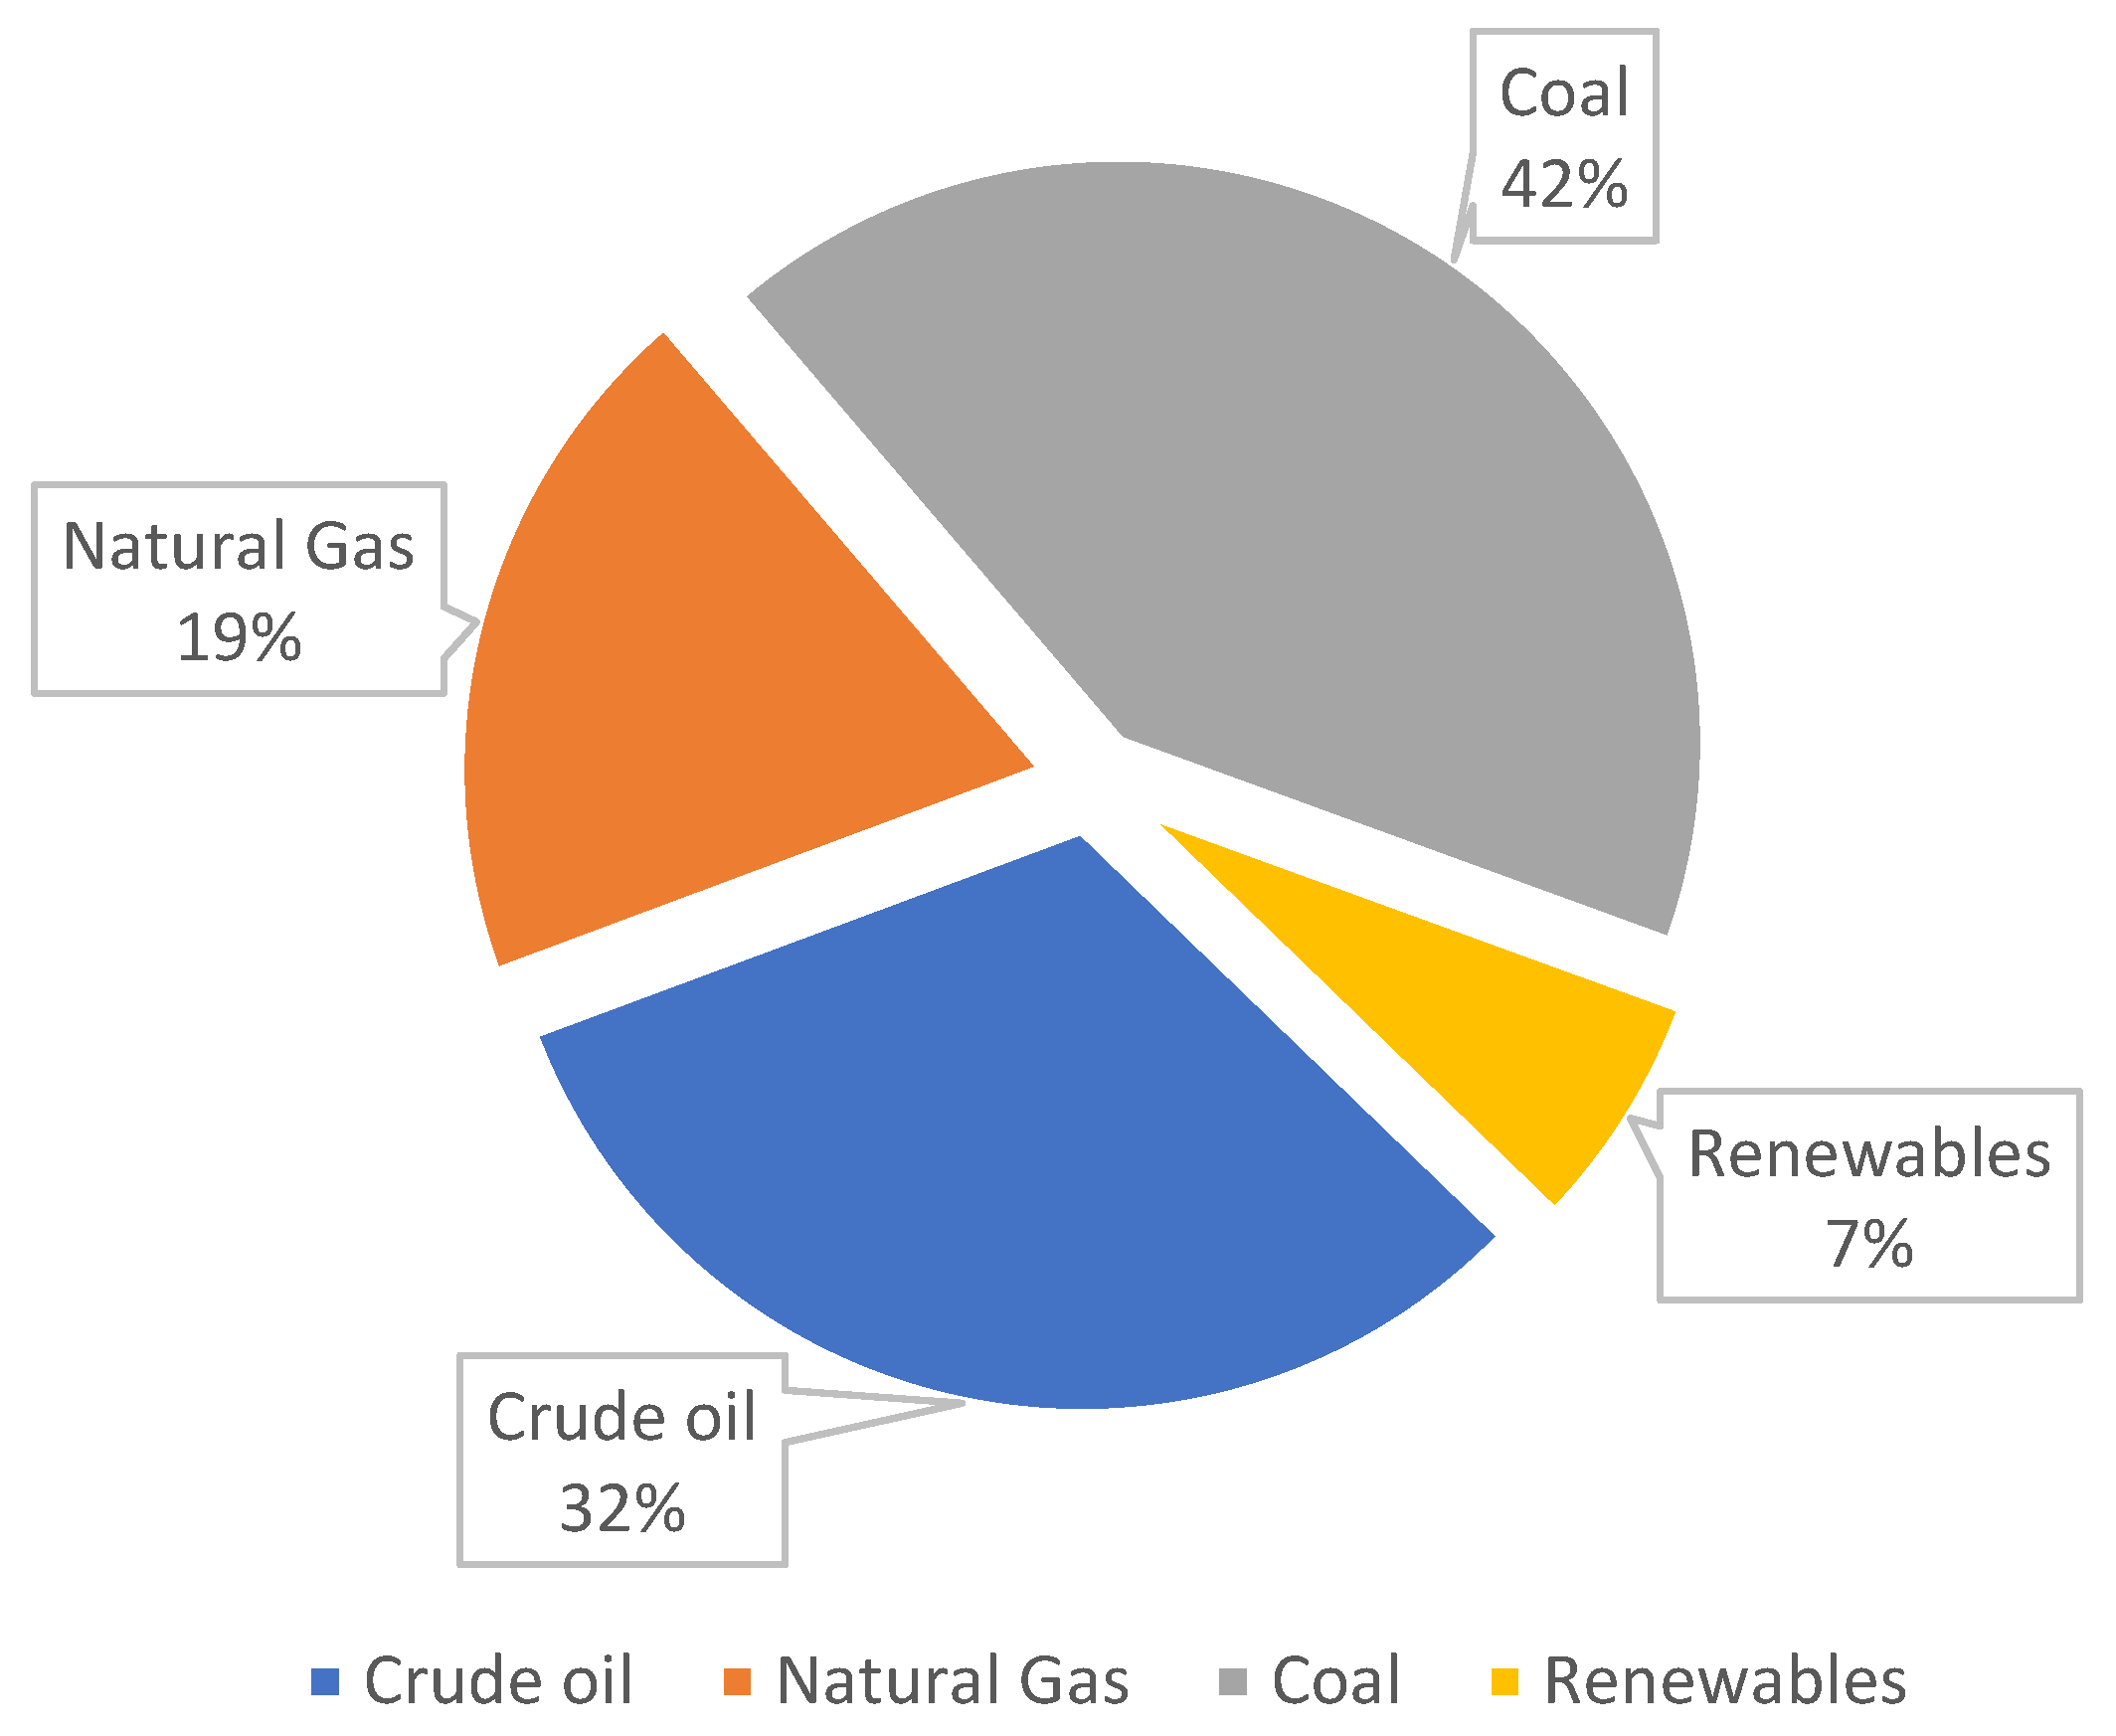
14]. Our dependence on carbon fuels is still much higher than that of other European countries, as shown in
Figure 2 and
Figure 3.
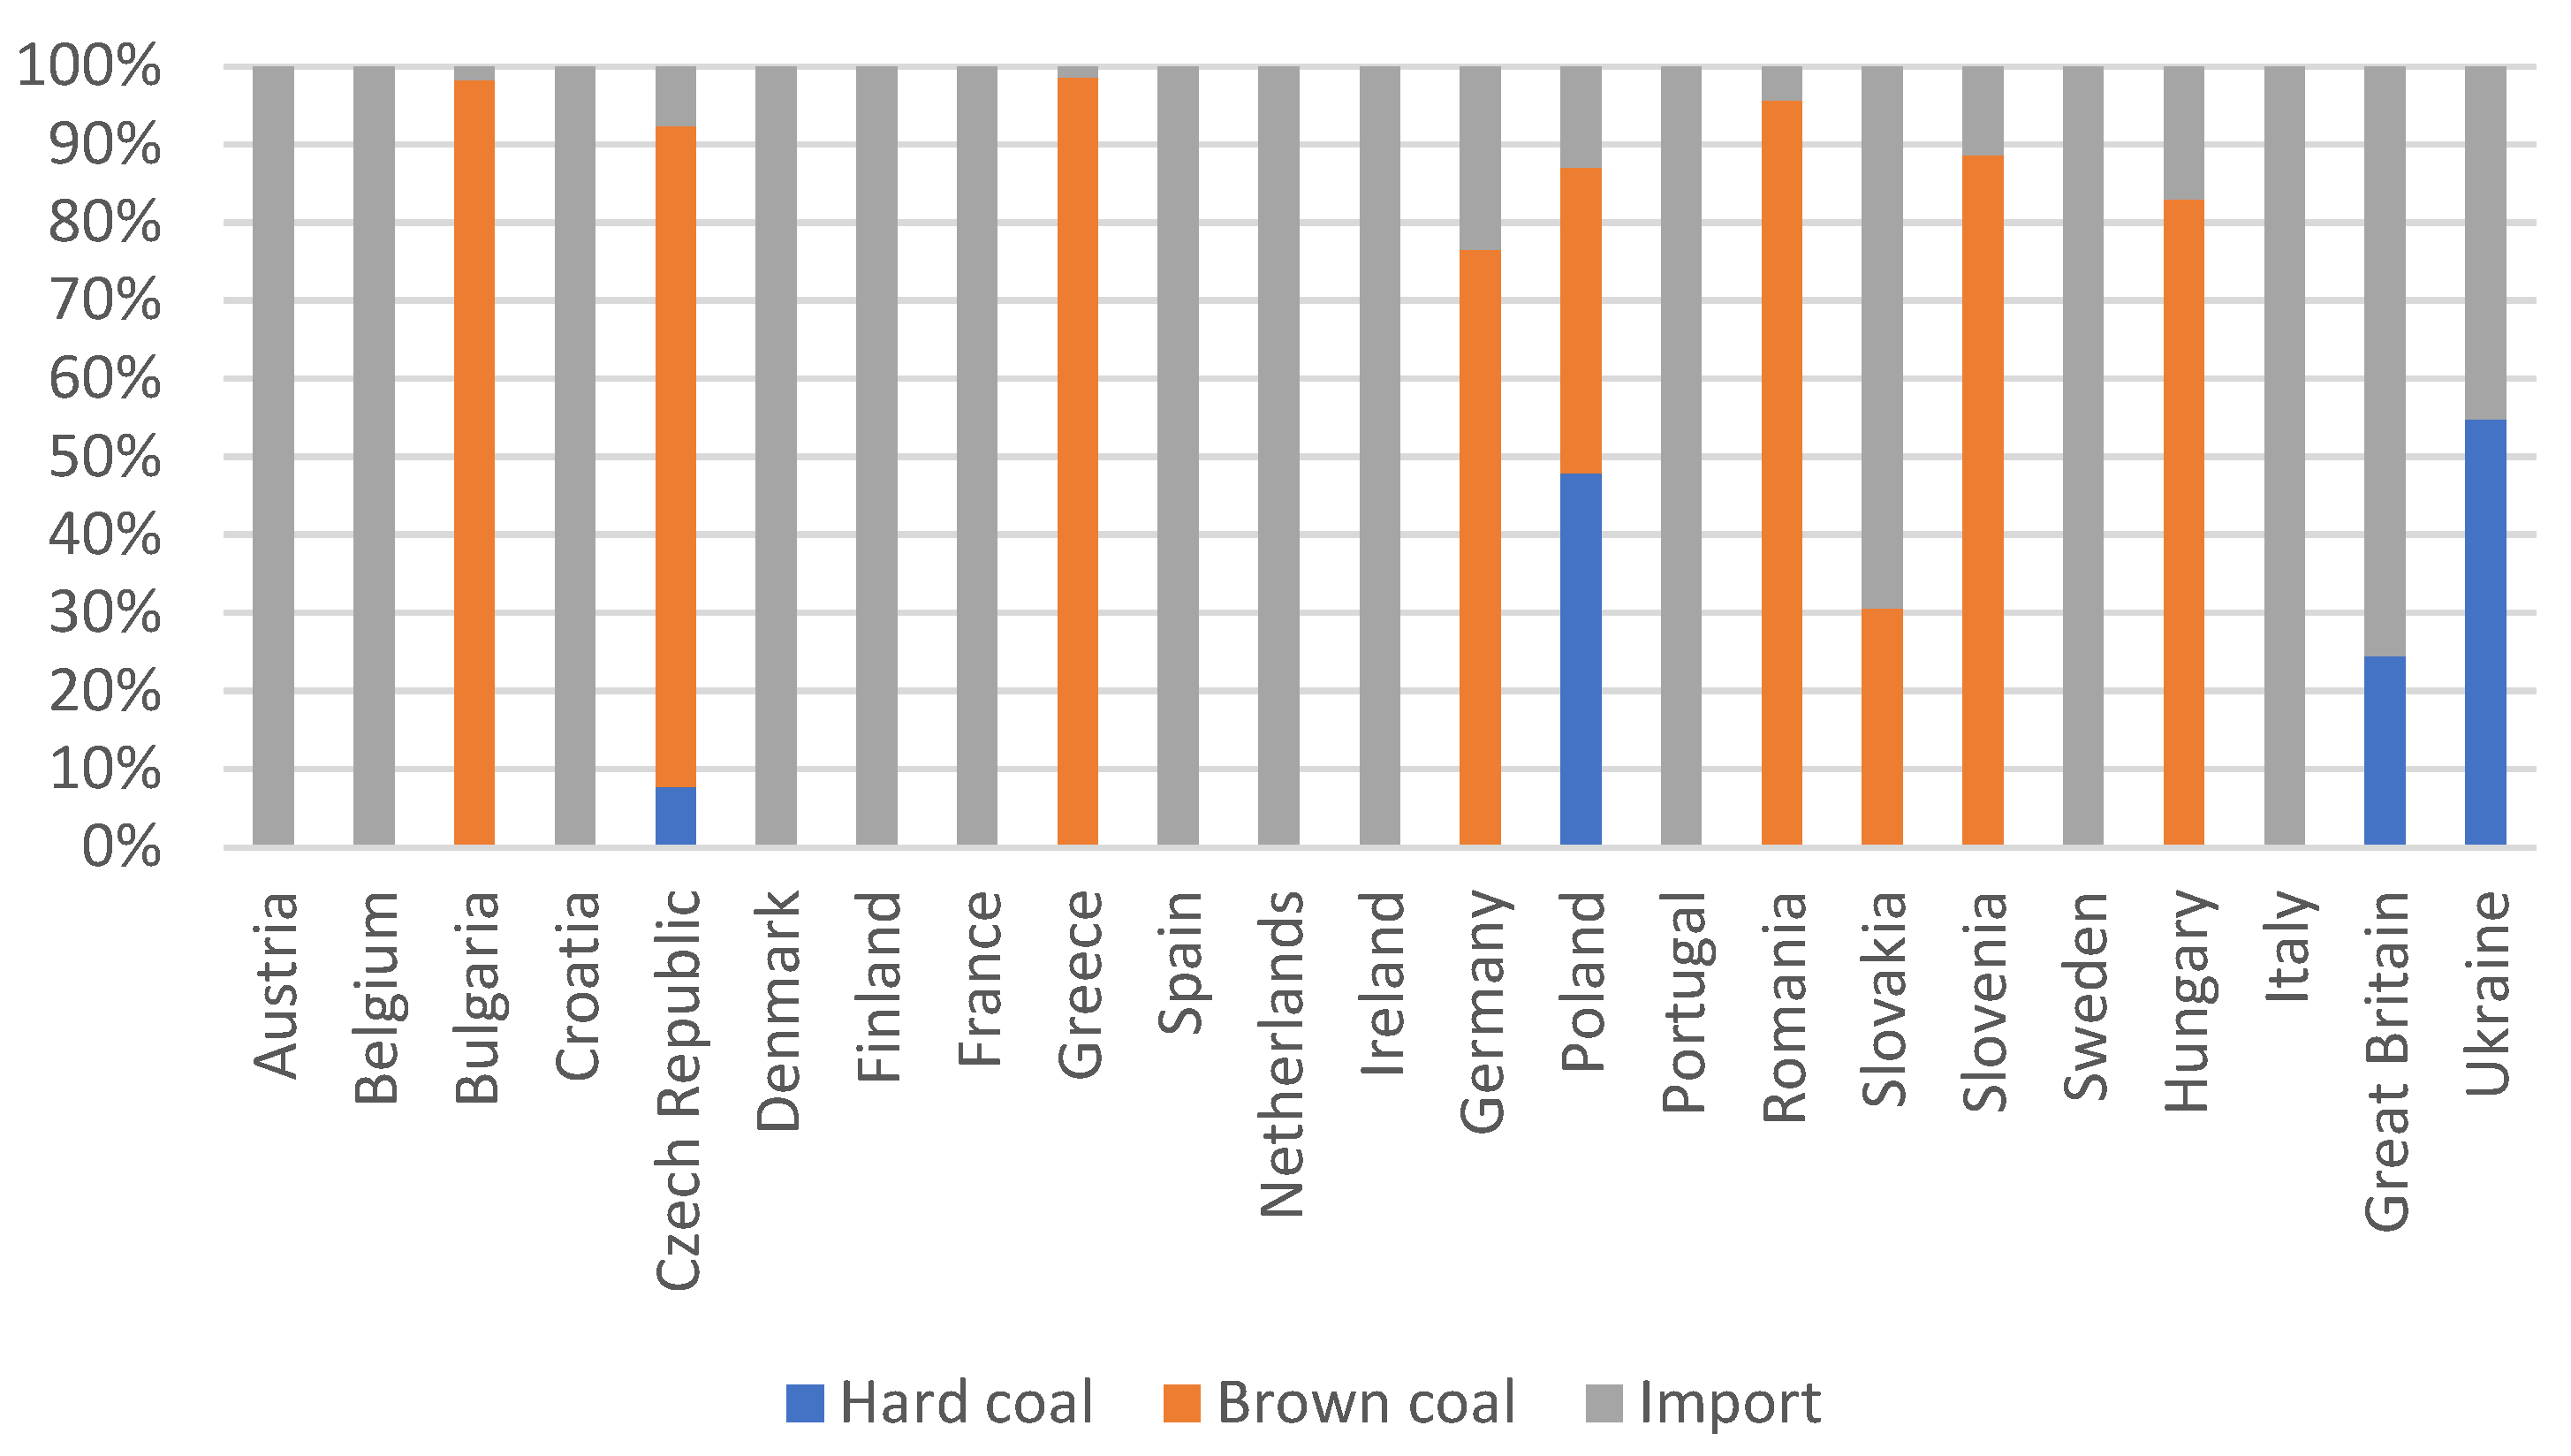
The share of coal alone in the energy balance is 78%, and most of it is mined domestically, whereas, in other EU countries, imports dominate, as shown in
Figure 4. Since the beginning of the nineties of the last century, the Polish mining industry has been undergoing a transformation process. Hard coal production fell from 177.4 in 1989 to 63.4 million Mg in 2018. Despite a significant reduction in mining capacity, Poland is by far the largest producer of hard coal in Europe over the course of almost three decades.
All strategic EU documents require a gradual reduction in the share of coal in energy production and the development of renewable energy sources. Further important aspects are the protection of the climate and the environment and a significant reduction in dust and gas emissions. Therefore, it can be assumed that, in the longer term, the regulatory conditions for coal will become more and more unfavorable. So far, nuclear technology has not been used in energy production in Poland. The objectives of the Polish nuclear power program define the necessary actions that the state must take to implement it. The following legal steps have now been taken:
- -
Resolution No. 4/2009 of the Council of Ministers of 13 January 2009 on activities in the field of nuclear power development [
16];
- -
Resolution No. 1 of the Extraordinary General Shareholders Meeting of PGE of 18 February 2009 on the appointment of the company as an entity obliged to cooperate in the preparation of the Polish nuclear power program and to play a leading role in its implementation [
17];
- -
Regulation of the Council of Ministers of 12 May 2009 on the appointment of the Government Plenipotentiary for Polish Nuclear Energy [
18];
- -
Adoption by the Council of Ministers on 11 August 2009 of the framework schedule of activities for nuclear energy [
19].
The Ministry of Economy established the following stages of the development of Polish nuclear energy: the development of a nuclear power development program and its formal adoption by the government; development of the necessary infrastructure, including the development of legal regulations for the implementation and operation of nuclear energy, institutional and organizational changes, education, information, consultations, staff training, R&D facilities and preparation for the construction of the first nuclear power plant; the investor’s share structure, selection of technology, suppliers, method of investment implementation, conclusion of contracts, obtaining financing for the construction of a nuclear power plant and planning of accompanying investments; construction of the first nuclear power plant in accordance with the established safety, quality and economy requirements, safe and efficient operation of the first nuclear power plant, decommissioning of the power plant and implementation of target solutions in the field of spent fuel [
19].
The document Energy Policy of Poland until 2040 [
20] states that: “There are several factors supporting the introduction of nuclear energy to the Polish energy balance. Nuclear blocks ensure stability of energy generation with zero air pollution emissions. At the same time, it is possible to diversify the structure of energy generation at a rational cost—high investment outlays are compensated by low variable costs of generation. The share of fuel in the cost of producing a unit of energy is relatively low, and the small dimensions allow you to maintain a long-term reserve, which also ensures cost stability. It is also important that it can be purchased from various directions, including countries with a stable political situation. In addition, the service life of nuclear power units is more than 60 years, which is 20 years longer than for coal units. The currently used technologies (generation III and III +) as well as strict world standards in the field of nuclear safety ensure the safe operation of a nuclear power plant and waste storage” [
20]. The construction of the first nuclear power plant in Poland, in addition to legal regulations, must be preceded by the selection and research on the location, design and contractor.
The commissioning of the first nuclear power plant is scheduled for 2033. Then, the first unit with a capacity of 1–1.5 GW is to be commissioned. By 2043, five more such units are planned to be commissioned. These terms result from the power balance in the national power system. Without additional investments in new energy sources, at this time, there will be further losses in covering the increase in power demand, resulting from the depletion of the existing generating units, especially coal-fired [
20]. Nuclear energy will also allow us to reduce global emissions of air pollutants such as CO
2, NO
X and SO
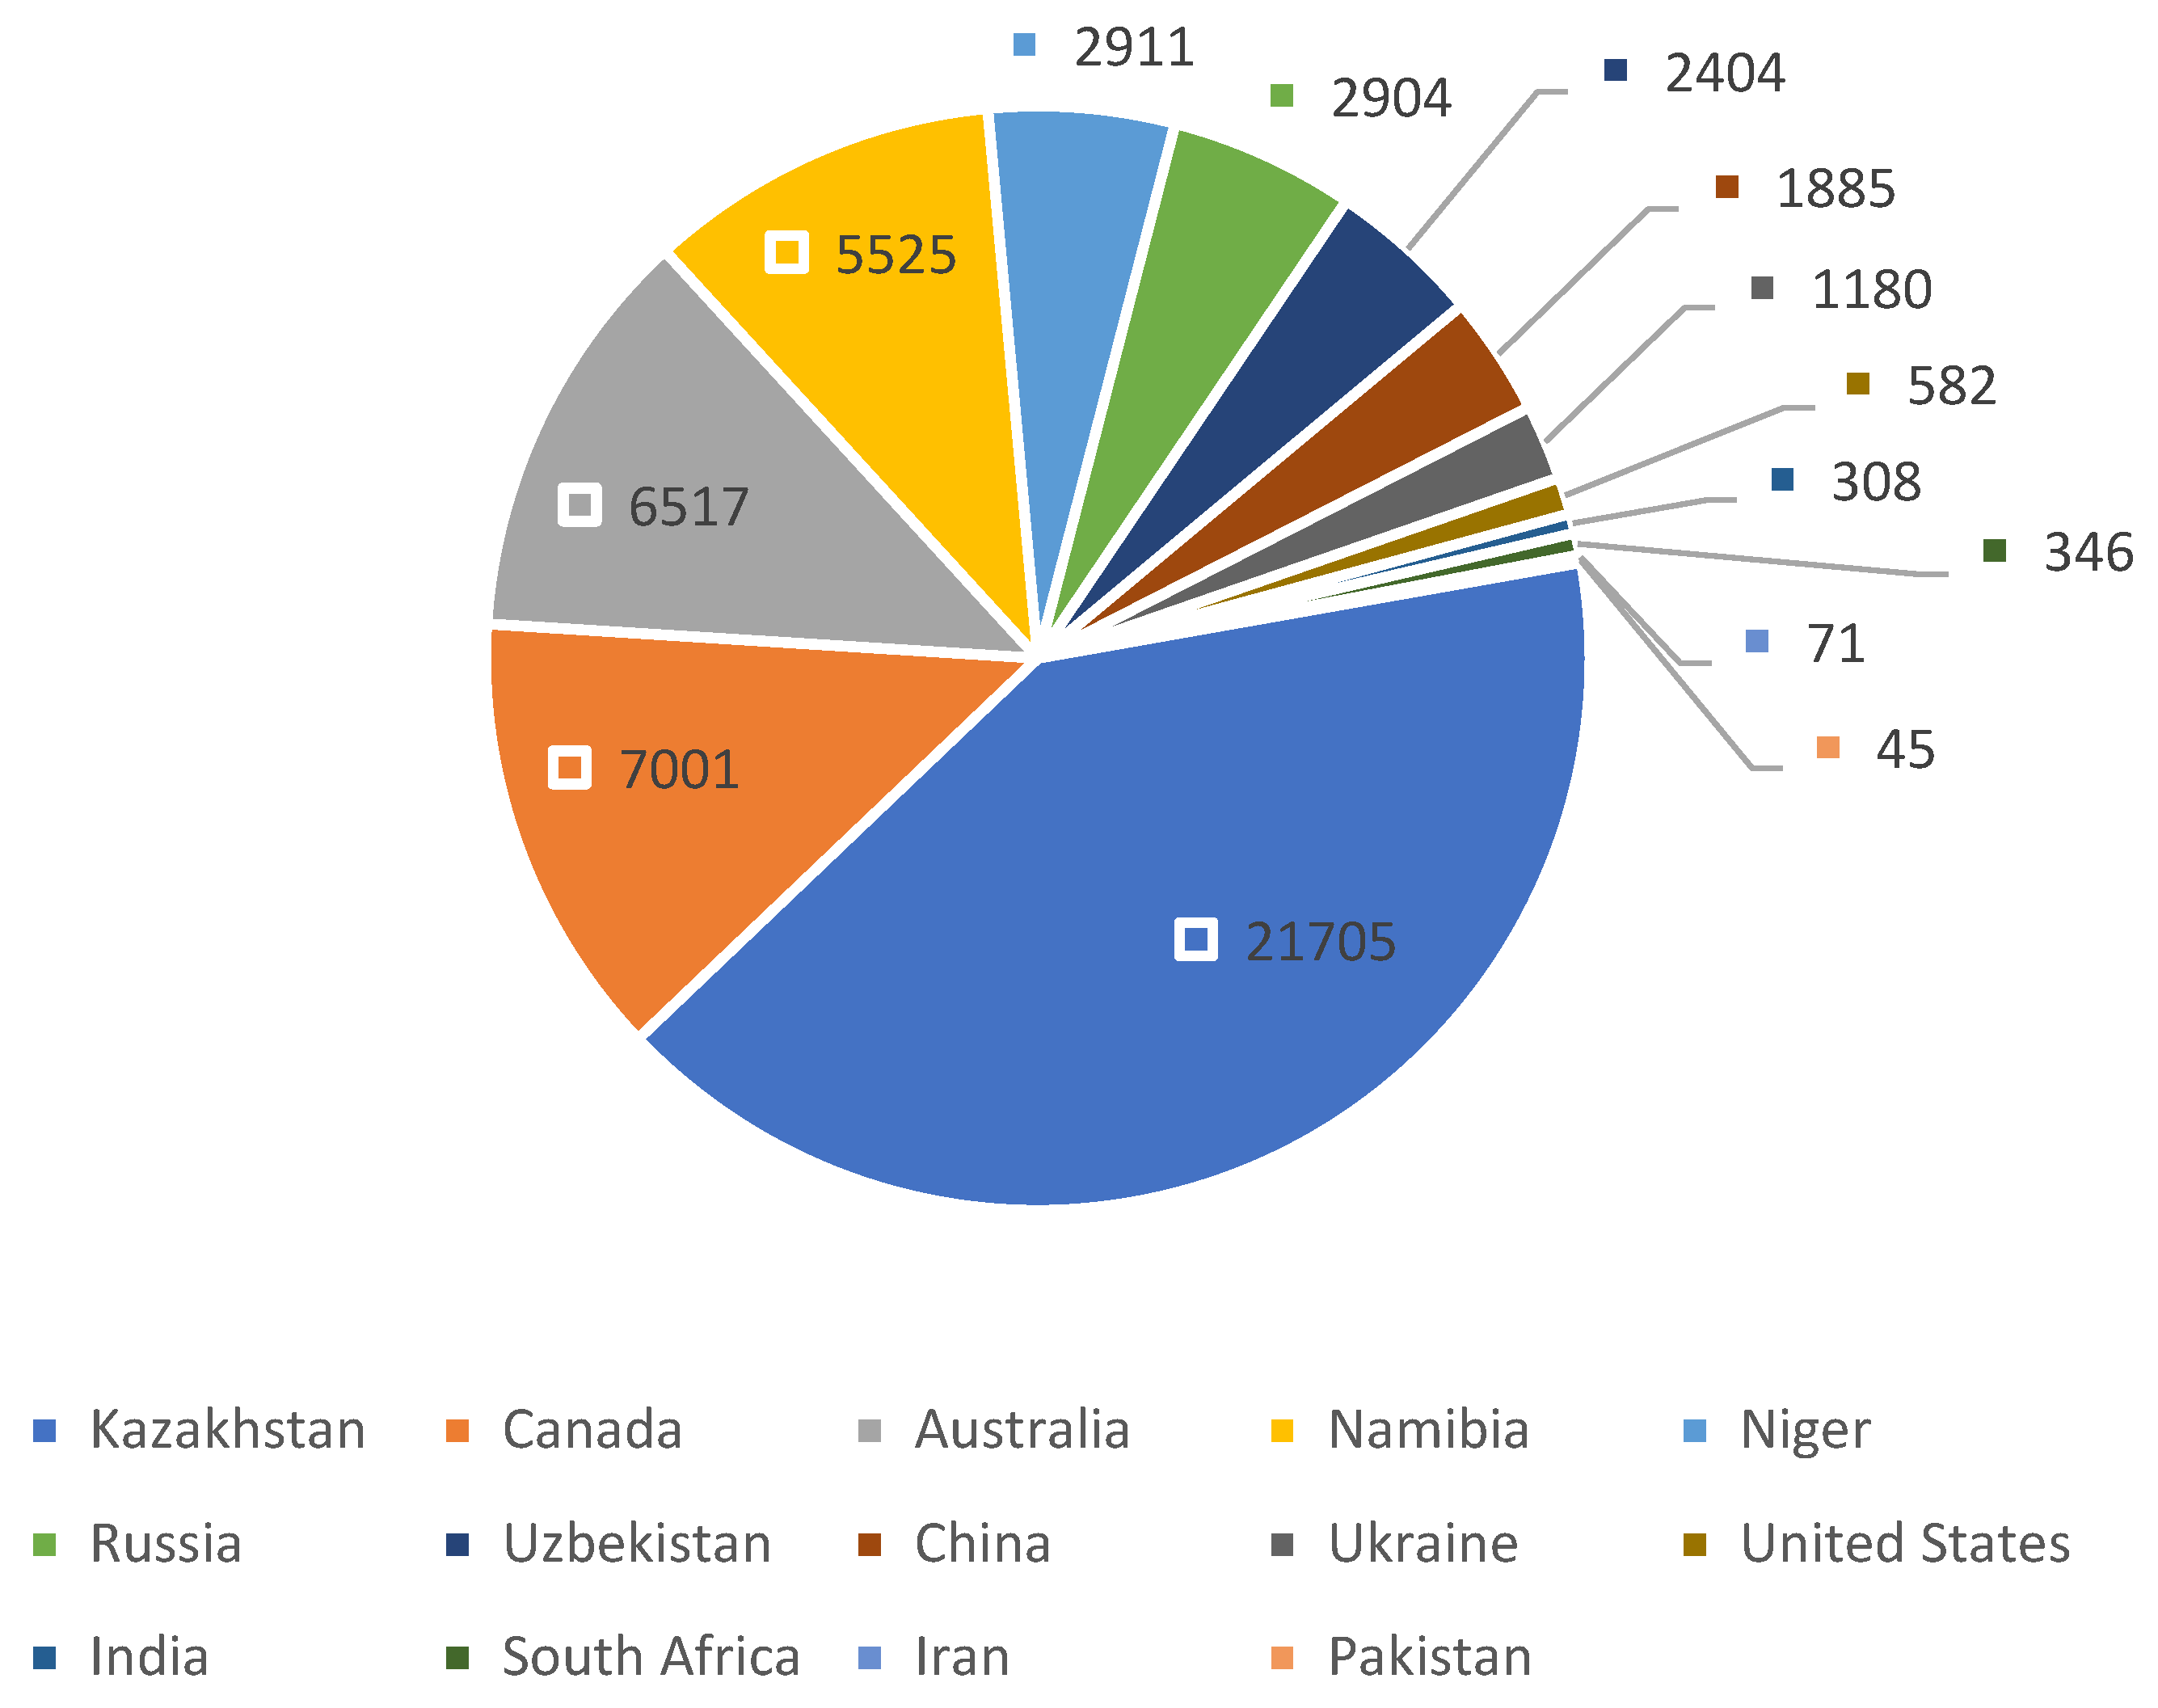
X from the energy sector. On the other hand, by deciding to have nuclear energy, Poland becomes a country that is completely dependent on the import of nuclear fuel. Uranium resources are marginal; however, there is potential for unconventional deposits (e.g., in ashes, copper mining wastes) [
21]. However, competition among nuclear fuel producers is quite fierce. The largest reserves of uranium are in Australia—28% of the world reserves, Kazakhstan—15% and Canada—14%. Other countries with significant deposits are South Africa, Namibia, Brazil, Russia and the USA [
22], as shown in
Figure 5.
Activities aimed at the development of renewable energy sources serve to reduce the emission intensity of the energy sector and diversify the energy generation structure, leading to limiting the intensity of fossil fuel use and reducing the state’s dependence on fuel imports [
23,
24,
25,
26,
27,
28,
29,
30,
31]. Despite the fact that the development of most RES technologies still requires support and currently affects the increase in the costs of the energy system, the use of renewable energy sources will reduce wholesale energy prices, as well as reduce the costs associated with pollutant emissions, both in terms of fees and charges, burdening the unit of energy produced, as well as environmental and health costs [
32,
33,
34,
35,
36,
37,
38,
39,
40]. In the long term, this will increase the competitiveness of the economy. The EU-wide target for 2020 is 20% and, for 2030, it is 32%. As part of EU obligations, in 2020, Poland should achieve a share of energy from renewable sources in gross final energy consumption at the level of 15%. It is assumed that the auctions for the purchase of electricity from RES in 2016–2020 and the support for distributed energy under the current mechanisms and programs will allow for the achievement of the above-mentioned national target and the further development of renewable energy sources (e.g., as a result of the RES auction for 2021). Taking into account the domestic potential of renewable resources, the competitiveness of renewable energy technologies and the technical possibilities of their operation in the NPS, as well as the challenges related to the development of renewable energy sources in transport and heating, Poland has declared that it will achieve a 23% share of renewable energy sources in gross final energy consumption in 2030 (measured as total consumption in electricity, heating and cooling, as well as for transport purposes) as part of the implementation of the EU-wide target for 2030. In the 2040 perspective, the share of renewable energy sources is estimated to be at least 28.5%.
3. Materials and Methods
The fundamental parameter that allows us to determine the amount of electricity that can be generated by a PV farm during the year is the specific photovoltaic power output (PV
OUT). It represents the amount of power generated per unit of the installed PV capacity over the long-term, and it is measured in kilowatthours per installed kilowatt-peak of the PV system capacity (kWh/kWp) [
41]. PV
OUT varies significantly from region to region of the world. It does not only depend on the latitude. It is influenced by climatic factors, such as the average number of sunny days in a year. An excellent example of a strong variation in PV
OUT for the same latitude is South America—the typical PV
OUT for the Antofagasta Region in Chile (latitude 22°~25° S) is approximately 2200 kWh/kWp and, for Sao Paulo in Brazil (latitude ~23°30′ S), it is approximately 1460 kWh/kWp [
42]. The differentiation in PV
OUT for the same latitude is observed all over the world. In Europe, there are significant differences in PV
OUT for the same latitude between Scotland and Latvia [
42]—this is due to the more cloudy weather in Scotland. In Poland, the value of PV
OUT is almost the same and ranges from 1030 kWh/kWp to 1140 kWh/kWp. There are many other factors that affect the performance of PV cells. An unfavorable and well-known effect is a decrease in PV efficiency at a high operating temperature—an increase in the p-n junction temperature causes a decrease in the threshold voltage in its current-voltage characteristics. The above effect may be important, as summer in central Europe has become hotter over the past decade. It should be noted that there are a lot of technologies that are available in energy markets to increase the efficiency of a PV panel, for instance [
43,
44,
45,
46]. These technologies are mainly based on cooling PV panels through the use of heat sinks or water cooling. Such solutions are used more and more often, but, unfortunately, they are not common yet. Cooling with water, which can be used in households, is especially interesting. However, this is not practiced when it comes to solar farms. Statistically, July is the hottest month in Poland, but the strongest monthly average of solar irradiance occurs in April and May [
47]. The interaction of various factors and their impact on the efficiency of solar farms requires further research. The structure of the proposed huge farm (or a few large farms) capable of supplying electricity to Poland is presented in
Figure 6.
Unfortunately, there are not many favorable locations in Poland for the construction of pumped storage hydropower (PSH) plants. There is no mountain range on the Baltic Sea in Poland. The mountainous areas in Poland are located approx. 500–600 km from the sea coast and there are no large rivers in these mountains that would allow for the construction of a sufficient number of PSH plants. Therefore, even if the number of PSH plants in Poland is increased several times, these plants could, at most, partially balance the daily electricity system in the idea in
Figure 4. Currently, the typical electricity power consumption in Poland (a typical day in June 2022) in the middle of the day is around 22 GW, and around 14 GW in the middle of the night. Most of the electricity generated comes from coal-fired power plants (~16 GW) [
48]. The rest of the power is generated in renewable energy sources and in pumped storage hydropower plants (when the demand for electricity is the highest). The total installed power capacity in Poland is around 50 GW (2022). Statistically, in the few years before the COVID-19 pandemic (in Europe, the pandemic began at the beginning of 2020), the highest electricity consumption in Poland was in December and January (~15 TWh), and the lowest was in April and May (~12.5 TWh). Unfortunately, the highest electricity consumption occurs in winter, when the energy generated in solar farms is by far the lowest. This is a significant problem. If all of the electricity energy is generated in PV farms, then it is necessary to build large energy storage—it depends on the annual energy consumption. For example, regarding countries in central Europe, the electricity consumption in 2019 was 165.7 TWh in Poland, 548.9 TWh in Germany, 69.6 TWh in Czech Republic and 28.4 TWh in Slovak Republic [
49]. These countries have a similar value regarding the specific photovoltaic power output. The proposed large solar farm will, in practice, take the form of many solar farms located mainly in post-industrial areas.
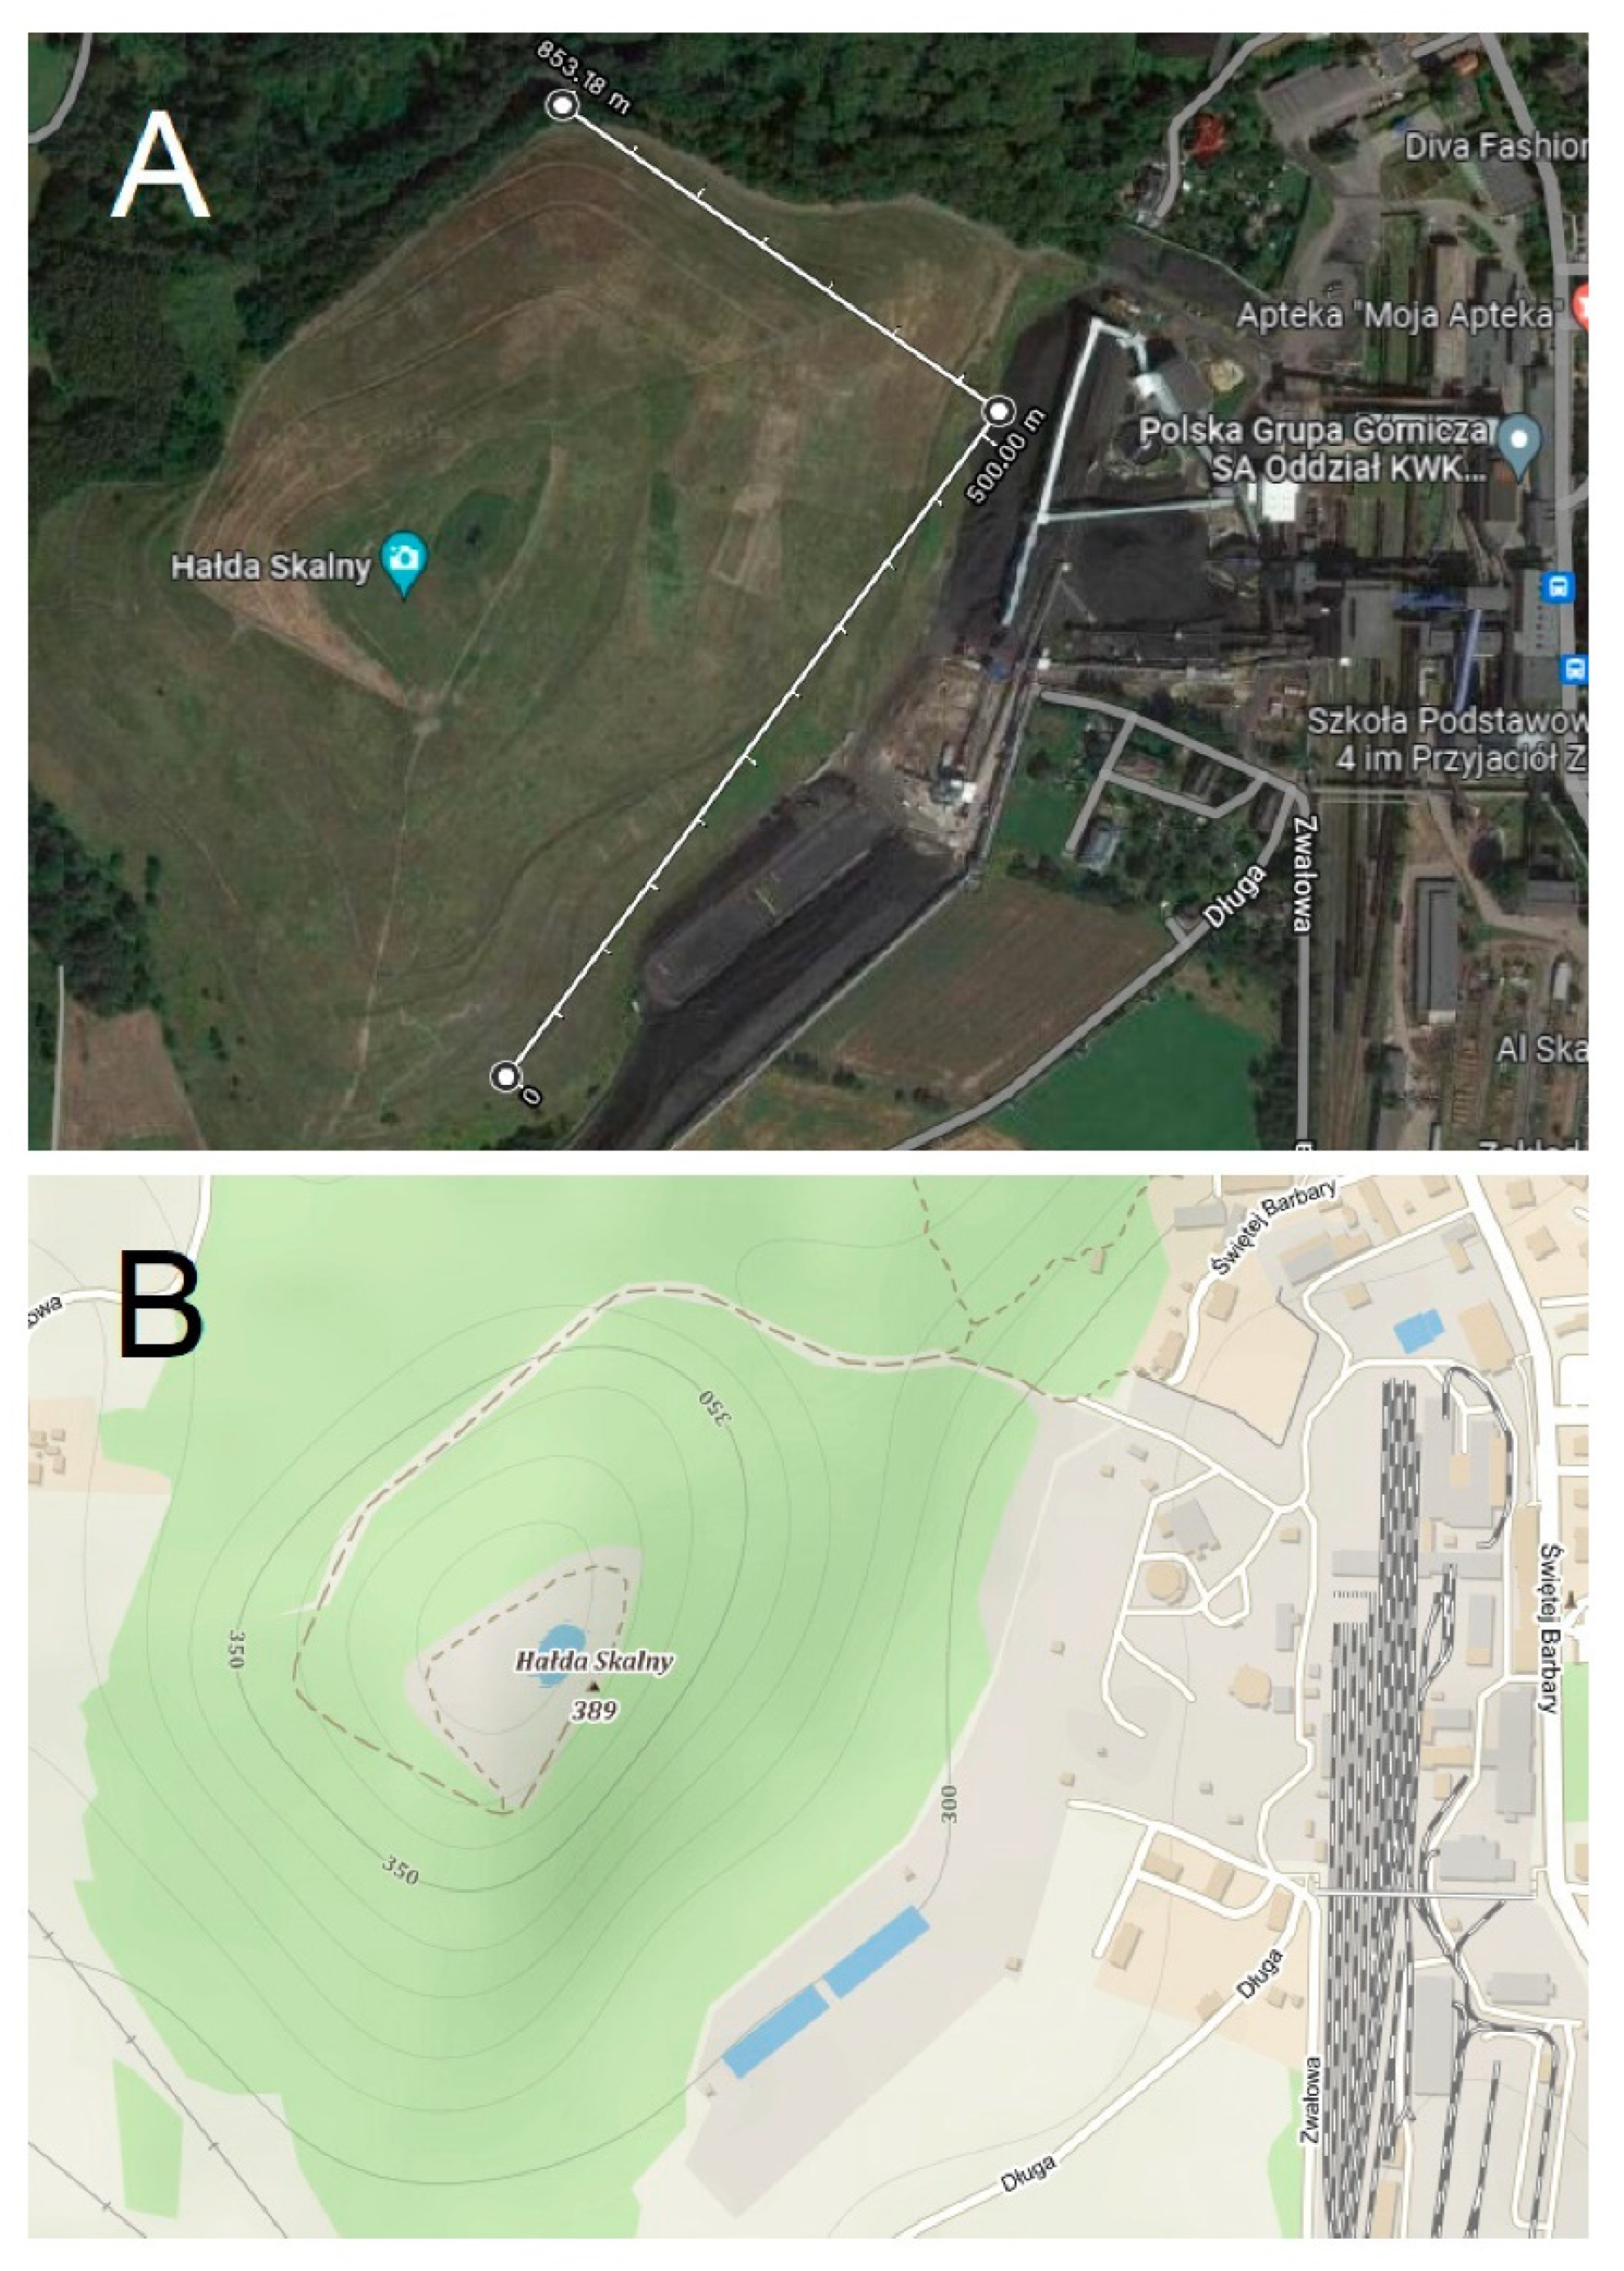
Figure 7 shows a map of one of the many coal waste heaps in Silesia, Poland. That heap is call “Hałda Skalny” and is located in Łaziska Górne (suburbs of the Katowice Metropolitan Area). There is a coal mine next to the heap in
Figure 7. This mine will get closed in a few years. It is an example of a convenient location for the construction of a solar farm. There are hundreds of similar coal waste heaps in Silesia. The average tangent of the slope of that heap is approximately ~0.27–0.30 (based on the topographic map given below). It gives an average angle of ~16 degrees. It should be noted that the optimal angle of the inclination of PV panels in relation to the horizon in Poland is 35 degrees.
Obviously, the surface area of the coal waste heaps is insufficient for building the required number of solar farms, but, in addition, there is a possibility of developing the areas left after closing the mines. Moreover, the construction of solar farms in such areas is an excellent method of recovering post-industrial spaces. Thanks to this, the solar farms will not significantly interfere with the natural environment. In the case of placing the PV panels on the heap, there are no problems with shadowing from surrounding objects. As a result of many years of experience, some general recommendations have been developed on how to design and where to locate solar farms. Designing solar farms for synergistic commercial and conservation outcomes is discussed in more detail in the work [
50]. The current structure of photovoltaic systems in Poland is discussed in [
51]. However, it should be noted that the existing solutions have not taken into account the use of coal waste heaps at a large scale for the installation of PV panels on them.
4. Results and Discussion
Electricity consumption has stabilized at an approximately constant level in the years leading up to the pandemic in central Europe [
49]. The estimated calculations of the power and area of a hypothetical solar farm providing electricity to Poland are presented below.
Taking the annual electricity consumption 170 TWh (slightly higher than the consumption in 2019), the average power of the generated electricity is given by Equation (1):
where:
Pav—average power consumption in Watts (W);
Econsum—annual electricity consumption in Watt-hours (Wh).
The average power consumption for Poland is equal to:
The above average power consumption of 19.4 GW requires a correspondingly higher generated power. The installed power in Poland is approx. 50 GW and it is enough when the electrical system is supplied by coal-fired power plants. The installed power-to-average-power-consumption ratio is given by Equation (3):
The installed power must be significantly higher than the average daily power consumption. The value of k1 in the Equation (3) parameter is sufficient to ensure the correct operation of the electrical system. It is necessary because not all blocks of power plants are working—some of them may be serviced or are kept in reserve. The vast majority of the power consumed in Poland is generated on an ongoing basis in coal-fired power plants. In the case of power from solar farms, it is different—most of the consumed energy is firstly stored. Solar farms provide direct power to the electrical system for only a few hours a day. Therefore, the installed power of solar farms cannot be only 2.6 times higher than the power consumption—it must be much higher. Taking the most unfavorable variant when all generated electrical energy at some stage is stored before consumption, it is possible to determine the generated power—according to Equation (4):
where:
In the following considerations, it is assumed arbitrarily that the efficiency of energy accumulation is approx. 60%. This is a realistic, approximate value of the energy efficiency of a modern energy storage based on lithium-ion batteries and inverters. Moreover, the η coefficient includes the losses in the elements of the power supply system (step-up transformers, etc.). The structure of a typical power grid containing PV farms and its integration into electricity grids is extensively discussed in article [
52]. If electrical system would be supplied only from solar farms, then the value of the generated energy needed for Poland in one year is calculated in Equation (5) using Equation (4):
The average value of the specific photovoltaic power output is approx. 1085 kWh/kWp but, taking into account air pollution, the true value of PVOUT is around 1000 kWh/kWp. This level is commonly used in calculations by companies building solar farms in Poland. The peak power generated in solar farms is calculated in Equations (6) and (7):
where:
The obtained peak power of 283.3 GW seems to be very high. However, it should be noted that a solar farm only generates significant amounts of electricity for only a few hours a day. During the day, the PV farms will not only supply the electric grid, but will also charge the energy storage. Moreover, in fact, the installed power in solar farms should be much higher than the power obtained in Equation (7)—this is ensured by the reliability of the electrical system in Poland. Solar farms also require servicing, etc. The proposed method of determining the installed power capacity is shown in Equation (8):
where:
The parameter k
2, despite the similarity to k
1, differs significantly. Since, in the case of electricity generation from photovoltaics, there are large energy stores, the value of the k
2 parameter does not have to be as high as k
1, where the power generated was consumed on an ongoing basis. Experimental studies with a big household PV installation have shown that a sufficient value of k
2 is around 1.2.
The installed capacity for a hypothetical PV farm supplying the entire territory of Poland is 6.8 times higher than the installed capacity in the currently existing energetical system (dominated by coal-fired power plants). That power of 340 GW will require a large area on which it will be built. Assuming an unfavorable level of energy efficiency of PV panels with inverters at the level of 15%, the surface area of these panels should be estimated at 6.7 m
2/kWp—approximately 6.7 m
2 of solar panels are needed to produce 1 kW of electricity power at a solar irradiance of 1000 W/m
2 (when the sun’s rays fall perpendicular to the surface of the panel). The total surface area of solar panels in a hypothetical solar farm is given by Equation (10):
where:
The surface area of solar panels in the hypothetical solar farm supplying the entire country should amount to 2584 km
2 for Poland. This area can be imagined as a square with dimensions of 50.83 km × 50.83 km. It should be added that Poland has dimensions of approx. 600 km × 600 km and a surface area of 312 710 km
2 [
53]. Of course, the area of the hypothetical solar farm (several large farms) supplying the entire country will be larger than the total area of the solar panels (SPV)—the optimal angle of inclination of PV panels in relation to the horizon in Poland is 35 degrees.
In order to ensure an uninterrupted power supply to electricity consumers throughout the year, it is necessary to build a large energy storage. It should be noted that there are many closed mines in Silesia (Poland) and Ruhrgebiet (Germany). Any coal mine includes tunnels with a total average length of 100 to 300 km (in one mine) and underground mining excavation. They are a very important advantage of the underground in closed mines. The estimated volume of a typical coal mine underground is in the order of 107 m3. As a result, for example, 20 closed coal mines (there are many more in Silesia) give an underground volume of more than 0.2 km3, and even 0.6 km3. This is a very large volume, and the closed mines are very effective locations for large energy stores. One more valuable feature of the underground mine should be brought out: very slight changes in temperature throughout every nychthemeron (24 h) and throughout the year. For example, the temperature in the coal mine at a depth of 320 m typically covers the range from 15 °C to 20 °C. Of course, as the depth increases, this temperature slowly rises. These are excellent and stable conditions for any type of batteries. It is also possible to build underground hydrogen stores in the closed mines. Thanks to the use of underground energy storage, there is no need to interfere with the natural environment.
The structure so far is based on the scattered home PV plants, which give off the surplus (more than the households need right now) of the produced electricity to the power grid. Today, household PV is still the most popular method of electricity generation from solar energy in Poland. In this case, the power grid transmits electrical energy in both directions—this is a common solution and well described in the work [
52]. However, the method of electricity generation from solar energy is slowly changing—the first solar farms are built in post-mining areas; for example, in the Jaworzno (Silesia, Poland) PV plant built by the Tauron (Polish energy holding) in the place of the closed coal mine. This is a small 5 MWp solar farm, but plans have been provided for the construction of a farm that is 10 times larger.
Other advantages of post-industrial areas as candidates for the construction of solar farms are the high-voltage power grid and the fact that transformer stations exist there. There are still unused high-voltage electrical lines left after the closed mines. These lines are integrated with the electrical power system. The proposed large solar farms in post-industrial areas will not require a revolution in the power system. An average-sized coal mine consumes tens of megawatts of power, and some even consume over 100 MW. The post-mining areas include buildings, shafts, heaps, large railway sidings and settlement ponds. The development of the area of a closed, average-sized mine in Central Europe makes it possible to build a solar farm with a capacity of tens of megawatts—the value of the generated power is similar to the power consumption of the mine. Moreover, in the proposed solution, energy storage will be located in the underground of the closed mines. These energy storage facilities will not only accumulate energy generated on the surface of the mine, but also energy from other solar farms in other post-industrial areas (mines are only part of the degraded post-industrial areas). Therefore, the input or output power of the energy storage will be able to be higher than the power of the solar farm on the surface of this mine. This makes it possible to use the existing transformer station and high-voltage power line up to 100 MW (of course, it will require a modification of the existing post-mining transformer station). Moreover, the implementation of the described system in Poland or another similar country will require at least 20 years. The central electricity management system in the country will also be rebuilt. It is evident that, if a large solar farm were to be built in degraded post-industrial areas, there is an uncomplicated way to connect it to the electricity system.
5. Conclusions
Renewable energy sources are rapidly gaining popularity in Central European countries. PV panels are increasingly found on the roofs of buildings. New solar farms and wind power plants are being built in Poland. The dominant source of electricity in Poland is fossil fuel power plants, but most of them will be decommissioned in the near future. Now, the construction of one or more nuclear power plants is being considered in Poland. The presented paper poses the question: what should the area of a hypothetical large solar farm be to supply a country the size of Poland? The presented calculations showed that, in order to supply Poland with electricity from only a big solar farm, the area of PV panels in that farm would have to be 2584 km
2 (this area corresponds to a square of 50.83 km × 50.83 km). Some of the area of that “farm” already exists in the form of PV panels on the roofs of houses and office buildings. However, it should be noted that the efficiency of a solar farm is higher than that of a typical home PV installation—the PV panels in the solar farm are always positioned at the optimal angle and direction. In the case of Poland, Silesia is a particularly attractive region for building large solar farms. As mentioned in the introduction, there are many post-industrial areas in Silesia. According to the data provided by the Senate of the Republic of Poland, the total post-industrial degraded area (brownfield sites) in Poland is around 8000 km
2 [
49]—that is three times as much as the area of a hypothetical solar farm. There is no shortage of space that can be developed for the installation of PV panels in Poland. Obviously, the area of each solar farm is larger than the total area of the panels used. Based on the data provided by the International Energy Agency [
49] and Equations (4)–(12), the total surface areas of PV panels in hypothetical solar farms for some other Central European countries are shown in
Table 1.
Taking into account the angle of incidence of sun rays during different months of the year in Central Europe, it is assumed that the surface area of the solar farm should be approx. 2.5 times larger than the surface area of the PV panels used. Of course, this value depends on many factors, including the number of rows of PV panels in the farm and the size of the panels. Moreover, not every part of the brownfield site is suitable for building a solar farm—the north side of the coal waste heap, for example. In the case of the southern slope of the heap, it will be possible to reduce the distance between the rows of PV panels. In conclusion, the surface area of the large solar farm should be around 6460 km2 for Poland. The obtained value is still lower than all degraded post-industrial areas in Poland—8000 km2. Despite this, some farms would have to be built on low-quality farmland or unused land.
The presented considerations do not take into account other renewable energy sources, e.g., wind farms. Wind energy can make a significant contribution to Poland’s energy mix. Favorable conditions for the construction of wind farms in Poland are mainly found on the coast of the Baltic Sea. The transition of the electrical system to the supply from solar farms (and other renewable energy sources) in medium-sized countries is technically feasible but very expensive. The abandonment of coal, gas and nuclear power plants requires the construction and maintenance of very large energy stores. The use of different types of energy storage, including hydrogen storage, should be considered. The hydrogen storage can be situated in the underground of closed mines. A very important type of storage is acid and lithium-ion batteries. The most important problem in the battery storage systems is their short lifespan and high price—much depends on the method of operation and the depth of the discharge of the cells [
54]. It should be noted that, in the model based solely on renewable energy sources, energy storage will not only be used for balancing the daily energy consumption but for seasonal balancing—in winter, a small amount of electricity is generated in the solar farms. This is why hydrogen storage should be considered.
On the other hand, the solar farm does not produce spent nuclear fuel—this is a very important advantage. The cost of building energy storage is discussed at length in [
55]. Unfortunately, it is currently impossible to estimate the costs of building a hypothetical solar farm and energy storage to power Poland and other European countries. Due to the complicated geopolitical situation in Europe, the prices of key materials for the construction of a farm and an energy storage have risen from several to several hundred percent over the last four months. At this point, it is impossible to predict at what level the construction costs of the proposed solar farm and energy storage will stabilize in a few years. However, there are many indications that these costs will be slightly lower than the costs of building and operating a nuclear power plant.


