1. Introduction
Global warming is being exacerbated by an ever-increasing reliance on fossil fuels as the population grows and consumption rises. Since 2016, 176 countries have established goals for a particular percentage of their energy needs to be met by so-called ‘green’ energy sources, including renewables. Environmental protection and reducing carbon emissions are two of the most important aspects of green energy’s role in sustaining economic growth. For every economy to achieve its long-term growth targets, its energy sector is crucial [
1]. To counteract climate change’s escalating dangers, the energy sector’s strategic interventions must take center stage on the legislative agenda. This has given energy a new lease on life.
Renewable energy sources have captured the world’s greatest attention. There is a potential contradiction between maintaining terrestrial biodiversity and ecological services and adopting renewable energy sources because of their lower carbon emissions. In terms of cost, greenhouse gas emissions, energy efficiency, land and water needs, and social implications, wind power came out on top, followed by hydropower, the most environmentally friendly renewable energy source. A detailed evaluation of the various green energy sources has not yet occurred [
2].
Low energy efficiency is another critical issue that economies are still dealing. An increase in energy efficiency is reflected in lower energy consumption, higher economic growth, and lower emissions of the greenhouse gas carbon dioxide. Enhancement of energy efficiency results in an increase in the distribution of energy in nations that are in a limited supply of the commodity [
3]. In China, green money has a favorable effect on energy efficiency. Understanding the link between green financing, carbon emissions, renewable energy use, and energy efficiency is critical and might give helpful information to governments [
4]. A nation’s economic growth and sustainability can be bolstered by investments in green finance [
5]. The financial system can swiftly adapt and establish tools to guide capital flows toward sustainable development [
5].
Energy efficiency programs can energize growth-inducing economic programs by creating new employment opportunities, assisting the pre-existing labor force, expanding economic activities in a labor-intensive strategic sector, and providing long-term benefits in the form of increased competitiveness of a country and lower utility bills [
6]. This enables energy efficiency to increase self-maintaining competitiveness, which assists businesses in reducing unnecessary energy use and maximizing energy savings. There are several sustainable development goals (SDGs) connected to the world’s sustainability by 2030 that may be met through green finance, green energy, and energy efficiency connections [
7].
Assessing the link or cause-and-effect relationship between green financing, energy efficiency, green energy, and carbon dioxide (CO
2) emissions is vital and might offer governments significant information. It is argued that in the short term, there would be no link between green financing, energy efficiency, green energy consumption under adverse policy implications, and exogenous shocks. Therefore, it will be beneficial and instructive for the policymakers to conduct the study of causal relationships. Nonetheless, several nations significantly promote the growth of the green finance market. The countries that are at the top for promoting green finance are Canada, Denmark, Hong Kong, Japan, New Zealand, Norway, Sweden, Switzerland, the United Kingdom, and the United States. [
8]. Their whole usage of renewable energy contributed around 22 percent to the total energy basket between 2000 and 2019. In 2000 and 2019, the level of CO
2 emissions in these nations was around 824,200 kt and 734,467 kt, respectively [
2].
2. Green Energy in the ASEAN Region
The countries of Indonesia, Malaysia, the Philippines, Singapore, Thailand, and Vietnam comprise the Association of Southeast Asian Nations (ASEAN). Commercial manufacturing of biofuels from palm oil just began in 2003 in this region. The political and economic climate had improved to the point where the biofuels industry could proliferate by this point. As most of the region’s biodiesel and ethanol is now produced in only five nations, the ASEAN economic bloc’s anticipated market integration would undoubtedly boost the region’s biofuel industry. Palm oil plantations’ rapid expansion in the biofuel industry has already accelerated deforestation in Southeast Asian rainforests, though. It is therefore essential to protect rainforest and animal populations in the region in order to produce biofuels sustainably [
7].
Figure 1 provides the map of the selected region.
Between 1990 and 2013, the demand for primary energy in the region rose by a factor of 2.5, and it is anticipated that demand will practically double between 2013 and 2040. However, despite these efforts, the region’s energy consumption is still primarily derived from fossil fuels [
9]. There is a good chance that this market share will rise even further in the future. Coal and natural gas (NG) are substantial resources in this area, with Indonesia and Malaysia being prominent participants in the global NG market. This time period might see a significant increase in the world’s population, increasing demand on the world’s coal-fired power plants, which are now the primary source of energy generation [
1].
Despite the dominance of fossil fuel-based energy sources, local governments and the private sector have been paying increasing attention to renewable resources. This energy source accounted for 27% of the country’s total energy matrix in 2015, making it the Philippines’ second-largest producer of geothermal electricity after the United States [
10]. Biomass fuels both the production and consumption of renewable energy in Vietnam and Laos, which accounts for a significant share of total renewable energy. In a relatively short amount of time (2006–2013), the Southeast Asian biofuel industry went from having virtually no capacity to contributing 7 percent of the world’s total production of biofuels (biodiesel and ethanol). This achieved an average annual production growth rate of 44 percent [
11]. Concerns about energy security and the growing market demand from European countries, especially for palm oil-based biodiesel, as well as local blending mandates, contributed to the rapid growth of the biofuels industry in the region. Even though favorable political, natural, and economic (accelerated economic growth rates) conditions support the Southeast Asian biofuel industry, since the development of palm oil plantations has caused deforestation and biodiversity loss, as well as long-standing subsidies for fossil fuels, these nations have been unable to meet their current blending objectives [
12].
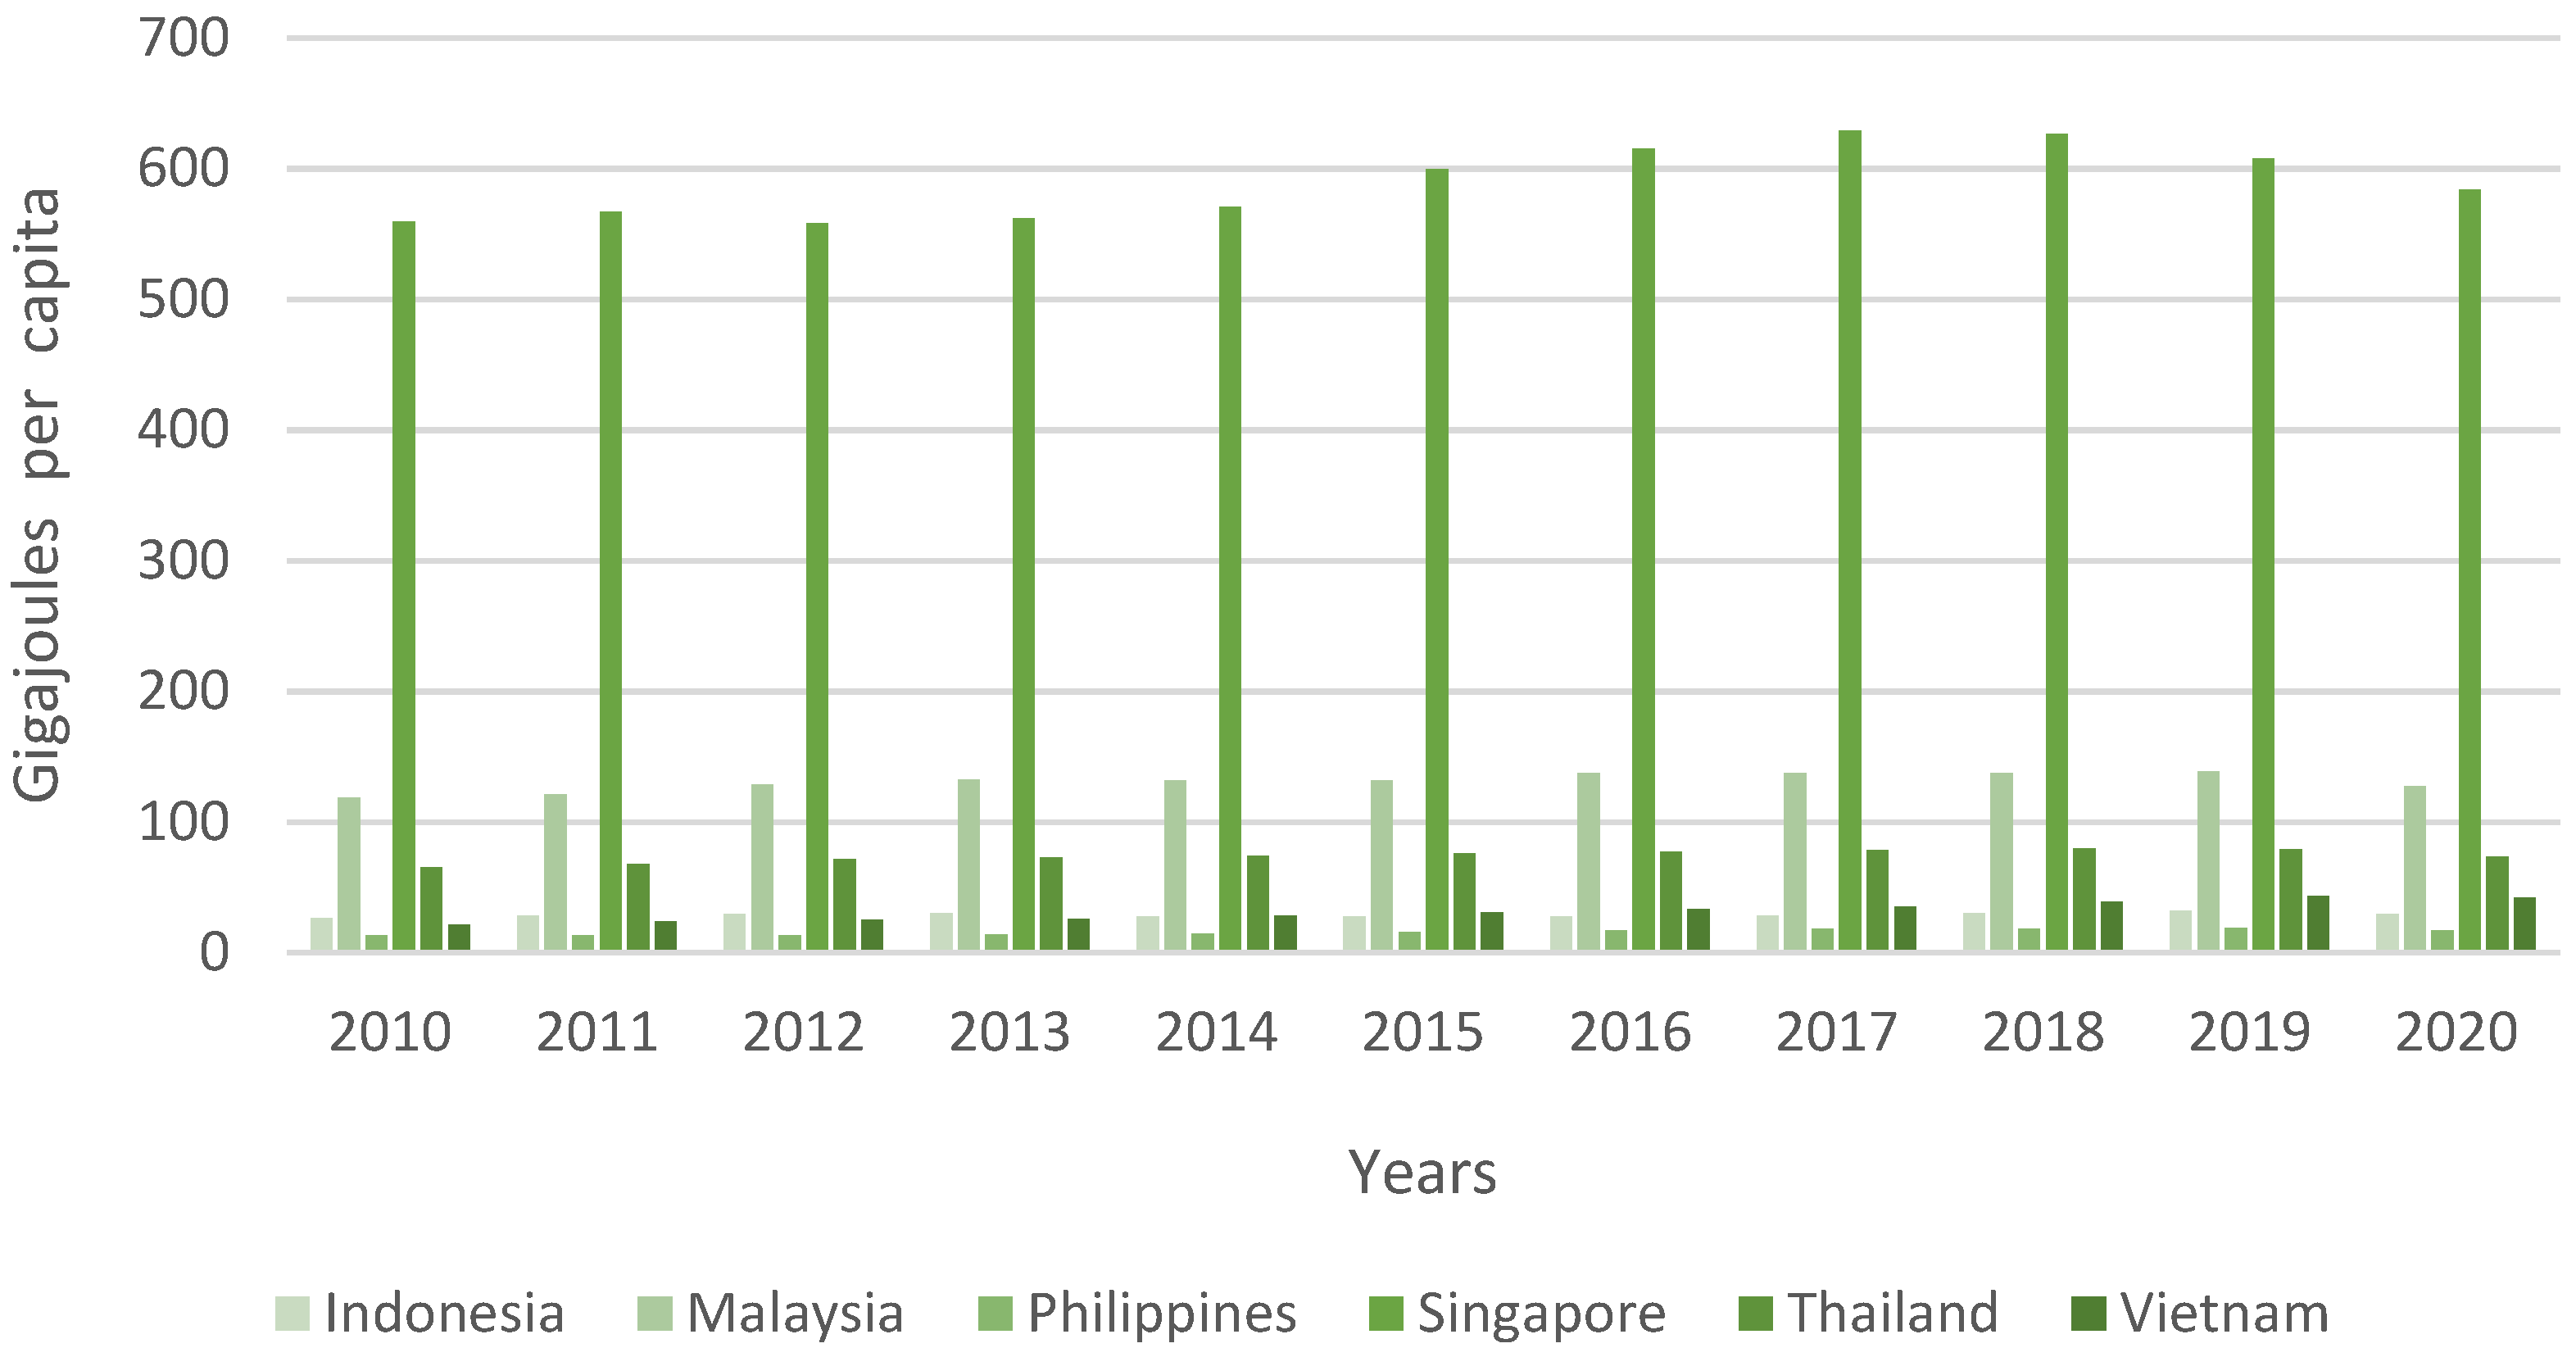
Figure 2 provides the graph for primary energy consumption by the aforementioned countries.
Researchers are concerned about green financing and energy efficiency. Eco-friendly financing is not a viable option for many countries because of various underlying issues. Furthermore, the lack of private sector and insufficient financial infrastructure make green financing approaches like green bonds ineffective in developing or less developed nations [
13,
14]. In line with earlier studies, Hammoudeh, Ajmi [
15] investigated the relationship between green bonds and various environmental and economic indicators and found no evidence of a causal association between them. Due to a lack of private sector funding and guidance with India’s climate action plan, PRAKASH and SETHI [
16] discover no correlation between green bonds and sustainable development goals. Green bonds issued for green power projects by European Investment Banks between 2015 and 2018 were examined by Gibon, Popescu [
17]. The results showed that money was being wasted. Contrary to the neutral or negative findings of some studies, green financing appears to have beneficial effects on a range of macroeconomic factors. Researchers found that in the COVID-19 era, green bonds were more successful than conventional bonds because of the increased transparency of interest rates and investment returns. During the COVID-19 pandemic, government initiatives radically affected global energy consumption patterns [
18]. Between 2008 and 2019, Nguyen, Naeem [
19] investigated the connection between green bonds and other characteristics, such as clean energy. Green bonds have a significant impact on renewable energy development, according to researchers. Asian and Pacific countries were the focus of Taghizadeh-Hesary and Yoshino’s [
20] analysis of the green bond market. Researchers in Asia have discovered that green bonds offer better yields but at the expense of more volatility and risk. The Asian green bond market is dominated by the banking industry, accounting for 60% of all issuances. According to their findings, de-risking strategies and issuer diversification might be adopted in the post-COVID-19 environment. According to Lee [
21], there is a connection between green finance and the sustainable development goal (SDG) targets related to climate change and environmental risks. Intriguing results demonstrated that the banking and financial industries may entice private investors to engage in green finance [
22].
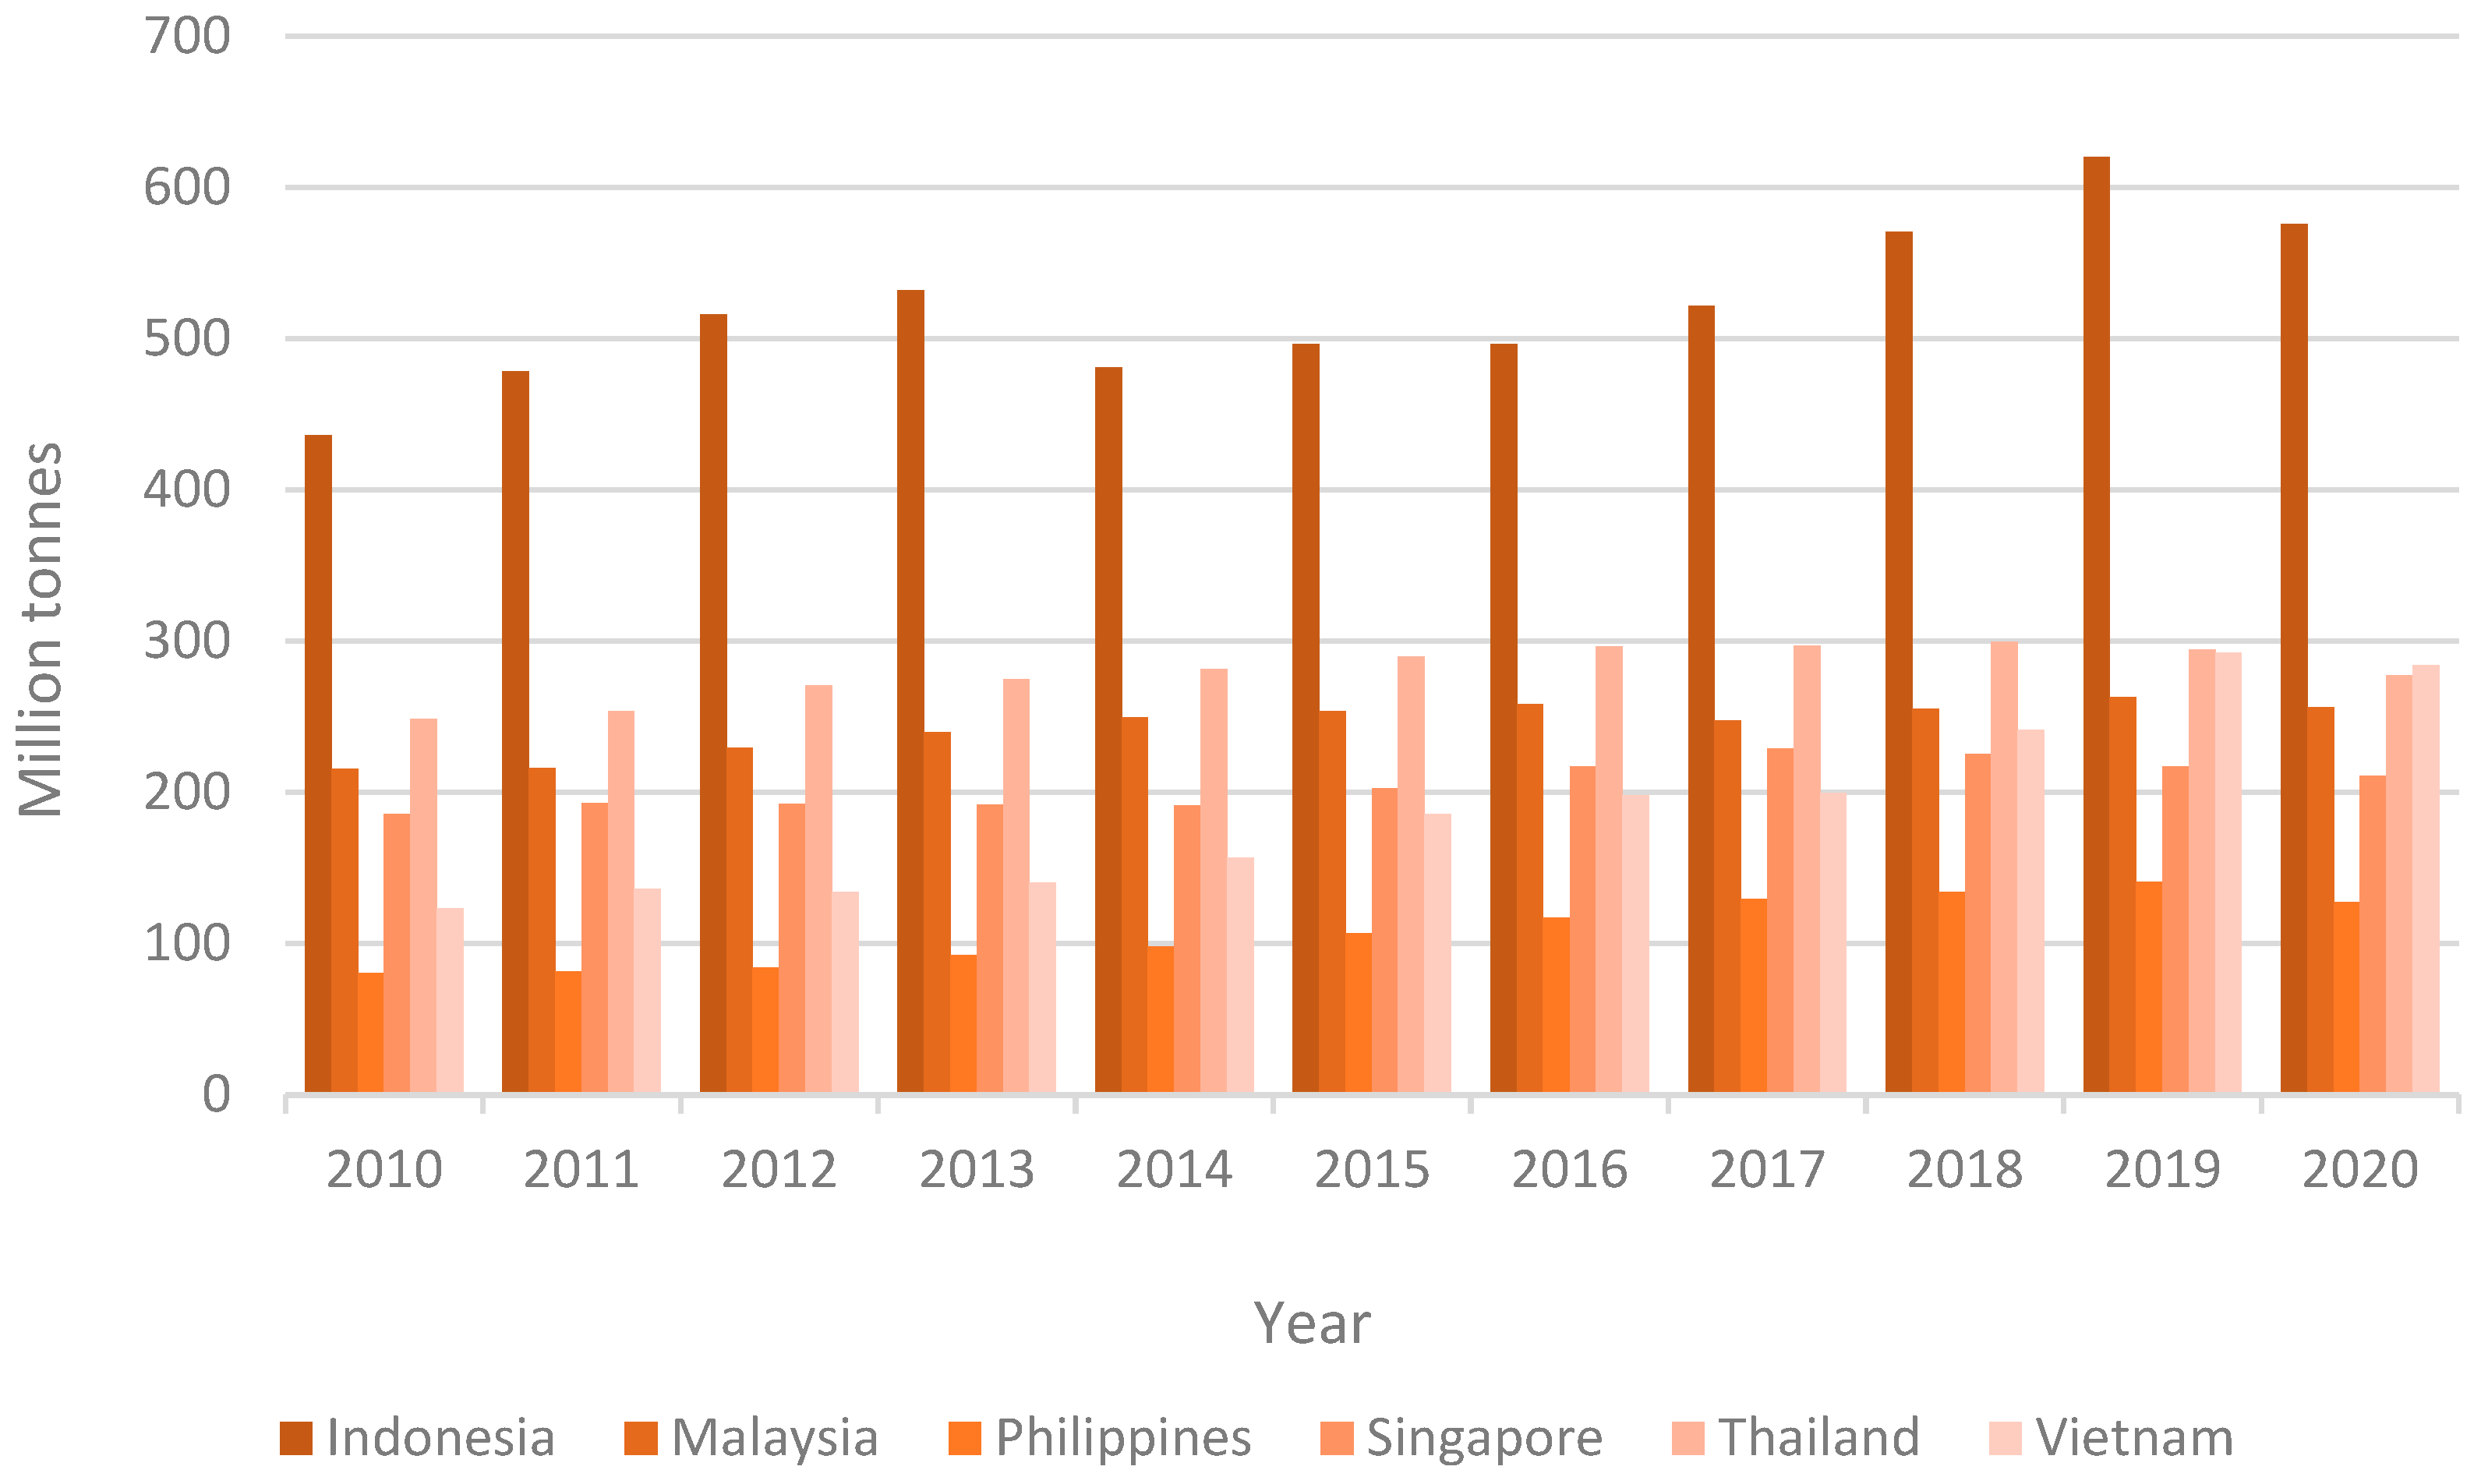
Figure 3 depicts the amount of carbon dioxide emission by the aforementioned countries.
However, it is anticipated that Southeast Asia will suffer more significant economic losses as a result of climate change than the majority of other regions across the world. In addition, it is possible that these losses, which represent the aggregate effect of impacts on agriculture, tourism, energy consumption, labor productivity, catastrophic risks, health, and ecosystems, will be more than what was anticipated in the past. When these loss estimates are incorporated together in the modeling, it is shown that under the BAU emissions scenario of this study, the gross domestic product (GDP) will be lowered by 11 percent in 2100. This finding is 60 percent greater than the prior assessment of the Asian Development Bank (ADB) [
23].
The growth of green energy projects might be aided by the development of green funding as green financing is a crucial factor in green investments in the long term. Moreover, the importance that public financial institutions play in improving the effectiveness of these various funding sources cannot be overstated [
24]. For green finance, adopting green bonds as an effective vehicle for green financing might reduce risk, boost return on investment, and draw global investors to green energy projects [
25]. Using green bond market risk management, ref. [
26] discovered that this financing mechanism is more efficient and successful when used to fund green energy project development. The two essential aspects in developing a good association between green financing and green energy projects are Market circumstances and the green finance market mechanism [
8]. Sachs et al., 2019 discovered that green finance has a beneficial influence on encouraging small-scale green energy initiatives. A recent study by [
22] indicated that when the green energy financing sector expands in India, the overall share of green energy in the country’s energy mix will be rise. In [
27], it is argued that green funding has a favorable impact on the growth of renewable energy, based on the processes of the financial market and the legislation that is passed by the government. It is critical for all countries to implement environmentally friendly economic changes to increase investment in renewable energy generation and reduce environmental pollution [
28].
The findings presented in the aforementioned research indicate that the consequences of green finance are not the same in numerous countries and are affected by a wide variety of diverse factors. Studying green finance in ASEAN member economies will be beneficial and offer novel insights not just for these economies, but also for all other nations that are working toward the creation of green finance markets. As these countries play such a significant part in the achievement of sustainable development goals (SDGs) set by the United Nations in 2015, it is very necessary to do research into the ways in which this factor influences energy efficiency and the use of green energy. [
2] There are numerous differences between this study and prior investigations. The objectives of this study are (i) to examine the linkage among energy efficiency, green finance, green energy, and CO
2 emissions in ASEAN member countries; (ii) to examine the impact of green finance in reducing the CO
2 emission in ASEAN member countries; and (iii) to explore the impact of green energy in lessening the CO
2 emission in the region. The study will employ the STIRPAT model, a proven framework for energy economics analysis. Moreover, the study will use principal component analysis (PCA) to construct a green energy index (GEI) using various green energy resources. The null hypothesis of the study is (i) green finance or environmental finance does not affect the CO
2 emission in the ASEAN region, and (ii) there is no impact of using green energy in reducing the CO
2 emission.
The rest of the paper is comprised of three sections:
Section 2, “Materials and Methods”, describes the data and model specifications;
Section 3, “Results and Discussion”, discusses the results of the study; and the last section, “Conclusions and Policy Implications”, presents the outcomes summary and practical implications.
3. Materials and Methods
Scholars have long debated the merits of utilizing a suitable framework to estimate the environmental consequences of various variables. Study [
29] proposed a framework called IPAT (environmental impact generated by population, affluence, and technology). Study [
30] modified the IPAT approach to ImPACT, including consumption per gross domestic product (GDP) unit. There are certain drawbacks, such as a lack of dynamic analysis and discrepancies in the effects of relevant elements, to these methodologies [
31]. To address these concerns, refs. [
31,
32,
33] came up with a more advanced technique called STIRPAT, which considers many variables in a regression form. STIRPAT is the best theoretical technique to elucidate the link between environmental pollution and explanatory factors; it was proposed by [
34,
35]. Equation (1): STIRPAT’s theoretical equation may be found here.
where
EI denotes the environmental impact in country
i; population and affluence are represented with
P and
A, respectively. Moreover,
T shows technology, and e is the error term.
α scales the model, and the estimated exponents for the factors including population, affluence, and technology are
b,
c, and
d.
Following [
36], the STIRPAT model in Equation (1) can be rewritten in its logarithmic form as Equation (2):
where
α indicates
a constant and
b,
c, and
d represent the exponents of population, affluence, and technology, respectively.
e is the error term, and
t represents the time. Regarding the dependent variable (
EI), we adhere to the methodology of [
36,
37].
EI represents the CO
2 emissions per capita.
Ppl means population, and
Af represents GDP per capita and energy intensity. At long last, our empirical model for
T has been updated to include issued green bonds as well as GEX. The variables that were considered for our model are listed in
Table 1:
The PCA method is used to calculate the GEX, derived from using green energy sources such as nuclear, hydro, solar, wind, and biofuels. The GEX is based on the consumption of green energy sources. The Kaiser–Meyer–Olkin (KMO) test and the Bartlett test were carried out to establish whether the data was suitable for factor analysis before the principal component analysis was carried out. As the KMO and the Bartlett value are estimated to be 0.79 and 0.001, respectively, the principal component analysis (PCA) approach may be used for these variables.
Table 2 presents the findings of the PCA analysis.
It is feasible to conclude that A1 possesses an eigenvalue greater than one and accounts for 77.5 percent of the total variation in the amount of green energy consumed by the ASEAN member countries. As a result, we decided to include A1 in our model as GEX. In addition, the factor loadings, which are shown in
Table 3, can be used to gain an understanding of the contributions made by each variable to component A1.
The findings of
Table 3 show that in the A1 component studied, hydro and wind power consumption was significantly greater than that of other green energy sources. Estimation of the Granger causal links between variables in Equation (3) for yearly data spanning 2002–2018 was done using the generalized method of moments (GMM).
where,
CPC denotes the carbon dioxide emissions per capita,
Ppl represents the population size of a country, GDP per capita is represented by
GPC,
EI for energy intensity,
GBs are used for issued green bonds, and
GEX shows the green energy index.
The study employs a panel unit root test to detect the stationary problem in the data and ensure that the data is reliable for empirical estimation. In this study, unit root tests, including (Breitung (2000) [
38], and Levin-LinChu (LLC) [
39]) were performed. Moreover, to further validate the panel unit root test results a unit root test with structural breaks was performed recommended by Carrion-i-Silvestre, del Barrio-Castro [
40].
Next, the panel co-integration test proposed by [
41,
42] was employed to check the cointegration association among variables. Furthermore, this study used an augmented mean group estimation technique to estimate the long-term coefficient of independent variables.
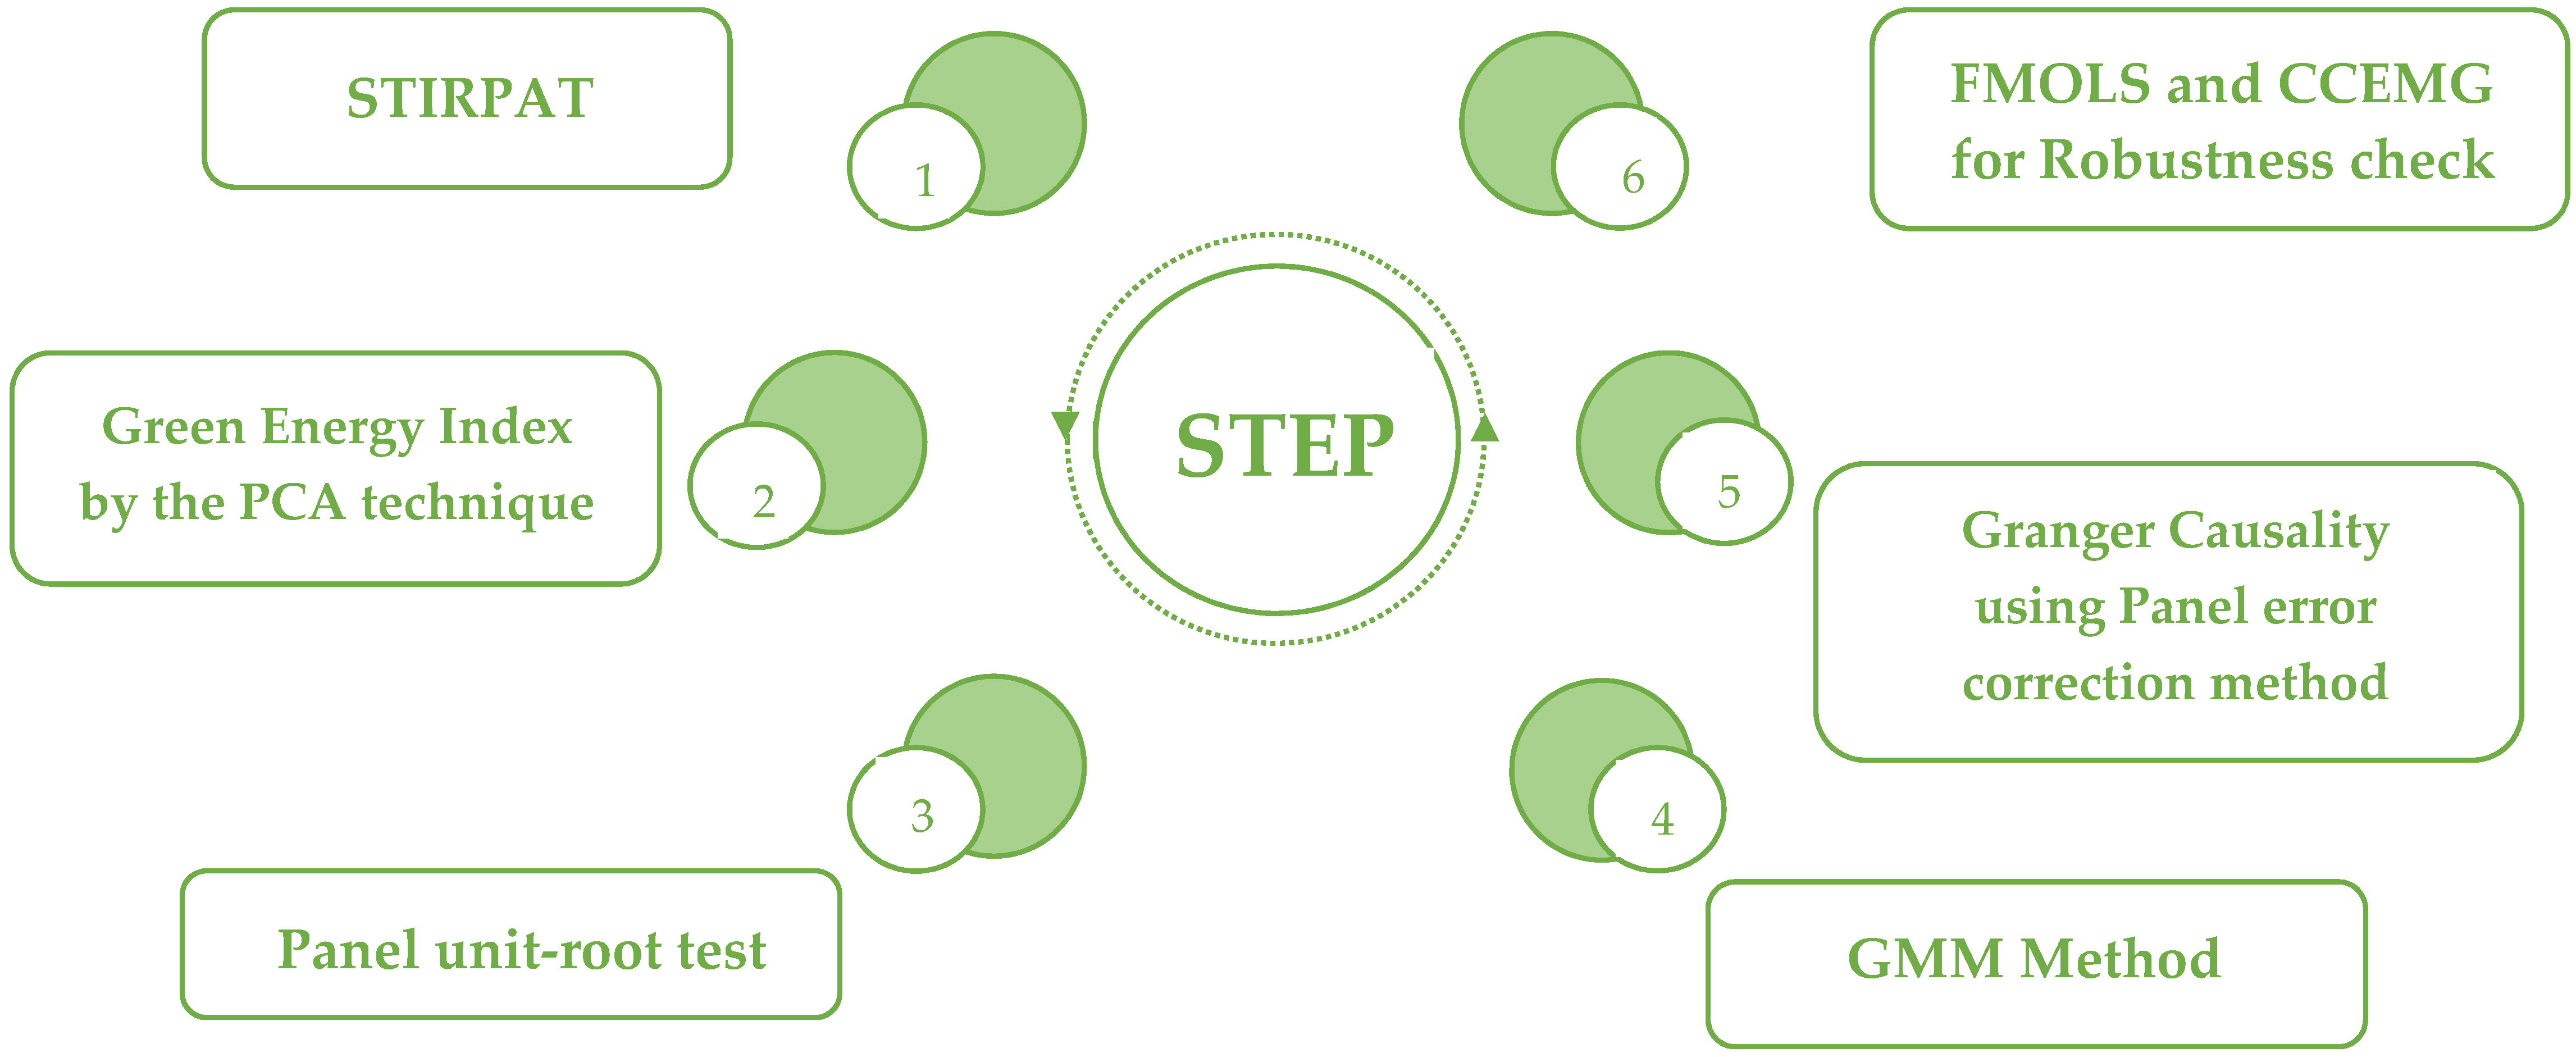
A Granger causality panel error correction model was utilized to check variables for causal relationships. Finally, we employed the FMOLS estimator and the common correlated effect mean group estimator (CCEMG) for a robustness check. The detailed empirical findings and their discussion are provided in the “Results and Discussion” section. The actions that need to be taken to complete the paper are illustrated in the conceptual framework shown below (
Figure 4).
4. Results and Discussion
First, the panel unit root tests were performed. The results have been reported in
Table 4 and
Table 5.
Table 4 provides the findings of the panel unit root tests (Breitung test and Levin-LinChu test). The findings concluded that all the variables are not stationary at the level but are free from unit root problems at the first level.
Table 5 provides the results for the unit root test with structural breaks. The Barlett Kernel and Quadratic Kernel findings are compared to the Bootstrap critical values at 5 percent, 2.5 percent, and 1 percent, respectively. The findings prove the rejection of Ho of the stationary series. It is concluded from the findings of the panel unit root tests that all the series are stationary at first difference. However, they have unit-root at the level. Due to this result, we can carry out the panel co-integration test to ascertain whether there is a long-term equilibrium. This study used the Westerlund test and the Johansen Fisher test. Findings from these tests are presented in
Table 6 and
Table 7 below.
The findings of the Johansen Fisher and Westerlund cointegration test confirmed the variables for a cointegration relationship, indicating that a long-run unidirectional link exists for at least one variable.
Then, regression estimates are conducted using the augmented mean group estimator (AMG). The outcomes are shown in
Table 8.
According to the calculated coefficients, ASEAN countries’ CO
2 emissions per capita are positively correlated with population and GDP per capita. As a result of the increased CO
2 emissions caused by these two explanatory factors, air pollution has increased. The findings are in line with [
41,
42] for the linkage of CO
2 emissions to GDP and with [
41,
42,
43] for the linkage of CO
2 emissions to population. One of the primary reasons for the increased CO
2 emissions caused by these two factors is their higher energy usage.
Higher energy intensity is found to cause an increase in CO
2 emissions of 0.172 percent over the long run among the Green Leaders, according to the study’s findings. This is in line with the previous studies [
44,
45] for certain African nations.
The issue of green bonds as a stand-in for green finance encourages the deployment of renewable energy sources and lowers CO
2 emissions per capita. According to the calculated coefficient for this variable, a 1% increase in the volume of issued green bonds lowers the CO
2 emissions by 1.16% in the ASEAN region. This is consistent with the findings of [
8,
46].
The green energy index can help these nations mitigate CO
2 emissions. According to the calculated coefficient for this variable, a 1% increase in the green energy index lowers the CO
2 emissions by 0.89% in the ASEAN region. This is consistent with the findings of [
8,
46,
47]. Moreover, several previous studies have demonstrated the positive impact of renewable energy deployment on CO
2 reduction [
48,
49,
50,
51].
Next, the Granger causality panel error correction test was employed to examine the direction of association among variables in the short-term presented in
Table 9.
According to the calculated coefficient,
Table 9 indicates unidirectional causality running from GBs to Ppl and from GBs to EI. There is also a bidirectional causality between CPC, Ppl, GPC, and EI; GBs and GPC; and Ppl, GPC, EI, and GEX. However, no causal linkage has been found between GEX and CO
2 emissions per capita and GBs and CO
2 emissions per capita, which is something that the decision-makers in these nations could find interesting. Any assistance provided by green finance methods may increase GDP per capita, an essential component of a nation’s overall standard of living.
The study employs two estimators, including FMOLS and CCEMG, for robustness checks to ensure that empirical estimations are valid. In
Table 10, according to the findings of the employed test, the explanatory variables’ estimated coefficients all point in the same direction. However, compared to the AMG estimates, there were significant differences in the magnitude of impact.
5. Conclusions and Discussion
Scholars have long debated the merits of utilizing an appropriate framework to estimate the environmental consequences of various variables. To address the issues with IPAT and ImPACT, this study employed the best theoretical technique to elucidate the link between environmental pollution and explanatory factors, STIRPAT, which was proposed by [
35]. The author gathered yearly data spanning 2002–2018 for ASEAN member countries. After preliminary tests, the study will use the Westerlund test and Johansen Fisher test for long-term equilibrium and estimate the Granger causal links between variables using the generalized method of moments (GMM). The results reveal a positive relationship between population, GDP per capita, and CO
2 emissions, which shows that increasing the population and GDP per capita of ASEAN countries without switching to renewable energy might lead to a rise in CO
2 emissions. It is estimated that an increase of one percent in the issuance of green bonds will mitigate CO
2 emissions by 1.6 percent. Access to financial resources is facilitated via green bonds, which encourage renewable resources and reduce greenhouse gas emissions per capita. Furthermore, it is estimated that the higher the value of the green energy index, the lower the CO
2 emissions will be. In the short run, the study demonstrates that an increasing level of population, per capita GDP, and energy intensity may contribute to higher carbon dioxide emissions per capita.
Moreover, no causal association between the green energy index and carbon dioxide emission has been found. Green bonds also contribute to carbon dioxide emissions. However, a bi-directional association between GBs and the GEX and GBs and GPC has been observed.
The null hypothesis of the study is (i) green finance or environmental finance does not affect CO2 emission in the ASEAN region; (ii) there is no impact of using green energy in reducing the CO2 emission.
The findings reject the null hypothesis and conclude that that green finance and the deployment of green energy can only assist nations in reducing their CO2 emissions in the long run. On the other hand, both in the short and long run, they are extremely important contributors to the rise in GDP per capita. Therefore, to achieve sustainable economic growth that considers environmental concerns, governments should establish support policies that take a long-term strategy to increase private participation in the investment of green energy projects. As a result, offering remittance of revenues and a return on investment would be two of the most effective strategies to encourage private sector involvement in environmentally friendly initiatives. Restoring economic development in the short and long periods appears to require several critical components, one of which is an increase in the quantity of green bonds issued as an appropriate form of green finance. This financial instrument could be able to guarantee adequate returns on investment for private investors. There is a possibility that this policy will be more applicable during and after the COVID-19 timeframe. This has become a topic of discussion worldwide, because, as a result of the pandemic’s effects, green initiatives are suffering from a shortage of funding, and the economy is contracting. In addition, governments should pay attention to energy efficiency to limit the amount of energy used and the number of pollutants released into the environment. Therefore, it is highly recommended to make use of internationally recognized best practices, such as the EU energy efficiency plan, the National Energy Efficiency Action Plan (NEEAP), Thailand’s 20-Year Energy Efficiency Development Plan, and the Energy Saving Improvement Program (ESIP), as well as Turkey’s Strategic Energy Efficiency Plan (SEEP). Policymakers must expand green energy usage in electricity generating and industrial sectors, the two most significant CO2-producing sectors, due to the short-term inefficiency of green finance and green energy consumption. Additionally, a productive strategy in these nations would be one that gives green energy projects higher priority based on financial metrics and CO2 emissions.
Despite the study’s essential findings and policy implications, panel econometric analysis is used for ASEAN countries only and is not used at the country level. Moreover, the study excludes Brunei, Loas, and Cambodia due to the lack of availability of data. Additional research is needed to examine the impact of green financing and green energy use on CO2 emissions at the national level.


